
Abstract
Background:
Obstructive sleep apnea (OSA) is accompanied by both gray and white matter differences in brain areas that regulate autonomic, cognitive, and mood functions, which are deficient in the condition. Such tissue changes have been examined through diffusion tensor and diffusion kurtosis imaging-based procedures. However, poor in-plane spatial resolution of these techniques precludes precise determination of the extent of tissue injury. Tissue texture maps derived from the ratio of T1-weighted and T2-weighted images can provide more adequate in-plane assessment of brain tissue differences.
Objectives:
To examine brain tissue integrity in recently diagnosed, treatment-naïve OSA subjects, relative to age- and sex-comparable control subjects using T1-weighted and T2-weighted images.
Design:
A cross-sectional study.
Methods:
We examined the extent of tissue changes in 106 OSA over 115 control subjects using high-resolution T1- and T2-weighted images collected from a 3.0-Tesla scanner (analysis of covariance; covariates: age, sex, body-mass-index, Pittsburgh sleep quality index, Epworth sleepiness scale, Beck Anxiety Inventory, and Beck Depression Inventory II; false discovery rate corrected; p < 0.01).
Results:
OSA subjects showed significantly lowered tissue integrity in several brain regions, including the frontal, cingulate and insular cortices, cingulum bundle, thalamus, corpus callosum, caudate and putamen, pons, temporal, occipital, and parietal sites, cerebellar peduncles, and medial medullary sites, compared with controls.
Conclusion:
OSA subjects show widespread lowered tissue integrity in autonomic, mood, and cognitive control sites over healthy controls. The pathological processes contributing to the alterations may include repetitive hypoxic and hypercarbic processes and excitotoxic injury, leading to altered brain tissue integrity in OSA.
Introduction
Obstructive sleep apnea (OSA) is a condition characterized by persistent events of partial or complete upper airway obstruction, with continued diaphragmatic efforts to breathe during sleep. In addition to breathing issues, OSA subjects show severe deficits in autonomic functions, expressed principally as blood pressure and sweating disturbances, and cognitive deficits, along with depression and anxiety. 1 Untreated OSA can lead to severely reduced attention, memory, and cognitive functions, and consequently reduced quality of life. 2 Gray matter injury in OSA subjects is principally located in autonomic, respiratory, mood, and cognitive control sites, as observed in various studies, including observations with procedures such as voxel-based morphometry, diffusion tensor imaging, magnetic resonance spectroscopy, and manual volumetric-based magnetic resonance imaging (MRI).3–7 Regional brain gray matter changes can be accompanied by subcortical and white matter alterations, as reported in other conditions.7–9 However, the extent of gray and white matter microstructural differences that may result from inflammation or edema in OSA subjects is unclear.
Numerous MRI methods, including magnetization transfer imaging, diffusion tensor imaging-based radial diffusivity, and diffusion kurtosis imaging-based radial kurtosis procedures are sensitive to examine changes in gray and white matter tissue integrity.10–13 Precise determination of brain tissue integrity is essential for protection from further injury, or to intervene with restorative procedures after initial damage; there is some evidence that aggressive intervention for OSA with breathing support can at least partially recoup from early injury.14,15 Assessing the nature of tissue injury, and determining potential therapies for restoring the integrity may hasten that recovery.
T1- to T2-weighted ratio imaging was initially developed for brain myelin mapping at cortical sites, 16 and later extended to accommodate data from different scanners for subject comparisons. 17 Both T1- and T2-weighted images show different signal intensities in white matter regions compared with surrounding gray and deep-gray matter areas due to the presence of myelin, and white matter sites show higher signal intensity on T1-weighted than in T2-weighted images. However, when brain tissue integrity is compromised, signal intensities of both T1-weighted and T2-weighted images vary, but in opposite directions, and signal reductions on T1-weighted images are more prominent than T2-weighted, which leads to enhanced microstructural differences on T1-weighted to T2-weighted ratio maps. The T1-weighted to T2-weighted ratio map has been used to assess tissue integrity in some clinical conditions, 8 and thus, the approach may be useful to examine tissue integrity in gray and white matter regions in OSA subjects.
Our aim was to examine brain tissue integrity in recently diagnosed, treatment-naïve OSA subjects, relative to age- and sex-comparable control subjects using T1-weighted and T2-weighted images. Such precise assessments are essential for determining potential therapies for restricting further or rescuing initial white matter damage, since early tissue changes are partially restorable with aggressive breathing intervention in OSA subjects.14,15 We hypothesized that this technique would be sensitive to detect gray and white matter microstructural changes due to repetitive hypoxic processes that lead to deficit in autonomic, respiratory, cognitive, and mood functions in OSA.
Methods
Subjects
A total of 106 newly diagnosed, treatment-naïve OSA and 115 age- and sex-comparable control subjects were included in this study (Table 1). Control subjects were recruited through posting flyers at the University of California Los Angeles (UCLA) campus and West Los Angeles Area. No control subjects were taking any medication as described below that might alter brain tissue. OSA subjects were recruited from the Sleep Disorders Center at the UCLA Medical Center, were newly diagnosed via overnight polysomnography with at-least mild severity (apnea-hypopnea-index ⩾ 5 events/h), and were treatment-naïve for breathing issues. OSA subjects were not taking any mood regulating or cardiovascular medications, such as serotonin reuptake inhibitors, α-agonists, angiotensin-converting enzyme inhibitors, or vasodilators. All OSA and control subjects were compatible with the MRI scanner environment and were without history of stroke, heart failure, diagnosed brain conditions that may introduce brain changes, or metallic implants. Although all OSA subjects were newly diagnosed, of 106 OSA, 43 were taking multivitamins, 19 were on blood pressure medication, 18 were on cholesterol medication, 21 were taking pain medication, 7 were taking anti-diabetes medication, 5 were using proton pump inhibitors, 4 were taking anti-depression medication, and 6 were taking sleep medication. Of 106 OSA subjects, 7 subjects were diagnosed with Type 2 diabetes, 19 with hypertension, and 6 with thyroid issue. All control subjects included here were healthy, without taking any medication, and without any neurological or psychiatric condition.
Demographic, physiologic, neuropsychologic, sleep, and cognitive data of control and OSA subjects.

AHI, Apnea-Hypopnea-Index; BAI, Beck Anxiety Inventory; BDI-II, Beck Depression Inventory II; BMI, body mass index; ESS, Epworth sleepiness scale; MoCA, Montreal Cognitive Assessment; OSA, Obstructive sleep apnea; PSQI, Pittsburgh sleep quality index; SaO2, Oxygen saturation; SD, standard deviation.
Assessment of sleep, mood, and anxiety
To investigate sleep quality and daytime sleepiness, two self-administered questionnaires were employed. 18 In both OSA and control subjects, sleep quality was evaluated based on the Pittsburgh sleep quality index (PSQI), and daytime sleepiness based on the Epworth Sleepiness Scale (ESS). The Beck anxiety inventory (BAI) and Beck depression inventory II (BDI-II) questionnaires, which are self-administered questionnaires on symptoms severity (21 questions; each score ranged from 0 to 3), with each score ranging from 0 to 63, were used for assessment of anxiety 19 and depressive 20 symptoms in OSA and control subjects.
Cognition assessment
The Montreal Cognitive Assessment (MoCA) test was performed for cognitive assessment in OSA and control subjects. This test includes fast screening of various cognitive domains, including attention and concentration, language, memory, executive functions, visuo-constructional skills, conceptual thinking, calculations, and orientation. Trail-making A & B tests, which are used for screening of dementia and cognitive functions, including executive function, visual search, mental flexibility, scanning and processing speed, were conducted in OSA and control subjects.
Magnetic resonance imaging
Brain images from OSA and control subjects were acquired from 3.0-Tesla MRI (Siemens, Magnetom Tim-Trio and Prisma, Erlangen, Germany) scanners. Foam pads were used on either side of the head to reduce motion-related artifacts during scanning. Two high-resolution T1-weighted scans were acquired with magnetization prepared rapid acquisition gradient echo pulse sequence in the sagittal plane [repetition time (TR) = 2200 ms; echo time (TE) = 2.4, 2.6 ms; inversion-time = 900 ms; flip-angle (FA) = 9o; matrix size = 256 × 256, 320 × 320; field of view (FOV) = 230 × 230 mm2; slice thickness = 0.9, 0.72 mm). Proton density (PD) and T2 weighted images [TR = 10,000 ms; TE1, 2 = 12, 124 ms; FA = 130°] were acquired simultaneously using a dual-echo turbo spin-echo pulse sequence in the axial plane, with a 256 × 256 matrix size, 230 × 230 mm2 FOV, 4.0, 3.5 mm slice thicknesses, and no inter-slice gap. Two control subjects were scanned twice, once on a Tim-Trio and the other on a Prisma MRI scanner.
Theoretical background ─ gray and white matter changes
Dividing the T1-weighted image by the aligned T2-weighted image mathematically cancels the signal intensity bias related to the sensitivity profile of the radio frequency receiver coils, which is assumed to be the same in both images. 16 Therefore, calculating the ratio of T1-weighted/T2-weighted increases gray and white matter microstructural contrast. However, the contrast obtained through this approach is not completely bias-free due to the transmit field differences that remain. 16 Previously, this technique was implemented for data acquired across the same scanner, 16 and later advanced by introducing scaling factors to combine data across various scanners with same field strength. 17 In case data need to be combined with different acquisition parameters a scaling factor can be introduced to lower bias so that the T1-weighted/T2-weighted intensity scaling is comparable across subjects. 17 Thus, mathematically, the ratio of T1-weighted/T2-weighted images, could be modeled as:

where tissue integrity is represented by ‘x’, and variables α1, α2 are scaling factors related to bias field inhomogeneity of T1-weighted and T2-weighted images, respectively.
Data processing and analysis
We used various software tools for image visualization, data processing, and analyses that included the statistical parametric mapping package SPM12 (Wellcome Department of Cognitive Neurology, UK; http://www.fil.ion.ucl.ac.uk/spm), MRIcroN, 21 and MATLAB-based custom routines (MATLAB, The MathWorks Inc., Natick, MA). For all OSA and control subjects, both T1- and T2-weighted images were visually examined to ensure that no serious anatomical defects were apparent. None of the subjects included in the analysis showed any serious brain pathology on visual examination of these structural brain images.
Calculation of T1-/T2-weighted ratio maps
Both high-resolution T1-weighted image volumes from each subject were realigned using SPM12 to remove any potential variation between scans and averaged. The realignment parameters for separation, smoothing were 2, 3 with a 7th degree B-spline interpolation. The averaged T1-weighted image and the single T2-weighted image were bias- corrected, using the intensity inhomogeneity correction tool implemented in SPM12 (smoothing, 60 mm; regularization, 0.00001 FWHM). After bias correction, the T1-weighted images were co-registered and re-sliced to the corresponding T2-weighted images, maintaining 2D resolution (normalized mutual information; interpolation, 7th degree B-Spline). Using bias-corrected T2-weighted and bias-corrected and re-sliced T1-weighted images, T1-/T2-weighted ratio maps, representing gray and white matter tissue integrity maps, were computed voxel-by-voxel, as described above (Figure 1).

The graphical representation illustrating the steps that were used to calculate the T1w/T2w ratio maps. The tissue integrity is represented by ‘x’, and variables α1, α2 are scaling factors related to bias field inhomogeneity of T1-weighted and T2-weighted images, respectively.
Normalization and smoothing of T1-/T2-weighted ratio maps
T1-/T2-weighted ratio maps of OSA and control subjects were normalized to Montreal Neurological Institute space (1 × 1 × 1 mm3 voxel size), using a modified unified segmentation approach implemented in the SPM12 package. The warping parameters for x, y, z directions were obtained from the bias-corrected and re-sliced T1-weighted images via modified unified segmentation approach and applied to the corresponding ratio maps. The normalized ratio maps were smoothed using an isotropic Gaussian filter (kernel size, 8 mm).
Global brain mask
The averaged and bias-corrected T1-weighted images of each subject were partitioned into gray matter, white matter, and cerebrospinal fluid tissue types using SPM12. The gray and white matter probability maps of all subjects were normalized into MNI space, and averaged to create a global gray matter and a white matter probability map. The averaged gray and white matter probability maps were thresholded (probability threshold of 0.3), and combined to form a whole-brain brain mask.
Histogram calculation
T1-/T2-weighted ratio maps, calculated for the two subjects that were scanned across the two scanners, were first masked for skull and other non-brain tissue using the global brain mask. Histograms were calculated from these masked ratio maps, using the ‘hist’ function implemented in MATLAB. A total of 250 bins were used to estimate the frequency distribution of T1-weighted/T2-weighted ratio values ranging from 1 to 5.
Background images
Averaged high-resolution T1-weighted image of all OSA and control subjects were normalized to MNI space (1 × 1 × 1 mm3, voxel size), using the modified unified segmentation approach. The normalized images of all OSA and control subjects were averaged to create a whole-brain mean image (background image), which was used for structural identification.
Region-of-interest analyses
Region of interest (ROI) analyses were performed to calculate regional brain T1-weighted/T2-weighted ratio values to determine magnitude differences between groups. Using a neuromorphometric atlas (http://www.neuromorphometrics.com), ROIs were created for each brain site, and these ROIs were used to create anatomic-specific masks based on findings from group comparisons. In addition, manual masks were created for white matter sites that were not available in the neuromorphometric atlas using MRIcroN. These anatomic-specific masks were used to compute average values from individual smoothed T1-weighted/T2-weighted ratio maps of OSA and control subjects.
Statistical analyses
The SPM12 and the IBM statistical package for social sciences (SPSS v24) were employed for statistical analyses. Chi-square test and independent-sample t-tests were used to examine group differences in demographic, neuropsychologic, sleep, and cognitive data. The consistency of histograms between two scanners was examined with the Kolmogorov test, and the difference in shapes was assessed with the Wilcoxon rank-sum test.
The smoothed T1-/T2-weighted ratio maps were compared voxel-by-voxel between groups using analysis of covariance (ANCOVA), with age, sex, BMI, PSQI, ESS, BAI, and BDI-II included as covariates. Corrections for multiple comparisons (false discovery rate, p < 0.011) were performed with the REST toolbox. 22 The statistical threshold (p < 0.011) was chosen to achieve clusters with maximum significant level corrected for multiple comparisons. The global brain mask was used to restrict the analysis to brain regions only, and sites with significant differences between groups were overlaid onto a background image for structural identification.
The mean ratio values, derived from ROI analyses, were compared between groups using ANCOVA (covariates, age, sex, BMI, PSQI, ESS, BAI, and BDI-II), and effect sizes were calculated. We considered a p value less than 0.05 as statistically significant.
To identify any associations between T1-/T2-weighted ratio values and cognitive, sleep, mood, and anxiety variables, we performed partial correlations between ratio values and BMI, PSQI, ESS, BDI-II, BAI, and MoCA in OSA subjects (covariates, age, and gender).
Results
Demographics and biophysical variables
No significant differences in age (p = 0.58) or gender (p = 0.09) emerged between groups (Table 1). However, OSA subjects showed higher BMI values compared with control subjects (p < 0.001; Table 1).
Physiology, sleep, depression, anxiety, and cognitive variables
No significant difference in heart rate (p = 0.096) appeared between OSA and controls. However, both systolic (p = 0.001) and diastolic (p = 0.01) blood pressure values were significantly elevated in OSA as compared with control subjects (Table 1). Sleep scores (PSQI, p < 0.001; ESS, p < 0.001), as well as BDI-II values (BDI-II, p = 0.045) were significantly higher in OSA compared with controls (Table 1). Although global MoCA scores did not differ significantly between OSA and control subjects, visuospatial scores were significantly lower in OSA subjects. In addition, Trail-A and Trail-B measures did not show any significant differences between OSA and control subjects (Table 1).
Histogram consistency and shape analysis
No significant differences were observed in shape (p = 0.56, Wilcoxon rank-sum test) or consistency (p = 0.46, Kolmogorov test) between the two histograms of T1-/T2-weighted maps of control subjects scanned across the two scanners (Figure 2), indicating that data collected from two different scanners could be pooled for the analysis. The two peaks represent the GM and WM distributions.
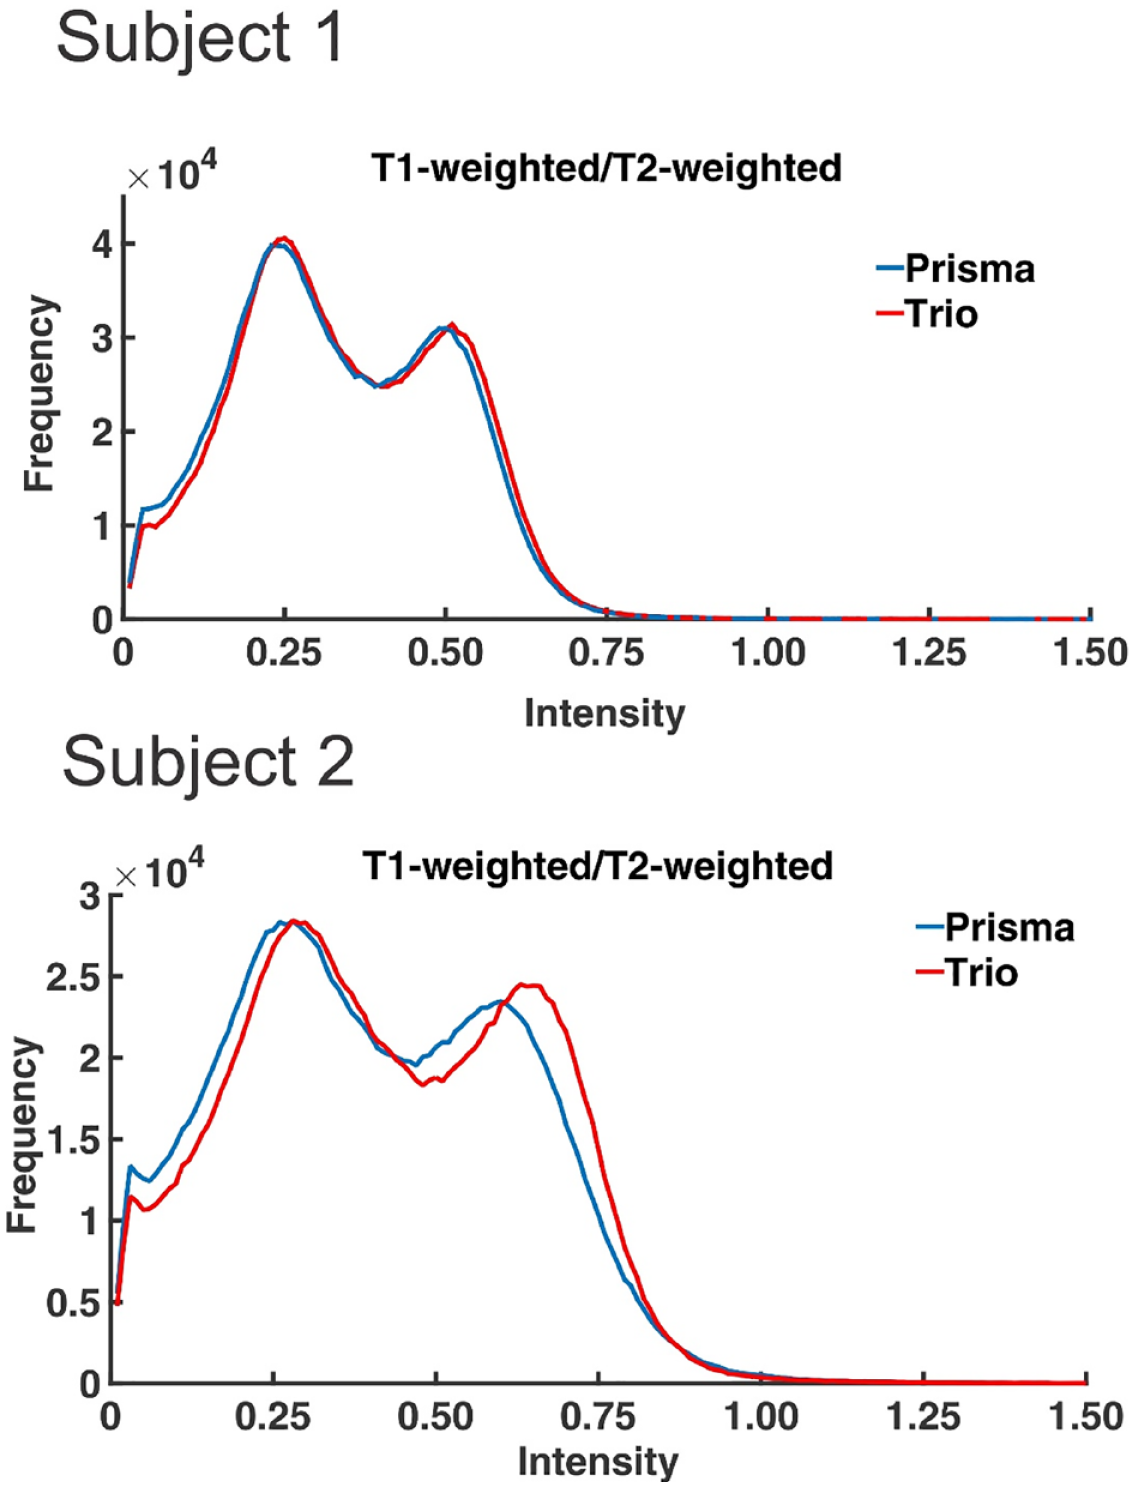
T1-weighted/T2-weighted ratio histograms of two control subjects scanned on two different scanners (3.0-Tesla, Magnetom, Tim-Trio, and Prisma). T1-weighted/T2-weighted ratio histograms were plotted for descalped T1-weighted/T2-weighted ratio maps obtained from Tim-Trio (red) and Prisma (blue) scanners. The x-axis (intensity) represents the bins for T1-w/T2-w ratio values.
T1-/T2-weighted ratio differences
Ratio maps from an OSA and a control subject are shown, overlaid onto a background image (Figure 3). The OSA subject shows lowered brain tissue integrity across substantial areas of the whole-brain compared with control subjects [Figure 3(a) versus Figure 3(a)]. Multiple brain areas in OSA subjects showed lowered T1-/T2-weighted ratio values, indicating altered gray and white matter microstructural differences in those sites, compared with control subjects (Figure 4, p < 0.011, FDR corrected). No brain sites showed increased T1-/T2-weighted ratio values in OSA over controls. Brain sites in OSA subjects that showed lowered ratio values included the bilateral frontal cortices [Figure 4(a)], bilateral insular cortices [Figure 4(b)], posterior corpus callosum [Figure 4(c)], cerebellum and cerebellar peduncles [Figure 4(d)], anterior [Figure 4(e)], mid [Figure 4(f)], and posterior cingulate cortices [Figure 4(g)], bilateral amygdala [Figure 4(h)], fornix fibers [Figure 4(i)], left hippocampus [Figure 4(j)], cerebellar vermis [Figure 4(k)], bilateral occipital white matter [Figure 4(l)], parietal cortices [Figure 4(m)], caudate [Figure 4(n)] and putamen [Figure 4(o)], internal and external capsule [Figure 4(p)], thalamus [Figure 4(q)], basal forebrain [Figure 4(r)], ventral temporal white matter [Figure 4(s)], cerebellar cortices [Figure 4(t)], cerebral crus [Figure 4(u)], medial medulla [Figure 4(v)], basal and caudal pons [Figure 4(w)], bilateral anterior [Figure 4(z)], mid [Figure 4(a1)] and posterior [Figure 4(b1)] corona radiata. Remarkable was absence of differences in tissue integrity in major portions of the thalamus and the frontal cortex, although the ventral frontal cortex was severely affected.

T1-w/T2-w ratio maps from an (a) OSA and (b) an age and gender-matched control subject. The OSA subject shows altered tissue integrity in large areas of the whole-brain relative to the control subject.

Brain sites showing lowered T1-w/T2-w ratio values in OSA over control subjects (FDR corrected p < 0.011). These sites include the bilateral frontal cortices (a), bilateral insular cortices (b), posterior corpus callosum (c), cerebellum and cerebellar peduncles (d), anterior (e), mid (f), and posterior cingulate cortices (g), bilateral amygdala (h), fornix (i), hippocampus (j), vermis (k), bilateral occipital white matter (l), parietal cortices (m), caudate (n) and putamen (o), internal and external capsule (p), thalamus (q), basal forebrain (r), ventral temporal white matter (s), cerebellar cortices (t), cerebral crus (u), medial medulla (v), basal and caudal pons (w), anterior (x) and mid corpus callosum (y), bilateral anterior (z), mid (a1) and posterior (b1) corona radiata. Color bar represents t-statistic values (L = Left; R = Right).
ROI analyses
Regional brain T1-/T2-weighted ratio values from various sites of OSA and control subjects are summarized in Table 2. The regional brain mean ratio values were significantly lowered in OSA compared to control subjects, and showed predominantly large effect sizes between groups.
Regional T1-/T2-weighted ratio values of control and OSA subjects.
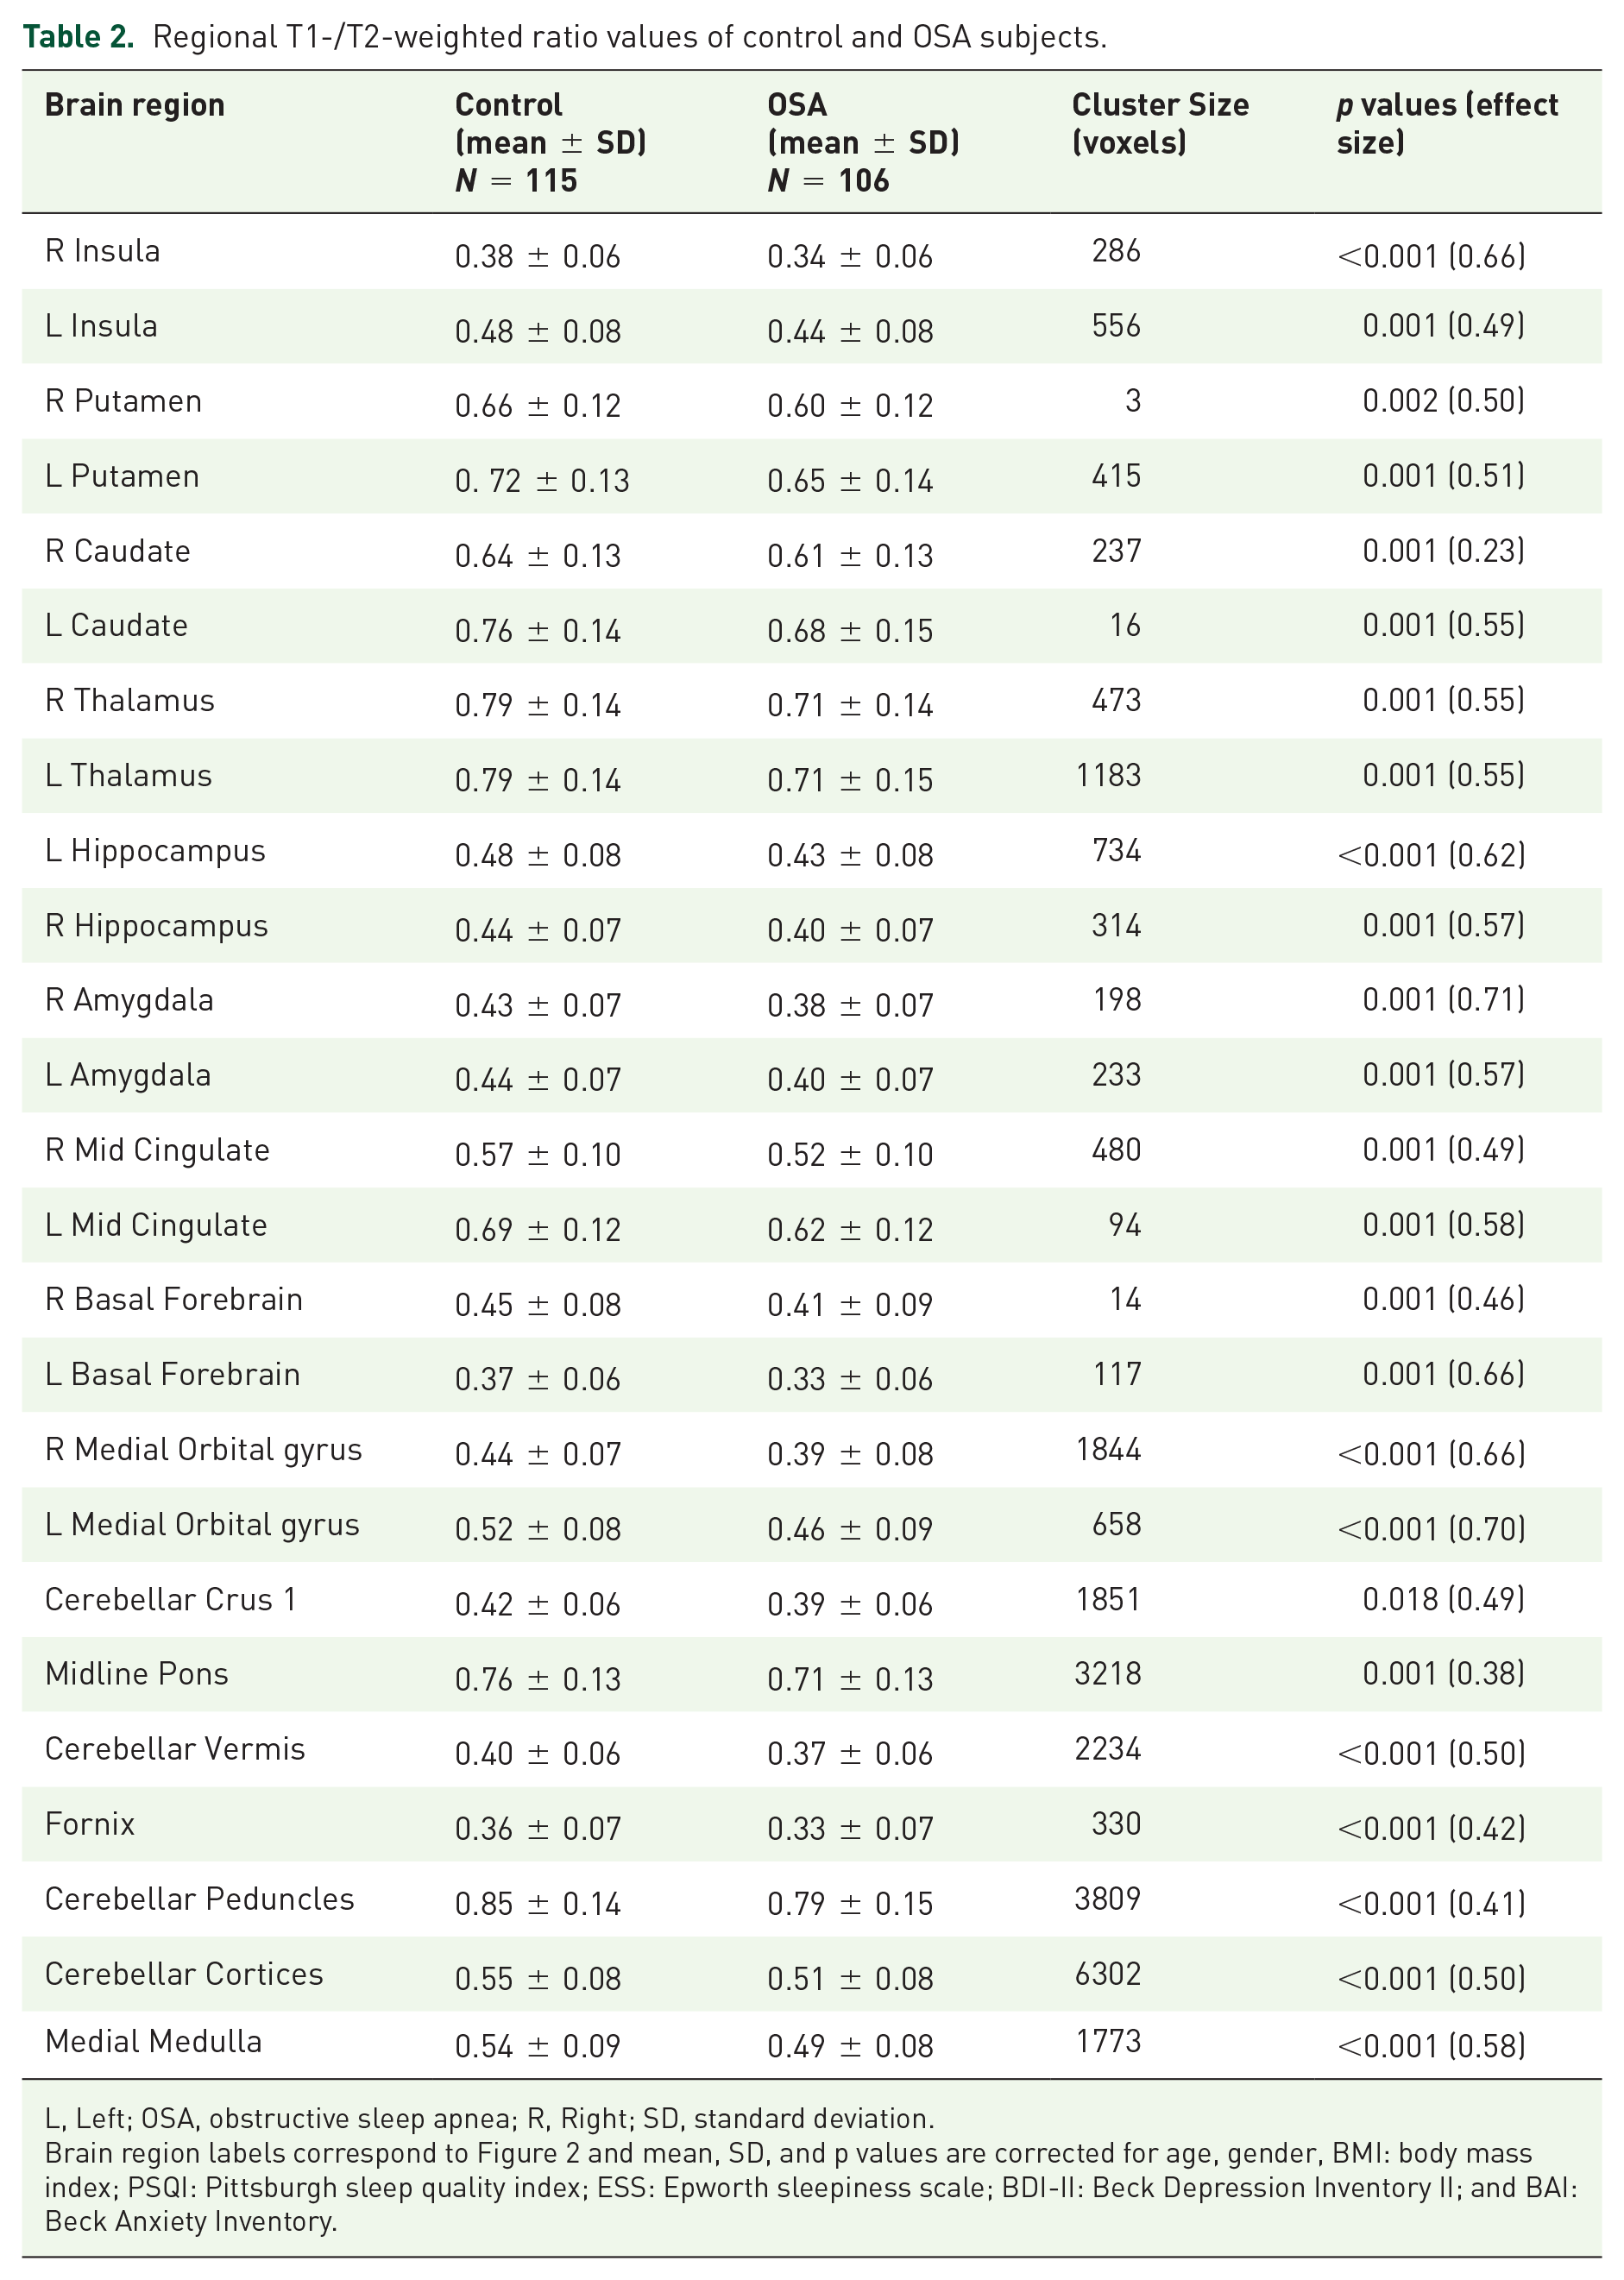
L, Left; OSA, obstructive sleep apnea; R, Right; SD, standard deviation.
Brain region labels correspond to Figure 2 and mean, SD, and p values are corrected for age, gender, BMI: body mass index; PSQI: Pittsburgh sleep quality index; ESS: Epworth sleepiness scale; BDI-II: Beck Depression Inventory II; and BAI: Beck Anxiety Inventory.
Correlations between T1-/T2-weighted ratios and sleep, mood, anxiety, and cognitive variables in OSA
BAI values showed significant negative correlations between T1-/T2-weighted ratio values of the left hippocampus and right amygdala in OSA subjects. No other variables showed any significant correlations with T1-/T2-weighted ratio values (Table 3).
Correlation r-values (p values) between T1-/T2-weighted ratio values and sleep, mood, anxiety, and cognitive scores.

AHI, Apnea-Hypopnea-Index; BAI, Beck anxiety inventory; BDI-II, Beck depression Inventory II; BMI, Body mass index; ESS, Epworth sleepiness scale; MoCA, Montreal cognitive assessment; PSQI, Pittsburgh sleep quality index; SaO2, Oxygen saturation.
p values are corrected for age and gender.
Discussion
Overview
Tissue injury appeared in several white matter and subcortical gray matter regions in recently diagnosed, untreated OSA subjects, as indicated by significantly lowered T1-/T2-weighted ratio values. Damage appeared predominantly in the medial medulla, extending to the midline pons, regions which contribute significantly to breathing and sympathetic control. In addition, areas such as cerebellar cortex, hippocampus, and amygdala, regions important for muscle coordination, and mediating cognitive, memory, and autonomic aspects showed lowered tissue integrity, along with surrounding white matter. Fiber projections to the frontal cortex, as well as insular and cingulate cortices necessary for autonomic regulation, showed significantly lowered tissue integrity. Previous studies have shown several brain sites in OSA to be compromised, but those sites were not as widespread as shown here. The widespread white matter damage to cortical-subcortical circuitry may result from cellular damage from hypoxic or inflammatory processes accompanying the sleep disordered breathing condition, and could contribute to understanding neural dysfunctions that lead to lowered autonomic, cognitive, and mood functions in OSA subjects. Lowered T1-/T2-weighted ratio values preferentially emerged on the left side. The lateralization of injury follows a pattern in a number of OSA studies.6,7,9 The mechanisms underlying the asymmetry are unclear, but may include relative perfusion differences between the left and right brain.
T1-weighted, T2-weighted images, and microstructural tissue differences
Conduction impairment from tissue damage can cause paralysis, sensory-motor dysfunction, cognitive deficits, mental retardation, and lead to compromised vital functions. 23 Important for OSA, slowing of conduction of signals to brainstem blood pressure and breathing arriving from cerebellar and forebrain sites can lead to delayed timing of activation of upper airway muscles relative to the diaphragm, accentuating airway obstruction. Moreover, late activation of transient blood pressure increases can lead to syncope during movement and slowed cognitive responses. We showed that the T1-weighted/T2-weighted ratio maps could be used to detect altered gray and white matter microstructural tissue differences in OSA. White matter structures, such as midline and surrounding occipital white matter, 24 extending to parietal and motor cortices, showed lowered ratio values in OSA subjects. This may be due to the increase in T2-weighted signal, especially in white matter areas, as a result of hypoxia accompanying the condition. 25 As the T2-weighted signal increases, the overall ratio values lower. In addition, frontal cortices also showed compromised tissue integrity, indicating that this procedure is robust in identifying various regions affected by microstructural tissue differences.
OSA findings and their implications
The underlying mechanisms contributing to gray and white matter microstructural differences in OSA may be a combination of hypoxic, hypercarbic, excitotoxic, and perfusion issues accompanying the syndrome. Upper airway blockage during sleep in OSA results in intermittent hypoxia, a process that reduces O2 supply to brain tissue, and then rapidly restores oxygenation a repetitive sequence especially damaging to tissue.26,27 The hypoxic processes initiate water movement from extracellular to intracellular spaces, leading to axonal and neuronal inflammation, including myelin swelling in acute conditions. The inflammatory responses can be observed as white matter differences, gray matter volume alterations, and metabolic deficits, and can be examined by various MRI and spectroscopy procedures in OSA, which are present in multiple brain areas.5,9,28–30 In addition, white matter injury in the form of loss of fiber integrity has been shown by fraction anisotropy techniques 31 in regions such as cingulate, corpus callosum, and multiple cortical projection areas. However, the findings here show widespread altered tissue integrity not only in the regions specific to autonomic, respiratory, mood, and cognitive roles, but also in surrounding white matter sites. Lowered T1-/T2-weighted ratio values appeared in frontal, insular, and cingulate cortices. Abnormalities in these sites can establish the basis for affective disorders, including depression and anxiety,32,33 and may affect autonomic regulation.34–36 White matter differences also extended to the cingulum bundle and cerebellar areas that control sympathetic and parasympathetic nervous systems.37–39 The cerebellar and cingulum bundle findings may contribute to the distorted timing to autonomic challenges (e.g. delayed onset of heart rate changes) 40 and excessive sympathetic tone.41,42
Areas implicated in normal emotional behavior have been closely related to the medial prefrontal cortex (MPFC), insula, amygdala, hippocampus, and ventromedial parts of the basal ganglia.43,44 We found altered tissue integrity in white matter circuits between the orbital and medial prefrontal cortex, amygdala, hippocampus, continuing up to the fornix and mid cingulate. Conduction failure between these regions can compromise emotional and mood behavior in OSA subjects, 45 which is also evident from the clinical measures, as they differ between groups. Correlation analyses show significant associations between BAI and T1-/T2-weighted ratio values of the insula, hippocampus, amygdala, basal forebrain, and cerebellar vermis. The majority of these areas, including the amygdala, insula, hippocampus, and basal forebrain are involved in anxiety control, a common issue in OSA subjects (Table 3). In addition, tissue injury to these limbic pathways can also cause deficits in processing speed, working and episodic memory, and worsen the quality of life in OSA subjects, as readily observed in major depressive disorder cases. 46
Similarly altered tissue integrity was observed in basal forebrain and pathways projecting to the caudate, putamen, and hippocampus and can severely affect mental performance and learning. 47 The mid corpus callosum, along with surrounding white matter, leading to the cingulate cortices, showed impaired tissue integrity that can affect inter-hemispheric transfer of information at various visuomotor and cognitive levels. 48 Although there was no significant difference in global MoCA scores, it is evident that this injury could impact visuospatial functioning, as a significant difference in visuospatial scores emerged between groups. In addition, tissue injury appeared in white matter projections from dorsal and ventral temporal regions, passing through the thalamus and frontal lobule. Injury to this circuitry is known to cause severe cognitive deficits.49,50 Finally, subcortical structures such as the midline pons, and white matter tracts extending to the medial medulla showed lowered ratio values as well. Damage to these areas and surrounding white matter structures would compromise regulation of blood pressure, respiration, and integration of baroreceptor and chemoreceptor afferents.51–54
We found widespread altered gray and white matter tissue integrity in regions responsible for cognitive, mood, autonomic, and respiratory functions. Several sites that showed more widespread tissue differences, included the corpus callosum, cingulum bundle, frontal, parietal, temporal, and occipital white matter, cerebellar peduncles, and anterior, mid, and posterior corona radiate over findings described earlier.7,9,31 These data suggest that aggressive breathing intervention is needed as soon as possible in OSA subjects after initial diagnosis.
Limitations
Several limitations of this study should be acknowledged. The spatial resolution of T2-weighted images (slice thickness of 3.5, 4 mm) are lower, compared with T1-weighted counterparts, which may have affected co-registration, and thus, tissue-related contrast. Due to time and technical constraints during scanning, we were unable to acquire high-resolution T2-weighted data. However, we co-registered T1-weighted to T2-weighted images, and resampled T1-weighted to T2-weighted resolution, which may have minimized variation in tissue contrast. Furthermore, we smoothed the data by 8 mm, which may affect the resolution in the slice direction, but this is an essential step for voxel-based procedures. In addition, the receiver coil bias across the two different scanners differs, and dividing T1-weighted by T2-weighted images may have not completely eradicated these inhomogeneities. Thus, variations in the bias field may have affected our findings, which could be improved if these issues are corrected in future studies. Data collected from two different scanners were pooled in this study without including scanner as a covariate, though histogram obtained from same control subjects from two different scanners showed no differences in shape and consistency. Although the T1-weighted and T2-weighted images were acquired successively, they may have undergone different receiver gain calibrations along with different shimming and auto adjustments that might have affected our results. However, histogram analyses of all the control subjects showed consistent pattern with minimal inter-subject variability across dataset, indicating minimum influence from receive gain changes, if any. Significant differences emerged in BMI between groups. Although BMI was used as a covariate in our statistical analysis, we cannot rule out any impact from BMI on these findings. The microstructural tissue differences found in this study could be enhanced due to multiple factors, including contribution from comorbidities, such as hypertension and type 2 diabetes. Therefore, future studies performing logistic regression to predict these changes by different comorbidities would be helpful. Factors including blood pressure, heart rate, and cholesterol levels have been known to influence cerebral microstructure. However, non-availability of such information from some OSA participants hindered us to account for these contributing factors in the statistical analyses.
Conclusion
Regional brain T1-weighted/T2-weighted ratio values are significantly lowered, indicating differences in gray and white matter microstructural tissue in multiple areas in newly diagnosed, treatment-naive OSA over control subjects. These areas of lowered ratio values include regions of critical autonomic, somatic motor inhibition, respiratory, mood, and cognitive control sites, including the insular cortices and surrounding white matter, hippocampus, fornix fibers, amygdala, basal forebrain fibers, mid-cingulate and cingulum bundle, corpus callosum, cerebellar cortices and peduncles, and midline and caudal pons. Some projections, particularly in thalamic sites, were less affected. Altered brain tissue in OSA is more widespread than determined previously, indicating that aggressive interventions are required in newly diagnosed OSA subjects. A range of pathological processes, including hypoxia and ischemia, repeated arousals, hypercarbia, and inflammatory-induced mechanisms may contribute to these differences. The findings suggest that T1-/T2-weighted ratio procedures could be useful procedures to examine gray and white matter microstructural differences with disease progression and help understand the OSA brain.