
Abstract
Background:
Aneurysm wall enhancement (AWE) in high-resolution magnetic resonance imaging (HR-MRI) has emerged as a new imaging biomarker of intracranial aneurysm instability.
Objective:
To determine a standard method of AWE quantification for predicting fusiform intracranial aneurysms (FIAs) stability by comparing the sensitivity of each parameter in identifying symptomatic FIAs. The predictors of AWE and FIA types were also identified.
Methods:
We retrospectively analyzed consecutive fusiform aneurysm patients who underwent HR-MRI from two centers. The aneurysm-to-pituitary stalk contrast ratio (CRstalk), aneurysm enhancement ratio, and aneurysm enhancement index were extracted, and their sensitivities in discriminating aneurysm symptoms were compared using the receiver-operating characteristic curve. Morphological parameters of fusiform aneurysm were extracted based on 3D vessel model. Uni- and multivariate analyses of related predictors for AWE, CRstalk, and FIA types were performed, respectively.
Results:
Overall, 117 patients (mean age, 53.3 ± 11.7 years; male, 75.2%) with 117 FIAs underwent HR-MRI were included. CRstalk with the maximum signal intensity (CRstalk-max) had the highest sensitivity in identifying symptomatic FIAs with an area under the curve value (0.697) and a cut-off value of 0.90. The independent predictors of AWE were aneurysm symptoms [(odds ratio) OR = 3.754, p = 0.003], aspirin use (OR = 0.248, p = 0.037), and the maximum diameter of the cross-section (OR = 1.171, p = 0.043). The independent predictors of CRstalk-max were aneurysm symptoms (OR = 1.289, p = 0.003) and posterior circulation aneurysm (OR = 1.314, p = 0.001). Transitional-type showed higher rates of hypertension and mural thrombus over both dolichoectatic- and fusiform-type FIAs.
Conclusion:
CRstalk-max may be the most reliable parameter to quantify AWE to distinguish symptomatic FIAs. It also has the potential to identify unstable FIAs. Several factors contribute to the complex pathophysiology of FIAs and need further validation in a larger cohort.
Introduction
Intracranial aneurysms (IAs) affect nearly 3–5% of the entire population. 1 IA rupture leads to aneurysmal subarachnoid hemorrhage, followed by high morbidity and mortality. 1 Generally, IAs are dichotomized into saccular IAs (SIAs) and fusiform IAs (FIAs) based on their morphology.2,3 SIAs account for the majority, while FIAs only account for 3–13% of IAs.3–6 Recent studies have revealed that the physiological processes differ between SIAs and FIAs.3,7 Hemodynamically, FIAs may be subjected to lower hemodynamic stress than SIAs.7,8 Pathologically, FIAs may demonstrate more extensive pathological processes because they are associated with greater aneurysm wall enhancement (AWE) and more involved areas of the culprit artery than SIAs. 3 On the basis of their pathological features, non-saccular aneurysms can be divided into three types: fusiform, dolichoectatic, and transitional. 9
Aneurysm growth and rupture are mediated by inflammatory processes in the aneurysm wall. 10 Recently, AWE on high-resolution magnetic resonance imaging (HR-MRI), which correlates with aneurysm wall inflammation and vasa vasorum, has been identified as a useful surrogate biomarker of unstable IAs.11,12 Thus, a standard quantification of AWE may help to delineate the borderline cases and screen those patients who need early intervention. Several studies have standardized AWE quantification in SIAs.13–15 One study has reported that the aneurysm-to-pituitary stalk contrast ratio (CRstalk) with a cut-off value of 0.60 tends to have a higher sensitivity in discriminating unstable aneurysms than other AWE parameters (e.g. aneurysm enhancement ratio, AER; aneurysm enhancement index, AEI). 13 However, there is currently no standard definition for AWE quantification of FIAs. Considering certain aneurysm symptoms (e.g. sentinal headache and oculomotor nerve palsy) reportedly strongly indicate aneurysm instability, 16 it is, therefore, reasonable to determine a standard method of AWE quantification for predicting FIA stability by comparing the sensitivity of each parameter in identifying symptomatic FIAs. To understand the underlying mechanisms of IA progression, the risk factors for AWE of SIAs, which may include aneurysm symptoms, anti-inflammatory drugs, and aneurysm morphology, have been widely studied.16–18 In contrast, the related predictors of AWE in FIAs have received less attention. In addition, based on the fact that FIAs, characterized by different classifications,8,9 present a wide spectrum of pathophysiology, 8 investigating the related predictors of AWE and FIA types may help to understand the disease processes of vasculopathy.
We aimed to identify a standard method to quantify the AWE of FIAs. To further understand the physiological mechanisms of FIAs, related predictors of AWE and FIA types were also investigated.
Methods
Patients’ characteristics
Consecutive patients with FIAs who underwent HR-MRI were retrospectively recruited from August 2015 to September 2021 at Beijing Tiantan Hospital and Center for Biomedical Imaging Research of Tsinghua University. Patients who harbored dissecting aneurysms, dural arteriovenous fistulas, arteriovenous malformations, Moya Moya disease or other cerebrovascular diseases, incomplete medical records, or poor image quality for AWE analysis, or without post-gadolinium sequencing on HR-MRI were excluded. The baseline characteristics of the patients, including aneurysm symptoms, hypertension, hyperlipidemia, diabetes mellitus, smoking status, and aspirin use, were obtained from medical records or telephone follow-up. Aneurysm symptoms were defined as sentinel headache and oculomotor nerve palsy, which strongly indicate aneurysm instability. 16 Smoking status was defined as never smoking, current smoking, and former smoking, as outlined in our previous study. 19 Aspirin use was defined as a daily intake of ⩾81 mg aspirin in the recent 6 months or longer. 16
Aneurysm characteristics
The characteristics of FIAs included fusiform type, location, maximum diameter (Dmax), and maximum length (Lmax). Dissecting aneurysms were defined as string sign, double lumen, intimal flap, alternation of stenosis and dilatation, arterial occlusion, or semilunar hematoma with luminal narrowing.20–22 Considering the inherent differences between dissecting aneurysms and other types of aneurysms, the Mizutani classification, which includes dissecting aneurysms, was not used in this study.
One experienced reader with at least 20 years of neuroimaging diagnosis experience identified and excluded those dissecting aneurysms. Then, the included FIAs were classified based on Flemming’s classification.8,9 Fusiform-type FIAs are characterized by dilatation of 1.5 times the diameter of the normal blood vessel, dolichoectatic-type FIAs are characterized by uniform dilatation of >1.5 times normal, while transitional-type FIAs are characterized by uniform dilatation of >1.5 times normal with overlapping dilatation of the part of the involved blood vessel. 12 The aneurysm location was divided into the anterior circulation and the posterior circulation.
Dmax was defined as the greatest diameter in the cross-section,20,23,24 while Lmax was defined as the length of the involved vessel with a boundary of 1.5 times the normal vessel.23,24 Three-dimensional (3D) time-of-flight (TOF) magnetic resonance angiography (MRA) was used to quantify Dmax and Lmax in the 3D space. Specifically, the 3D vessel model [Figure 1(a)] was first generated based on a workflow, including threshold segmentation, region growth, connected domain selection, and surface smoothing, using our in-house software programmed in Python. Second, to measure Lmax, the centerline of the vessel was automatically extracted based on the feature tree growth algorithm [Figure 1(b)]. Next, the centerline of the FIA was isolated from the rest of the centerline network according to the boundary definition [Figure 1(c)]. Finally, Lmax was calculated based on the isolated centerline, and Dmax was measured in the cross-section [Figure 1(d)]. Mural thrombus was identified as a high signal in T1. 21
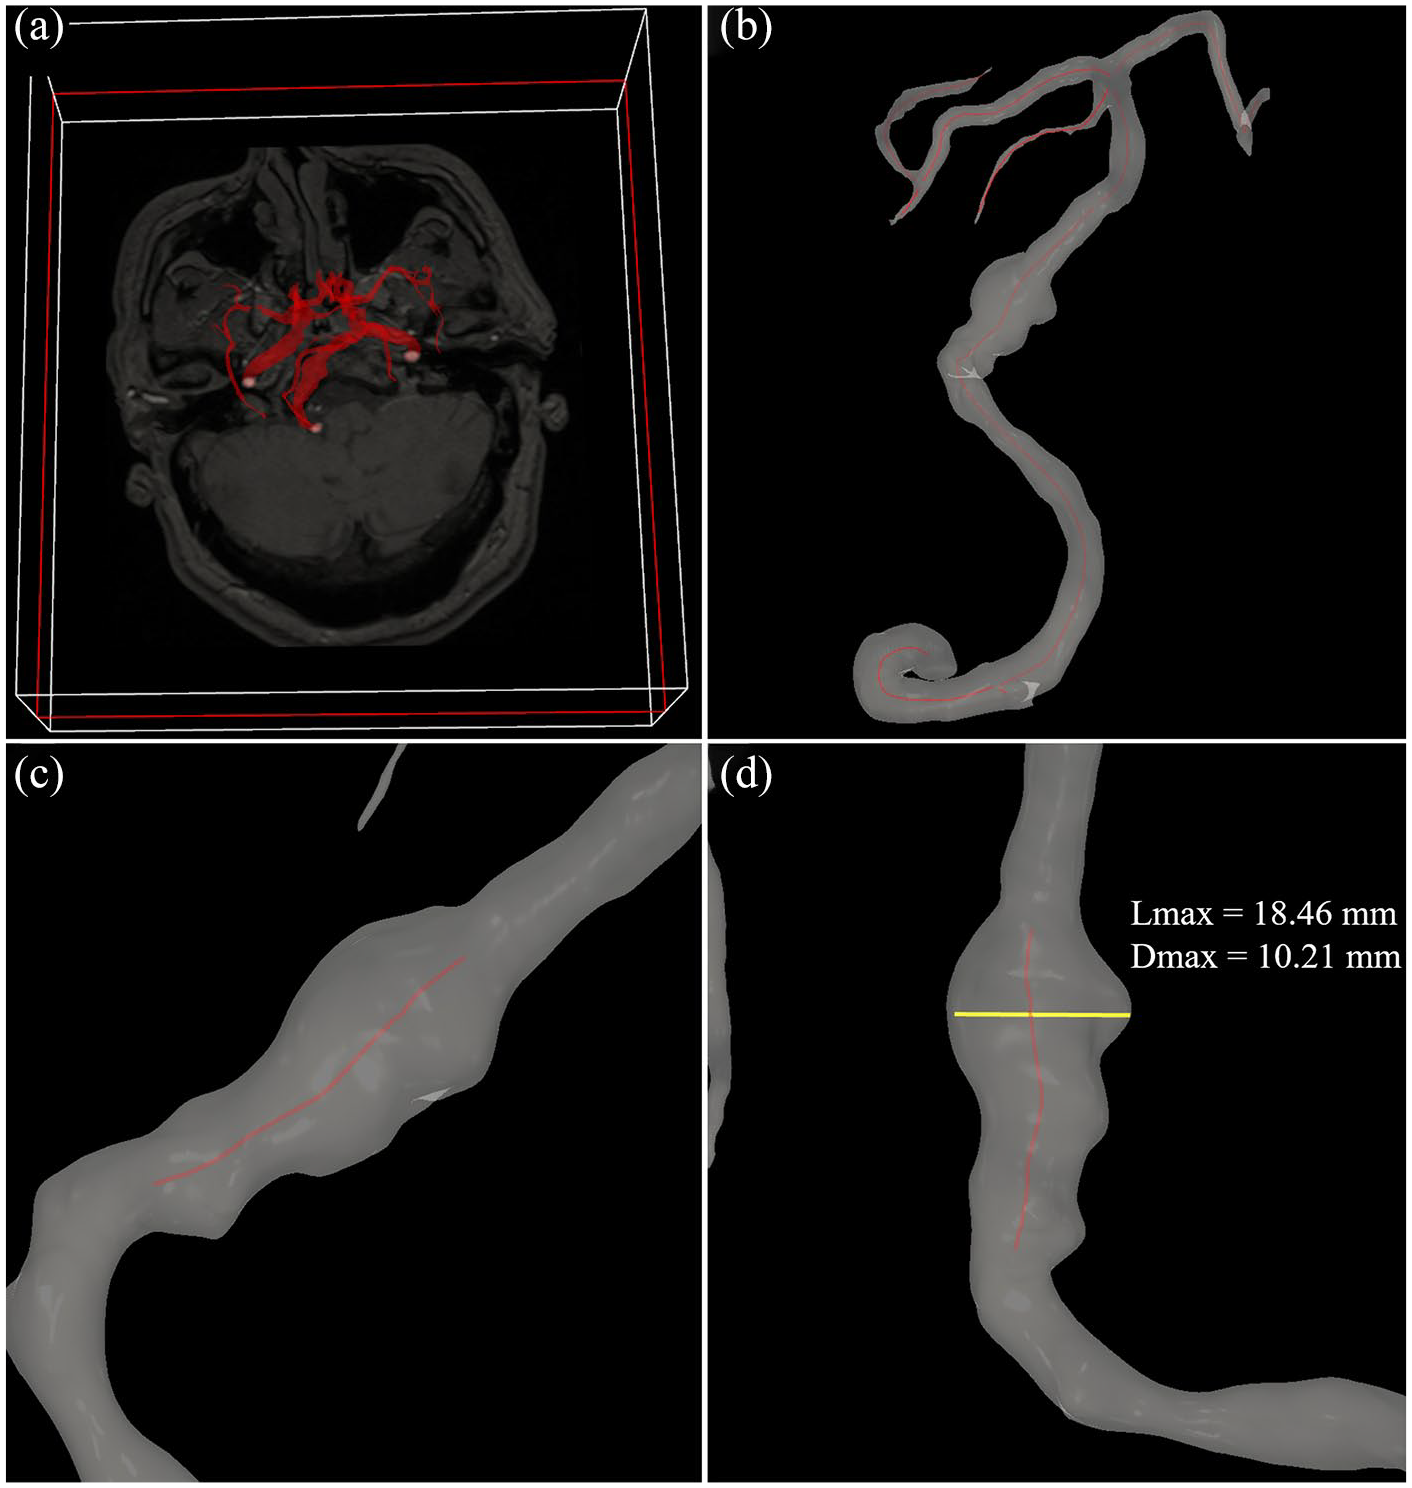
Quantification of Dmax and Lmax in the 3D space. (a) The 3D vessel model was first extracted from 3D TOF MRA. (b) The centerline of the vessel was then automatically extracted. (c and d) Finally, Lmax was calculated based on the boundary definition, and Dmax was measured in the cross-section.
HR-MRI protocol
All MRI scans were performed using a 3.0-T MR scanner (Trio-Tim, Siemens Healthcare, Erlangen, Germany; Discovery 750, GE Healthcare, Milwaukee, WI, USA; Ingenia CX, Philips Healthcare, Best, the Netherlands) equipped with a 32-channel head coil. Three-dimensional TOF MRA was used to identify FIAs. High-resolution sequences included pre- and post-contrast 3D T1-weighted images (SPACE/CUBE/VISTA) with a voxel size of 0.7 × 0.7 × 0.7 mm3. Six minutes after the injection of 0.1 mmol/kg gadopentetate dimeglumine (Gd, Magnevist; Bayer Schering Pharma AG), post-contrast T1-weighted imaging was performed.
AWE assessment
The AWE assessment was carried out using Horos (https://horosproject.org/). Two experienced readers with at least 5 years of neuroimaging diagnosis experience were blinded to patients’ information to assess AWE. Any discrepancy was resolved by consensus with a third experienced reader. First, the pre- and post-contrast T1-weighted images of FIAs were manually co-registered in three planes (axial, coronal, and sagittal) using the same slide. 16 Then, the region of interest of the aneurysm wall was extracted from the plane that covered the maximum aneurysm diameter. To avoid pseudo-enhancement of the aneurysm wall, pre- and post-contrast T1-weighted images were compared to define aneurysm wall thickness. 16 SIwall was defined as the signal intensity (SI) of the aneurysm wall on pre- or post-contrast T1-weighted images of FIAs at the plane covering the maximum aneurysm diameter in the cross-section and extending to the sites of 1.5 normal diameters of the parent vessel in both directions as the boundary (same boundary with the Lmax).20,23,24 Meanwhile, the mean value of four randomized points in the pituitary stalk (SIstalk) was calculated (Figure 2). 13 CRstalk-average and CRstalk-max were calculated as the ratio of SIwall over SIstalk on post-contrast imaging, which used the mean and maximum SI, respectively. 6 The AER was calculated as (SIwall-post−SIwall-pre)/SIwall-pre. 15 SIbrain was defined as the SI in the co-registered 20 mm2, which was drawn over the corpus callosum (Figure 2). 15 Then, the AEI was calculated as [(SIwall-post/SIbrain-post) − (SIwall-pre/SIbrain-pre)]/(SIwall-pre/SIbrain-pre). Similarly, AERmax, AEImax, AERaverage, and AEIaverage were calculated using the mean or maximum SI value.

Post-contrast 3D T1-weighted images revealed the 20 mm2 of corpus callosum (red circle), four points of the pituitary infundibulum (black plus), and fusiform aneurysm of the right vertebral artery (white triangle).
Statistical analysis
All statistical analyses were conducted using SPSS version 22.0 (IBM Corp., Armonk, NY, USA). Continuous variables are expressed as mean ± standard deviation, and categorical variables are expressed as frequency and percentage. A non-parametric test (Kruskal–Wallis H test) was used for statistical assessment of AWE parameters (CRstalk, AER, and AEI) using the maximum and mean SI values, respectively. A p value of <0.05 was considered statistically significant. On the basis of aneurysm symptoms, which predict aneurysm instability, sentinel headache and oculomotor nerve palsy were used in the receiver-operating characteristic (ROC) curve analysis. Discrimination, which refers to the ability to discriminate symptomatic and asymptomatic FIAs, was assessed using the C-statistic [an area under the ROC curve (AUC) of 0.5 indicates no discriminative ability and an AUC of 1.0 indicates a perfect discriminative ability]. When the cut-off value of the AWE parameter with the highest sensitivity to discriminate aneurysm symptoms was defined, the AWE parameter was classified into two categories: non-AWE and AWE.
To identify the risk factors for AWE, the baseline characteristics of the patients and aneurysms were first examined in the univariate analysis (χ2 test or Kruskal–Wallis H test). Variables with a p value of <0.20 were entered into the logistic regression analysis. To identify the risk factors of CRstalk-max, those baseline characteristics were first examined in the general regression analysis. Variables with p < 0.20 were entered into the multiple linear regression analysis. To identify the risk factors for FIA type, those baseline characteristics were first examined in the univariate analysis (χ2 test or Kruskal–Wallis H test). Variables with a p value of <0.10 were entered into the multinomial logistic regression analysis.
Results
Patient and aneurysm characteristics
A total of 117 patients (mean age, 53.3 ± 11.7 years; male, 75.2%) with FIAs were included in this study (Figure 3). Among them, 81 patients (69.2%) had fusiform-type FIAs, 21 patients (17.9%) had dolichoectatic-type FIAs, and 15 patients (12.8%) had transitional-type FIAs. The assessments of aneurysm morphology and AWE for these three types of FIA are summarized in Figure 4. Fifty patients (42.7%) presented with aneurysm symptoms, including 39 (33.3%) with sentinel headache and 11 (9.4%) with oculomotor nerve palsy. The characteristics of the patients and FIAs are listed in Table 1.
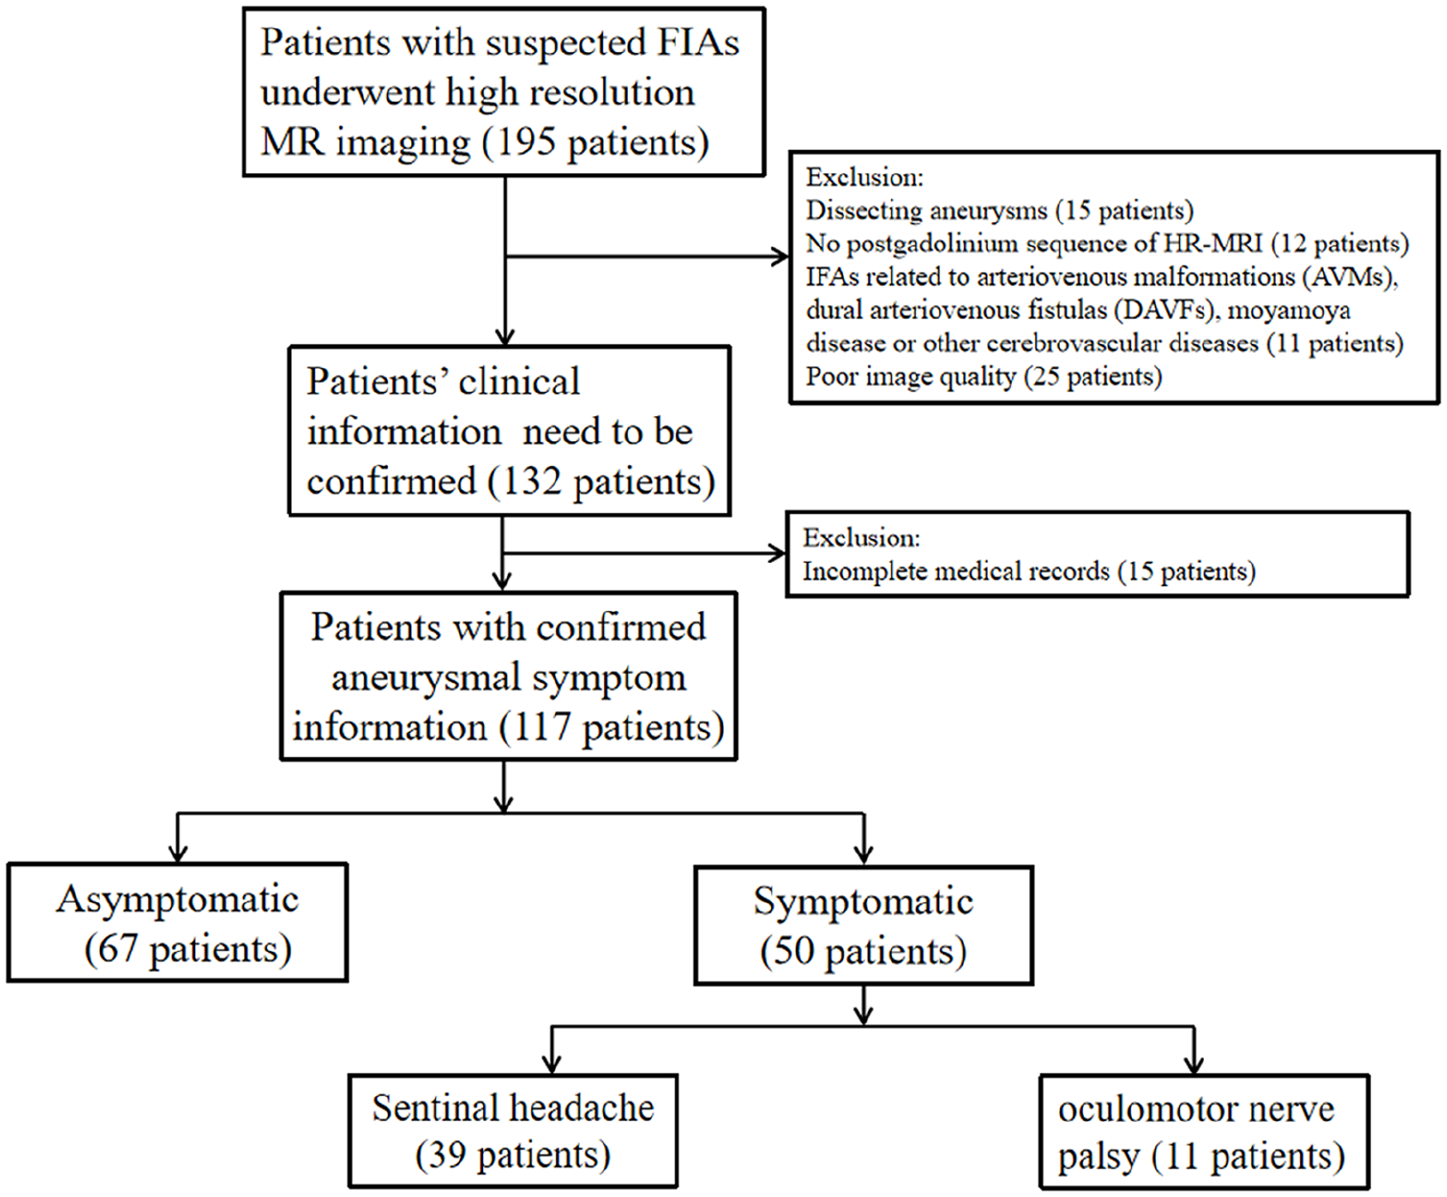
Flowchart of patient selection.

Assessment of aneurysm morphology and AWE in fusiform, dolichoectatic, and transitional FIAs. The upper column shows 3D TOF MRA, the middle column shows AWE of three types of FIA, and the bottom column shows Dmax (yellow line) and Lmax (red line).
Characteristics of patients and FIAs.
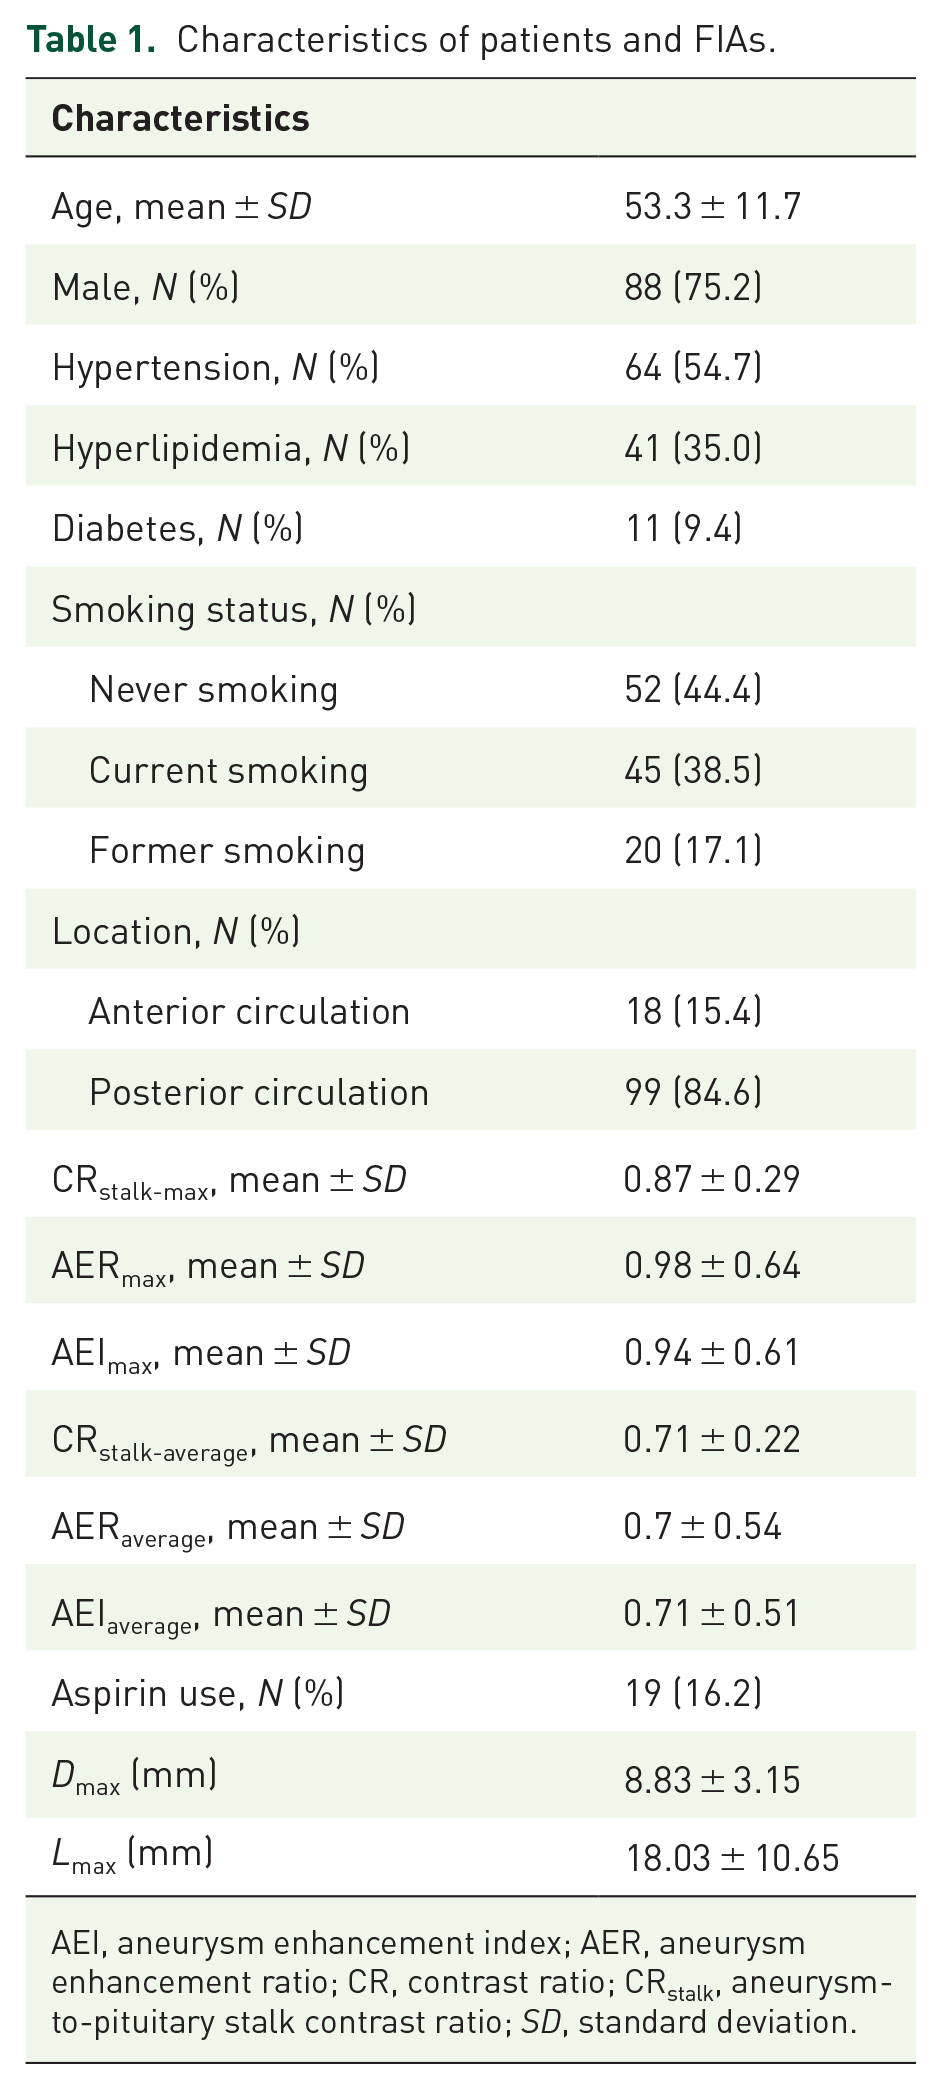
AEI, aneurysm enhancement index; AER, aneurysm enhancement ratio; CR, contrast ratio; CRstalk, aneurysm-to-pituitary stalk contrast ratio; SD, standard deviation.
AWE quantification in discriminating symptomatic FIAs
The Kruskal–Wallis H test showed that patients with aneurysm symptoms had significantly higher CRstalk-max (0.99 versus 0.77, p < 0.001), AERmax (1.13 versus 0.68, p = 0.037), AEImax (1.08 versus 0.84, p = 0.022), CRstalk-average (0.79 versus 0.65, p = 0.001), and AEIaverage (0.80 versus 0.64, p = 0.024) values than patients without aneurysm symptoms. Notably, although not statistically significant, AERaverage (0.84 versus 0.68, p = 0.093) tended to be higher in patients with aneurysm symptoms. In subsequent ROC curve analyses, CRstalk-max had the greatest AUC of 0.697 (Figure 5). When the cut-off value of CRstalk-max was 0.90, the sensitivity and the specificity were 0.60 and 0.701, respectively.

ROC curves for CRstalk-max, AERmax, AEImax, CRstalk-average, and AEIaverage with AUC values of 0.697, 0.675, 0.624, 0.622, and 0.613, respectively.
Risk factors associated with AWE and CRstalk-max in FIAs
The cut-off value of CRstalk-max was 0.90. Thus, a CRstalk-max of ⩾0.90 was defined as AWE, and a CRstalk-max of <0.90 was defined as non-AWE. For the risk factors of AWE in FIAs, univariate analysis revealed that age (p = 0.140), aneurysm symptoms (p = 0.001), hyperlipidemia (p = 0.083), diabetes mellitus (p = 0.113), coronary artery disease (p = 0.068), atherosclerosis (p = 0.014), mural thrombus (p = 0.054), current smoking (p = 0.180), aspirin use (p = 0.044), FIA type (p = 0.027), Dmax (p = 0.003), Lmax (p = 0.003), and posterior circulation aneurysm (p = 0.071) tended to be associated with positive AWE and were entered into the multivariate analysis. In the multivariate analysis, aneurysm symptoms [odds ratio (OR) = 3.754, p = 0.003), Dmax (OR = 1.171, p = 0.043), and aspirin use (OR = 0.248, p = 0.037) still remained significant (Table 2).
Uni- and multivariate analyses using CRstalk-max ⩾ 0.90 as the cut-off for aneurysmal wall enhancement.

CI, confidence interval; CRstalk, aneurysm-to-pituitary stalk contrast ratio; OR, odds ratio.
Statistically significant.
For the risk factors of CRstalk-max in FIAs, univariate analysis revealed that hyperlipidemia (p = 0.118), current smoking (p = 0.105), aspirin use (p = 0.103), aneurysm symptoms (p < 0.001), posterior circulation aneurysm (p < 0.001), Dmax (p = 0.002), Lmax (p < 0.001), mural thrombus (p = 0.004), and atherosclerosis (p < 0.001) tended to be associated with CRstalk-max and were entered into the multivariate analysis. Multivariate analysis revealed that aneurysm symptoms (OR = 1.289, p = 0.003) and posterior circulation aneurysm (OR = 1.314, p = 0.001) were the independent predictors of CRstalk-max (Table 3).
Risk factors associated with CRstalk.

CR, contrast ratio CRstalk, aneurysm-to-pituitary stalk contrast ratio.
p < 0.05.
Risk factors associated with FIA type
The subgroup analysis of FIA type is presented in Table 4. In the univariate analysis, transitional-type FIAs had the highest CRstalk-max (1.00 ± 0.25), while fusiform-type FIAs had the lowest CRstalk-max (0.81 ± 0.28). 93.3% of transitional-type FIAs had hypertension compared with 57.1% of dolichoectatic-type FIAs and 46.9% of fusiform-type FIAs (p = 0.004). Atherosclerosis was present in 66.7% of transitional-type FIAs compared with 61.9% of dolichoectatic-type FIAs and 34.6% of fusiform-type FIAs (p = 0.018). Mural thrombus was present in 66.7% of transitional-type FIAs compared with 33.3% of dolichoectatic-type FIAs and 30.9% of fusiform-type FIAs (p = 0.028). Transitional-type FIAs had the highest Dmax (11.53 ± 3.40 mm, p < 0.001) and Lmax (29.60 ± 14.63 mm, p < 0.001) compared with both dolichoectatic- and fusiform-type FIAs.
Uni- and multivariate analyses for FIA types.
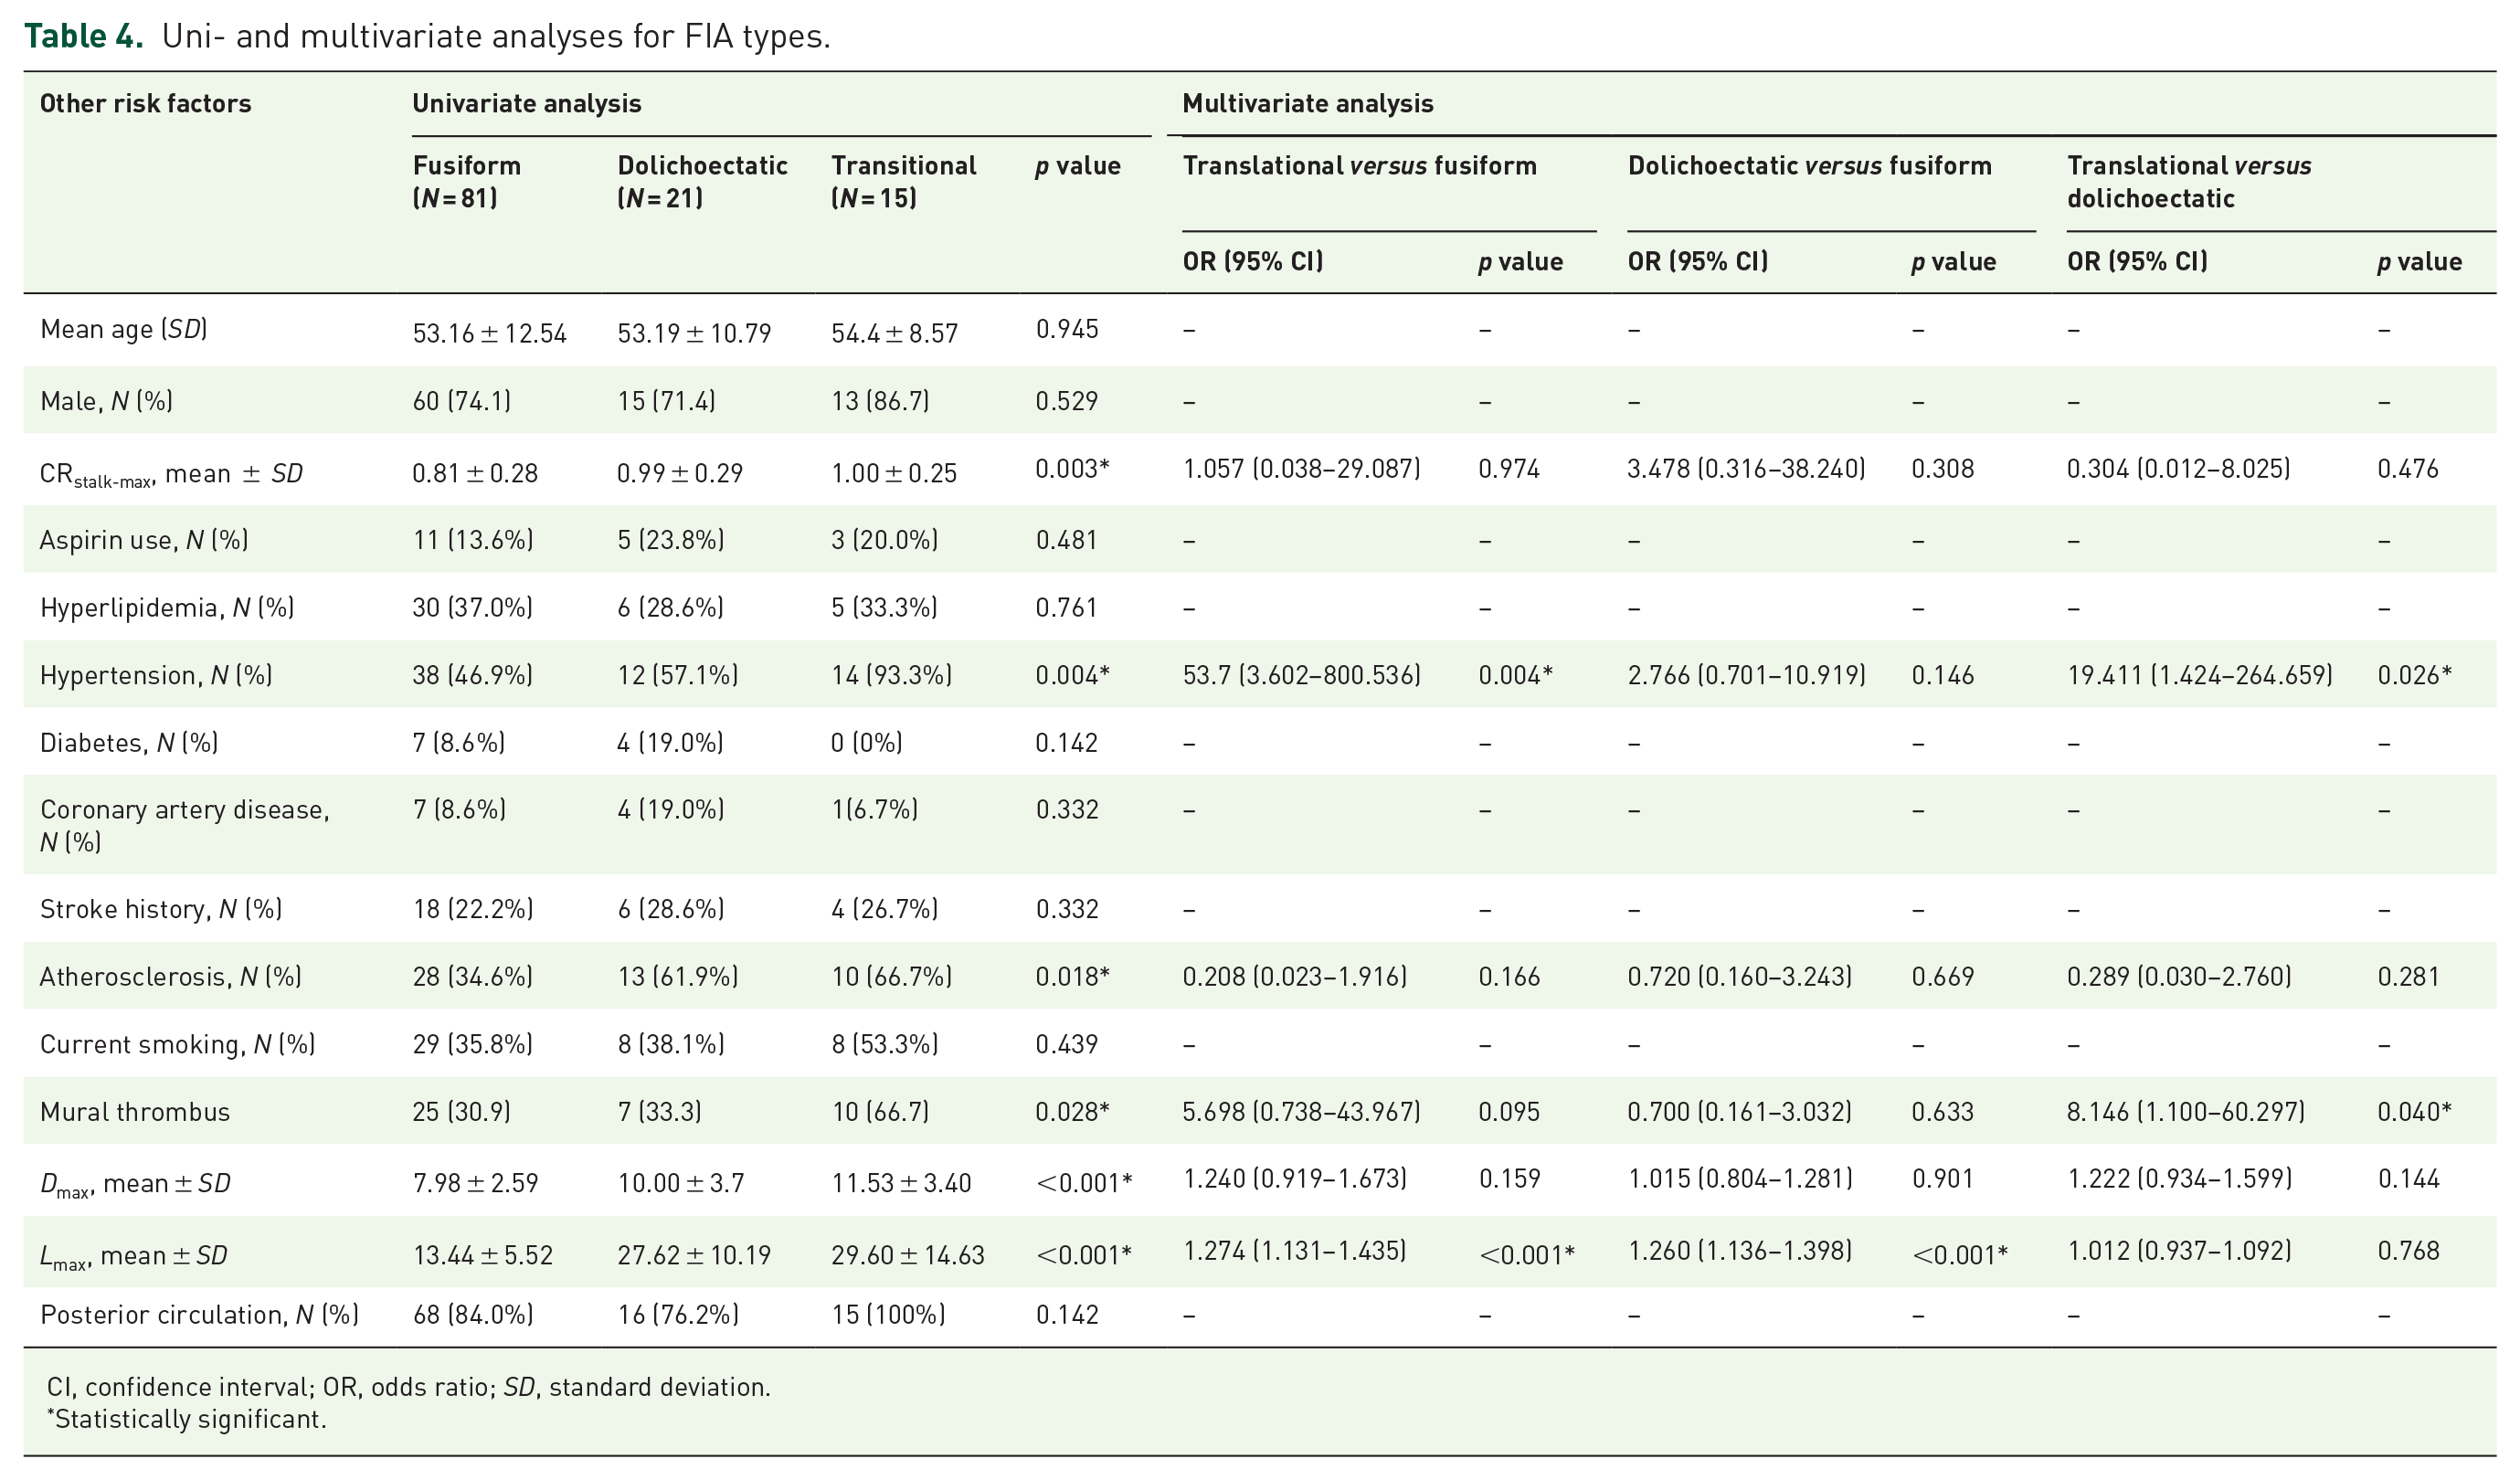
CI, confidence interval; OR, odds ratio; SD, standard deviation.
Statistically significant.
In multivariate analysis, dolichoectatic-type FIAs showed higher Lmax over fusiform-type FIA (OR = 1.260, p < 0.001). Transitional-type FIAs showed higher Lmax (OR = 1.274, p < 0.001), higher rates of hypertension (OR = 53.700, p = 0.004), and tended to have higher rates of mural thrombus (OR = 5.698, p = 0.095) over fusiform-type FIAs. In addition, transitional-type FIAs showed higher rates of hypertension (OR = 19.411, p = 0.026) and higher rates of mural thrombus (OR = 8.146, p = 0.040) over dolichoectatic-type FIAs.
Discussion
Poor natural history 21 and high mortality and morbidity rates by clinical treatment (e.g. surgical clipping, bypass, or endovascular treatment) 25 put a dilemma for patients of whether to choose conservative treatment or aggressive intervention, especially for those patients without clear clinical symptoms. Furthermore, insufficient understanding of the intricate pathophysiology processes of FIAs may impede an effective clinical management strategy. Recently, AWE, manifested aneurysm wall pathology, has emerged as a new imaging biomarker of IA instability. 26 Thus, a standardized method of AWE quantification may facilitate FIA stability prediction and delineate the borderline cases that need intervention. Moreover, investigations of the influence factors of AWE and FIA types may help to understand FIA pathophysiology and contribute to clinical management.
In the present study, we found CRstalk-max is the most reliable AWE quantitative parameter in distinguishing aneurysm symptoms, with a cut-off value of 0.90. Then, AWE was defined as CRstalk-max ⩾ 0.90. We found that the independent predictors of AWE and CRstalk-max may include Dmax, aneurysm symptoms, aspirin use, and posterior circulation aneurysm. Transitional-type FIAs showed higher rates of hypertension and mural thrombus over both dolichoectatic- and fusiform-type FIAs.
Standardized AWE parameters in FIAs
Qualitative and quantitative studies of AWE have been performed in the context of SIAs.16–18 To identify the most reliable AWE parameters to distinguish unstable SIAs, Roa et al. compared three different AWE parameters (CRstalk, AER, and AEI). They found that CRstalk with a maximum SI had the highest sensitivity in discriminating unstable SIAs, with a cut-off value of 0.60. 17 Recently, AWE of FIAs has received much attention.6,11,20 Liu et al. investigated AWE of SIAs and FIAs using 7.0-T HR-MRI. They found that compared with SIAs, FIAs had a stronger enhancement pattern, a higher enhancement grade, and a higher enhancement ratio (ER), which corresponds to CRstalk in the current study. 6 In their study, the average maximum ER and mean ER values in FIAs were 1.42 and 0.96, respectively. Cao et al. 20 investigated the AWE characteristics of non-saccular aneurysms in the basilar and vertebral arteries. They found that ER was an independent predictor of aneurysm symptoms, with a cut-off value of 0.82. However, related studies on AWE quantification in FIAs are still limited. Furthermore, the cut-off value for AWE, which can differentiate unstable FIAs, is still unclear. Roa et al. 17 defined those unruptured SIAs ⩾7 mm in certain locations (e.g. anterior communicating, posterior communicating, and basilar arteries) as unstable. In the current study, unstable FIAs were defined as certain symptoms (sentinel headache and oculomotor nerve palsy), since they are reportedly strongly indicative of aneurysm instability. 16 Therefore, we compared CRstalk, AER, and AEI with the maximum and mean SI in their ability to distinguish aneurysm symptoms. We found that CRstalk with a maximum SI (CRstalk-max) had the highest accuracy in identifying symptomatic FIAs, with a cut-off value of 0.90. Thus, CRstalk-max (⩾0.90) may also have the potential to distinguish unstable FIAs. For example, an FIA with CRstalk-max ⩾ 0.90 (especially for those patients with unspecific symptoms) may indicate unstable and require clinical evaluation or further intervention. In addition, the pathophysiology of IAs includes the interaction between morphology, hemodynamics, and aneurysm inflammation.10,27 Hence, in future studies, we consider AWE could be combined with the current risk factors of IA instability (e.g. symptom, aneurysm size) to establish a comprehensive evaluation model for IA stability.
Risk factors for AWE and CRstalk-max of FIAs
On the basis of the cut-off value of 0.90, parameter of AWE was divided into AWE and non-AWE. Dmax, aspirin use, and aneurysm symptoms were independent predictors of AWE in FIAs. A previous study demonstrated the association between AWE and Dmax. 20 Moreover, AWE correlated with aneurysm growth in several previous studies and tended to be greater when close to the SIA neck.28–30 Dmax represents the most obvious expansion of the cross-sectional plane; thus, this plane tends to have stronger AWE. Therefore, it is more inclined to grow. Lmax, based on the 3D vessel model and centerline extraction, was used to define the length of the culprit vessel. Lmax was not an independent predictor of AWE in this study, possibly due to the heterogeneity in AWE in different areas of the involved aneurysm segment. 28 Although Dmax and Lmax tended to be positively associated with CRstalk-max (rs = 0.507, p < 0.001; rs = 0.295, p = 0.001, respectively), both of them were not the independent predictors of CRstalk-max. Thus, the associations between aneurysm morphology and AWE in FIAs need to be further verified. Aneurysm symptoms were independent predictors of both AWE and CRstalk-max in FIAs. Such associations between them have been reported previously.16,20 Anti-inflammatory drugs, such as aspirin, are associated with a decrease in AWE in SIAs. 17 In the current study, aspirin use was the independent predictor of AWE in FIAs. Aspirin is beneficial in resisting the inflammatory microenvironment in the aneurysm wall through its ability to inhibit COX-2 activity, which is involved in aneurysm pathogenesis and progression.17,31 Considering aspirin use has been reported to be associated with a decreased risk of aneurysm growth in SIAs,32,33 it may also have the potential to decrease the growth rate of FIAs. However, aspirin use was not the independent predictor of CRstalk-max. In fact, only 19 patients (16.2%) had a history of aspirin use in the recent 6 months or longer, which may limit the results compared with a recent study in which a high proportion of patients (52.7%) used aspirin. 17 Other risk factors (e.g. mural thrombus, posterior circulation, atherosclerosis) also tended to be associated with AWE (or CRstalk-max) in FIAs although did not reach statistical significance, larger cohorts are needed to investigate and validate such risk factors.
Risk factors for FIA types
Compared with SIAs, FIAs have a different pathogenesis and tend to involve the entire artery. 11 Flemming et al. 9 made a simple classification for FIA types (fusiform, dolichoectatic, and transitional) based on the extent of dilatation and the involved artery. Because of limited studies on FIAs, the potential risk factors that differentiate the types of FIA are still unclear. Nasr et al. performed a subgroup analysis of FIA types. They found significant differences in maximum diameter and mural thrombus between the three FIA types. 21 Compared with their study, HR-MRI was used in the present study to present the characteristics of aneurysm wall vasculopathy and aneurysm morphology, which revealed that transitional-type FIAs had higher rates of hypertension and mural thrombus than both dolichoectatic- and fusiform-type FIAs (Table 4). Hypertension has long been considered an independent predictor of IAs. 34 This all revealed that hypertension may facilitate the evolution of FIAs to a more complex type (transitional-type). Mural thrombus also occurred more often in transitional-type FIAs than in the other two FIA types. Mural thrombus, which manifests the processes of neovascularization in the inner aneurysmal wall or vasa vasorum in the outer aneurysmal wall,8,35 was reported to be a predictor of FIA growth. 21 Therefore, FIA patients with hypertension need more close blood pressure monitoring. 36 In addition, on the basis of the 3D vessel model, Lmax tended to be longer in dolichoectatic- and transitional-type FIAs than in fusiform-type FIAs (Table 4), which revealed that more complex types of FIAs tend to involve more areas of the culprit artery. Still, longitudinal follow-up studies based on HR-MRI with larger sample sizes are needed to investigate the differences in progression between the three types of FIA.
The findings of this study have several clinical implications. First, CRstalk-max could serve as a new imaging biomarker of FIA symptoms (sentinel headache and oculomotor nerve palsy) for patient screening. Second, an FIA with CRstalk-max of ⩾0.90 may indicate the FIA is unstable, especially for patients with unclear clinical symptoms and hard to assess the FIA stability. Third, FIA patients with hypertension need close monitoring and management of hypertension. Finally, anti-inflammatory drugs (e.g. aspirin) may have the potential to decrease AWE and therefore inhibit FIA progression further.
Strengths and limitations
To our knowledge, this is the first study to quantitatively evaluate the ability of AWE to discriminate aneurysm symptoms in a large cohort of patients with FIAs based on HR-MRI. In addition, the risk factors for AWE and FIA types were also investigated. To eliminate the heterogeneity between the three types of FIA to the greatest possible extent, dissecting aneurysms were excluded from the current study, which was in accordance with a previous study. 21 However, the present study had several limitations. First, this is a retrospective study. Second, HR-MRI images were exported from three different 3.0-T MRI machines, although the inherent parameters were adjusted to ensure consistency. In addition, the voxel size is 0.7 mm, which is oversized for most of the aneurysmal walls. Third, this study is lacking in histologic verification. Fourth, further follow-up studies with larger sample sizes are needed to make more intergroup comparisons. In the future, considering the relatively low sensitivity and specificity of predicting AWE in the current study, more accurate methods, such as 3D space technology, are needed to quantify AWE.
Conclusion
CRstalk-max may be the most reliable parameter of AWE quantification to distinguish symptomatic FIAs, thus, it also has the potential to distinguish unstable FIAs. Predictors of AWE in FIAs may include Dmax, aneurysm symptoms, aspirin use, and posterior circulation aneurysm. Transitional-type FIAs showed higher rates of hypertension and mural thrombus over both dolichoectatic- and fusiform-type FIAs. Moreover, longitudinal follow-up studies based on HR-MRI with larger sample sizes are needed to further understand the physiological mechanisms of FIAs.
Footnotes
Ethics approval and consent to participate
This study was approved by the institutional ethics committee of Beijing Tiantan Hospital (KY 2018-086-03). Written informed consent was provided by each subject.
Consent for publication
Not applicable.
Author contributions
Funding
The authors disclosed receipt of the following financial support for the research, authorship, and/or publication of this article: This work was supported by the Natural Science Foundation of China (grant nos. 81771233 and 82171290), Natural Science Foundation of Beijing, China (grant nos. 7142032 and L192013), Specific Research Projects for Capital Health Development (grant no. 2018-2-2041), Beijing Science and Technology Planning Project (grant no. Z181100009618035), Beijing Municipal Administration of Hospitals’ Ascent Plan (grant no. DFL20190501), Horizontal Project in Beijing Tiantan Hospital [grant no. HX-A-043 (2021)], Research and Promotion Program of Appropriate Techniques for Intervention of Chinese High-risk Stroke People (grant no. GN-2020R0007).
Competing Interests
The authors declared no potential conflicts of interest with respect to the research, authorship, and/or publication of this article.
Availability of data and materials
Not applicable.