
Abstract
Background:
Endovascular treatment for aneurysmal subarachnoid hemorrhage (aSAH) has high fatality and permanent disability rates. It remains unclear how the prognosis is determined by the complex interaction between clinical severity and aneurysm characteristics.
Objective:
This study aimed to design an accurate prognostic prediction model for aSAH patients after endovascular treatment and elucidate the interaction between clinical severity and aneurysm characteristics.
Methods:
We used a clinically homogeneous data set with 1029 aSAH patients who received endovascular treatment to develop prognostic models. Aneurysm characteristics were measured by variables, such as aneurysm size, neck size, and dome-to-neck ratio, while clinical severity on admission was measured by both comorbidities and neurological condition. In total, 18 clinical variables were used for prognostic prediction. Considering the imbalance between the favorable and the poor outcomes in this clinical population, both ensemble learning and deep reinforcement learning approaches were used for prediction.
Results:
The random forest (RF) model was selected as the best approach for the prognostic prediction for all patients and also for patients with good-grade aSAH. Using an independent test data set, the model made accurate predictions (AUC = 0.869 ± 0.036, sensitivity = 0.709 ± 0.087, specificity = 0.805 ± 0.034) with the clinical severity on admission as a leading contributor to the prediction. For patients with good-grade aSAH, the RF model performed the best (AUC = 0.805 ± 0.034, sensitivity = 0.620 ± 0.172, specificity = 0.696 ± 0.043) with aneurysm characteristics as leading contributors. The classic scoring systems failed in this patient group (AUC < 0.600; sensitivity = 0.000, specificity = 1.000).
Conclusion:
The proposed prognostic prediction model outperformed the classic scoring systems for patients with aSAH after endovascular treatment, especially when the classic scoring systems failed to make any informative prediction for patients with good-grade aSAH, who constitute the majority group (79%) of this clinical population.
Keywords
Introduction
Subarachnoid hemorrhage from ruptured intracranial aneurysms, a worldwide health burden, is characterized by its high fatality and permanent disability rates. Approximately one-third of all patients die owing to the severe brain injury with the initial weeks after aneurysmal subarachnoid hemorrhage (aSAH), and a large portion of survivors suffered from long-term disability or cognitive impairment. 1 Prognostic prediction model for patients after aSAH is critical not only to inform outcome expectations but also to identify modifiable contributors to a favorable prognosis. However, it remains unclear how the complex interaction between clinical severity and aneurysm characteristics jointly determines the prognosis after aSAH.
To date, a few clinical scoring systems can be used to inform the prognosis after aSAH, including the subarachnoid hemorrhage international trialists (SAHIT), 2 functional recovery expected after subarachnoid hemorrhage (FRESH), 3 size of the aneurysm, age, Fisher grade, World Federation of Neurosurgical Societies after resuscitation (SAFIRE), 4 and so on. However, these scoring systems were often built from clinically heterogeneous patient groups to maximize the overall sample size. For example, the patients in these studies were often treated with various methods, including surgical clipping, endovascular method, and even conservative treatment.2–4 Among these different treatment approaches, the difference in prognosis had already been reported. A meta-analysis of the data from 11,568 patients showed that the coiling reduced the 1-year poor outcome rate (OR, 1.48) compared with clipping. 5 Given the continuous surgical and material advances in the treatment of aSAH during the last two decades, 6 the training data collected in the early 2000s for these scoring systems might make them less predictive in the latest clinical practice. Recently, the researches on the prognostic prediction models had begun to focus on the homogeneous groups of patients, especially the patients after aSAH treated with the endovascular approach only.7–9 However, the sample sizes were often limited. To build an accurate and reliable prognostic prediction model, both large sample size and independent test data set are needed.
Another important limitation in literature is the lack of a prognostic prediction model for patients with good-grade aSAH on admission. As reviewed by a recent meta-analysis, five aSAH studies with a total of 2862 participants found that 2425 (84.7%) patients had the good-grade aSAH on admission, but among them 19.8% suffered poor outcomes. 5 Therefore, an accurate prognostic model for this patient group could better inform the decision-making before the surgery. For example, when a poor outcome is predicted, alternative methods such as clipping may be considered. Furthermore, the identification of the key factors that contribute to this prognosis may provide novel opportunities toward better outcomes.
To address these limitations, we attempted to establish multivariate models for the prognostic prediction in patients after aSAH treated with the endovascular approach, both in the general patient population and in patients with good-grade aSAH on admission. We reviewed the data from the largest-to-date cohort of 1191 patients after aSAH who were treated with the endovascular approach at a single center between 2012 and 2018. Using the clinical information on admission, we proposed a few multivariate models and compared them with classic scoring systems to improve the prediction accuracy for 1-year prognoses of these patients and validated performances of these models using an independent test data set.
Methods
Patient population
We reviewed patients with acutely ruptured intracranial saccular aneurysms treated with endovascular treatment at the Changhai Hospital, Shanghai, P.R. China, from January 2012 to December 2018. The baseline data were collected on admission, and the outcome data were available at a 1-year clinical follow-up.
The inclusion criteria were as follows: (1) patients with spontaneous subarachnoid hemorrhage, which was confirmed by computed tomography or lumbar puncture, caused by intracranial aneurysms rupture; (2) ruptured intracranial aneurysms treated < 28 days post-aSAH; and (3) aneurysm treated by endovascular approach. The exclusion criteria were as follows: (1) traumatic, fusiform, dissecting, pseudo-, and blood blister-like aneurysms; (2) multiple aneurysms but failed to identify the ruptured one; (3) patients treated by surgical clipping or parent artery occlusion; and (4) incomplete 1-year clinical follow-up data.
Measurements
The models were trained using baseline variables implicated in the literature,2–4,8–13 including the demographic information (age, sex), medical history (hypertension, diabetes, smoking, and coronary heart disease), comorbidities (pneumonia, acute hydrocephalus), initial neurologic condition or clinical severity on admission [Hunt-Hess grade, World Federation of Neurosurgical Societies (WFNS) grade, modified Fisher grade], 14 aneurysm characteristics [aneurysm size, neck size, dome-to-neck ratio, aneurysm location (internal carotid artery, anterior cerebral artery, middle cerebral artery, anterior communicating artery and posterior circulation), parent artery configuration (bifurcation or sidewall), presence of multiple aneurysms, and irregular shape]. These 18 clinical variables were used for the subsequent prognostic prediction.
The clinical outcome (favorable or poor) was defined according to the modified Rankin Scale score (mRS) at the 1-year follow-up as the following: an mRS of 0–2 denoted a favorable outcome, while an mRS of 3–6 indicated a poor outcome.
For data preprocessing, categorical variables were converted into numerical values with one-hot encoding. Each variable was standardized separately for the training data set and the test data set.
The difficulty of the prognostic prediction was visualized by the t-Distributed Stochastic Neighbor Embedding (tSNE), which is a popular method of visualization and unsupervised clustering. The data points, which are close to each other in the high dimension, are also close to each other in the lower dimension (i.e. the embedding space) where a better visualization is feasible. 15 If the clusters are separable, a clear boundary between different clusters is observable in the embedding space; otherwise, the clusters might be overlapping and difficult to classify.
Prognosis prediction models
Cases treated between January 2012 and December 2017 of the data set were used to train the models (i.e. the training data set), and cases treated in the year 2018 were reserved for testing (i.e. the test data set). Note that classic clinical scoring systems often failed to predict prognoses for patients with good-grade aSAH. Therefore, we also investigated patients with good grades of clinical severity on admission, that is, WFNS ⩽ 3 (the training data set: n = 815 and the test data set: n = 127; Figure 1).
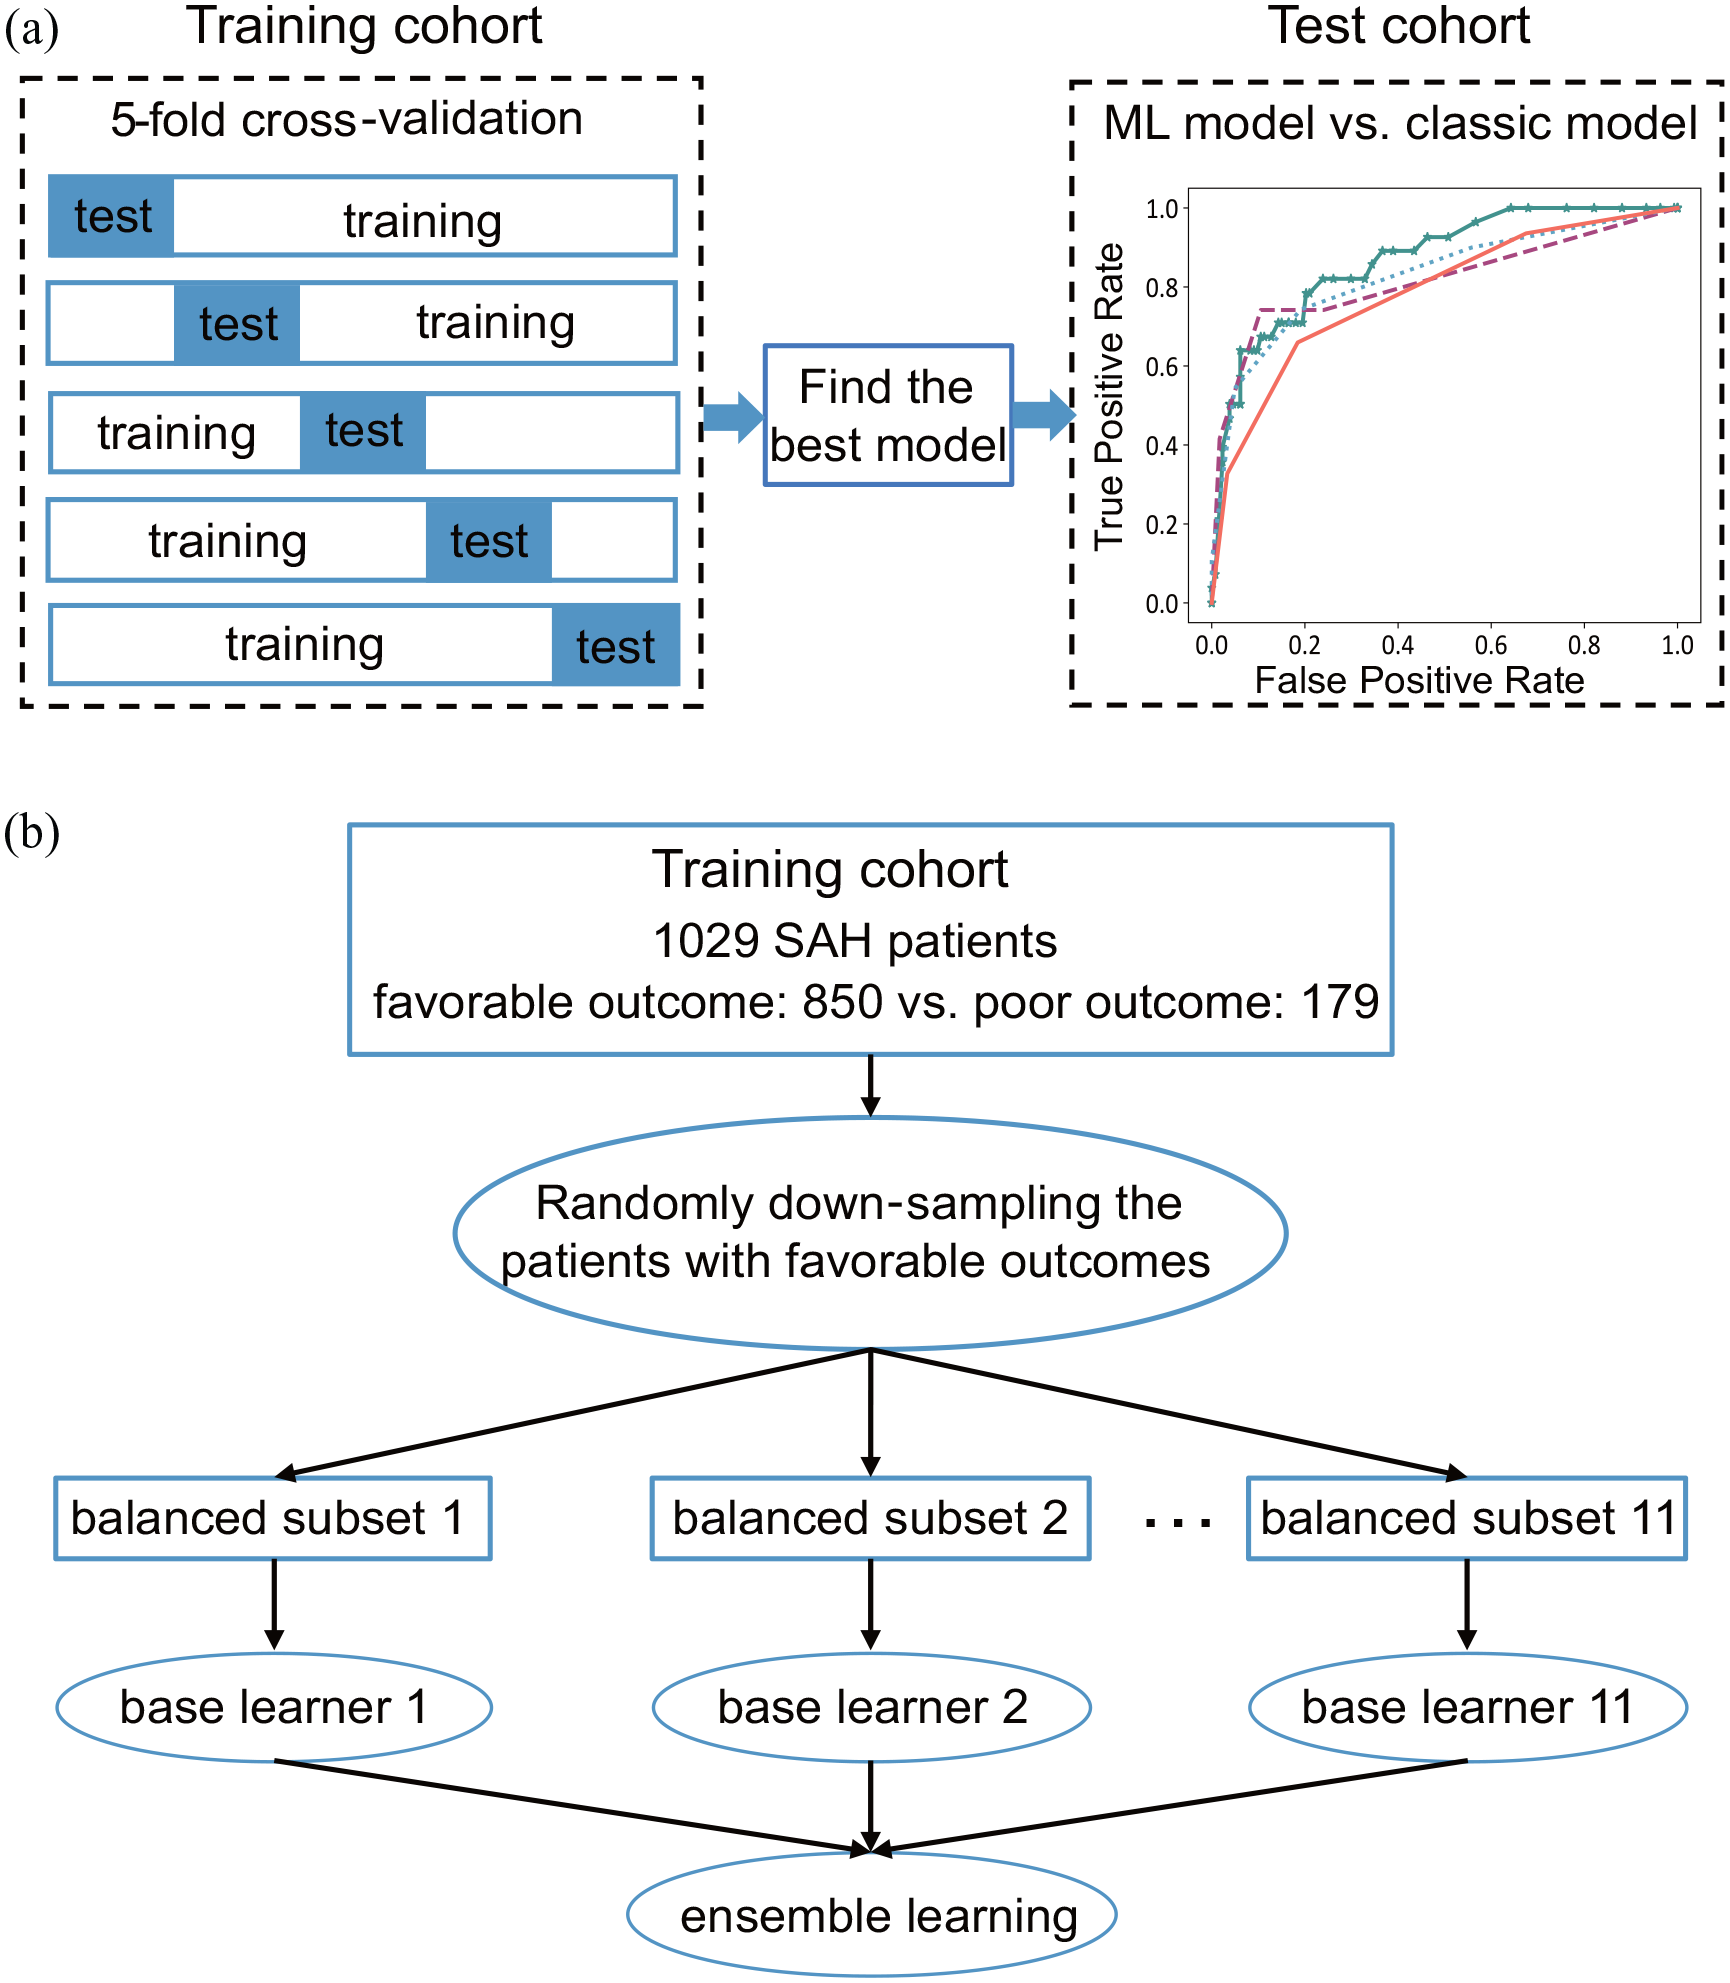
Overview of the study design. (a) Using the training data set, a 5-fold cross-validation was used to select the best model from four machine learning (ML) models [i.e. the linear support vector machine (SVM), the regularized logistic regression (RLR), the random forest (RF), and the meta-sampler (MESA)]. Using an independent test data set, the best-performed ML model was compared with the three classic models: the WFNS grade, the Hunt-Hess grade, and the Modified Fisher grade. (b) The SVM, RF, and RLR adopt the way of bagging ensemble learning, and 11 base learners were used for these three models.
To determine the best prognostic prediction model based on the 18 clinical variables as described above, we compared four machine learning (ML) models, including the regularized logistic regression (RLR), linear support vector machine (SVM), and RF, and a novel deep reinforcement learning algorithm, namely the ensemble imbalance learning framework with meta-sampler (MESA).
The first three algorithms, namely RLR, SVM, and RF, adopted a way of bagging ensemble learning, that is, first constructing multiple identical base learners and then combining them using a majority voting to improve the generalizability of the model. During the training process of these three models, the standard 5-fold cross-validation protocol was used to optimize hyper-parameters of these models with a grid search algorithm. Meanwhile, MESA adaptively resampled the training data set by a reinforcement learning algorithm in iterations to get multiple classifiers and formed a cascade ensemble model. 16 To evaluate the model performance, we repeated a 5-fold cross-validation by 10 times to evaluate the averaged area under the curve (AUC) using the training data set. The model with the greatest averaged AUC was selected to assess contributions of clinically relevant features to distinguishing poor outcomes from favorable ones.
To deal with the imbalanced proportions between favorable and poor outcomes in the clinical sample, we employed two different approaches. For the first three models, we created the balanced training samples by randomly downsampling the patients with favorable outcomes in the training data set. In the MESA, a soft-actor critic algorithm was used to decide the sampling weight for each patient with a favorable outcome. Next, the sampled subset of patients with favorable outcomes was combined with patients having poor outcomes.
In the ensemble learning framework, the number of base learners might influence the predictive performance of the model. We had tried 5, 11, 21, and 31 base learners for the first three models (i.e. RLR, SVM, and RF), and tried 15, 25, 35, and 45 base learners for MESA. However, increasing this number to a larger value brought a greater computational cost but a non-significant increase in performance. We only reported the results with an optimal balance between the predication accuracy and the computational cost. In current analysis, 11 base learners were used for the first three models and 35 base learners were set for MESA.
To test the superiority of the selected model in the prognostic prediction, classic models were built using the Hunt-Hess, modified Fisher, and WFNS grades, respectively. Among these models, the sensitivity, specificity, and AUC were calculated and compared using the independent test data set. The 95% confidence interval (CI) of the difference in AUC between each pair of models was established by 1000 bootstraps of the test data set. When this 95% CI did not include zero, the difference was considered as statistically significant.
To assess the prognostic powers of three groups of features, including the age, the classic clinical severity scores (i.e. the WFNS, Hunt-Hess, and modified Fisher grades), and the aneurysm characteristics (i.e. aneurysm size, neck size, and dome-to-neck ratio), we compared the performances of the prognostic models with and without using each group of these features. The 95% CIs of the difference in AUC among these models were established by 1000 bootstraps of the independent test data set.
These procedures were implemented using the scikit-learn package (version 0.22.2. post1) and PyTorch (version 1.0.0) in Python (version 3.8.3). The source codes were provided on https://github.com/hanluyt/SAH_scoring.
Statistical analysis
Categorical and continuous variables were presented as frequency and mean ± standard deviation (x ± s), respectively. Pearson’s chi-squared test, Fisher’s exact test, independent samples t-test, or nonparametric test was used as appropriate to compare the favorable-outcome group with the poor-outcome group in the training data set. A p-value less than 0.05 was considered statistically significant. These analyses were performed using IBM SPSS version 25.0 software (IBM, Armonk, New York).
Results
Clinical characteristics
A total of 1191 patients with acutely ruptured intracranial aneurysms were included, among whom 753 were female and 207 had poor clinical outcomes (more clinical characteristics were listed in Table 1 and Table S4). The training data set included 1029 cases (treated between January 2012 and December 2017, 17.4% patients with poor clinical outcomes), while the test data set had 162 cases (treated in the year 2018, 17.3% patients with poor clinical outcomes). We found that the poor clinical outcome was associated with an older age, severe clinical conditions on admission (e.g. with concurrent pneumonia/hydrocephalus, higher WFNS/Hunt-Hess/modified Fisher grade), and aneurysm characteristics (e.g. a larger aneurysm size and a wider neck size; Table S1).
Clinical and aneurysm characteristics.

mm, millimeter; mRS, modified Rankin Scale score; WFNS, World Federation of Neurosurgical Societies.
Unless indicated otherwise, data are presented as the number of patients (%).
Prognostic prediction model for patients after aSAH
After visualizing the data by tSNE, we found no simple boundary between patients with favorable and poor outcomes in the embedding space (Figure S1), which suggested that the clustering problem (i.e. the prognostic prediction) was not trivial. Among the ML methods compared, the RF model achieved the highest AUC for the prognostic prediction in the training data set (0.982 ± 0.011; Table 2). Comparing with the classic models, the RF model performed better in the test data set achieving an AUC of 0.869 ± 0.036 [95% CI of the differences in AUC: RF versus WFNS grade (0.016, 0.134) and RF versus modified Fisher grade (0.041, 0.171); Table S2, Figure 2(a) and (c)]. Compared with the Hunt-Hess grade (sensitivity: 0.498 ± 0.093; specificity: 0.805 ± 0.034), the RF model achieved a better sensitivity/specificity balance (sensitivity: 0.709 ± 0.087; specificity: 0.955 ± 0.018).

Comparison of model performances using the test data set. The receiver operating characteristic (ROC) curves were compared among these models using the independent test data set. (a) The mean ROC curve of each model trained using all patients. (b) The mean ROC curve of each model trained using the patients with good grade of clinical severity. (c) The standard deviation of the ROC curve for each model trained using all patients. (d) The standard deviation of the ROC curve for each model trained using the patients with good grade of clinical severity.
Comparison of model performances using the training data set.

aSAH, aneurysmal subarachnoid hemorrhage; AUC, the area under the curve; MESA, meta-sampler; RF, random forest; RLR, regularized logistic regression; SVM, support vector machine.
The mean and the standard deviation established by 1000 bootstraps were reported before and after the ‘±’, respectively.
Prognostic prediction model for patients with the good-grade aSAH
For patients with good-grade aSAH, the classic scoring systems failed to make any informative prediction as their sensitivities in the test data set were all zeros (Table S3). Compared with the classic models, the RF model performed significantly better in patients with good-grade aSAH in the test data set. The AUC of the RF model was 0.750 ± 0.064 with a balanced sensitivity of 0.620 ± 0.172 and specificity of 0.696 ± 0.043. Meanwhile, the AUCs of the WFNS, Hunt-Hess, and modified Fisher grades were lower than 0.60 with an unbalanced sensitivity of 0.000 ± 0.000 and specificity of 1.000 ± 0.000 [Table S3; Figure 2(b) and (d)]. The significance of this performance superiority was confirmed by the 95% CIs of the difference in AUC between the RF model and the classic models using the independent test data set [i.e. RF versus WFNS grade (0.196, 0.449), RF versus Hunt-Hess grade (0.030, 0.360), RF versus modified Fisher grade (0.076, 0.286)].
Contributions of the baseline factors to the prognostic prediction
The contribution of each variable in the RF model was assessed by the information gain [which was estimated by the decrease in impurity; 17 Figure 3(a)]. Apart from age (ranked third among 22 input variables), the grades of clinical severity on admission contributed the most to the prognostic prediction, as the Hunt-Hess grade, the WFNS grade, and the modified Fisher grade ranked first, second, and fourth, respectively. The aneurysm characteristics contributed the second-most to this prediction (the aneurysm size, neck size, and dome-to-neck ratio ranked from fifth to seventh).

Rankings of feature contributions to the prognostic prediction. (a) The contributions to the RF model trained using all patients with aSAH. (b) The contributions to the RF model trained using the patients with good grade of clinical severity.
Among patients with good-grade aSAH [Figure 3(b)], apart from age, the aneurysm characteristics (i.e. the aneurysm size, neck size, and dome-to-neck ratio) ranked the first and were followed by the clinical severity on admission (i.e. the modified Fisher grade, Hunt-Hess grade, and WFNS grade).
Sensitivity analysis
Using the independent test data set, the prognostic power of these aneurysm characteristics (i.e. the aneurysm size, neck size, and dome-to-neck ratio) was further confirmed by the 95% CI of the difference in AUC between the RF models with and without using these aneurysm characteristics [0.047, 95%CI: (0.005, 0.087) for all patients, 0.118, 95%CI: (0.003, 0.255) for patients with good-grade aSAH; Table 3]. Similarly, we also found significant prognostic power of the age (Table 3). However, leaving out the classic clinical severity scores (i.e. the WFNS, Hunt-Hess, and modified Fisher grades) significantly changed the AUC of the model for all patients only (Table 3). In addition, we also tested the relative contribution of a post-surgery condition, namely the delayed cerebral ischemia (Table S4), to the outcome and found that including this condition could not significantly increase the AUC of the RF models for both all patients and patients with good-grade aSAH (Table 3).
Comparison of performances between the RF models with and without including one group of features.

aSAH, aneurysmal subarachnoid hemorrhage; AUC, the area under the curve; CI, confidence interval; RF, random forest.
The mean and the standard deviation established by 1000 bootstraps using the test data set were reported before and after the ‘±’, respectively. Δ AUC 95%CI stands for the 95% confidence interval of the difference in AUC between the RF model with all the 18 clinical variables and the RF model without a group of features or with an additional group of features.
Discussion
Different from previous prognostic models for patients after aSAH with small sample sizes,18–21 our study used a clinically homogeneous group of patients with a large sample size. For example, Hostettler et al. 22 used a decision tree to predict the long-term outcome for the patients after aSAH (n = 329) using both clinical information and laboratory measurements. Their results indicated that the procalcitonin on day 1 and the WFNS grade were the strongest predictors for outcomes, and the accuracy of prediction for poor outcomes was 75.4% in a testing data set (n = 219). Similarly, Liu et al. 23 trained a decision tree to predict the clinical outcomes of the patients after a high-grade aSAH using the modified Fisher grade, Glasgow Coma Scale, pupillary reactivity, and age (n = 212). Their model yielded an AUC of prediction as 0.88 in a smaller test data set (n = 54). However, the training samples were clinically heterogeneous in these previous studies, as both patients who received the endovascular treatment and the surgical clipping were included.22,23 In the current study, we analyzed a homogeneous patient group with a large sample size, and all of them were treated with endovascular approach (i.e. n = 1029 in the training data set and n = 162 in the test data set). Another notable feature of our sample was that it resembled the imbalance between the favorable and the poor outcomes in the clinical practice (i.e. only 17% of patients had the poor outcomes in our sample). We met this challenge of imbalanced learning using several advanced methods, such as ensemble learning, deep reinforcement learning, and so on. The application of and comparison among these advanced methods enabled our final model to achieve an AUC as high as 0.871 in the independent test data set.
Notably, our model is applicable to patients with good-grade aSAH, where the classic scoring systems failed. This is clinically important because patients with good-grade aSAH on admission are a majority group in this clinical population. As reported in the literature, 84.7% of the patients had good-grade aSAH on admission, but among them 19.8% suffered poor outcomes. 5 Consistent to this clinical observation, 79% patients had good-grade aSAH in our sample, and 13% of them had poor outcomes. However, the classic scoring systems failed to predict prognoses for these patients (specificity = 1.000 and sensitivity = 0.000). In literatures, prognostic analyses in good-grade aSAH patients had identified some risk factors for poor outcomes, but the small sample sizes of these studies could not support them to establish any accurate prognostic prediction model.24–26 Using a clinical cohort with a large sample size, our model made accurate predictions with a good sensitivity/specificity balance (specificity = 0.697 and sensitivity = 0.625). The prediction made by our model may prevent physicians from overlooking this clinical population at the risk of developing poor outcomes. For this clinical population at risk, an alternative treatment (e.g. clipping), or more cautious about the procedure, and the perioperative management may lead to better outcomes.
Interestingly, our models highlighted that aneurysm characteristics were the most predictive factors of prognoses of patients with good-grade aSAH. Clinical severity features contributed significantly to the prognostic prediction model proposed in the current study had also been implicated in the previous studies for the prognostic prediction, such as hypertension and diabetes,9,27 the initial neurological condition, such as the WFNS grade,2,7 the Hunt-Hess,12,28 and the modified Fisher grading scales.4,8 However, this information was less predictive in patients with good-grade aSAH. Indeed, we found that the classic scoring systems, which were mainly based on the clinical severity on admission, failed to make any informative prediction for these patients. Compared with the clinical severity on admission, we found that aneurysm characteristics (as measured by the aneurysm size, neck size, and dome-to-neck ratio) contributed more to the prognostic prediction. Therefore, our findings highlighted the importance of carefully considering aneurysm characteristics in securing more favorable outcomes in patients with good-grade aSAH.
This study had some limitations. First, future multicenter studies are needed to test the generalizability of the proposed model. Second, future studies with biomarkers from the blood or CSF7,22,29 can be more informative for the underlying neurobiological process after aSAH.
Conclusion
In this study, we developed a prognostic prediction model for the patients with aSAH treated with endovascular approach using a clinically homogeneous data set with a largest-to-date sample size. The prediction model performed better compared with the classic clinical scale-based predictions as demonstrated using an independent test data set, especially when the classic scoring systems failed to make any informative prediction for patients with good-grade aSAH.
Supplemental Material
sj-pdf-1-tan-10.1177_17562864221099473 – Supplemental material for An accurate prognostic prediction for aneurysmal subarachnoid hemorrhage dedicated to patients after endovascular treatment
Supplemental material, sj-pdf-1-tan-10.1177_17562864221099473 for An accurate prognostic prediction for aneurysmal subarachnoid hemorrhage dedicated to patients after endovascular treatment by Han Lu, Gaici Xue, Sisi Li, Yangjiayi Mu, Yi Xu, Bo Hong, Qinghai Huang, Qiang Li, Pengfei Yang, Rui Zhao, Yibin Fang, Qiang Luo, Yu Zhou and Jianmin Liu in Therapeutic Advances in Neurological Disorders
Footnotes
Ethics Statement
The study protocol was approved by the Shanghai Changhai Hospital Ethics Committee (Registration no. CHEC2017-074). Because of the retrospective nature of the analysis with pseudonymised patient data, separate informed consent was waived by the committee. This corresponds to the local legislation.
Author contribution(s)
Funding
The authors disclosed receipt of the following financial support for the research, authorship, and/or publication of this article: This study was partially supported by grants from the National Key Research and Development Program of China (No. 2019YFA0709502), the National Natural Science Foundation of China (No. 81873909 and 81930095), the Science and Technology Commission of Shanghai Municipality (No. 20ZR1404900 and 20DZ2260300), the Shanghai Municipal Science and Technology Major Project (No.s 2018SHZDZX01 and 2021SHZDZX0103), the Fundamental Research Funds for the Central Universities, the SanHang Program of the Naval Medical University, and the ‘Climbing’ program of Changhai hospital, the National Research and Development Project of Key Chronic Diseases.
Conflict of interest statement
The authors declared the following potential conflicts of interest with respect to the research, authorship, and/or publication of this article: J.L, Y.Z, Q.L., P.Y., G.X., and H.L. are listed as inventors on submitted patents on prognostic prediction model using machine learning. The other authors declare no conflict of interest.
Data availability statement
Supplemental material
Supplemental material for this article is available online.
References
Supplementary Material
Please find the following supplemental material available below.
For Open Access articles published under a Creative Commons License, all supplemental material carries the same license as the article it is associated with.
For non-Open Access articles published, all supplemental material carries a non-exclusive license, and permission requests for re-use of supplemental material or any part of supplemental material shall be sent directly to the copyright owner as specified in the copyright notice associated with the article.