
Abstract
Background:
Different from diabetic hyperglycemia, stress-induced hyperglycemia (SIH) can better reflect elevated blood glucose owing to intracerebral hemorrhage (ICH). However, studies about the outcome of ICH patients with SIH are still very limited.
Aims:
This study aimed to investigate whether SIH measured by stress-induced hyperglycemia ratio (SHR) was associated with hematoma expansion and poor outcomes in patients with ICH.
Methods:
A consecutive series of patients with spontaneous ICH from two clinical centers admitted within 24 h after symptom onset were enrolled for prospective analysis. SHR was defined as admission fasting blood glucose divided by estimated average glucose [1.59 × Hemoglobin A1c (%) − 2.59]. This study investigated the association between SHR and hematoma expansion, and short-term and long-term poor outcomes using univariate and multivariate logistic regression analyses.
Results:
A total of 313 ICH patients were enrolled in the study. SHR was markedly higher in patients with hematoma expansion and poor outcomes (p < 0.001). The multivariate logistic regression analysis demonstrated SHR independently associated with hematoma expansion (p < 0.001) and poor outcomes, including secondary neurological deterioration within 48 h, 30-day mortality, and 3-month poor modified Rankin Scale (mRS 4–6) (p < 0.001), while the blood glucose only predicted 30-day mortality. Meanwhile, the diagnostic accuracy of SHR exhibited by area under the curve in receiver operating characteristic analysis was statistically equal to or higher than the well-known predictors.
Conclusion:
SHR is a reliable predictor for early hematoma expansion and poor outcomes in patients with ICH.
Keywords
Introduction
Intracerebral hemorrhage (ICH) is the second most common stroke subtype which contributes the highest morbidity and mortality.1,2 However, despite the unremitting efforts, there remain few effective managements of ICH comparing with ischemic stroke. 3 Hematoma expansion is known to occur in about 30% of patients and associated with case fatality and poor functional outcome after ICH. 4 Prevention of hematoma expansion is an intriguing therapeutic strategy, while great difficulties exist due to the multiple impact factors. Therefore, it may develop clinical benefits providing that attenuating hematoma expansion from the essential mechanisms.
It is well established that diabetes mellitus is an independent risk factor for ischemic or hemorrhagic stroke. Meanwhile, it has been reported that hyperglycemia after ICH has strong associations with hematoma expansion and poor functional recovery and high mortality.5–7 Our recent study establishes an optimized hematoma expansion model induced by hypertension and hyperglycemia, which undergoes stress vessel rupture caused by immediate hyperglycemia. 8 Interestingly, according to the current reports, hematoma expansion has been hardly observed in a single diabetic model. Similarly, it is demonstrated that elevated admission blood glucose confers a higher risk of poor outcome in non-diabetics rather than diabetic patients. 6 Therefore, the prognosis of ICH seems to be more associated with post-hemorrhagic hyperglycemia than single background hyperglycemia. Hemoglobin A1c (HbA1c) represents long-term (2–3 months) blood glucose level and has been revealed to have a higher risk of death and poor functional outcome in ICH patients without a diabetic history. 9 However, neither admission glucose nor HbA1c reflects stress-induced hyperglycemia (SIH) after ICH and few studies have investigated SIH in ICH patients.
Stress-induced hyperglycemia ratio (SHR) has been introduced to quantify SIH, which is defined as the admission glucose adjusted for the estimated average glucose using HbA1c. 10 The aim of the current study was to investigate whether SHR was associated with hematoma expansion and poor outcomes in patients with ICH.
Methods
Study population
A consecutive series of patients with spontaneous ICH aged 18 years or above admitted to a stroke unit within 24 h after symptom onset were enrolled for prospective analysis. These patients were from two centers of Fudan University: Huashan Hospital and North Huashan Hospital between 1 January 2015 and 31 December 2020. The enrolled patients all underwent admission blood glucose and HbA1c tests along with both baseline and follow-up noncontrast CT (NCCT) scan. The exclusion criteria included (1) secondary ICH (cerebral aneurysm, Moyamoya syndrome, arteriovenous malformation, tumor, trauma or hemorrhagic transformation from brain infarction), (2) primary intraventricular hemorrhage (IVH), (3) historical modified Rankin Scale (mRS) score > 1, and (4) refused to be enrolled. All patients or their next of kin gave their informed consent prior to inclusion in this study. This study was approved by and studied in accordance with the ethical standards of the Fudan University Ethics Committee (Approval No. 20150572A259).
Imaging analysis
NCCT examinations were performed using a multidetector computed tomography (CT) scanner with contiguous axial 5-mm section thickness (Brilliance iCT; Philips Medical Systems, Cleveland, OH, USA). The hematoma volume was measured by 3D Slicer software after three-dimensionally reconstructed. This is a free open-source software platform for biomedical research (http://www.slicer.org). The hematomas in CT images with the Digital Imaging and Communications in Medicine (DICOM) format were automatically identified pixel by pixel in each slice after setting the threshold range at 50–100 HU. A 3D model was constructed and then the hematoma volume was calculated by the accumulating volume of the pixels.11,12 ABC/2 method is a simple method for calculating ICH volume and widely used. 13 To investigate whether our results were also applicable in more medical institutions especially those without 3D volumetric reconstruction, we also performed a sensitivity analysis using ABC/2 method to measure the hematoma volume. Hematoma expansion was defined as an absolute growth greater than 6 ml or a relative growth of more than 33% in the follow-up NCCT scan compared with the baseline NCCT scan. 14
Clinical data and outcome assessment
The essential clinical data included sex, age, history of hypertension, diabetes mellitus, smoking, alcohol consumption, antiplatelet, and anticoagulation therapy. We also recorded the clinical and radiographic status on admission, such as systolic and diastolic blood pressure, Glasgow coma scale (GCS) scores, the time of initial CT, location of the hematoma, presence of IVH, and hematoma volume. Meanwhile, laboratory testing, including prothrombin time (PT), activated partial thromboplastin time (APTT), international normalized ratio (INR), platelet count, blood glucose levels (fasting plasma glucose), and HbA1c on admission, was also recorded. SHR was calculated using the following formula: SHR = admission fasting blood glucose/ [1.59 × HbA1c (%) − 2.59]. 10
Short-term and long-term functional outcomes were assessed. Secondary neurological deterioration was defined as (1) early hemicraniectomy under standardized criteria or (2) secondary decrease in GCS of > 3 points, both within the first 48 h after symptom onset. 15 The mortality at 30 days was also recorded. Moreover, mRS at 3 months after ICH onset was used for assessing long-term functional outcome. It was performed through in-person interviews by trained senior physicians or a phone call by trained study staffs. Poor outcome was defined as mRS > 3 and good outcome was defined as mRS ⩽ 3 as reported by previous studies.13,16
Statistical analysis
Statistical analyses were performed with SPSS 22.0. Data for categorical variables were presented as a percentage and compared using chi-square test or Fisher’s exact test (two-tailed). Data for continuous variables were expressed as means [standard deviations (SDs)] or medians [interquartile ranges (IQRs)] when appropriate and analyzed using two-tailed Student’s t-test, one-way analysis of variance, Mann–Whitney U test, or Kruskal–Wallis H test depending on the data distribution and the number of variables. A p-value less than 0.05 was considered statistically significant. We used univariate analysis for comparing the variables to discover the possible significant predictors for hematoma expansion and poor outcomes. When significance appeared, multivariate logistic regression analysis was performed to investigate the independent predictors for hematoma expansion and poor functional outcomes. Variables known to be associated with hematoma expansion and poor outcomes based on multiple external datasets were also included in the multivariate model. Receiver operating characteristic (ROC) curves were configured to calculate predictive values of variables for diagnosing hematoma expansion and poor outcomes. The critical values of SHR for predicting hematoma expansion, secondary neurological deterioration within 48 h, 30-day mortality, and 3-month poor outcome were also determined by ROC analysis, and correspondingly, the sensitivity, specificity, positive predictive value (PPV), negative predictive value (NPV), and accuracy were calculated. Diagnostic accuracies evaluated by area under the curve (AUC) were compared using the DeLong test package in MedCalc. All analyses were conducted by statisticians blinded to the groups.
Results
Baseline characteristics
There were 313 ICH patients (227 males and 86 females) with the average age of (62.7 ± 13.3) years meeting inclusion criteria for analysis (Figure 1). The baseline GCS score was 15 (IQR: 13–15). The median of time to the baseline NCCT scan was 217.0 (IQR: 124.0–388.5) min from ICH onset with the baseline hematoma volume of 12.7 (IQR: 5.6–25.7) ml. The location of the baseline hematoma contained deep (71.6%), lobar (21.1%), and infratentorial (7.3%), and IVH was found in 25.9% of the patients. The admission fasting plasma glucose and HbA1c (%) were 6.4 (IQR: 5.4–8.2) mmol/l and 5.7 (IQR: 5.5–6.3) [%], respectively, and then the median SHR was calculated as 0.98 (IQR: 0.85–1.13) (Table 1). The baseline characteristics of the included and excluded patients in Table 1 were well balanced (p > 0.05). Hematoma expansion was observed in 74 patients (23.6%). Short-term and long-term poor outcomes were evaluated as follows: secondary neurological deterioration within 48 h (63 patients, 20.1%), 30-day mortality (19 patients, 6.1%), 3-month poor mRS (4–6) (142 patients, 45.4%).

Flowchart of study patients.
The baseline characteristics of the included and excluded patients.

APTT, activated partial thromboplastin time; DBP, diastolic blood pressure; GCS, Glasgow coma scale; HbA1c, Hemoglobin A1c; INR, international normalized ratio; IQR, interquartile range; IVH, intraventricular hemorrhage; NCCT, noncontrast computed tomography; PT, prothrombin time; SBP, systolic blood pressure; SD, standard deviation; SHR, stress-induced hyperglycemia ratio.
We arranged the SHR values from small to large and averagely divided the values into first to fourth quartile. Then, the patients were further divided evenly into four quartiles according to the quartiles of SHR, and their baseline characteristics were compared according to the quartile groups (Q1–Q4). Patients with a higher SHR were more likely to have history of diabetes mellitus, lower GCS scores, lobar hematoma, IVH, larger hematoma volume, and higher levels of PT, INR, and blood glucose (p < 0.05). In addition, more patients with higher SHR underwent hematoma expansion, secondary neurological deterioration within 48 h, 30-day mortality, and 3-month poor outcome (p < 0.05) (Table 2).
Comparison of the clinical, radiological, and laboratory testing characteristics between patients with different values of SHR.
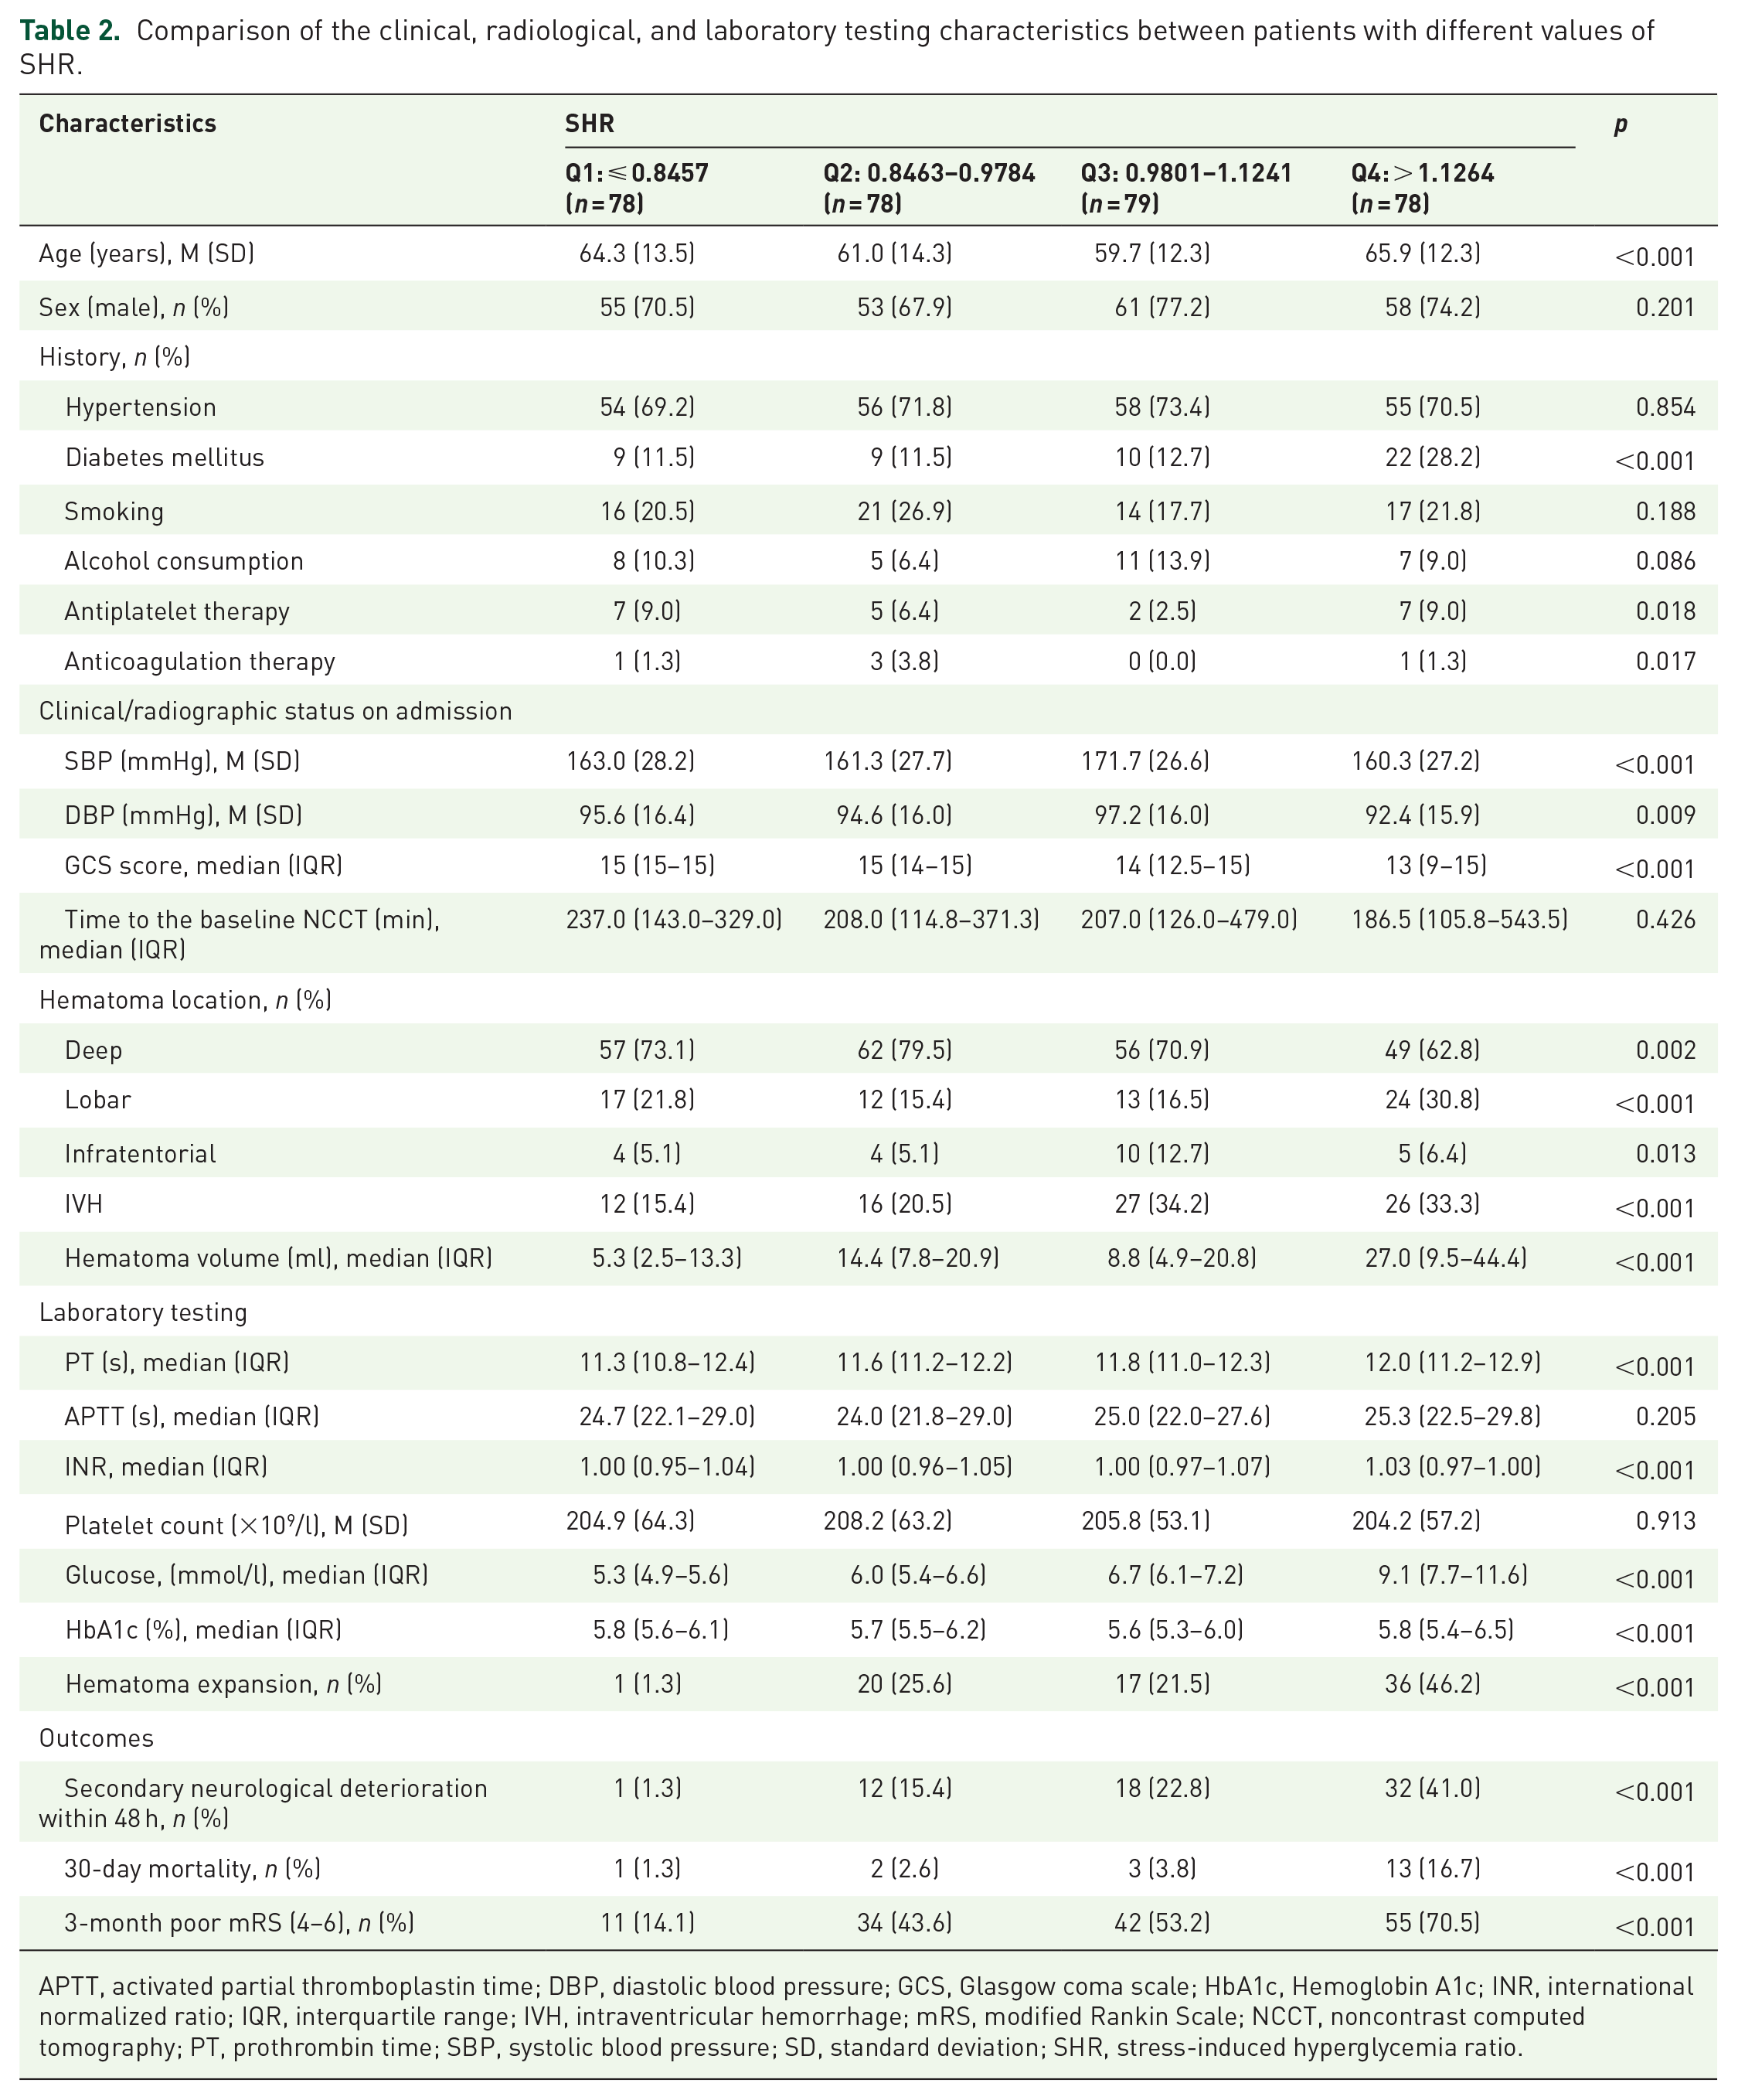
APTT, activated partial thromboplastin time; DBP, diastolic blood pressure; GCS, Glasgow coma scale; HbA1c, Hemoglobin A1c; INR, international normalized ratio; IQR, interquartile range; IVH, intraventricular hemorrhage; mRS, modified Rankin Scale; NCCT, noncontrast computed tomography; PT, prothrombin time; SBP, systolic blood pressure; SD, standard deviation; SHR, stress-induced hyperglycemia ratio.
Association between SHR and hematoma expansion
The incident of hematoma expansion was markedly increased accompanying with the increasing of SHR (Table 2). SHR value in patients with hematoma expansion was much higher than patients without hematoma expansion (1.124, IQR: 0.963–1.366 vs 0.942, IQR: 0.828–1.067) [Figure 2(a)]. Univariate analysis revealed significant differences in the history of diabetes mellitus (p < 0.027), baseline GCS scores (p < 0.001), time to the baseline NCCT (p = 0.001), baseline hematoma volume (p = 0.001), levels of PT (p = 0.014), blood glucose (p < 0.001), and SHR (p < 0.001) for hematoma expansion prediction (Table 3). Subsequently, the multivariate logistic regression analysis showed that SHR [odds ratio (OR): 16.535, 95% confidence interval (CI): 3.572–76.543, p < 0.001] was independently associated with hematoma expansion. Other predictors included time to the baseline NCCT (p = 0.003), hematoma volume (p = 0.005), and PT level (p = 0.028) (Table 3). In ROC analysis, the AUC of SHR was 0.759 with 95% CI 0.694–0.825 (p < 0.001), indicating SHR was appropriate for diagnosing hematoma expansion. The accuracy was statistically equal to the common predictors, such as hematoma volume (p = 0.761) and time to the baseline NCCT (p = 0.102) and higher than PT level (p = 0.048) [Figure 3(a)]. The cut-off point for predicting hematoma expansion was 0.905 with the sensitivity, specificity, PPV, NPV, and accuracy of 90.5%, 44.8%, 33.7%, 93.9%, and 55.6%, respectively (Table 5). The hematoma volume measured by ABC/2 method was 11.5 (IQR: 5.1–24.1) ml, which had no statistical difference with 3D volumetric reconstruction (p = 0.604). Comparing with 3D volumetric reconstruction, the AUC of ABC/2 method to reveal hematoma expansion in ROC analysis was 0.938. SHR could also predict hematoma expansion calculated by ABC/2 method with the AUC of 0.711 (95% CI: 0.644–0.777, p < 0.001) (see Supplemental Material).

(a–d) Differences of SHR between ICH patients with and without (a) hematoma expansion, (b) secondary neurological deterioration within 48 h, (c) 30-day mortality, and (d) 3-month poor mRS. (e) The SHR values in each mRS score (from 0 to 6).
Univariate and multivariate analysis of the potential predictors for hematoma expansion.
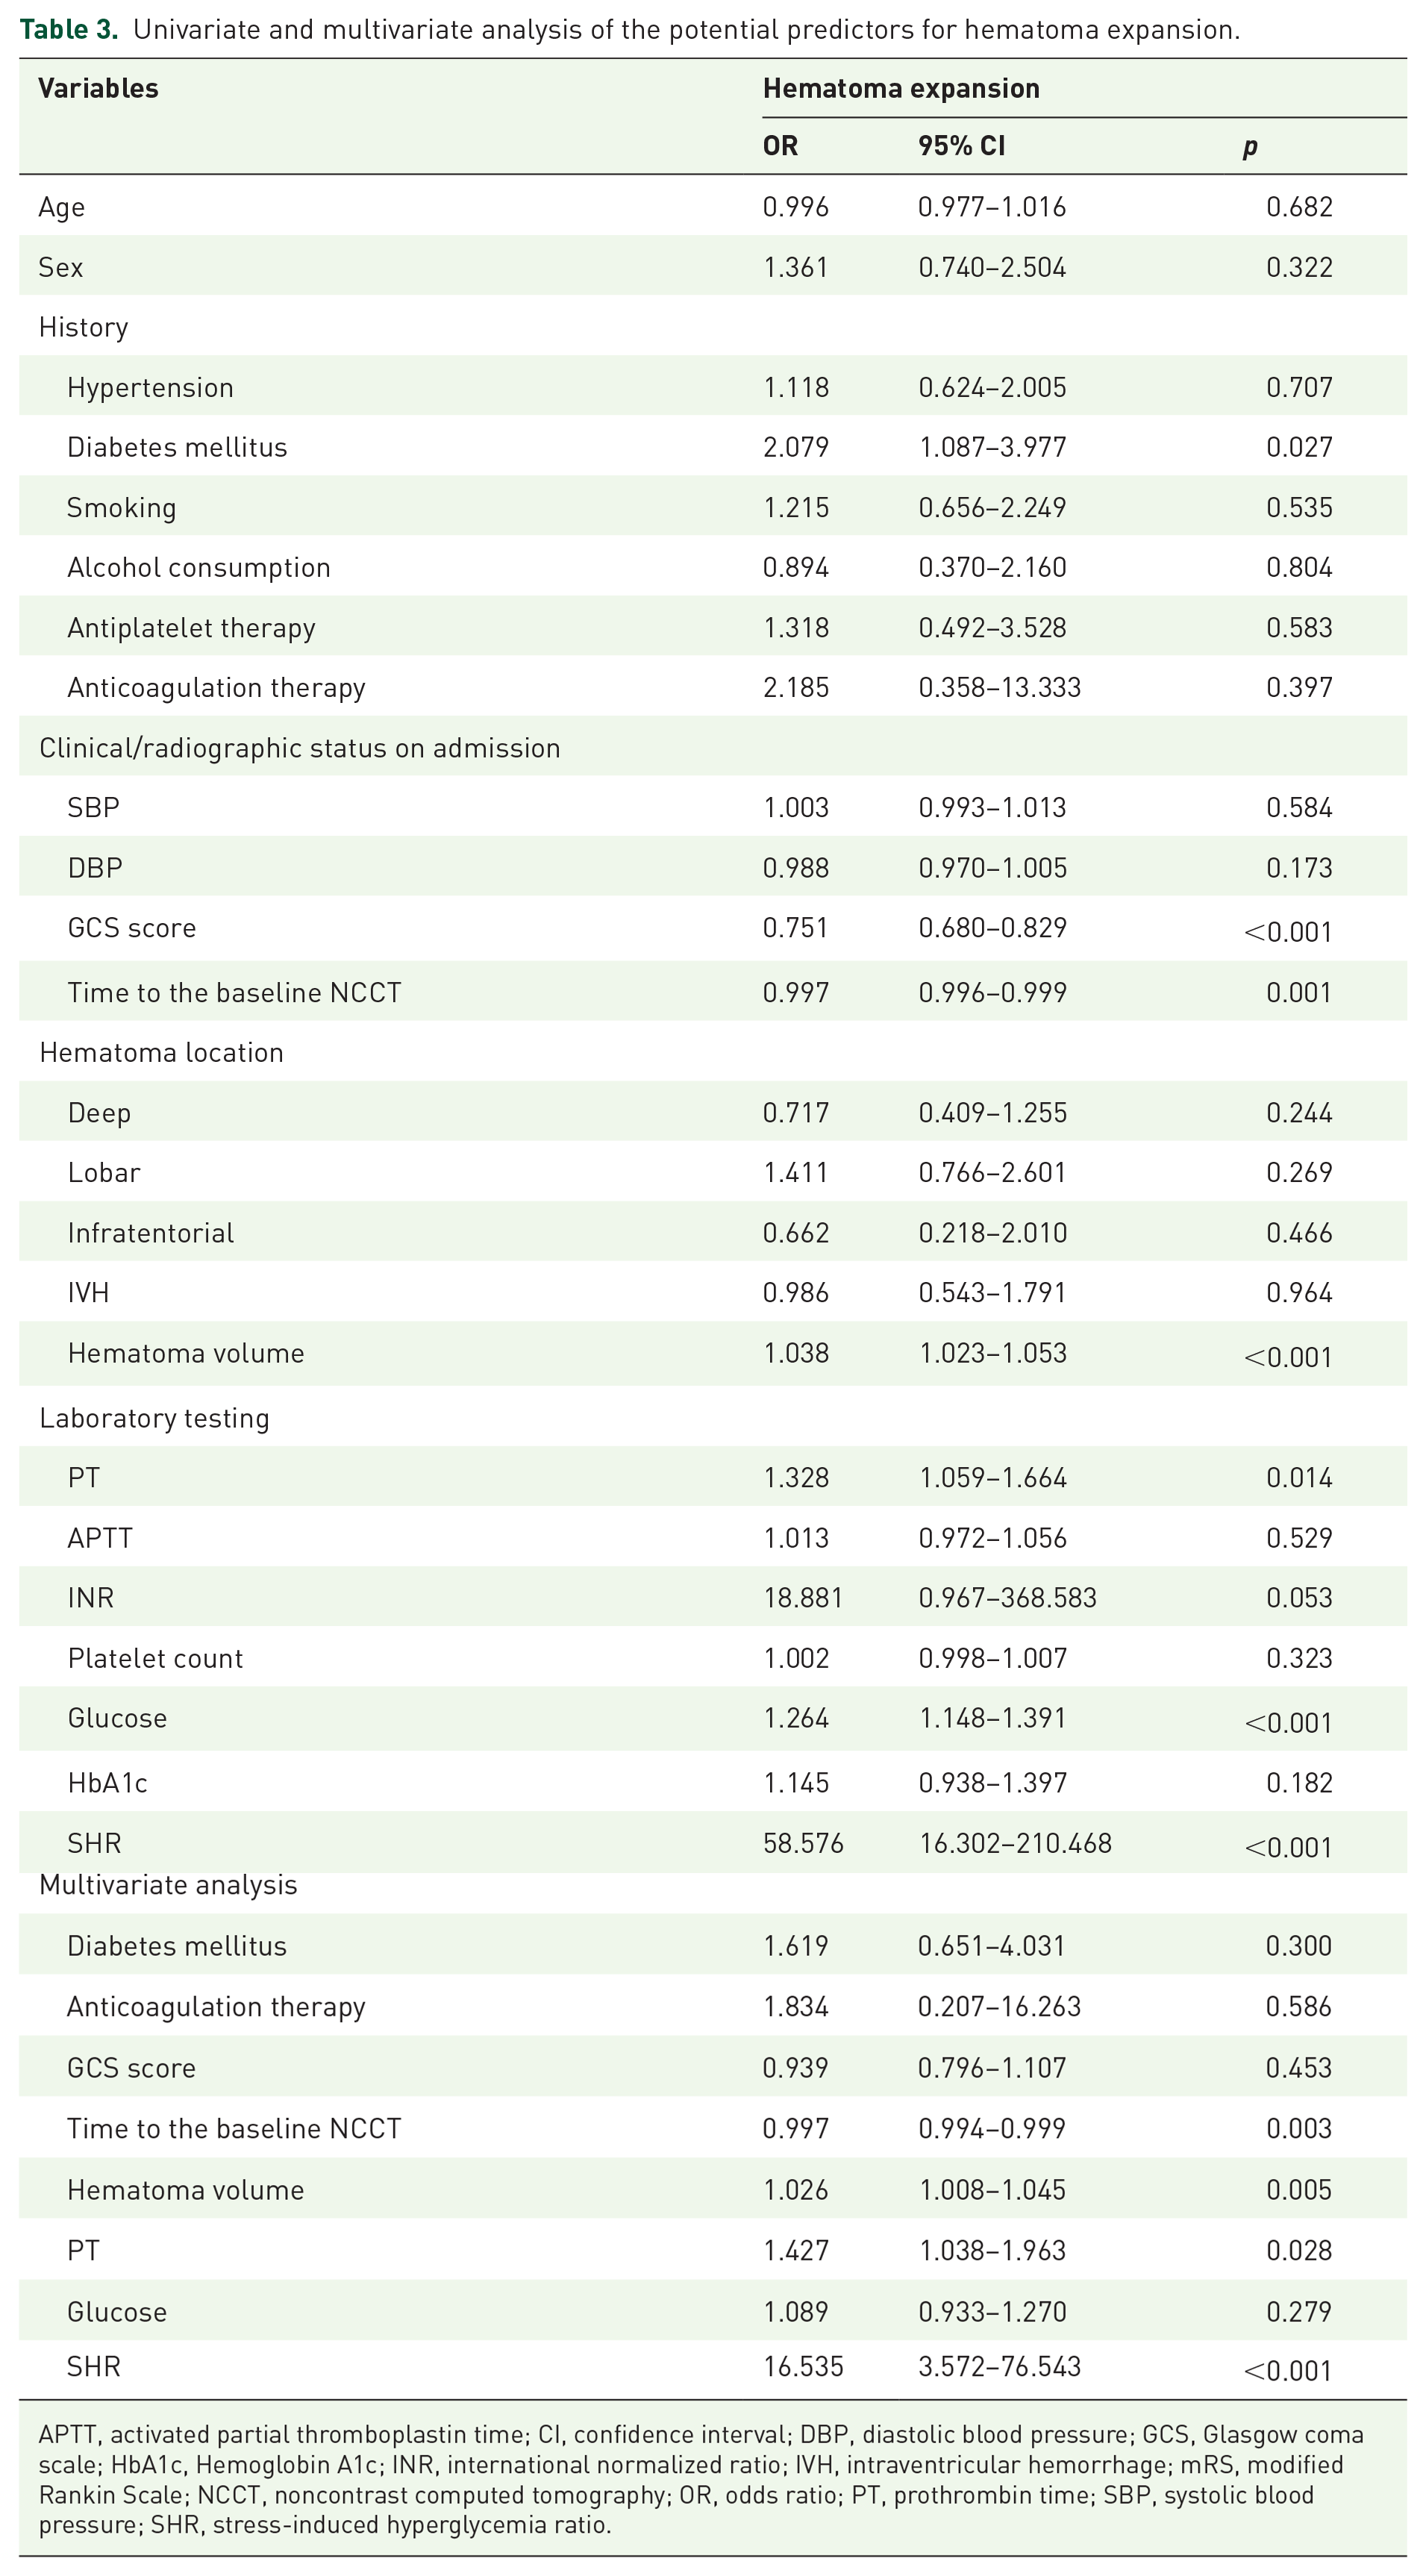
APTT, activated partial thromboplastin time; CI, confidence interval; DBP, diastolic blood pressure; GCS, Glasgow coma scale; HbA1c, Hemoglobin A1c; INR, international normalized ratio; IVH, intraventricular hemorrhage; mRS, modified Rankin Scale; NCCT, noncontrast computed tomography; OR, odds ratio; PT, prothrombin time; SBP, systolic blood pressure; SHR, stress-induced hyperglycemia ratio.

ROC curves of SHR for predicting hematoma expansion and poor outcomes. (a) Hematoma expansion—SHR versus hematoma volume, p = 0.761; SHR versus PT, p = 0.048; SHR versus time to the baseline NCCT, p = 0.102. (b) Secondary neurological deterioration within 48 h—SHR versus hematoma volume, p = 0.142; SHR versus PT, p = 0.017; SHR versus GCS, p = 0.250. (c) 30-day mortality—SHR versus hematoma volume, p = 0.866; SHR versus blood glucose, p = 0.563. (d) 3-month poor mRS—SHR versus hematoma volume, p = 0.158; SHR versus IVH, p = 0.002; SHR versus GCS, p = 0.465.
SHR as a predictor for poor outcomes
As to assessing functional outcomes, both short-term and long-term poor outcomes were included. Expectably, the results were consistent with each other. ICH patients with poor outcomes had much higher SHR comparing with those with good outcomes [secondary neurological deterioration within 48 h (1.169, IQR: 1.007–1.322 vs 0.940, IQR: 0.831–1.068); 30-day mortality (1.294, IQR: 1.093–1.505 vs 0.963, IQR: 0.844–1.106); 3-month poor mRS (4–6) (1.076, IQR: 0.957–1.268 vs 0.881, IQR: 0.803–1.019)] [Figure 2(b)–(d)]. Univariate analysis and the following multivariate logistic regression analysis demonstrated that SHR independently predicted secondary neurological deterioration within 48 h (OR: 6.610, 95% CI: 1.022–42.753, p = 0.047); 30-day mortality (OR: 36.363, 95% CI: 4.752–278.227, p = 0.001); 3-month poor mRS (4–6) (OR: 8.887, 95% CI: 1.699–46.479, p = 0.010) after ICH (Table 4). ROC curves of the independent predictive factors for poor outcomes were plotted and the AUCs, 95% CIs, and p-values of SHR were as follows: secondary neurological deterioration within 48 h (0.805, 0.735–0.876, p < 0.001); 30-day mortality (0.865, 0.784–0.947, p < 0.001); and 3-month poor mRS (4–6) (0.749, 0.690–0.809, p < 0.001). The diagnostic accuracy of SHR exhibited by AUC showed no statistical differences compared with the well-known predictors (p > 0.05), while higher than PT level (p = 0.017) and presence of IVH (p = 0.002) [Figure 3(b)–(d)]. Meanwhile, the SHR values in each mRS score (from 0 to 6) were also detailed, which suggested SHR increased with the aggravation of poor outcomes [Figure 2(e)]. Moreover, the cut-off points of SHR for predicting secondary neurological deterioration within 48 h, 30-day mortality, and 3-month poor mRS were 1.067, 1.226, and 0.905, respectively, and the sensitivity, specificity, PPV, NPV, and accuracy were presented in Table 5.
Univariate and multivariate analysis of the potential predictors for poor outcomes.

APTT, activated partial thromboplastin time; CI, confidence interval; DBP, diastolic blood pressure; GCS, Glasgow coma scale; HbA1c, Hemoglobin A1c; INR, international normalized ratio; IVH, intraventricular hemorrhage; mRS, modified Rankin Scale; NCCT, noncontrast computed tomography; OR, odds ratio; PT, prothrombin time; SBP, systolic blood pressure; SHR, stress-induced hyperglycemia ratio.
The cut-off points and accuracy of SHR to predict hematoma expansion and poor outcomes.

mRS, modified Rankin Scale; NPV, negative predictive value; PPV, positive predictive value.
Discussion
This double-center prospective study demonstrates that SHR is independently associated with hematoma expansion and poor outcomes in ICH patients. There are three parts of results supporting the conclusion. First, the SHR values in patients with hematoma expansion and poor outcomes, including short-term and long-term, were markedly higher than the negative groups. Then multivariate logistic regression analysis revealed that SHR could be regarded as an independent predictor. Moreover, ROC analysis indicated that SHR was appropriate for diagnosing hematoma expansion and poor outcomes compared with other variables.
More and more efforts have been made to explore optimal laboratory testing parameters for predicting hematoma expansion and/or outcomes. These parameters should be easily and rapidly available and closely related to the pathophysiology of ICH. There are mainly three kinds of predictors on the basis of the mechanisms. Factors altering the coagulation function, such as high INR and hypocalcemia, have been paid attention to predict hematoma expansion.17,18 Inflammatory responses induced by ICH may result in the damage of peri-hematoma vessels, 19 thus inflammatory-associated factors, for example, C-reactive protein and lactate dehydrogenase are regarded as predictors for hematoma expansion and/or poor outcomes.20,21 Moreover, microvascular integrity markers, such as metalloproteinase-9 and low-density lipoprotein cholesterol which lead to the breakdown of the blood–brain barrier (BBB), are also independent risk factors for hematoma expansion and/or poor outcomes.22,23 However, two predominant defects may restrict the clinical practice of the laboratory parameters. On one hand, as these parameters themselves may be influenced by multiple factors, theoretically, a great alternation due to ICH compared with the background status may play a better predictive role. Nevertheless, the data prior to ICH are always difficult to obtain. On other hand, an appropriate predictor should be effectively intervened through existing management to improve the outcome, while most of the above markers failed to meet this criterion. Fortunately, it is possible to tackle the two thorny problems using SHR.
Similar to other markers, although admission hyperglycemia has been regarded as a risk of poor outcome after ICH, most studies accept that this finding is more likely to be applied to non-diabetic patients whose baseline blood glucose may be relatively normal. 6 Our study also demonstrated admission blood glucose only predicted 30-day mortality rather than hematoma expansion and other outcomes. SIH is a type of hyperglycemia secondary to stress, which commonly occurs in patients with critical illness, including stroke. 24 In ICH patients, different from diabetic hyperglycemia, SIH can better reflect elevated blood glucose owing to ICH. However, studies about the outcome of ICH patients with SIH are still very limited. Thanks to SHR, we can effectively distinguish SIH from diabetic hyperglycemia. Nathan et al. 25 created an equation to translate HbA1c into estimated average glucose values ‘Estimated average glucose = (1.59 × HbA1c) − 2.59’. Then SHR, which is calculated as admission blood glucose divided by estimated average glucose, is developed to define relative hyperglycemia, that is, SIH. 10 SHR has been considered as an index that more accurately reflects the extent of SIH by correction for chronic glycemic status. It has been indicated that SHR is a useful predictive marker for the outcomes of acute myocardial infarction and all-cause death after percutaneous coronary intervention.26,27 Our work first investigated the role of SHR in ICH patients and demonstrates SHR is independently associated with hematoma expansion and poor outcomes. Glycemic gap (GG) is another indicator for evaluating SIH. A recent study demonstrated admission GG was associated with the risk of in-hospital mortality in ICH patients with diabetes, which is in accord with our results. 28 However, we performed a more comprehensive study, including more prognostic markers apart from mortality and hematoma expansion. Besides, distinct from the markers with the aforementioned second defect, SHR can be altered by regulating the blood glucose. American Heart Association/American Stroke Association guidelines for the management of ICH also recommend glucose should be monitored and both hyperglycemia and hypoglycemia should be avoided. 29
The effects of SIH on ICH are complex and contain multiple mechanisms. It is reported that hyperglycemia after ICH is associated between neutrophil and lymphocyte ratio, suggesting hyperglycemia may induce inflammatory responses that promote secondary brain injury. 30 Meanwhile, hyperglycemia in ICH model can facilitate neuroinflammation by increasing inflammatory mediators, including tumor necrosis factor α and high-mobility group box 1 expression. 31 In addition, hyperglycemia leads to hematoma expansion possibly by impairing of the integrity of vessels close to the site of initial bleeding and increasing the expression of nuclear factor kappa B and matrix metalloproteinase-9. 32 Neuronal mitochondria damage may be another mechanism of hyperglycemia in hemorrhagic neural injury. 33 Aquaporin-4 (AQP4) is the most abundant aquaporin in the brain. 34 Our previous studies demonstrated that AQP4 reduces brain edema, BBB disruption, and apoptosis and aggravates hematoma expansion after ICH using AQP4 knockout mice.8,35–37 Hyperglycemia may also exacerbate ICH through downregulating expression of AQP4. 38
Since SHR was indicated as a predictor for hematoma expansion and poor outcomes, the translation into clinical implications should be more useful. Generally, single predictor for hematoma expansion usually has its own limitation, which prompts scholars to create prediction scores with the combination of several predictors.39,40 Correspondingly, SHR may be a potential candidate for a new prediction score combined with other predictors to increase sensitivity and specificity. Blood glucose and blood pressure are two essential impact factors in cerebrovascular diseases. It has been demonstrated that higher SBP variability in the first 24 h of admission is associated with unfavorable in-hospital outcome in ICH patients. 41 Meanwhile, SBP reduction in the first 6 h of ICH is markedly associated with the in-hospital outcome that varies with initial hematoma volume, which suggests that SBP reduction protocols should give consideration to initial hematoma volume, baseline SBP level, and magnitude of early SBP reduction. 42 Blood glucose control after ICH is recommended by the guidelines and a cluster randomized trial revealed a set of interventions (managing glucose, fever, and swallowing dysfunction) produced long-term and sustained benefit in a mixed cohort of ischemic and hemorrhagic stroke patients, 43 while the optimal management of hyperglycemia and the target glucose level remains to be clarified. However, no association was revealed between glycemic variability indices and 3-month clinical outcomes. 44 Similarly, blood glucose control protocols may also consider a combination of factors, such as the initial hematoma volume, baseline blood glucose level, magnitude of early blood glucose variability, and SHR. In addition, computed tomography angiography (CTA) spot sign as a predicting marker is a key inclusion criterion of the trials to evaluate the effect of intensive blood pressure reduction and tranexamic acid.45,46 Similarly, further studies may investigate whether ICH patients with certain range of SHR benefit from the existing therapies.
Several limitations of this study should be concerned. The sample size was relatively small and only Chinese patients were evaluated, which may limit the generalizability of the study results in other cohorts. Meanwhile, the potential mortality bias should not be neglected. Therefore, further study of global multicenter with large sample size should be performed to avoid the above limitations. Moreover, the critical value of SHR to predict hematoma expansion and poor outcomes has not been validated. Besides, prolonging follow-up time for 1 year or more should be performed for comprehensively evaluating the outcomes.
Conclusion
The current study using SHR for measuring SIH suggests SHR is independently associated with hematoma expansion and poor outcomes of different terms in ICH patients, including secondary neurological deterioration within 48 h, 30-day mortality, and 3-month poor mRS.
Supplemental Material
sj-docx-1-tan-10.1177_17562864211070681 – Supplemental material for The stress hyperglycemia ratio predicts early hematoma expansion and poor outcomes in patients with spontaneous intracerebral hemorrhage
Supplemental material, sj-docx-1-tan-10.1177_17562864211070681 for The stress hyperglycemia ratio predicts early hematoma expansion and poor outcomes in patients with spontaneous intracerebral hemorrhage by Heling Chu, Chuyi Huang, Yuping Tang, Qiang Dong and Qihao Guo in Therapeutic Advances in Neurological Disorders
Footnotes
Author contributions
Conflict of interest statement
The authors declared no potential conflicts of interest with respect to the research, authorship, and/or publication of this article.
Funding
The authors disclosed receipt of the following financial support for the research, authorship, and/or publication of this article: This research was supported by grants from the National Natural Science Foundation of China (Grant Nos. 81901102, 82071472).
Supplemental material
Supplemental material for this article is available online.
References
Supplementary Material
Please find the following supplemental material available below.
For Open Access articles published under a Creative Commons License, all supplemental material carries the same license as the article it is associated with.
For non-Open Access articles published, all supplemental material carries a non-exclusive license, and permission requests for re-use of supplemental material or any part of supplemental material shall be sent directly to the copyright owner as specified in the copyright notice associated with the article.