
Abstract
Background:
Alzheimer’s disease (AD) is the most common form of progressive and irreversible dementia, and accurate diagnosis of AD at its prodromal stage is clinically important. Currently, computer-aided diagnosis of AD and mild cognitive impairment (MCI) using 18F-fluorodeoxy-glucose positron emission tomography (18F-FDG PET) imaging is usually based on low-level imaging features or deep learning methods, which have difficulties in achieving sufficient classification accuracy or lack clinical significance. This research therefore aimed to implement a new feature extraction method known as radiomics, to improve the classification accuracy and discover high-order features that can reveal pathological information.
Methods:
In this study, 18F-FDG PET and clinical assessments were collected in a cohort of 422 individuals [including 130 with AD, 130 with MCI, and 162 healthy controls (HCs)] from the Alzheimer’s Disease Neuroimaging Initiative (ADNI) and 44 individuals (including 22 with AD, and 22 HCs) from Huashan Hospital, Shanghai, China. First, we performed a group comparison using a two-sample Student’s t test to determine the regions of interest (ROIs) based on 30 AD patients and 30 HCs from ADNI cohorts. Second, based on two time scans of 32 HCs from ADNI cohorts, we used Cronbach’s alpha coefficient for radiomic feature stability analyses. Pearson’s correlation coefficients were regarded as a feature selection criterion, to select effective features associated with the clinical cognitive scale [clinical dementia rating scale in its sum of boxes (CDRSB); Alzheimer’s disease assessment scale (ADAS)] with 500-times cross-validation. Finally, a support vector machine (SVM) was used to test the ability of the radiomic features to classify HCs, MCI and AD patients.
Results:
As a result, we identified brain regions which were mainly distributed in the temporal, occipital and frontal areas as ROIs. A total of 168 radiomic features of AD were stable (alpha > 0.8). The classification experiment led to maximal accuracies of 91.5%, 83.1% and 85.9% for classifying AD versus HC, MCI versus HCs and AD versus MCI.
Conclusion:
The research in this paper proved that the novel approach based on high-order radiomic features extracted from 18F-FDG PET brain images that can be used for AD and MCI computer-aided diagnosis.
Introduction
Alzheimer’s disease (AD) is the most common form of progressive and irreversible dementia, with occurrences doubling approximately every 5 years after the age of 65 years. Presently, approximately 90 million people have been diagnosed with AD, and it is estimated that the number of AD patients will reach 300 million by 2050. 1 Mild cognitive impairment (MCI), which is considered a precursor of AD, has been an increasingly common target of potential therapeutic trials. 2 Currently, there is no effective cure solution for AD; thus, the early detection at its prodromal stage and accurate diagnosis of AD are important for patient care and developing future treatment. 3
In recent years, positron emission tomography (PET) imaging technology has been widely used in the diagnosis, classification and rehabilitation evaluation of AD. In particular, 18F-fluorodeoxy-glucose (18F-FDG) PET, which is a functional molecular imaging modality performed utilizing glucose metabolic activity and distribution via imaging agents, 4 has been proven to be a valid tool to help doctors diagnose AD and MCI. 5
Currently, there are two primary categories of computer-aided diagnoses of AD and MCI based on 18F-FDG PET imaging: (1) the numerical distribution method of glucose uptake values, and its common imaging markers are usually low-order and simple image features 6 ; (2) machine learning and deep learning techniques. Gary and colleagues 7 used multi-region PET image fusion structural magnetic resonance imaging (MRI) to extract the average signal intensity per cubic millimeter in each region as features to classify AD patients and healthy controls (HCs), achieving an accuracy of 82%. Silveira and colleagues 5 proposed a boosting classification technique based on simple classifier hybridization for the diagnosis of AD and MCI, with average accuracies of 90.97% and 79.63%, respectively. Liu and colleagues 3 invented a classification framework based on the combination of two-dimensional convolutional neural networks and recurrent neural networks, and the classification accuracies of AD or MCI versus HCs could reach 91.2% and 78.9%, respectively. However, the aforementioned low-order markers used in numerical methods were mostly hand-crafted, original, and low-level features that could not reveal the neuropathological heterogeneity of brain tissue and could hardly achieve high classification accuracy.3–5 By comparison, although the deep learning frameworks could achieve better diagnostic accuracy, these methods only obtain the calculation values without clinical significance; thus, we cannot determine the association between intermediate values and the disease. For clinical practice, finding image features that can provide pathological information about diseases and using them for efficient classification diagnosis have great implications for physicians.
In this paper, to find high-level image features and develop efficient and accurate diagnostic tools, we proposed an emerging method, radiomics, for 18F-FDG PET image feature extraction. The term ‘radiomics’ refers to the extraction and analysis of large amounts of advanced and high-order quantitative features with high-throughput from medical images.8,9 These radiomic features could not only effectively diagnose disease and assist in treatment but also reveal the in-depth information hidden in the images that may help develop personalized and accurate medical plans.8–10 Radiomics has been well developed in oncological studies.11–14 Although current radiomics research studies have been mainly focused on oncology, considerations have been recently extended to numerous medical applications. 8 However, no application of radiomics has been described in AD and MCI. Therefore, the present study was aimed to determine whether radiomic features extracted from 18F-FDG PET brain images could be used for AD and MCI computer-aided diagnoses, and then we proposed a novel computer-aided Alzheimer’s diseases diagnosis approach based on radiomics.
Methods
As shown in the Figure 1, we first preprocessed the collected 18F-FDG PET data using normalization and smoothing. Next, we performed statistical parametric mapping (SPM) analyses based on two-sample, Student’s t tests of the preprocessed data to determine the regions of interest (ROIs). Subsequently, a few radiomic features were extracted from the ROIs. Thereafter, we applied the Cronbach’s alpha coefficient and Pearson’s correlation coefficient for feature selection. Finally, based on these selected radiomic features, we completed three classifications for AD versus HCs, MCI versus HCs and AD versus MCI using a support vector machine (SVM). Details on this approach are described in following sections.
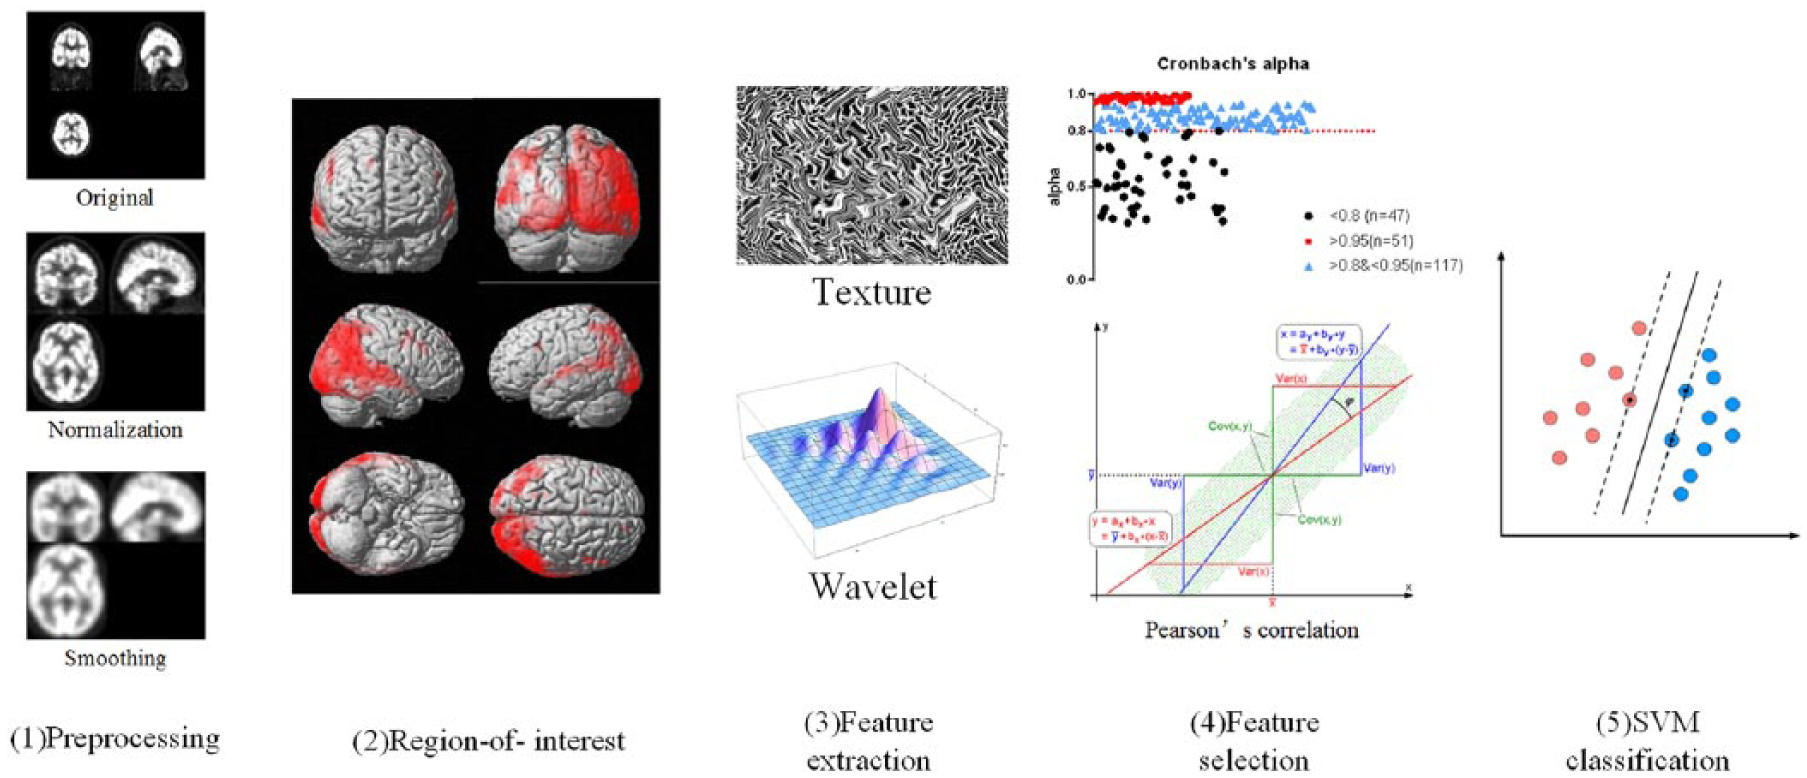
Workflow of the analysis methods in this study, which comprised five steps: image preprocessing, image preprocessing, identification and extraction of regions of interest, feature extraction, feature selection, and SVM classification.
Materials
The study was approved by the ethics committee of Huashan Hospital, Fudan University, Shanghai, China (permission number: KY2013-336). All patients of Huashan Hospital provided written informed consent. For ethical review information on Alzheimer’s Disease Neuroimaging Initiative (ADNI) data, please refer to the website (adni.loni.usc.edu).
The data used in this study included two cohorts: (1) 422 cohorts from the ADNI database, including 162 HCs (32 HCs had two time-interval 18F-FDG PET scans, while 130 HCs had only one 18F-FDG PET scan), 130 MCI and 130 AD patients. We selected clinical variables [clinical dementia rating scale in its sum of boxes (CDRSB); Alzheimer’s disease assessment scale (ADAS)] and 18F-FDG PET images for these cohorts. The ADNI was launched in 2003 by the National Institute on Aging, the National Institute of Biomedical Imaging and Bioengineering, the United States Food and Drug Administration (US FDA), private pharmaceutical companies, and nonprofit organizations, as a $60 million, 5-year, public-private partnership. The primary goal of ADNI has been to test whether serial MRI, PET, other biological markers, and clinical and neuropsychological assessments can be combined to measure the progression of MCI and early AD. (2) A total of 44 cohorts from the PET Center, Huashan Hospital, Fudan University, Shanghai, China, including 22 HCs and 22 AD patients. We selected basic information (sex and age) and 18F-FDG PET images for these cohorts. Table 1 lists the basic information of all the data.
Basic information of all the data.

18F-FDG PET, 18F-fluorodeoxy-glucose positron emission tomography; AD, Alzheimer’s disease; ADAS, Alzheimer’s disease assessment scale; ADNI, Alzheimer’s Disease Neuroimaging Initiative; CDRSB, clinical dementia rating scale in its sum of boxes; F, female; HC, healthy control; M, male; MNI, Montreal Neurological Institute; N/A, not available.
Image acquisition
All patients who underwent 18F-FDG PET brain scans at Huashan Hospital were in a resting state. A 222-296 MBq injection of 18F-FDG was administered intravenously under standardized conditions (in a quiet, dimly lit room with the patient’s eyes open). A 10-min three-dimensional brain emission scan was acquired at 45-min post injection with a state-of-the-art PET scanner (Siemens Biograph 64 HD PET/CT; Siemens, Germany). During the scanning procedure, the patient’s head was immobilized using a head holder. Attenuation correction was performed using low-dose computed tomography (150 mAs, 120 kV, Acq. 64 × 0.6 mm) prior to the emission scan. Following corrections for scatter, dead time, and random coincidences, PET images were reconstructed by three-dimensional filtered back-projection and a Gaussian filter [full-width at half maximum (FWHM) 3.5 mm], providing 148 contiguous transaxial slices of 3-mm-thick spacing. For images downloaded from the ADNI database, detailed information regarding the data acquisition protocol is publicly available on the LONI website (https://ida.loni.usc.edu/login.jsp).
Image preprocessing
Image data were processed using statistical parametric mapping (SPM8, www.fil.ion.ucl.ac.uk/spm/) implemented in MATLAB R2014b. The aim of preprocessing was to spatially normalize the images into a standard space defined by template images and to remove unwanted distortions such as low-frequency background noise. The image preprocessing consisted of two steps: normalization and smoothing. All the original Digital Imaging and Communications in Medicine (DICOM) data were converted into NIfTI-formatted files using DCM2NII (http://people.cas.sc.edu/rorden/mricron/index.html). For each patient, the PET image was first normalized to the Montreal Neurological Institute (MNI; McGill University, Montreal, Canada) space through the ‘normalize: estimate and write’ methodology. Next, the normalized images were smoothed using an isotropic Gaussian smoothing kernel with a FWHM value of 10 × 10 × 10 mm3. The normalized images had a spatial resolution of 91 × 109 × 91 with voxel sizes of 2 × 2 × 2 mm3.
ROIs
In this study, we focused on brain areas that were relevant to AD pathology. To characterize morphological differences in AD patients compared with HCs, we performed a group comparison using a two-sample, Student’s t test implemented in SPM8, based on 30 AD patients (from AD1 group) and 30 HCs (from HC2 group) randomly selected from ADNI cohorts. These 60 samples were not included in subsequent feature selection and classification experiments. We set the peak threshold at p < 0.01 with family-wise error correction over the entire brain regions with a threshold of 20 voxels. Significantly different brain areas were localized using the software xjView9.6 (www.alivelearn.net/xjview). Because MCI is an intermediate process of HC conversion to AD, we assume that these ROIs can also be used for feature extraction of MCI data. Thus, these regions were treated as ROIs in subsequent studies. To verify the reliability of these ROIs, we repeated this SPM analysis as a comparison in the Huashan cohort.
Feature extraction
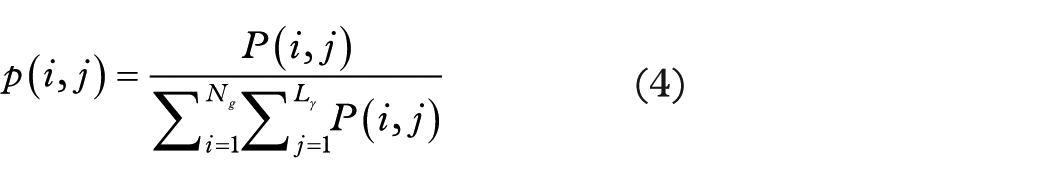
Using morphological results from the last section, we extracted ROIs of the remaining samples (including 100 AD patients, 130 MCI patients and 132 HCs) in the ADNI cohorts for further analysis. In this section, the radiomics tool developed by Vallieres 4 (https://github.com/mvallieres/radiomics) was used. All steps were performed in MATLAB R2014b, including wavelet bandpass filtering, Lloyd–Max quantization and feature calculation. The first step was wavelet bandpass filtering. This step was carried out by applying different weights [low (L) and high (H)] to bandpass sub-bands (LHL, LHH, LLH, HLL, HHL, and HLH) of the ROIs, compared with low- and high-frequency sub-bands (LLL and HHH) in the wavelet domain. The ratio of the weight was defined by R, and the values of R were 1/2, 2/3, 1 (no wavelet filtering), 3/2, and 2. Global features were immediately extracted before other steps. Second, because the feature extraction algorithm required that the image grayscale value should be a discrete value and voxels should be isotropic, the Lloyd–Max quantization algorithm was applied to normalize the 18F-FDG PET images to 256 gray-level images. Finally, four types of texture matrices [gray-level co-occurrence matrix (GLCM) gray-level run-length matrix (GLRLM), gray-level size zone matrix (GLSZM), and neighborhood gray-tone difference matrix (NGTDM)] could be obtained from quantized PET images. According to these texture matrices, numerous high-order features could be calculated. In addition to texture features, we also calculated wavelet features throughout 16 orders of wavelet decomposition. In total, 215 radiomic features were extracted from each sample, including 43 texture features (The R parameter values for these features was 1) and 172 wavelet features that were defined as the features extracted after wavelet filtering (The R parameters values for these features were 1/2, 2/3, 3/2 and 2). 11 The detailed mathematical definition of the global features and four texture matrices were as follows15–20:
(1) Global texture (GT): let

(2) GLCM: let

The following quantities are also defined:

(3) GLRLM: let
The following quantities are also defined:

(4) GLSZM: let

The following quantities are also defined:

(5) NGTDM: let
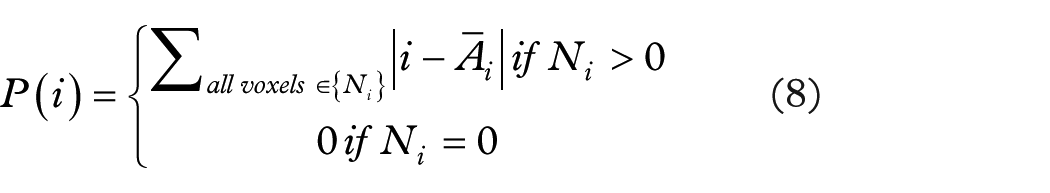
Where
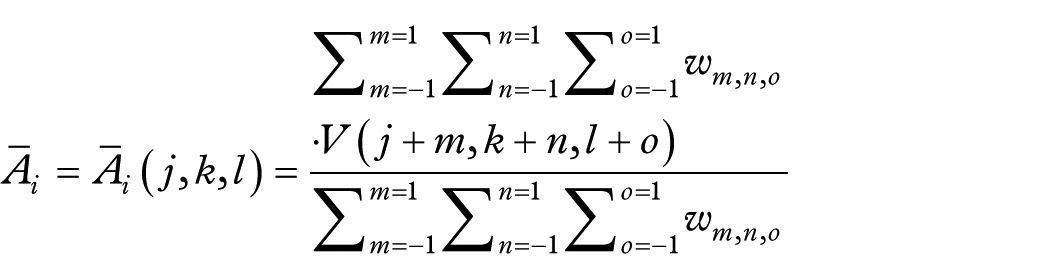

The following quantities were also defined as follows:

Table 2 provides more details on the names, references and mathematical definitions of above texture features.
Details of radiomic texture features.

Haralick RM, Shanmugam K and Dinstein IH. Textural features for image classification. IEEE Trans Syst Man Cybern 1973; 3: 610–621.
Galloway MM. Texture analysis using grey level run lengths. Vol. 75. NASA STI/Recon Technical Report N. Linthicum Heights, MD, 1974.
Chu A, Sehgal CM and Greenleaf JF. Use of gray value distribution of run lengths for texture analysis. Patt Recog Lett 1990; 11: 415–419.
Dasarathy BV and Holder EB. Image characterizations based on joint gray level—run length distributions. Patt Recog Lett 1991; 12: 497–502.
Thibault G, Fertil B, Navarro C, et al. Texture indexes and gray level size zone matrix application to cell nuclei classification. In: 10th International conference on pattern recognition and information processing, Minsk, Belarus, 2009, pp.140–145.
Amadasun M and King R. Textural features corresponding to textural properties. IEEE Trans Syst Man Cybern 1989; 19: 1264–1274.
Feature selection
The feature selection step was done in ADNI cohorts. In this step, we first performed a stability analysis on the features mentioned above to eliminate the unstable invalid features. The radiomic features were separately extracted from the 32 HCs (HC1 group) in using their first-time and second-time 18F-FDG PET images. The one type of radiomic feature extracted from these samples was divided into two feature vectors (first and second-time). The two vectors were then treated as inputs to calculate the Cronbach’s alpha coefficient. We judged the stability of each feature by the value of alpha. The coefficient threshold was 0.8 and features above this value were considered stable and those features below this value were excluded from follow-up studies.
Second, to screen out the radiomic features associated with AD and MCI, we used Pearson’s correlation coefficients to evaluate whether there was a correlation between the clinical scale and radiomic features. If there was a correlation, we believe that this feature was effective for AD or MCI and would be used for classification. To ensure statistical reliability, we conducted a cross-validation test. Taking AD as an example, the cross-validation process was as follows: (1) we randomly chose 70 patients from the AD1 group (100 patients that were not used for SPM analysis described in section Regions of interest); (2) we extracted ROIs from the above 70 patients and got stable radiomic features; (3) we calculated the correlation between the ADAS scale and each feature using Pearson’s correlation coefficients. As a result, those features which were related to ADAS (p < 0.05 with false discovery rate (FDR) correction) were considered as selected features; (4) the remaining 30 patients from the AD1 group were used as a test dataset for subsequent classification experiments. Finally, the above cross-validation process was repeated 500 times.
For the MCI group, we calculated the correlation between the CDRSB scale and each feature and did the same cross-validation process 500 times. In addition, we also did the same cross-validation process to explore radiomic features that were effective for both the AD group and MCI group by calculating the correlation between the ADAS scale and each feature. All calculations were implemented in MATLAB R2014b using raw values without normalization.
To further explore the consistency of the selected features in different conditions, we also extracted selected features using ROIs from the Huashan cohort and calculated the intraclass correlation coefficient (ICC) for those feature using samples which participated in feature selection cross-validation (CV) experiments (100 AD and 100 MCI patients).
SVM classification
After the feature selection step, we identified three selected radiomic feature sets (AD/MCI/HC) to distinguish AD/HC, MCI/HC and AD/MCI. To verify the diagnostic capabilities of these feature sets, we performed three SVM classification for AD versus HCs, MCI versus HCs and AD versus MCI. The SVM is one kind of supervised learning model with associated learning algorithms that analyze data used for classification and regression analysis. Given a set of training examples, each marked as belonging to one or the other of two categories, an SVM training algorithm builds a model that assigns new examples to one category or the other, making it a nonprobabilistic binary linear classifier.
In this step, we also conducted classification experiments 500 times for each SVM classification. Taking the AD versus HCs classification as an example, we used 70 patients from the AD1 group (the same as 70 patients selected in the section, Feature selection) and randomly selected 70 patients from the HC2 group (100 patients that were not used for SPM analysis described in the section, Regions of interest) to train the SVM classifier. Then, we used the remaining 30 patients from the AD1 group and 30 patients from the HC2 group to test the SVM classifier. Finally, the Huashan cohort was used as the second test dataset to further validate the classification results. We also did the above process for AD versus MCI, and MCI versus HCs 500 times. The mean and standard deviation values were also calculated 500 times in each experiment.
In the classification experiment, four kernel (linear, sigmoid, polynomial, and radial basis) functions were used to detect feature generalization ability and classification reliability. Before classification, all feature values were normalized in both the train dataset and test dataset by using a ‘min-max normalization’ method separately. In addition, features, age and sex had also been considered as the inputs for SVM classification. The classifier version used in this experiment was LIBSVM 2.9.1 (www.csie.ntu.edu.tw/~cjlin/libsvm/) and was implemented in MATLAB R2014b. In addition, we repeated the above feature selection experimental process using ROIs obtained by the Huashan cohort as a comparison. The same classification experiments were also repeated.
Results
ROIs
Figure 2 shows the results of the voxel-based two-sample Student’s t test of AD patients and HCs in both ADNI cohorts (30 AD patients versus 30 HCs) and Huashan cohorts (22 AD patients versus 22 HCs). These brain regions comprised brain tissue related to the AD pathology and are summarized in Tables 3 and 4. The results obtained from the two groups were consistent. Most of the ROIs were distributed in the temporal, occipital and frontal areas.
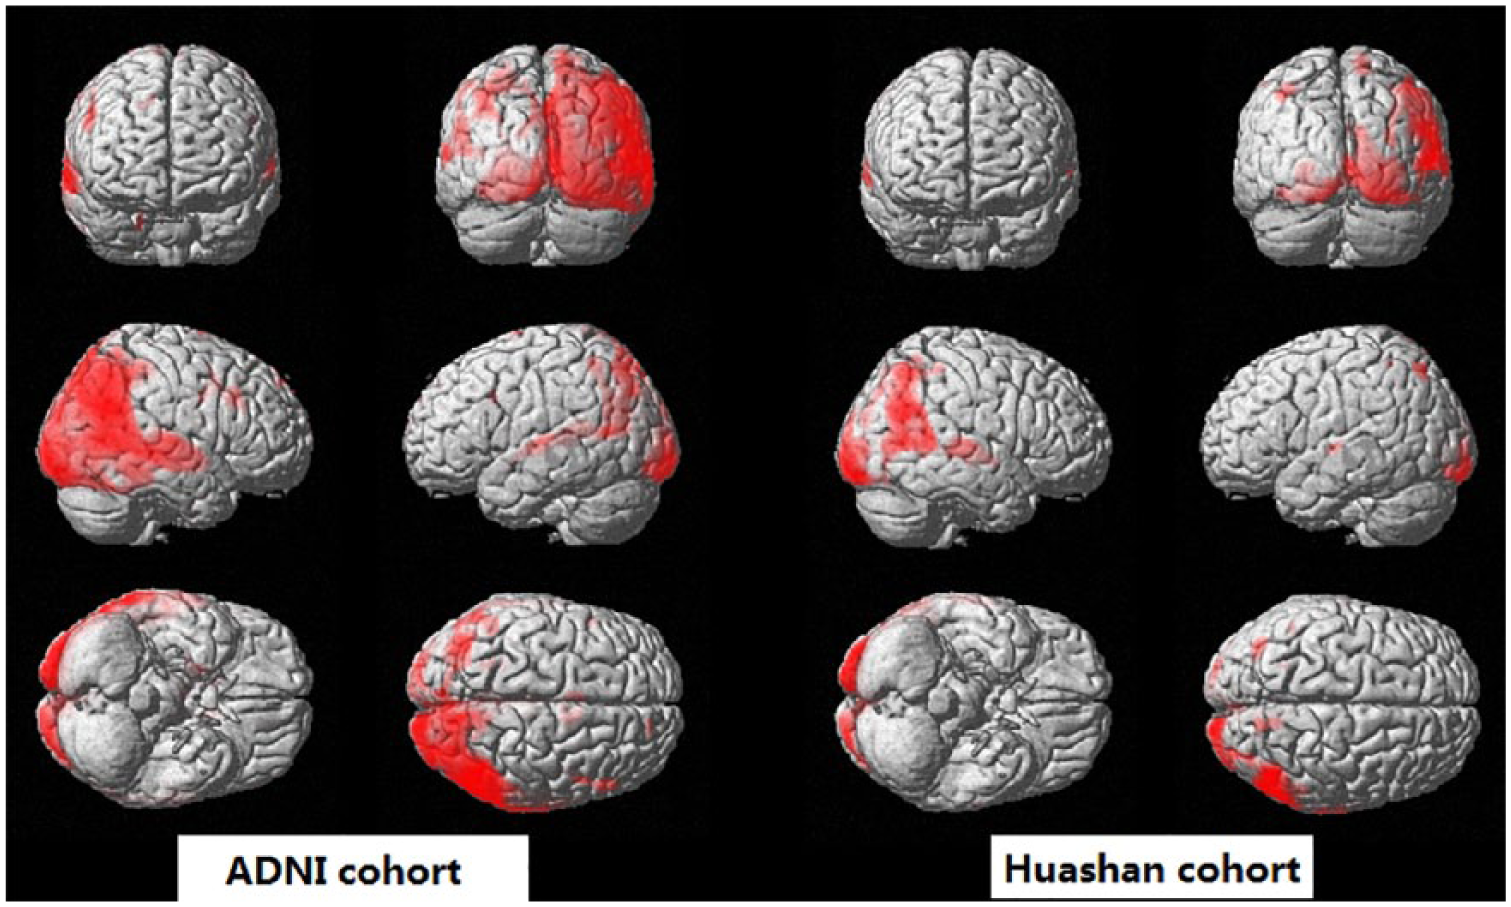
Results of the two-sample Student’s t test brain 18F-FDG PET images conducted to assess differences between AD patients and HCs.
Brain regions with significant differences between AD patients and HCs based on ADNI cohorts.

AD, Alzheimer’s disease; ADNI, Alzheimer’s Disease Neuroimaging Initiative; HC, healthy control; MNI, Montreal Neurological Institute.
Brain regions with significant differences between AD and HC based on Huashan cohorts.
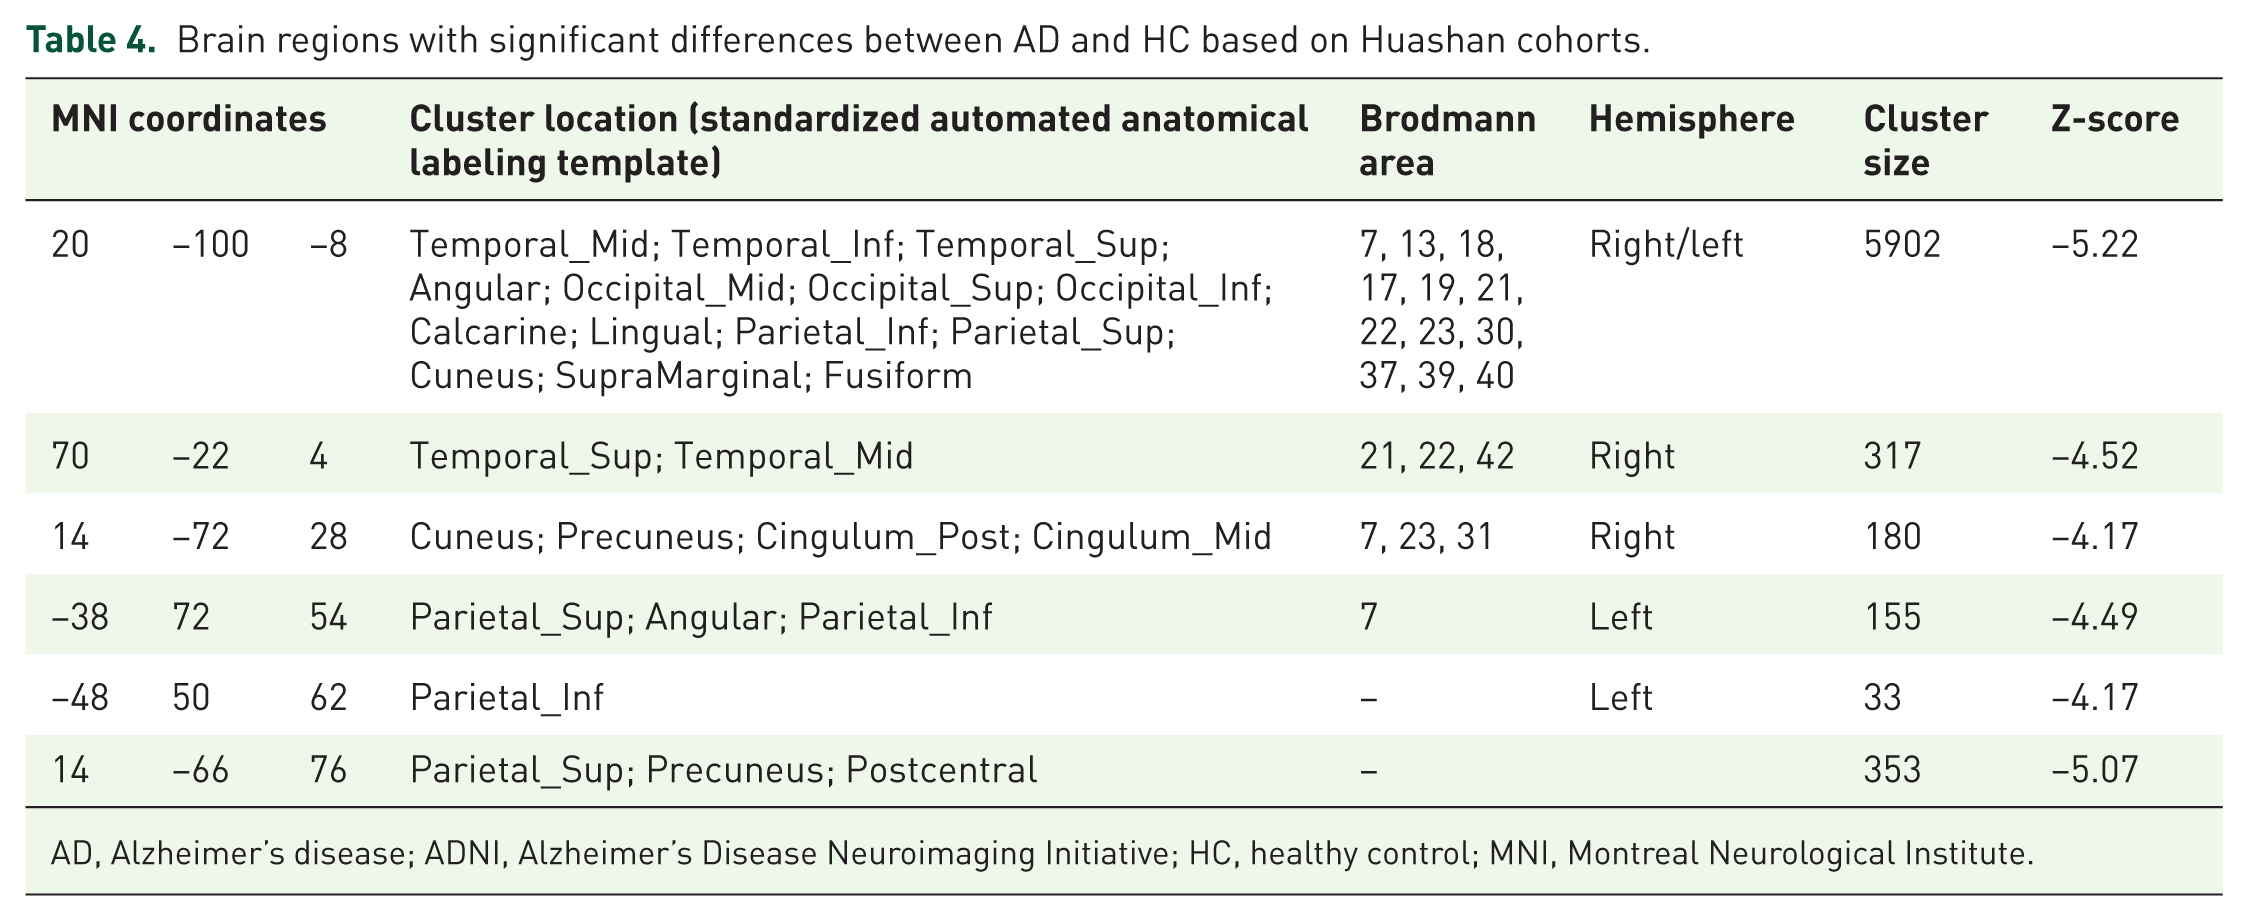
AD, Alzheimer’s disease; ADNI, Alzheimer’s Disease Neuroimaging Initiative; HC, healthy control; MNI, Montreal Neurological Institute.
Cronbach’s alpha coefficient
Figure 3 shows an overall scatter plot of the Cronbach’s alpha coefficient for all radiomic features. Of these, 168 features were stable (alpha > 0.8), and 47 were unstable (alpha < 0.8). Among the 168 stable features, 51 features were extremely stable (alpha > 0.95). The results from the stability analysis proved that the radiomic features were stable and reliable in brain 18F-FDG PET images. Table 5 shows all stable features.
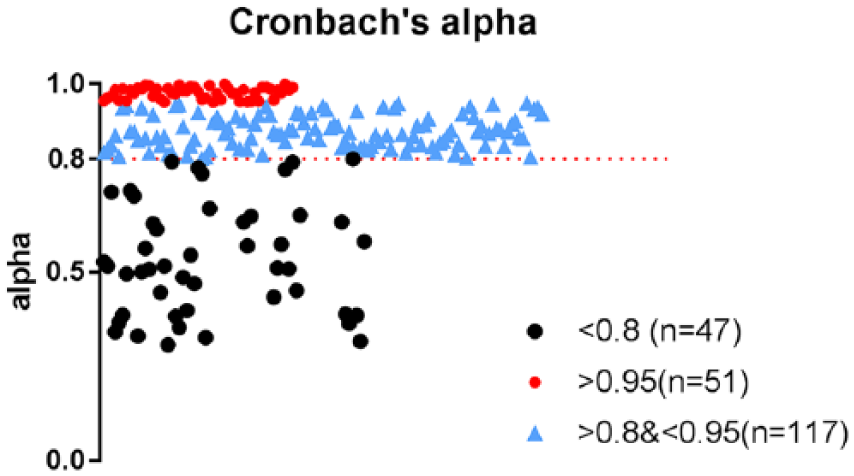
Scatter plot of all radiomic features in relation to Cronbach’s alpha coefficient.
Stable features.

AD, Alzheimer’s disease; ADNI, Alzheimer’s Disease Neuroimaging Initiative; GLN, gray-level nonuniformity; GLV, gray-level variance; HGRE, high-gray-level run emphasis; HGZE, high-gray-level zone emphasis; ICC, intraclass correlation coefficient; LGRE, low-gray-level run emphasis; LGZE, low-gray-level zone emphasis; LRE, long-run emphasis; LRHGE, long-run high-gray-level emphasis; LRLGE, long-run low-gray-level emphasis; LZE, large zone emphasis; LZHGE, large zone high-gray-level emphasis; LZLGE, large zone low-gray-level emphasis; MCI, mild cognitive impairment; RLN, run-length nonuniformity; RLV, run-length variance; RP, run percentage; SRE, short-run emphasis; SRHGE, short-run high gray-level emphasis; SRLGE, short-run low-gray-level emphasis; SZHGE, small zone high-gray-level emphasis; SZLGE, small zone low-gray-level emphasis; ZP, zone percentage; ZSN, zone-size nonuniformity; ZSV, zone-size variance.
Pearson’s correlation coefficients
After each cross-validation in the feature selection step, it can be observed that there were about 50–70 kinds of features associated with AD, about 30–40 features associated with MCI and about 10–20 features associated with both AD and MCI. Table 6 lists the most frequently features, their occurring times and ICC values at 500 times cross-validation. In general, these features showed excellent consistency in repeated experiments. For example, ‘energy’ and ‘entropy’ appeared in both AD and MCI experiments, indicating that these two features have good pathological revealing ability. As a comparison, the top relative features selected from Huashan cohort’s ROIs were consistent with Table 6. Table 7 shows the details of these key features.
The key relative features selected by cross-validation, 500 times.

ICC > 0.9 means excellent consistency and ICC > 0.8 means statistically acceptable consistency.
AD, Alzheimer’s disease; ADNI, Alzheimer’s Disease Neuroimaging Initiative; GLV, gray-level variance; HGRE, high-gray-level run emphasis; ICC, intraclass correlation coefficient; LRHGE, long-run high-gray-level emphasis; LZE, large zone emphasis; MCI, mild cognitive impairment; RLN, run-length nonuniformity; RLV, run-length variance; RP, run percentage; SRE, short-run emphasis; SZHGE, small zone high-gray-level emphasis; SZLGE, small zone low-gray-level emphasis; ZP, zone percentage; ZSV, zone-size variance.
Results for ADNI cohorts using the Huashan cohort ROIs.
(a) The top relative features selected by cross-validation 500 times.

(b) Classification accuracy, AUC, sensitivity, and specificity.

AD, Alzheimer’s disease; ADNI, Alzheimer’s Disease Neuroimaging Initiative; AUC, Area Under Curve; GLV, gray-level variance; HGRE, high-gray-level run emphasis; LRHGE, long-run high-gray-level emphasis; LZE, large zone emphasis; LZHGE, large zone high-gray-level emphasis; MCI, mild cognitive impairment; RBF, Radial Basis Function; RLN, run-length nonuniformity; RLV, run-length variance; RP, run percentage; SRE, short-run emphasis; SZHGE, small zone high-gray-level emphasis; SZLGE, small zone low-gray-level emphasis; ZP, zone percentage; ZSV, zone-size variance.
SVM classification results
As shown in Table 8, the use of selected radiomic features with linear, polynomial, radial basis, and sigmoid kernels could achieve average accuracies of 91.5%, 88.1%, 86.1%, and 86.3%, respectively, to distinguish AD patients and HCs, average accuracies of 85.9%, 83.4%, 85.0%, and 83.5%, respectively, to distinguish AD and MCI patients, and accuracies of 83.1%, 81.8%, 82.9%, and 81.5%, respectively, to distinguish MCI patients and HCs. As a result, the linear kernel could achieve an optimal classification performance. The classification performance of Radial Basis Function (RBF) and the sigmoid kernel were slightly poor and relatively unstable, probably because these two kernels depend on parameter adjustments and in this study, we only used default parameters for classification. As a comparison, similar results were achieved by using ROIs from the Huashan cohorts. The best classification performances achieved average accuracies of 91.2%,85.5%, 82.3% and 92.1%, in AD vs HC, AD vs MCI,MCI vs HC for ADNI cohorts, and AD vs HC for Huashan cohorts, respectively. Table 7 shows more details on classification accuracy, Area Under Curve (AUC), sensitivity, and specificity using Huashan cohort ROIs. The above results could prove the reliability of our research framework.
Classification accuracy, AUC, sensitivity, and specificity.

AD, Alzheimer’s disease; ADNI, Alzheimer’s Disease Neuroimaging Initiative; AUC, Area Under Curve; HC, healthy control; MCI, mild cognitive impairment; RBF, Radial Basis Function.
Discussion
This study utilized statistical analysis and SVM to investigate whether a radiomic method based on 18F-FDG PET images could be used for AD and MCI computer-aided diagnosis. To prove the stability and generalization of the proposed radiomic method, we selected different samples by different PET scanners with different imaging properties, including samples from the ADNI database and Huashan Hospital. This kind of cross-dataset research approach was frequently used in the radiomic studies to avoid the over-fitting problem, as well as to test the generalization ability of the whole research framework.8,11,12,21–23
To define ROIs, we performed a voxel-based, two-sample, Student’s t test in a group of 30 HCs and 30 AD individuals from ADNI cohorts to determine the brain areas associated with AD pathology. In the subsequent experiments, we regarded the ROIs of AD as those of MCI because the patients with MCI who will be converted to AD have brain tissue lesions similar to those of AD.24–27 As shown in Tables 3 and 4, most of the results are consistent with the typical results reported previously. Ferreira and colleagues found that the medial temporal region is the most consistent neurostructural biomarker for predicting AD, 28 and our results were consistent with this finding (AAL: Temporal_Mid, Temporal_Inf and Temporal_Sup). Occipital lobe regions (AAL: Occipital_Mid, Occipital_Sup, Occipital_Inf), anterior cingulate (AAL: Cingulum_Post, Cingulum_Mid), and the parietal cortex area (AAL: Parietal_Sup, Parietal_Inf, Parietal_Sup) were also identified in agreement with previous studies.28–32 After t test analysis, an ROI template was obtained (Figure 2 and Table 3), and features were extracted from this ROI. In total, 215 radiomic features were extracted for each sample, including intensity, texture, and wavelet features. Recent radiomics research studies usually involved shape features because the target ROIs with various shapes, such as the tumor areas, were segmented manually.8,9,11,13,14,22 However, those shape features were not included in this study. For brain PET studies, preprocessing steps usually include spatial normalization and smoothing. In this study, we followed this preprocessing process, further reducing the effects of shape differences. Moreover, individual heterogeneity in tumors was much higher than that in normal brain tissue. Therefore, our feature set did not contain shape features.
In addition, the stability of 215 radiomic features in brain 18F-FDG PET images was determined, revealing 168 stable features (alpha > 0.8). Stability analyses proved that more than half of the radiomic features would not be disturbed by random errors and imaging noise. Of the 168 stable features, 51 were extremely stable (alpha > 0.95). Stability score analysis was performed in HC samples, and subsequent analyses indicated that radiomic feature values were associated with clinical cognitive scales, which could reflect disease pathology in AD and MCI patients. Obviously, these connections were not caused by random factors. Hence, the stability results proved the reliability of subsequent analyses and indirectly proved that radiomic features contains a wealth of pathological information. The possible association of radiomic features with CDRSB and ADAS was explored based on Pearson’s correlation. We found that many radiomic features that were not studied previously were relevant with cognitive scale values. Here, we studied two scales because ADAS is a scale specifically designed to measure cognitive performance in AD patients. 33 As described in the section Feature selection, two group analyses containing AD patients used ADAS values; however, for MCI patients, we used CDRSB because it is a scale specifically sensitive for MCI measurement. As a result of the feature selection, we found that about 50–70 features were associated with AD through the Pearson correlation coefficient, about 30–40 features were associated with MCI, and about 10–20 features were associated with AD and MCI mixed samples. Jaccard index values of frequently occurring features in Table 6 showed that selected features were consistent with the correlation with disease. These correlations suggested that high-order radiomic features extracted from 18F-FDG PET brain imaging could be used not only for classification diagnosis but also contained rich information related to pathological processes for further study and mining.8–10,22
Importantly, on a 500-times cross-validation experiment based on both ADNI and Huashan cohorts using SVM as a classifier, we found that radiomic features had a distinct ability to classify AD versus HCs, MCI versus HCs and AD versus MCI with maximum average accuracies of 91.5%, 83.1% and 85.9%, respectively. By using the cross-validation method, the above results avoided the bias of test results, and presented the validity of the selected features, and SVM classification. 34 Table 9 lists the results of this paper compared with the results of previous studies, and these methods were complex image classification algorithms based on deep learning techniques. As shown in Table 9, the radiomic method could achieved a satisfied classification accuracy in both AD versus HCs (91.5%) and MCI versus HCs (83.1%) comparable with complex algorithms. Thus, radiomics may have application prospects in the field of AD and MCI diagnosis. Because the significance of the calculation values existing in the neural network framework are unknown, compared with the deep learning framework, another advantage of radiomics is that its features are correlated with AD and MCI clinical scales. Based on this, a future study can investigate the relationship between the radiomic feature values and the disease directly to help physicians carry out personalized and precise treatment. 8
Classification accuracy of existing literature.

AD, Alzheimer’s disease; HC, healthy control; MCI, mild cognitive impairment.
Limitations and further considerations
Although the potential application value of radiomics in the diagnosis of AD and MCI has been proven in the paper, some limitations persist that may influence the results of this study. First, for individuals from ADNI and the Huashan Hospital, their ages and races were not matched. The average age of individuals from ADNI was approximately 72 years and mainly included Europeans and Americans. The average age of individuals from Huashan Hospital was 57 years and mainly included Asians. Whether the differences in age and race will influence the results has not been studied yet and can be explored in subsequent studies.
Second, the shape and some texture features of PET images were lost in the preprocessing step, events that may influence the results. In this study, we used a smooth step and selected the MNI template for image registration and lost some texture and morphology information during the registration process. However, this is a routine step in other AD studies; thus, we followed this preprocessing principle. The effect of these preprocessing methods on the results is unknown and requires follow-up studies.
Third, the pathobiological mechanism concerning the correlation between radiomic features and clinical scale was not explored in this paper. In our current research, we only confirmed that the radiomic features were related to the clinical scale, indicating that there is indeed a correlation between radiomic features and AD/MCI pathology; however, we did not further study the pathobiological mechanism. In future research, the mechanism between each feature and disease should be studied in detail.
Conclusion
In summary, the research in this paper proved that high-order radiomic features extracted from 18F-FDG PET brain images can be used for AD and MCI computer-aided diagnoses. Radiomic features can reflect the pathological information of MCI and AD, and they can diagnose MCI and AD with increased accuracy. The simplicity of the acquisition of radiomic features and its high-throughput nature would constitute powerful tools for personalized precision medicine for the population affected by AD and MCI.
Footnotes
Author Contribution
Yupeng Li and Jiaying Lu have contributed equally to this work.
Funding
This study was supported by the National Science Foundation of China (grant numbers 61603236, 81671239, 81361120393, 81401135, 81771483, and 81361120393), the National Key Research and Development Program of China (grant numbers 2016YFC1306305, 2016YFC1306500, and 2018YFC1707704) from the Ministry of Science and Technology of China, Shanghai Technology and Science Key Project in Healthcare (grant number 17441902100), Science and Technology Commission of Shanghai Municipality (grant number 17JC1401600), and the Open Project Funding of Human Phenome Institute (grant number HUPIKF2018203), Fudan University. Data collection and sharing for this project were funded by the Alzheimer’s Disease Neuroimaging Initiative (ADNI; National Institutes of Health Grant U01 AG024904) and DODADNI (Department of Defense, award number W81XWH-12-2-0012). ADNI is funded by the National Institute of Aging and the National Institute of Biomedical Imaging and Bioengineering and through generous contributions from the following: AbbVie, Alzheimer’s Association; Alzheimer’s Drug Discovery Foundation; Araclon Biotech; BioClinica, Inc.; Biogen; Bristol-Myers Squibb Company; CereSpir, Inc.; Eisai, Inc.; Elan Pharmaceuticals, Inc.; Eli Lilly and Company; EuroImmun; F. Hoffmann-La Roche Ltd. and its affiliated company Genentech, Inc.; Fujirebio; GE Healthcare; IXICO Ltd.; Janssen Alzheimer Immunotherapy Research & Development, LLC.; Johnson & Johnson Pharmaceutical Research & Development LLC.; Lumosity; Lundbeck; Merck & Co., Inc.; Meso Scale Diagnostics, LLC.; NeuroRx Research; Neurotrack Technologies; Novartis Pharmaceuticals Corporation; Pfizer, Inc.; Piramal Imaging; Servier; Takeda Pharmaceutical Company; and Transition Therapeutics. The Canadian Institutes of Health Research is providing funds to support ADNI clinical sites in Canada. Private sector contributions are facilitated by the Foundation for the National Institutes of Health (![]() ). The grantee organization is the Northern California Institute for Research and Education, and the study is coordinated by the Alzheimer’s Disease Cooperative Study at the University of California, San Diego, CA, USA. ADNI data are disseminated by the Laboratory for Neuro Imaging at the University of Southern California, CA, USA.
). The grantee organization is the Northern California Institute for Research and Education, and the study is coordinated by the Alzheimer’s Disease Cooperative Study at the University of California, San Diego, CA, USA. ADNI data are disseminated by the Laboratory for Neuro Imaging at the University of Southern California, CA, USA.
Conflict of interest statement
The authors declare that there is no conflict of interest.