
Abstract
Background:
Based on the hyperexcitability and disinhibition observed in patients with restless legs syndrome (RLS) following transcranial magnetic stimulation (TMS), we conducted a study with low-frequency repetitive TMS (rTMS) over the primary motor (M1) and somatosensory cortical areas (S1) in patients with RLS.
Methods:
A total of 13 right-handed patients and 10 age-matched controls were studied using clinical scales and TMS. Measurements included resting motor threshold (rMT), motor-evoked potentials (MEPs), cortical silent period (CSP), and central motor conduction time (CMCT). A single evening session of rTMS (1 Hz, 20 trains, 50 stimuli each) was administered over the left M1, left S1, and sham stimulation over M1 in a random order. Clinical and TMS measures were repeated after each stimulation modality.
Results:
Baseline CSP was shorter in patients than in controls and remained shorter in patients for both motor and somatosensory stimulation. The patients reported a subjective improvement of both initiating and maintaining sleep the night after the rTMS over S1. Patients exhibited a decrease in rMT after rTMS of S1 only, although the effect was smaller than in controls. MEP latency and CMCT changed only in controls after stimulation. Sham stimulation was without effect on the observed variables.
Conclusions:
rTMS on S1-M1 connectivity alleviated the sensory–motor complaints of RLS patients. The TMS indexes of excitation and inhibition indicate an intracortical and corticospinal imbalance, mainly involving gamma-aminobutyric acid (GABA)ergic and glutamatergic circuitries, as well as an impairment of the short-term mechanisms of cortical plasticity. The rTMS-induced activation of the dorsal striatum with the consequent increase of dopamine release may have contributed to the clinical and neurophysiological outcome.
Introduction
Restless legs syndrome (RLS) can be regarded as a sensory–motor network disorder with a modified excitability of a complex corticospinal drive involved in both somatosensory perception and movement generation.1,2 In particular, changes in cortical excitability revealed by transcranial magnetic stimulation (TMS), that is dysfunctional inhibitory control and sensory–motor integration, have been proposed as the pathomechanism of the disease.3–8 Structural and functional neuroimaging studies have also shown alterations in the sensory–motor cortices and white matter tracts in RLS patients.9–11 Overall, these findings seem to reflect a disease-specific pattern rather than a general consequence of the sleep architecture alteration.8,12–14
TMS is a painless and noninvasive neurophysiologic technique capable of assessing the excitability of the primary motor cortex (M1) and the corticospinal tract in vivo.15–20 Stimulation of M1 generates motor-evoked potentials (MEPs) in contralateral muscles that can be recorded by surface electromyography (EMG), thus providing relevant information in physiological conditions and in a variety of neurological21–31 and psychiatric disorders,32–35 also with prognostic and therapeutic implications.36–42 The paradigm of repetitive stimulation (rTMS), which delivers long trains of closely spaced pulses, is able to transiently modulate the excitability of the stimulated and connected areas. This depends primarily on the stimulation frequency, with a high frequency usually causing excitatory and a low frequency causing inhibitory effects.43–47 The neurobiological mechanisms underlying these effects are only partially known, although they appear to be related to phenomena of long-term potentiation (LTP) and long-term depression (LTD) in the central nervous system (CNS).21,46–48 Moreover, the modulation of specific cells and neural circuits may induce neurotransmitter release, altered gene activity, and changes in regional cerebral blood flow.46,49
To date, although dopamine (DA) agonists are usually effective and well tolerated in the first-line treatment of RLS, some patients report an incomplete response. Moreover, drug-emergent problems, such as DA dysregulation syndrome or augmentation, may limit their use for long-term therapy.2,50 Interestingly, the ability of rTMS of the human motor cortex to induce DA release from the basal ganglia opens a potentially wide spectrum of clinical applications in both sleep and movement disorders,51–53 particularly in the therapy of RLS, where the required DAergic doses are markedly lower than those in Parkinson’s disease (PD).
Based on the hyperexcitability and disinhibition to TMS reported in most studies on RLS,8,12,13 consistent with a hyperarousal state in the electroencephalogram (EEG) at sleep onset, 54 the present study was designed to investigate the effects of low-frequency rTMS of M1 in patients with RLS for the first time. Moreover, as subjective reports by patients indicate an essentially sensory disturbance at sleep onset, 2 we also studied the effects of rTMS over the primary somatosensory cortex (S1). Previous studies in different clinical contexts have demonstrated that low-frequency rTMS of S1 can modulate somatosensory processing, and that changes in S1 excitability influence neural mechanisms underpinning somatosensation, M1 function, and motor control.55–59 We therefore hypothesized that the rTMS-mediated modulation of cortical excitability within the sensory–motor network might decrease the symptoms of patients with RLS. To objectively quantify the neurobiological impact of rTMS, we compared clinical and TMS variables before and after each stimulation procedure.
Methods
Participants and baseline assessment
A total of 13 right-handed RLS patients (3 males and 10 females; median age 68.0 years, range 53.0–72.0 years) with a median disease duration of 8.8 years (range 2.0–15.0 years), and 10 age-matched healthy controls (4 males and 6 females; median age 57.5 years, range 51.0–63.0 years) were consecutively recruited from the Sleep Research Centre of the Oasi Research Institute - IRCCS, Troina, Italy. The inclusion criteria were: (a) duration of RLS ⩾ 1 year; (b) symptoms ⩾ three times/week; (c) International Restless Legs Syndrome Rating Scale score 60 (IRLS-RS) ⩾ 20, indicating severe symptoms. Patients were examined by three clinical neurologists with expertise in sleep medicine (BL, FIIC, RF). Conventional polysomnography (PSG) performed on the patients met the diagnostic criteria for RLS according to the latest consensus by the International RLS Study Group. 61 None of the patients were given pharmacological agents for the duration of the procedure. Patients who had been on medication for RLS (pramipexole, three; clonazepam, one; diazepam, one; combination pramipexole/clonazepam one) underwent a drug washout period prior to the enrolment (1 week for diazepam and clonazepam; 72 h for pramipexole). All controls were drug free. One RLS patient and one control subject had a positive family history for RLS.
At baseline, all subjects were evaluated for clinical and hypnological features. These included age, sex, education, handedness, social and living conditions, general and neurological clinical examinations, cognitive status screening (Mini Mental State Examination—MMSE), 62 and co-morbidities. The right-handedness of the participants was assessed according to the Edinburgh Handedness Inventory. 63 The hypnological scales included: rating of daytime sleepiness (Epworth Sleepiness Scale, ESS), 64 severity of insomnia (Insomnia Severity Index, ISI), 65 and severity of RLS symptoms (IRLS-RS). 60 Moreover, an ad hoc visual analog scale (VAS) was prompted, in which the respondent reported a score between 0 and 10 (0 = extremely poor; 10 = extremely good) that best reflected the subjective quality of initiating and maintaining sleep. General and neurological examinations were unremarkable in all participants. No relevant comorbidity was present, except for hypertension (three patients and one control), dyslipidemia (three patients), and obesity (one patient and one control).
Exclusion criteria were: age < 18 years; other sleep disorders, such as obstructive sleep apnea syndrome, chronic insomnia, abnormal sleep–wake rhythm, narcolepsy, clinical conditions known to be associated with RLS (e.g. renal failure, anemia, low serum iron and ferritin levels, pregnancy), disorders with symptoms similar to RLS, such as neuroleptic-induced akathisia, vascular or neurogenic claudication, neuropathic pain, leg cramps, myelopathy, and osteoarthritis, major psychiatric or neurological disorders, an MMSE score < 24, acute or chronic uncontrolled medical conditions, alcohol or illicit drug abuse, current intake of psychoactive medication or other drugs known to modulate cortical excitability,66,67 any condition precluding TMS. 68 A conventional EEG obtained prior to entry into the study was normal in all subjects. Although a normal EEG does not rule out a predisposition to seizures, none of the participants had had a previous seizure, suffered from epilepsy, or was taking antiepileptic drugs. Radicular or peripheral nerve pathology was ruled out by a preliminary conduction study of the right ulnar nerve including the F-wave. Results of routine laboratory tests (including hemoglobin, iron, ferritin, urea, creatinine, vitamin B12, folic acid, thyroid hormone, and HbA1c) and brain magnetic resonance imaging scans (1.5 Tesla) were within the normal limits in all participants.
The study, performed in accordance with the 1964 Declaration of Helsinki and its later amendments, has been approved by the Ethics Committee ‘CE IRCCS Sicilia—Oasi Maria SS’ on October 25, 2016 (Approval ID: 2016/CE-IRCCS-OASI/1). Participants gave their written informed consent after a full explanation of the whole procedure. The consent was for inclusion in the present study. The stimulations and assessments were performed in a controlled laboratory environment by experienced personnel (GL, MC, DA, BL). The participants returned to their homes after the stimulation to sleep in their own beds and returned the following week to complete the protocol, as described below.
Experimental design
This study compared real rTMS over M1 and S1 as well as sham stimulation in RLS patients and controls. Each participant underwent three sessions on 3 different days, each of which was separated by a 1-week interval (Figure 1). One session was real rTMS over M1 (M1-rMTS), one was real rTMS over S1 (S1-rTMS), and in one session, sham stimulation was applied over M1. The participants were blinded with respect to the stimulation modality. The order of the stimulation modalities for each participant was determined by a list of random numbers generated by an operator who was not involved in the study. The patients consented to remaining drug-free during the study period in order to better quantify any response induced by the different stimulation modalities. Single-pulse TMS and VAS were performed immediately after each session. Any adverse effect was recorded for each participant.
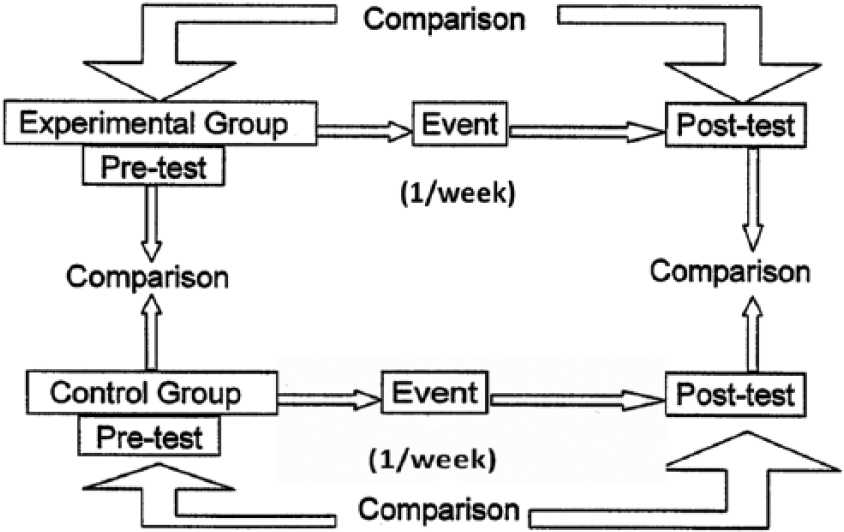
Schematic representation of the experimental design of the present study.
Transcranial magnetic stimulation
Single-pulse TMS was performed using a high-power Magstim 2002 magnetic stimulator (Magstim Co., Whitland, Dyfed, UK). An air-cooled, 70 mm figure-of-eight coil was positioned over the left M1 in the optimal location for eliciting MEPs in the contralateral first dorsal interosseous (FDI) muscle. The flat surface of the coil was positioned tangentially at a degree of 45° on the scalp, as recommended. 69
EMG activity was recorded using an active Ag/AgCl surface electrode placed over the motor point of the FDI muscle. The reference electrode was placed at the metacarpal–phalangeal joint of the index finger and the ground electrode over the radial surface of the wrist. Motor responses were amplified and filtered (bandwidth 3–3000 Hz) using a system with an amplification factor of the screen of 100 μV per division unit for the measurement of resting motor threshold (rMT), and 1 mV per division unit during the MEP recording. The temporal resolution of the screen was 5 ms per division unit so that the TMS artifact, the beginning and the end of the MEP were all always visible. 69
Measures of motor cortex excitability included rMT, cortical silent period (CSP), MEP latency and amplitude, and central motor conduction time (CMCT). Resting MT was defined according to the recommendations of the International Federation of Clinical Neurophysiology (IFCN) Committee 69 as the lowest stimulus intensity able to elicit an MEP with an amplitude > 50 μV in at least 5 of 10 trials with the muscle at rest. Using a stimulus intensity of 110% rMT, MEP latency was calculated for each trial as the temporal interval from the TMS artifact to the first deflection of muscular response from EMG baseline. As recommended, the MEP with the shortest corticomotor latency was used for analysis for each subject, since it is known to reflect the optimal conduction from M1 to the target muscle. 69 The peak-to-peak amplitude of the motor responses was considered as the mean MEP amplitude. CMCT was calculated by subtracting the conduction time in the peripheral nerve obtained by magnetic stimulation of the cervical root (peripheral motor latency) from the MEP cortical latency obtained during moderate active muscle contraction. 69 CSP was determined during an approximately 50% maximal tonic voluntary contraction of the FDI muscle induced by contralateral TMS pulses delivered at 110% of the rMT. Following the IFCN guidelines, mean CSP duration based on trial-by-trial measurement of 10 rectified traces was calculated. In a single trial, CSP was measured as the time elapsing from the onset of MEP until the recurrence of voluntary EMG activity. 69
All measurements were conducted while the participants were comfortably seated on a dedicated chair, with a head restraint applied, to prevent movements. Continuous EMG monitoring ensured either a constant level of muscle activity during tonic contraction or a complete relaxation at rest. Data were collected on a computer and stored for offline analysis.
Repetitive transcranial magnetic stimulation
rTMS was performed with the same set up as for single pulse TMS. The participants wore earplugs during the stimulation. Coil temperature was constantly monitored both before and during the procedure. The same operators performed every stimulation modality, at the same lab and at the same time of day (approximately 7 p.m.).
The stimulus intensity used in each session was fixed at 110% of the determined rMT and maintained constantly throughout the procedure for each participant. In the sessions with actual rTMS, the coil was applied tangentially to the head above the area to be stimulated. In sham stimulation, the coil was tilted 90°, that is edge on to the scalp surface, thus imitating stimulation. While sham stimulation used the same coil as for actual rTMS and was associated with an identical level of sound produced by the capacitor discharge, it did not induce the same cutaneous sensations that a ‘sham coil’ would have.
For repetitive transcranial magnetic stimulation over the primary motor cortex (M1-rTMS) and sham stimulation, the coil was positioned as for single-pulse TMS. For S1-rTMS, the coil was applied 2 cm posterior to C3’ in the 10–20 EEG system. Before beginning S1-rTMS session, the position was verified using single stimulation pulses to ensure that the stimulation did not elicit muscle activity. EMG recording was supplemented by visually observing the participant’s hand for any stimulation-associated movement. Previous studies had shown that a 70 mm coil can deliver focal stimulation with a current spread small enough (10 × 10 × 20 mm3) to independently stimulate M1 and S1.70,71 Once determined, the location for S1 stimulation and the orientation of the coil were kept constant.
In each rTMS session, 20 trains of 1 Hz stimulation were applied. Each train consisted of 50 stimuli with an intertrain interval of 30 s, giving a total of 1000 stimuli per session. This setup is consistent with those employed in previous rTMS studies in RLS patients,72–74 although the parameter configuration and stimulation modalities were specifically customized.
Statistical analysis
Nonparametric tests were used for statistical analysis because of the non-normal data distribution. The results obtained during the different stimulation sessions within each group (patients and controls) were analyzed using the Friedman ANOVA for paired datasets, while the Mann–Whitney U test was used for between-group comparisons, followed by a Bonferroni correction for multiple comparisons. A p value of <0.05 was considered statistically significant.
Results
All participants completed the study with a good compliance. No adverse effect was reported during or after the procedures, and none of the patients complained of augmentation according to the established criteria 75 before entering the study.
Biometric and sleep-related characteristics of the participants are summarized in Table 1. As expected, patients exhibited significantly more daytime sleepiness and symptoms of insomnia than controls. Patients had consistently worse scores for initiating and maintaining sleep than control persons. Compared with baseline, patients perceived a subjective improvement in both initiating and maintaining sleep the night after the S1-rTMS session but not after M1-rTMS (Figure 2).
Clinical and hypnological characteristics of patients and controls.

Significant after Bonferroni correction; numbers in bold, statistically significant p values.
ESS, Epworth Sleepiness Scale; IRLS-RS, International Restless Legs Syndrome Rating Scale; ISI, Insomnia Severity Index; MMSE, Mini Mental State Examination; NS, not significant; PLMS, Periodic Limb Movement of Sleep; RLS, restless legs syndrome.

Subjective clinical effect on initiating and maintaining sleep, evaluated by means of a visual analog scale, in patients and controls with respect to the different stimulation modalities.
At baseline, patients had a shorter CSP duration than healthy subjects (Figure 3), whereas the other TMS measures did not differ between the groups. Compared with controls, patients did not exhibit the prolongation of CSP after M1-rTMS; moreover, regardless of the stimulation modality, CSP duration remained persistently shorter in patients than in controls (Figure 3). In the control persons, rMT increased after M1-rTMS (as an index of hypoexcitability due to the inhibition of the motor cortex),76,77 and decreased after S1-rTMS (as a result of motor cortex facilitation, likely due to the lack of physiological inhibition from the somatosensory cortical areas)58,59,78 (Figure 3). Resting MT decreased in both patients and controls after S1-rTMS, but the effect was less pronounced in patients than in controls (Figure 3).
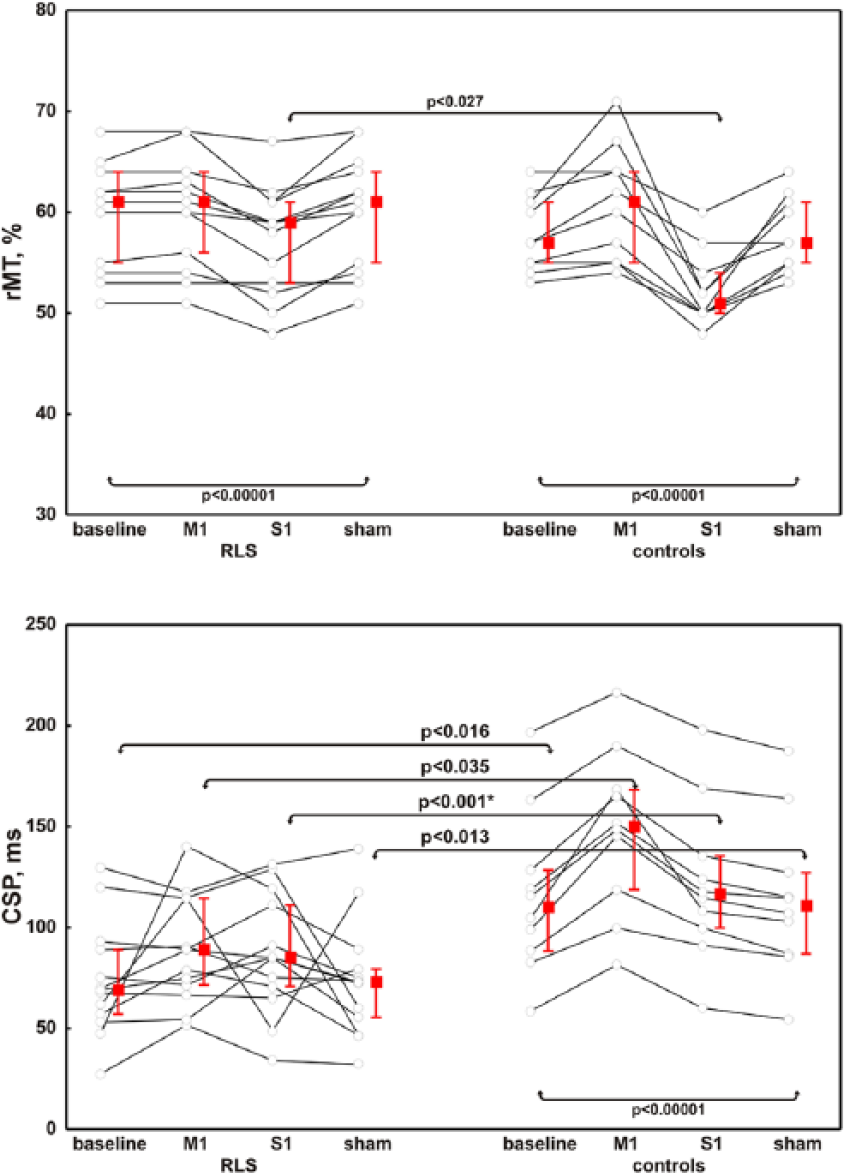
Resting motor threshold and the cortical silent period in patients and controls with respect to the different stimulation modalities.
With regard to corticospinal conductivity, MEP amplitude decreased in both groups after M1-rTMS, while parallel changes of MEP latency and CMCT were only seen in control persons following M1 and S1 stimulation (Figures 4, 5). Peripheral motor latency measured after magnetic stimulation of the cervical roots showed no significant changes in either group regardless of the stimulation modality (Figure 5).

Latency and amplitude of the motor-evoked potential in patients and controls with respect to the different stimulation modalities.

Peripheral latency of motor-evoked potential and the central motor conduction time in patients and controls with respect to the different stimulation modalities.
Sham stimulation had no clinical or electrophysiological effects.
Discussion
Main findings
The main finding of this study is tat a single evening session of inhibitory rTMS applied over the M1-S1 network was able to transiently alleviate the clinical complaints of RLS patients with regard to initiating or maintaining sleep. This short-term effect was obtained after a non-invasive and painless inhibition of M1 but especially of S1 in RLS patients. No similar effect was seen in controls or after sham stimulation.
This result adds further evidence to the role of rTMS in effectively modulating sensory–motor connectivity and central sensitization processes, both considered to be dysfunctional in RLS.1,79,80 Although the underlying neurochemical explanation was not directly evaluated in this study, it might be associated with an rTMS-induced activation of the ipsilateral dorsal striatum (putamen and caudate nucleus), probably through the corticostriatal projections, with the consequent increase in endogenous DA release.79,80 In addition, DA acting on D2 receptors plays a role in descending inhibitory control and in preventing abnormal somatosensory processing at several CNS sites, including the dorsal striatum, hypothalamus A11-cell group, and spinal cord. 81 Nevertheless, it is worth remembering that in clinical application, a single rTMS session is expected to be less effective than repeated sessions. 82 In an earlier study, Khedr and colleagues suggested that the effect of a single rTMS session might involve either a presynaptic action from corticostriatal terminals on DAergic inputs to the striatum, or a more complex route involving input from cortex to brainstem DAergic neurons. 83 However, in the same study, it was noted that these effects would only lead to transient increases in DA levels. 83 Therefore, repeated rTMS sessions are probably needed to induce more DA release and therefore long-lasting clinical effects.83–85
From a neurophysiological point of view, CSP elongation in control persons after low-frequency rTMS on M1 confirms the presence of a normal balance between intracortical inhibition and facilitation. This is thought to be the result of an increased gamma-aminobutyric acid (GABA)-mediated tonus via the temporal summation of intracortical inhibitory interneurons.16,19,66,67 Conversely, RLS patients exhibited only partial inhibitory rTMS-induced changes in cortical excitability. In this context, it is known that low-frequency rTMS increases the firing threshold of intracortical interneurons, thus inducing short-term synaptic suppression, a phenomenon that depends mainly on GABAergic activation and accounts for MEP inhibition.76,77 In the patients studied here, both the shortening of CSP at baseline and the absence of CSP change after rTMS might be considered as a correlate of GABA involvement in RLS pathophysiology.43,44,46 This finding is in accordance with the occurrence of recurrent CSPs in RLS (i.e. increased number of separate compounds of CSP), which could be considered as an additional sign of a dysfunctional inhibitory control system. 86
Regarding measures of excitation, rMT is considered to be a global index reflecting the excitation state of the corticospinal cells and intracortical interneurons,16,17,19–21 mainly mediated by glutamatergic transmission.66,67 Although baseline rMT was similar in patients and controls, it did not increase in patients after M1-rTMS. Similarly, the latency of the motor responses, which reflects the balance between inhibitory and excitatory intracortical circuits and the intracortical projections into the corticospinal neurons,21,69 changed consistently with the different stimulation modalities in controls but not in patients. Taken together, these results lead to the hypothesis that glutamate circuitries are also involved in RLS.
Interestingly, the segmental root and peripheral nerve excitability of patients and controls were similar and did not change significantly after stimulation, suggesting that it was unlikely that a ‘peripheral component’ contributed to the observed results. Finally, it is worth mentioning that placebo treatment is known to activate both DA and endogenous opioid peptides in the nucleus accumbens, both of which are related to RLS treatment. 87 However, since the neurophysiological measures performed after the sham procedure had shown no significant difference within or between groups, a placebo effect alone can hardly have been responsible for the obtained results.
From a strictly clinical perspective, the results of the present study are consistent with the few reports already published. However, the methods used here differ significantly in that to the best of our knowledge, no previous study has tested low-frequency rTMS in RLS, or has stimulated the S1, or has probed cortical excitability before and after rTMS. A previous controlled pilot study found an improvement in the IRLS-RS scores after high-frequency rTMS over the supplementary motor area (SMA). 72 Similar results were found using 2-week sessions of high-frequency rTMS on the leg cortical representation, with long-lasting improvement of motor symptoms, sleep disturbances, and anxiety. 74 Finally, high-frequency rTMS delivered to the leg area of M1 may raise functional activity in the sensory–motor and occipital regions, leading to symptom improvement and providing intriguing insights into RLS pathophysiology. 73 Nevertheless, it was speculated that low-frequency rTMS might be even more beneficial for RLS patients, in whom the corticospinal system is hyperexcitable. 72 Accordingly, in a previous study comparing low-frequency (1 Hz) and high-frequency (10 Hz) rTMS over the SMA in a different model of disease (PD), Shirota and co-workers demonstrated that only the former was effective in improving motor symptoms in patients with PD. 88 Overall, it cannot be excluded that either excitatory rTMS of M1 (by direct stimulation) or inhibitory rTMS of SMA or S1 (through an indirect effect on M1) might produce similar clinical effects on the sensory–motor complaints of RLS patients.
Limitations
A number of potential limitations and critical aspects should be taken into account with regard to both this study and the technique itself. First of all, as usual in TMS research, sample sizes were relatively small, although the patients were very homogeneous in terms of clinical and sleep features and were age-matched with healthy controls. Secondly, PSG was not repeated after the rTMS sessions, and we cannot therefore infer possible correlations between PSG and TMS data. Third, using a self-reported VAS of sleep latency and quality following rTMS cannot provide an objective quantification of these measures, although it was an easy-to-use and feasible tool. Fourth, using a hand muscle for MEP recordings in RLS might not be optimal, although TMS measures have been shown to be involved even when recording over the hand. 12 In addition, the well-known technical difficulties in MEP recordings from lower limbs may have affected the reproducibility of the results. 69 Fifth, data on S1-rTMS are not as robust as the traditional stimulation of M1 because the sensory system cannot be targeted as precisely as the motor system. Therefore, determining to what extent cortical responses of the motor system are representative of nonmotor cortical areas needs additional work, though the present study may help in addressing this question. And finally, although the inter- and intra-individual variability was kept to the lowest possible level, a neuronavigated system would have allowed a more precise localization of the cortical targets, especially when stimulating nonmotor areas.
Conclusion
Findings from this investigation, although preliminary, might be viewed as a potential target for customized, noninvasive brain stimulation protocols that would represent a first step in the development of new pharmacological and nonpharmacological therapeutic options for RLS. rTMS integrated with clinical, sleep-related, and neuroimaging data was confirmed to be an effective tool in transiently modulating cortical excitability and inducing short-term synaptic plasticity in RLS. Further studies with larger numbers of participants, repeated sessions, an optimized rTMS setup, and clinical follow-up should be encouraged in order to validate these results and to expand clinical and research interest towards neuromodulation in RLS and other sleep disorders.