
Abstract
Background:
Evidence suggests a relationship between ustekinumab (UST) concentrations and therapeutic outcomes in inflammatory bowel disease.
Objectives:
This study aimed to evaluate the association between UST concentrations during the induction phase and treatment outcomes at week 24 in patients with Crohn’s disease (CD) and ulcerative colitis (UC). The primary outcome was endoscopic remission at week 24, defined as a simple endoscopic score (SES-CD) ⩽2 for CD and a Mayo endoscopic score = 0 for UC. Secondary outcomes included endoscopic response, clinical remission, and treatment persistence.
Design:
This was a prospective observational study assessing clinical and endoscopic outcomes in CD and UC patients starting UST therapy.
Methods:
Consecutive patients with CD and UC were included at the initiation of UST treatment. Trough UST concentrations were measured at weeks 8, 16, and 24 after the first intravenous dose, and the main outcomes were assessed at week 24. Endoscopic and clinical parameters were used to evaluate treatment efficacy and persistence.
Results:
Seventy patients (45 with CD) were enrolled. Those achieving endoscopic remission and response at week 24 had higher UST levels at week 8 (4.5 vs 2.6 μg/mL, p = 0.0028; 4.1 vs 2.4 μg/mL, p = 0.0024, respectively). Patients with UST concentrations in the fourth quartile (Q4) at week 8 (>4.5 μg/mL) had higher rates of endoscopic remission (66.7% (Q4) vs 20% (Q1); 33.3% (Q2); 28.6% (Q3); p = 0.012). A UST concentration threshold of 4.5 μg/mL at week 8 was the best predictor of endoscopic remission (AUC = 0.7, sensitivity 54.5%, specificity 83.8%), while 3.5 μg/mL predicted endoscopic response (AUC = 0.732, sensitivity 53.8%, specificity 87%). Longer disease duration correlated with a higher risk of UST discontinuation (odds ratio, 1.034, 95% confidence interval, 1.002–1.068, p = 0.035). Higher UST concentrations in Q4 did not result in greater drug persistence (p = 0.319).
Conclusion:
UST concentrations at week 8 were positively associated with endoscopic outcomes at week 24, with a threshold of 4.5 μg/mL reliably predicting endoscopic remission. Further randomized clinical trials are warranted to explore whether optimizing UST treatment based on post-induction concentrations can enhance therapeutic outcomes.
Plain language summary
This study looked at how the concentration of the drug ustekinumab (UST) during the first weeks of treatment affects gut healing in patients with Crohn’s disease and ulcerative colitis, two types of inflammatory bowel disease (IBD). The researchers followed 70 patients starting UST treatment and measured drug levels in the blood at week 8; then checked how well the treatment was working at week 24 based on clinical symptoms and findings in colonoscopy. Patients with higher UST levels at week 8 were more likely to have better healing of the bowel mucosa at week 24. In particular, patients with UST levels above 4.5 micrograms per milliliter had the best results. This level was a good predictor of who would achieve intestinal healing. However, a higher drug level did not mean that the treatment lasted longer overall. These results suggest that measuring UST levels at the start of treatment could help doctors predict how well a patient will respond to treatment and influence treatment decisions. Further research is needed to confirm that adjusting doses based on early drug levels can improve outcomes for patients with IBD.
Keywords
Introduction
Crohn’s disease (CD) and ulcerative colitis (UC) are chronic, debilitating, immune-mediated inflammatory bowel diseases (IBD) with a relapsing-remitting clinical pattern. 1 Demand for new therapeutic agents is mandatory given the high rates of primary non-response and secondary loss of response to existing biologic and small molecule treatments.2–6
Therapeutic drug monitoring (TDM) has proven to be a useful tool to optimize response to anti-tumor necrosis factor-alpha (anti-TNF-a) treatment in IBD.7–10 Indeed, it has been shown to improve clinical outcomes and quality of life, as well as provide pharmacoeconomic and pharmacokinetic benefits. 11 The rationale for TDM is based on the correlation between serum drug concentrations and therapeutic outcomes. 12 The question of whether a reactive or a proactive strategy for TDM is preferable and in which situations is useful is still a matter of debate.
Ustekinumab (UST) is a monoclonal antibody targeted against the common p40 subunit of interleukin (IL)-12/IL-23. 13 Positive results from clinical trials led to the approval of UST for both CD and UC.14,15 Post hoc analysis of these studies showed a positive relationship between serum exposure and response.16–18 Interestingly, UST serum concentrations did not show an association with adverse events, including infections.
In the STARDUST trial, 19 an increase in endoscopic response and remission rates was observed with increasing UST concentration at week 48. In the SEAVUE study, 20 patients in the higher quartiles of UST concentration at week 48 had better endoscopic response rates at week 52.
To date, there is a paucity of published real-world data on UST concentrations, particularly in UC patients. This is critical to translate the results of randomized controlled trials into clinical practice. Confirming the relationship between UST concentrations and therapeutic outcomes is of paramount importance for the ultimate implementation of UST-TDM. However, the greatest uncertainty rests on the timing of UST serum concentration determination and UST threshold.
Therefore, we aimed to investigate the relationship between UST serum concentrations and clinical, biochemical, and endoscopic outcomes in the short and medium term in a real-world setting, and to establish a UST concentration threshold right after induction.
Materials and methods
Study design and patients
This was a prospective observational cohort study conducted at the Vall d’Hebron University Hospital in Barcelona, Spain. Consecutive adult patients with moderate to severe CD and UC patients were evaluated after starting treatment with UST between June 2022 and September 2023. The reporting of this study conforms to the Strengthening the Reporting of Observational Studies in Epidemiology (STROBE) statement.
Patients received an initial weight-adjusted intravenous (IV) infusion of UST (260 mg if body weight <55 kg, 390 mg if body weight was between 55 and 85 kg, and 520 mg if body weight >85 kg). Maintenance therapy consisted of 90 mg subcutaneous (SC) UST every 4 or 8 weeks, or 130 mg IV UST every 4 weeks. Intensification strategies were determined at the physician’s discretion.
Patients without objective disease activity (endoscopic or radiologic) at baseline or without UST levels measured during follow-up were excluded. Patients who required a third party to sign the consent form were also excluded from the study. All patients underwent an endoscopic examination as routinely performed in our clinical practice from week 24 of treatment.
Data collection
Patients’ demographic and clinical characteristics were collected. Follow-up visits were scheduled for all patients at 0, 8, 16, and 24 weeks. At each visit, clinical assessment was performed using the Harvey-Bradshaw Index (HBI) for CD and the partial Mayo score (PMS) for UC, and blood samples were collected to measure biochemical markers (C-reactive protein and fecal calprotectin) and UST trough concentrations. Serious adverse events during follow-up were recorded, and changes in therapy were documented.
All patient identifiers were removed so the identity of the patients cannot be determined in any way.
Outcome definitions
The primary outcome used to assess the exposure–effectiveness relationship was endoscopic remission at week 24. Endoscopic remission was chosen over clinical or biochemical outcomes because of its robustness. Secondary endpoints included clinical response and endoscopic improvement.
Endoscopic remission was defined as simple endoscopic score (SES-CD) ⩽2 and Mayo endoscopic score (MES) 0 for CD and UC, respectively; clinical remission was defined as HBI of ⩽4 and PMS ⩽1 for CD and UC, respectively; and endoscopic improvement was defined as ⩾50% reduction in SES-CD for CD and ⩾1 point reduction in MES for UC with MES <2.
All reported outcomes in the study results are steroid-free.
Analytical assays
UST samples were collected before each UST injection at week 8, week 16, and week 24 after the first IV dose. Analyses of concentrations and antibodies to UST were performed at our center using a drug-tolerant chemiluminescent immunoassay laboratory technique. The assay’s determination range was from 0.1 to 10 µg/mL. The antibody determination range was from 1 to 250 AU/mL.
Sample size calculation and statistical analysis
Assuming the endoscopic remission rate at week 24 would be 35%, a sample size of 70 subjects would have 80% power to detect an odds ratio (OR) of 2.5 per standard deviation increase in the drug’s serum level at an alpha level of 0.05. Descriptive statistics were presented as percentages for categorical variables and as medians and interquartile ranges for continuous variables. The percentage of patients achieving UST outcomes was calculated. Student’s t test and Mann–Whitney U test were used to analyze differences in UST serum concentrations between outcome groups. Quartile analysis was also used to investigate an association between serum drug concentrations and clinical and endoscopic outcomes.
Time to treatment discontinuation was analyzed using the Kaplan–Meier method, and patients were censored at their last follow-up visit.
Logistic and Cox proportional hazards regressions were performed to identify variables associated with endoscopic remission at week 24 and treatment discontinuation, respectively. The variables examined were gender, age, disease (CD vs UC), disease duration, disease behavior, previous surgery, presence of perianal disease, number of previous advanced treatments, basal fecal calprotectin, initial dosing scheme, and concomitant corticosteroids. Variables with a p-value of <0.05 in the univariate analysis were included in the multivariate analysis, and those with a p-value of <0.05 were considered statistically significant. ORs and hazard ratios with 95% confidence intervals (CIs) were reported.
The diagnostic performance of UST concentrations was assessed with receiver operating characteristic (ROC) curve analysis. A two-sided p-value of <0.05 was considered significant. Statistical analyses were performed with IBM® SPSS® Statistics version 26.0.0.1 (IBM Corp., Armonk, NY, USA).
Results
A total of 70 patients were enrolled. Patients reaching each follow-up visit are depicted in Figure 1. Baseline characteristics are shown in Table 1. Two-thirds of the patients had CD. The median age at UST induction was 46 years, and the median disease duration was 11.5 years. Only nine patients (12.9%) were biologic naïve. At UST initiation, all patients had biochemical, endoscopic, and/or radiologic activity, and one-third were on concomitant steroid treatment.

Flow chart of patients included in the study.
Baseline characteristics.
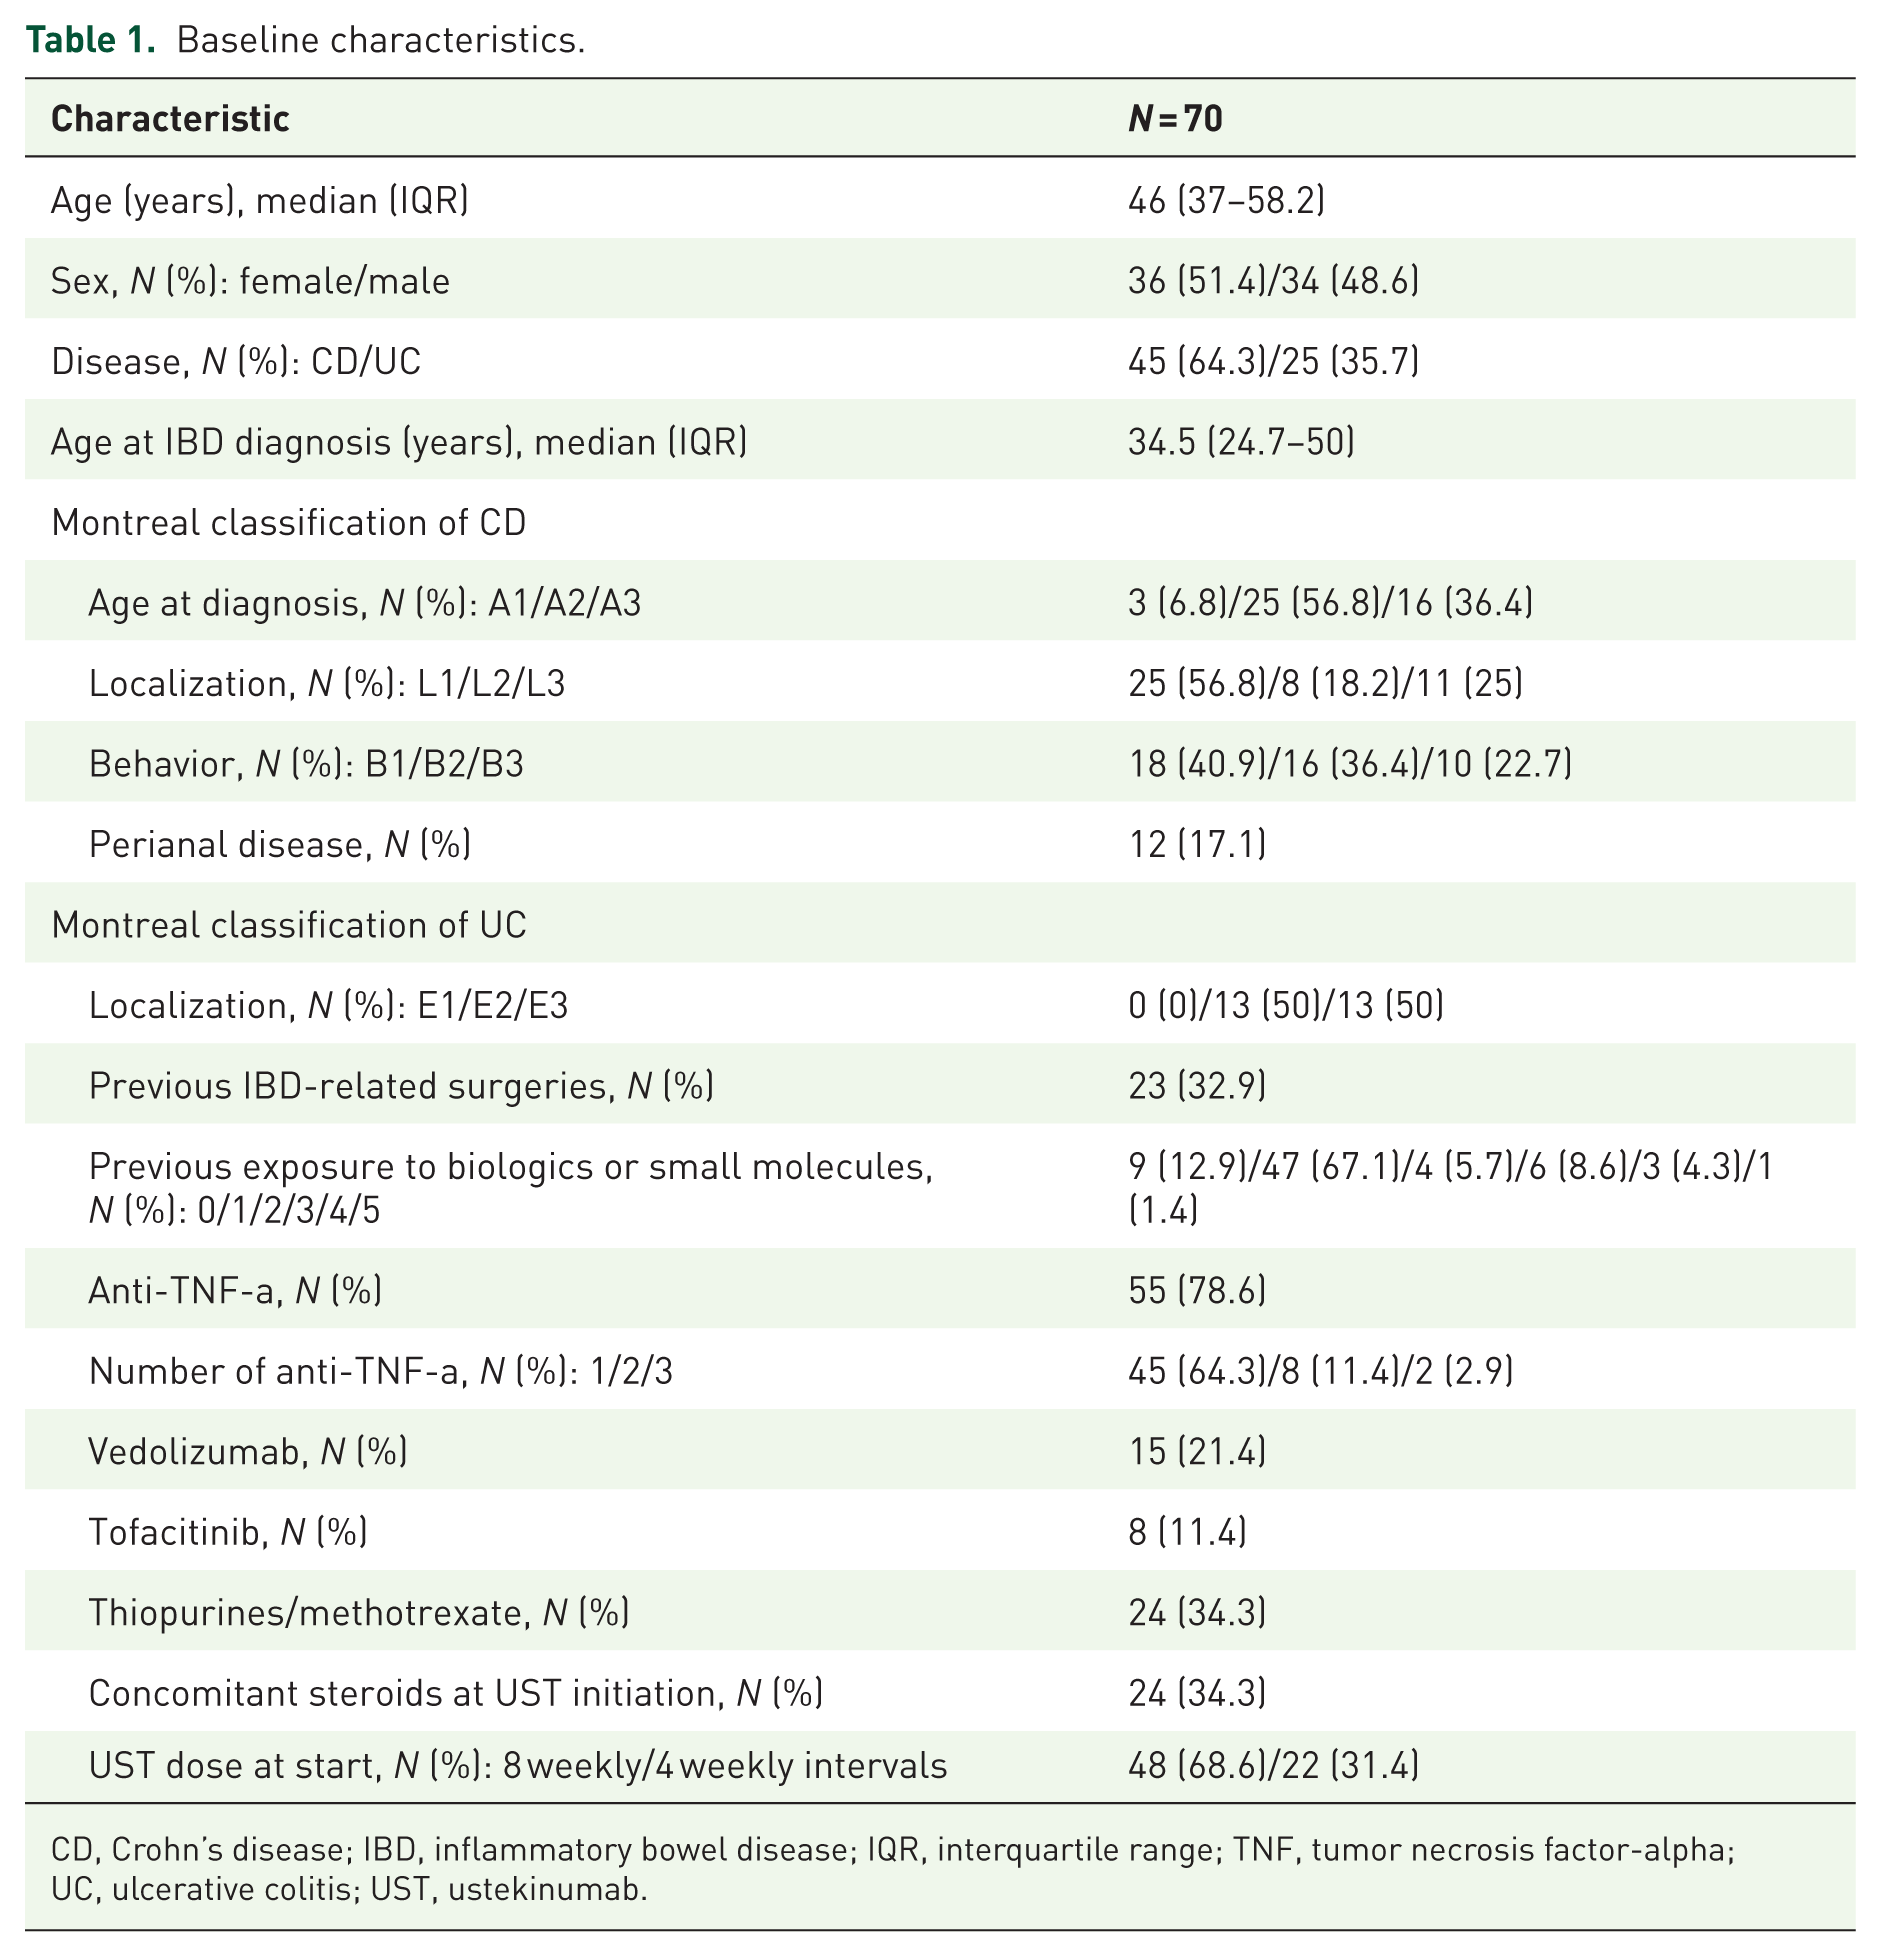
CD, Crohn’s disease; IBD, inflammatory bowel disease; IQR, interquartile range; TNF, tumor necrosis factor-alpha; UC, ulcerative colitis; UST, ustekinumab.
Clinical and endoscopic outcomes
Thirty-two patients (45.7%) had clinical disease activity at baseline. At weeks 8, 16, and 24, corticosteroid-free clinical remission was achieved in 44/70 (62.9%), 50/70 (72.4%), and 48/70 (68.6%), respectively. At week 24, endoscopic response and endoscopic remission were achieved in 33/67 (49.3%) and 21/67 (31.3%) patients, respectively. Two patients (3%) were on corticosteroids at week 24 because of non-remitting or relapsing activity.
UST treatment regimen
After the first IV dose, 48 (68.6%) patients continued SC UST at an 8-week interval (SCq8w), while the remaining 22 (31.4%) were treated at a 4-week interval (SCq4w). At week 8—8 weeks after the first IV dose—32/70 (45.7%) patients were on a SCq8w dosing scheme, 28/70 (40%) on a SCq4w dosing scheme, and 10/70 (14.3%) on an IV 4-week interval (IVq4w) dosing scheme. At week 16, 12/70 (17.1%) patients were on a SCq8w dosing scheme, 44/70 (62.9%) on a SCq4w dosing scheme, and 14/70 (20%) on an IVq4w dosing scheme. At week 24, 2/64 (2.9%) patients were on a SCq8w dosing scheme, 34/64 (48.6%) on a SCq4w dosing scheme, and 28/70 (40%) on an IVq4w dosing scheme.
After a median follow-up of 15.5 months, 2/56 (2.9%) patients were on a SCq8w dosing scheme, 30/56 (42.9%) on a SCq4w dosing scheme, and 24/56 (34.3%) on an IVq4w dosing scheme.
UST trough concentrations
Median UST trough concentrations were 3.0 μg/mL (IQR 1.8–4.5) at week 8, 1.9 μg/mL (IQR 0.9–3.1) at week 16, and 2.8 μg/mL (IQR 1.6–4.0) at week 24. UST trough concentrations at week 8 were not significantly different in patients on a SCq8w versus SCq4w initial dosing scheme (3.0 vs 3.5 μg/mL, p = 0.294). Trough concentrations at week 24 were not significantly different in patients on SCq8w, SCq4w, and IVq4w dosing schemes at that point (1.7 vs 3.2 vs 2.8 μg/mL, p = 0.400).
Previous exposure to two or more advanced treatments was found to predict higher UST trough concentrations at week 8 (Supplemental Table 1).
Exposure–response relationship
UST trough concentrations at week 8
Patients who achieved endoscopic remission and endoscopic response at week 24 had significantly higher UST concentrations at week 8 (4.5 vs 2.6 μg/mL, p = 0.0028 and 4.1 vs 2.4 μg/mL, p = 0.0024), compared to patients without endoscopic response and endoscopic remission, respectively. In the quartile analysis, patients with UST concentrations in the highest quartile at week 8 (>4.5 μg/mL) also had higher endoscopic remission rates at week 24 (66.7% (Q4) vs 20% (Q1); 33.3% (Q2); 28.6% (Q3); p = 0.012; Figure 2(a)), and higher endoscopic response rates at week 24 (80% (Q4) vs 26.7% (Q1); 53.3% (Q2); 64.3% (Q3); p = 0.038; Figure 2(b)).

Quartile analysis showing the exposure–response relationship between UST trough concentrations at week 8 and endoscopic remission (a), endoscopic response (b), and clinical remission (c). Q1 <1.83, Q2 1.84–2.95, Q3 2.96–4.53, Q4 >4.54 μg/mL. w8/24: weeks 8 and 24, respectively.
The ROC curve indicated an optimal UST week 8-threshold trough concentration of 4.5 μg/mL (area under the curve (AUC) = 0.7, sensitivity 54.5%; specificity 83.8%) to predict endoscopic remission at week 24, and of 3.5 μg/mL (AUC = 0.732, sensitivity 53.8%; specificity 87%) to predict endoscopic response at week 24 (Figure 3).

ROC curves analysis for endoscopic remission (AUC 0.7, p = 0.0205) (a) and endoscopic response (AUC 0.732, p = 0.0024) (b) based on UST concentration.
Early clinical remission at week 8 was not associated with endoscopic remission at week 24 (p = 0.338). UST concentrations at week 8 were associated with endoscopic remission even after controlling for early clinical response (OR, 1.00034, p = 0.037).
There was no association between corticosteroid-free clinical remission rate at week 24 and UST concentration at week 8 (3.4 vs 2.6 μg/mL, p = 0.104).
No predictors of endoscopic response at week 24 were found in logistic regression analysis other than UST concentrations at week 8 (OR, 1.0005, 95% CI: 1.0002–1.0009, p = 0.0042; Supplemental Table 2).
UST concentrations at week 16
In contrast to UST concentrations at week 8, patients who achieved endoscopic remission at week 24 did not show higher UST concentrations at week 16 (2.2 vs 1.9 μg/mL, p = 0.40), compared to patients without endoscopic remission. However, patients who achieved endoscopic response at week 24 had significantly higher UST concentrations at week 16 (2.4 vs 1.6 μg/mL, p = 0.038), compared to patients without endoscopic response. The performance of the ROC curve analysis was relatively poor at this time point.
There was no association between corticosteroid-free clinical remission rate at week 24 and UST concentration at week 16 (2.3 vs 1.7 μg/mL, p = 0.157).
UST concentrations at week 24
Patients who achieved endoscopic remission and endoscopic response at week 24 had significantly higher UST concentrations also at week 24 (3.0 vs 2.5 μg/mL, p = 0.037 and 3.2 vs 1.8 μg/mL, p = 0.0015). There was no association between the clinical remission rate at week 24 and the UST concentration at this time point (2.8 vs 2.8 μg/mL, p = 0.64).
The ROC curve indicated an optimal UST week 24-threshold trough concentration of 2.9 μg/mL (AUC = 0.60, sensitivity 58.3%; specificity 61.8%) to predict endoscopic remission at week 24, and of 2.9 μg/mL (AUC = 0.68, sensitivity 61.8%; specificity 75%) to predict endoscopic response at week 24.
Higher UST concentrations at week 24 were associated with higher endoscopic response rates at week 24 in logistic regression analysis (OR, 1.001, 95% CI: 1.0002–1.0011, p = 0.0037). No predictors of endoscopic remission at week 24 were identified.
UST persistence
Fourteen (20%) patients discontinued UST after a median (IQR) of 15.50 months (10–22), all of them due to either primary non-response or secondary loss of response. There were no serious adverse events reported. Patients with longer disease duration had a higher risk of discontinuing UST therapy (OR, 1.034, 95% CI: 1.002–1.068, p = 0.035; Table 2). Patients with UST concentrations in the highest quartile at week 8 (>4.5 μg/mL) did not show better UST persistence rates (log-rank p = 0.319; Figure 4). We did not find an association between UST trough concentrations at week 24 and treatment persistence. Patients in endoscopic remission were more likely to continue UST treatment (p = 0.011).
Cox regression parameters for therapy discontinuation.
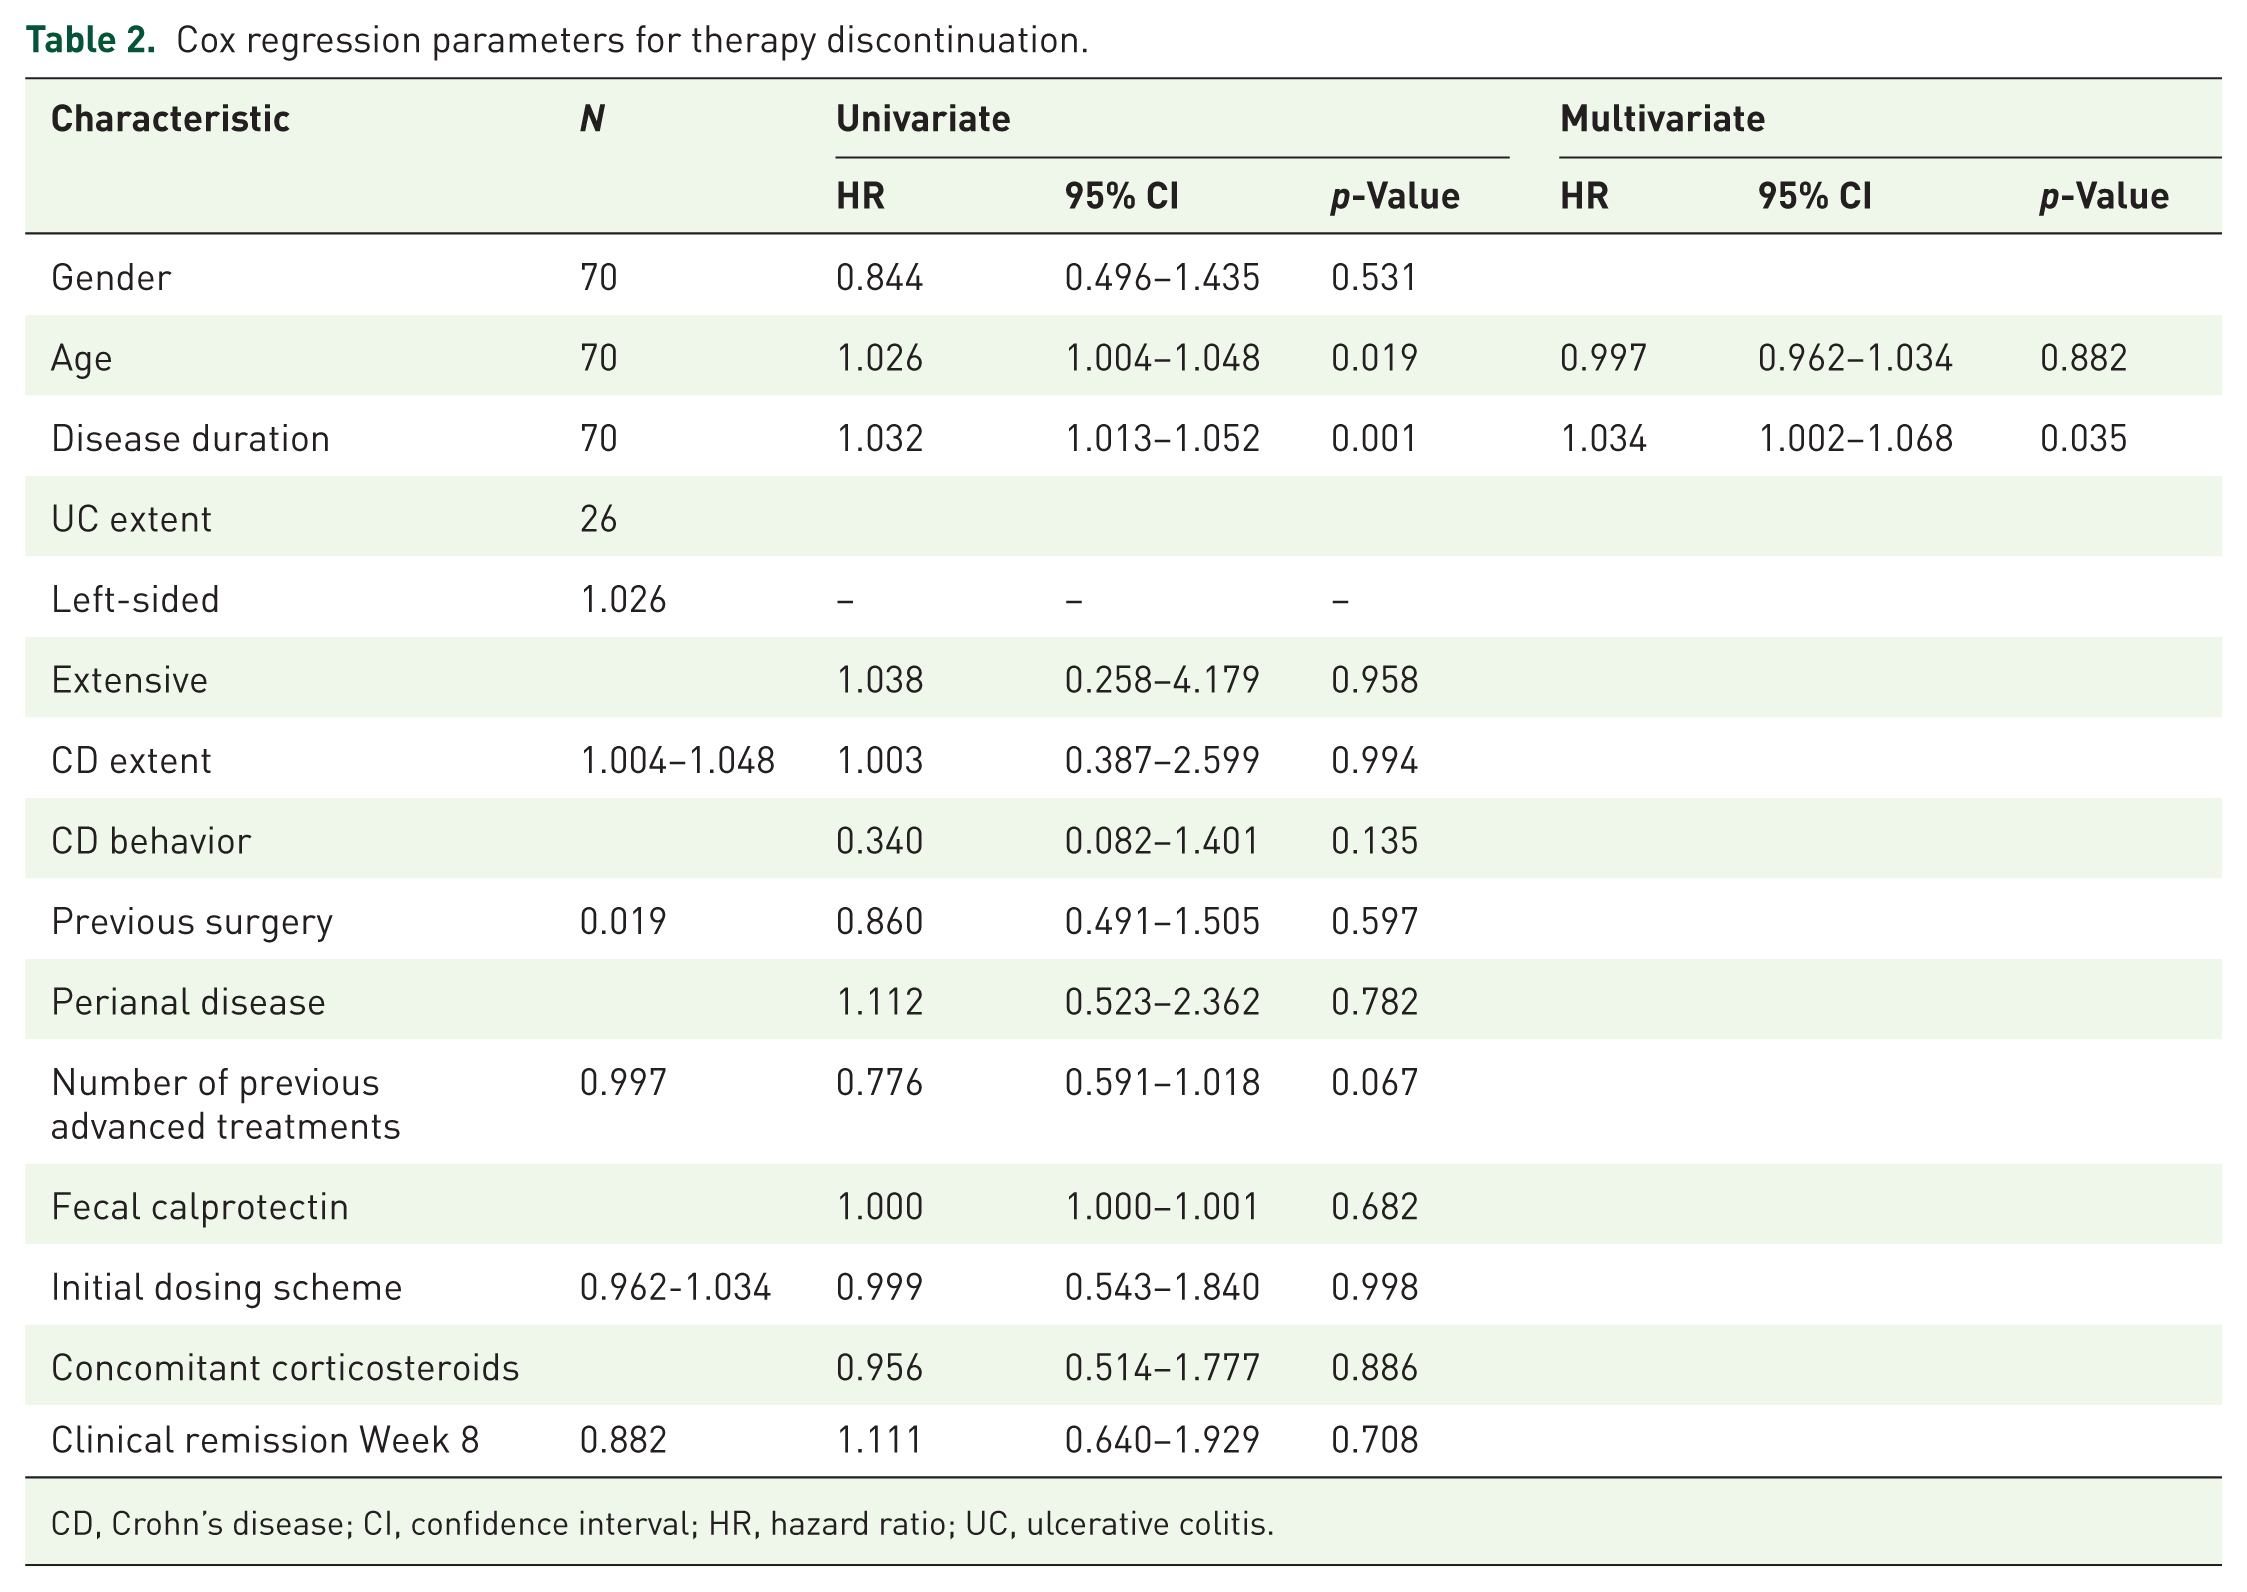
CD, Crohn’s disease; CI, confidence interval; HR, hazard ratio; UC, ulcerative colitis.

UST persistence in the Q4 UST trough concentration (>4.5 μg/mL) versus Q1–Q3 cohorts.
Immunosuppressive therapy and immunogenicity
No differences in UST trough concentrations were detected between patients on mono or combotherapy with methotrexate or azathioprine at week 24 (2.5 vs 2.8 µg/mL, p = 0.456). Patients on combotherapy did not show higher rates of clinical or endoscopic outcomes either. Anti-drug antibodies were measured when UST concentrations were below 1.00 μg/mL. None were detected.
Discussion
UST is an effective treatment for patients with CD and UC. In this prospective real-world cohort study of 70 IBD patients, UST concentrations 8 weeks after induction were positively associated with mid-term endoscopic outcomes. Namely, UST concentrations at week 8 were associated with higher endoscopic response and remission rates at week 24. Although the effect per unit is small, it becomes meaningful with larger increases (e.g., 100 and 1000 ng/mL). Indeed, for every 100 ng/mL increase in UST concentration at week 8, the probability of endoscopic response increases by approximately 5%. No association was found between UST concentrations and clinical remission rates. This suggests that drug levels are a better predictor of endoscopic remission than clinical symptoms.
While UST concentrations at week 16 were also associated with higher endoscopic response rates at week 24, it is important to note that heterogeneity in maintenance dosing complicates the assessment of clinical and endoscopic outcomes at later stages. More so, given that about a third of the patients started the 4-week treatment as early as 4 weeks after the first infusion, one could argue that another source of heterogeneity was introduced at this very early stage. However, this study reflects standard clinical practice and shows that the association between higher UST concentrations and better therapeutic outcomes is independent of how these concentrations were achieved at week 8.
Interestingly, UST concentrations were not significantly different in patients on different dosing schemes at any time point. It might be explained by the fact that patients with greater inflammatory burden are more likely to receive intensified treatment regimens, so that the higher dose would compensate for the increased drug clearance, resulting in similar trough UST concentrations. Whether proactive TDM is an effective strategy to improve long-term outcomes remains unknown. However, our results suggest that, in the right context, drug concentrations may help predict treatment failure and thus guide early optimization of treatment. Although the association between drug concentration and treatment goals was clear, we did not find an association with UST survival, likely due to the small number of patients. The only factor associated with worse survival in multivariate analysis was disease duration. Finally, we did not analyze the risk factors for treatment optimization (e.g., intensification) as this was a particularly common event in our cohort and would carry a high risk of bias.
To our knowledge, three randomized clinical trials have evaluated the association between UST concentrations and therapeutic outcomes. The UNITI and UNIFI studies16–18 identified a threshold of 3.3 μg/mL at week 8 as a predictor of clinical remission in CD and 3.68 μg/mL at week 8 as a predictor of clinical response in UC. Interestingly, neither immunomodulator use nor biologic failure status was found to have an impact on UST concentrations, although subsequent real-world data have provided conflicting results in this regard, as exposure to more than 2 advanced treatments appears to predict low drug concentrations that are likely indicative of more severe disease. The STARDUST study 19 reported an association between higher UST concentrations at week 16 and normalization of C-reactive protein or fecal calprotectin at week 16, and endoscopic response at week 48, with a cutoff of 2.60 μg/mL at week 16 (third quartile). Finally, in the SEAVUE study, 20 a cutoff value of 3.64 μg/mL at week 48 (fourth quartile) was associated with endoscopic response.
To date, a few real-world studies have examined the association between UST concentration in induction and long-term outcomes (Table 3). A meta-analysis of 14 observational studies assessing clinical remission (63% CD patients; 37% UC patients) and endoscopic remission (100% CD patients) found an association between higher UST concentrations (fourth quartile) and clinical remission. 21 We did not detect any UST antibodies in our study. This is consistent with previous studies and thus confirms the low immunogenicity of UST.
Real-world evidence with UST concentrations.

AUC, area under the curve; CD, Crohn’s disease; CRP, C-reactive protein; FC, fecal calprotectin; LR+, positive likelihood ratio; N/A, not applicable; NHI, Nancy Histology Index; SES, simple endoscopic score; UC, ulcerative colitis; UST, ustekinumab; UST8/10/26, ustekinumab concentration at weeks 8, 10, and 26, respectively; USTm, ustekinumab concentration in maintenance; w12/24/26, weeks 12, 24, and 26, respectively.
There are several factors that may explain the differences in optimal drug concentration thresholds between studies. First, it is not clearly understood whether different laboratory assays can give equivalent UST concentrations, as studies using ELISA assays appear to give higher concentrations compared to chemiluminescence assays, particularly at higher concentrations. 31 This might explain why we have found relatively lower UST concentrations compared to other studies. Second, there is growing evidence that more robust and ambitious therapeutic targets, such as remission or endoscopic response, require higher concentrations than clinical or biochemical remission. 32 In our study, optimal UST concentrations at week 8 were indeed higher as predictors of endoscopic remission than endoscopic response (4.5 vs 4.1 μg/mL in the nonparametric comparison test, and 4.5 vs 3.5 μg/mL in the ROC curve analysis, respectively). Biochemical remission/response could not be formally assessed due to the low number of patients. Finally, the phase of treatment (induction vs maintenance) and the week of concentration determination seem to be relevant, as UST concentration thresholds are higher in the first weeks of treatment than in the maintenance phase. Furthermore, UST concentrations in early phases—week 8 rather than 16 or 24—seem to correlate better with therapeutic outcomes, suggesting their importance right after induction. Nevertheless, the UST concentration determination also seems to have a place in optimizing maintenance treatment, as the inability to reach certain UST concentrations after dose escalation predicted treatment failure in a Slovenian study. 33
One of the strengths of our study was the use of endoscopic outcomes. Most real-world data evaluating UST concentrations have focused on clinical and/or biochemical outcomes,25,28–30 which have inherent limitations. Endoscopic outcomes are known for their robustness, and their use is aligned with the recommendations of international guidelines.34,35 A histologic or histoendoscopic endpoint was not used because, in a particularly refractory patient population, the treatment goal is not necessarily histologic remission, and the result could be misleading.
A limitation of our study is its unicentric nature. Although the baseline characteristics reflect other real-world cohorts, therapy optimization strategies—namely, dose escalation—may vary between centers. Another limitation of our study is the lack of data prior to the first determination of UST concentrations at week 8. Exploratory studies have reported the use of “very early” UST concentrations as early as week 2 as predictors of endoscopic and biochemical outcomes.36–38 Ren et al. 39 reported better endoscopic outcomes and survival rates with “optimized induction” consisting of two consecutive IV doses compared with standard induction. Patients under “optimized induction” had higher UST concentrations at both week 16 and, remarkably, week 48, suggesting a long-term impact on drug concentrations after early dose adjustment. This provides an opportunity for early treatment optimization.
In conclusion, a drug exposure–response relationship was observed for endoscopic outcomes 24 weeks after UST induction in IBD patients. A cutoff UST concentration of 4.5 µg/mL at week 8 reliably predicted endoscopic remission. Prospective randomized trials are needed to determine whether treatment outcomes can be improved by dose escalation based on trough concentrations.
Conclusion
This prospective, real-world cohort study shows that UST concentrations at week 8 are significantly associated with mid-term endoscopic outcomes in patients with CD and UC. Specifically, a trough concentration of 4.5 μg/mL at week 8 reliably predicted endoscopic remission at week 24, reinforcing the importance of early drug monitoring during induction. Remarkably, no association between UST levels and clinical remission was observed, supporting the notion that endoscopic outcomes are more robust and reliable therapeutic targets than clinical symptoms alone.
While UST concentrations at week 16 were also associated with endoscopic response, maintenance dose heterogeneity complicates interpretation at later stages, and the impact of early treatment intensification on long-term outcomes remains to be elucidated. The lack of detectable anti-UST antibodies in our cohort is consistent with its known low immunogenicity. Furthermore, our results confirm that treatment intensification strategies may normalize UST exposure, resulting in comparable trough concentrations across different dosing regimens, likely reflecting the balance between drug clearance and disease burden.
The optimal cutoff values determined in our study were higher for endoscopic remission than for endoscopic response, which is consistent with emerging evidence that more ambitious therapeutic goals require higher drug exposure. Differences between thresholds reported across studies may be explained by assay variability, treatment phase, and disease severity, emphasizing the need for standardization of TDM strategies in clinical practice. Importantly, our findings highlight the relevance of early drug concentration assessment, as week 8 levels correlated more consistently with outcomes than later time points.
Strengths of our study include the prospective design and the use of endoscopic outcomes, which provide a robust and guideline-endorsed measure of therapeutic efficacy. Limitations include its unicentric nature, the modest sample size, and the lack of very early UST concentration measurements (e.g., week 2), which might also serve as predictors of therapeutic response.
In summary, we confirm an exposure–response relationship between UST concentrations and endoscopic outcomes in IBD, with week 8 levels serving as an early predictor of treatment success. These findings support the potential role of proactive TDM to guide treatment optimization. However, prospective, randomized studies are needed to determine whether dose adjustment based on trough concentrations can lead to improved long-term clinical and endoscopic outcomes.
Supplemental Material
sj-docx-1-tag-10.1177_17562848251378067 – Supplemental material for Higher ustekinumab concentrations in induction are associated with better endoscopic outcomes in inflammatory bowel disease
Supplemental material, sj-docx-1-tag-10.1177_17562848251378067 for Higher ustekinumab concentrations in induction are associated with better endoscopic outcomes in inflammatory bowel disease by Xavier Serra-Ruiz, Elena Céspedes-Martínez, Luis Mayorga, Claudia Herrera-deGuise, Virginia Robles, Ernesto Lastiri, Sonia Garcia-Garcia, María Larrosa-García, María Teresa Sanz-Martínez, Zahira Pérez, Elena Oller and Natalia Borruel in Therapeutic Advances in Gastroenterology
Supplemental Material
sj-docx-2-tag-10.1177_17562848251378067 – Supplemental material for Higher ustekinumab concentrations in induction are associated with better endoscopic outcomes in inflammatory bowel disease
Supplemental material, sj-docx-2-tag-10.1177_17562848251378067 for Higher ustekinumab concentrations in induction are associated with better endoscopic outcomes in inflammatory bowel disease by Xavier Serra-Ruiz, Elena Céspedes-Martínez, Luis Mayorga, Claudia Herrera-deGuise, Virginia Robles, Ernesto Lastiri, Sonia Garcia-Garcia, María Larrosa-García, María Teresa Sanz-Martínez, Zahira Pérez, Elena Oller and Natalia Borruel in Therapeutic Advances in Gastroenterology
Supplemental Material
sj-docx-3-tag-10.1177_17562848251378067 – Supplemental material for Higher ustekinumab concentrations in induction are associated with better endoscopic outcomes in inflammatory bowel disease
Supplemental material, sj-docx-3-tag-10.1177_17562848251378067 for Higher ustekinumab concentrations in induction are associated with better endoscopic outcomes in inflammatory bowel disease by Xavier Serra-Ruiz, Elena Céspedes-Martínez, Luis Mayorga, Claudia Herrera-deGuise, Virginia Robles, Ernesto Lastiri, Sonia Garcia-Garcia, María Larrosa-García, María Teresa Sanz-Martínez, Zahira Pérez, Elena Oller and Natalia Borruel in Therapeutic Advances in Gastroenterology
Footnotes
Acknowledgements
None.
Author’s note
All co-authors have seen and agree with the contents of the manuscript, and there is no financial interest to report. We certify that the submission is original work and is not under review at any other publication.
Declarations
ORCID iDs
Supplemental material
Supplemental material for this article is available online.
References
Supplementary Material
Please find the following supplemental material available below.
For Open Access articles published under a Creative Commons License, all supplemental material carries the same license as the article it is associated with.
For non-Open Access articles published, all supplemental material carries a non-exclusive license, and permission requests for re-use of supplemental material or any part of supplemental material shall be sent directly to the copyright owner as specified in the copyright notice associated with the article.