
Abstract
Background:
Ustekinumab (UST) is an effective treatment option in Crohn’s disease (CD) and ulcerative colitis (UC). However, it still remains unclear if therapeutic drug monitoring could be helpful to guide clinicians.
Objectives:
The aim of our study was to analyze the relationship between UST through levels (USTTL) and clinical outcomes in real-world inflammatory bowel disease (IBD) patients.
Design:
We performed a unicentric retrospective study including patients with IBD under UST treatment with at least one level determination.
Methods:
The following variables were analyzed at the initiation of UST and at each USTTL measurement: clinical response and remission using the Harvey–Bradshaw Index (HBI) for CD and the Partial Mayo Score (pMayo) for UC; biochemical response and remission using fecal calprotectin and C-reactive protein, among others. Two periods were considered: P1 (time between induction and the first determination of USTTL) and P2 (time between USTTL1 and the second determination of USTTL).
Results:
We included 125 patients, 117 with CD. In P1, 62.4% of patients were on subcutaneous maintenance, and the median USTTL1 was 3.1 μg/mL (1.6–5.3). In 44.8% of CD patients (48/117), clinical remission was achieved, with USTTL1 significantly higher than those who did not achieve remission (3.7 μg/mL (2.3–5.4) vs 2.3 μg/mL (1.1–5.2); p = 0.04). In the 46 patients with two determinations, statistically significant differences were found between variables in P2 versus P1: clinical remission (73.9% vs 21.7%; p = 0.001); USTTL (7.2 μg/mL (4.7–11.7) vs 3.4 μg/mL (1.9–6.4); p < 0.001), HBI (4 (4–4.3) vs 8 (4–9); p < 0.001), pMayo (1 (1–3.3) vs 4.5 (3–5); p = 0.042), and corticosteroid use (26.1% vs 41.3%; p = 0.024). Receiver-Operating-Characteristic (ROC) curves were calculated for clinical remission in P2, with USTTL cutoff value of 6.34 μg/mL for clinical remission and a high rate of intensified patients (98%).
Conclusion:
High serum levels of UST were associated with clinical remission during treatment for IBD under intensification treatment, with a cutoff point of 6.3 μg/mL.
Keywords
Introduction
Background
Ustekinumab (UST) is a fully human monoclonal IgG1-kappa antibody targeting subunit p40 of interleukin (IL)-12 and IL-23. It is an effective treatment option for Crohn’s disease (CD) in case of failure, intolerance, or contraindication of a first-line biologic with anti-tumor necrosis factor (TNF), and in ulcerative colitis (UC). Its approved way of administration is an intravenous (IV) induction of approximately 6 mg/kg followed by subcutaneous (SC) maintenance treatment of 90 mg every 8 or 12 weeks.1,2 After years of anti-TNF being the only biologic therapy available, alternative therapeutic pathways have emerged and a handful of biologic and small molecules treatments are now available, allowing a better management of inflammatory bowel diseases (IBD). Nevertheless, results remain modest, with a large part of patients facing primary failure or loss of response. In this context, and with the perspective of a life-lasting disease of a poorly predictable course, positioning the different molecules and optimizing their use are challenging goals. Considering anti-TNF, optimization based on reactive therapeutic drug monitoring (TDM) is emerging as a new standard of care. This topic has recently been reviewed by the Spanish Crohn’s Disease and Ulcerative Colitis working group (GETECCU). This consensus document assumes that there is still a lack of evidence regarding the use of TDM in UST treatment in terms of establishing cutoff points. However, it does take into account the importance of further research and investigation in this field and supports the use of TDM in other biologics such as Infliximab, with more evidence available. 3 When it comes to biologic treatment, failure can stem from various factors: inadequate drug exposure caused by rapid drug consumption (pharmacokinetic failure) influenced by high inflammatory burden, extensive intestinal involvement, presence of hypoalbuminemia, or anti-drug antibodies; or due to inflammatory processes, likely related to an alternative inflammatory pathway (pharmacodynamic failure). There are two possible approaches to TDM. Reactive monitoring involves determining drug levels in patients who experience secondary loss of response in order to guide treatment change (intensification or selection of a new drug). The proactive strategy proposes monitoring drug levels, regardless of clinical and/or biological activity, and making dose adjustments to achieve a predetermined level. The ultimate goal of the proactive strategy is to improve the response rate during induction, prevent clinical relapse, and/or safely withdraw the immunosuppressive drug.
With UST, the pivotal studies UNITI-1, UNITI-2, and IM-UNITI in CD reported a clinical response of 34%–56% at week 6 according to previous anti-TNF treatment and induction regimen. Among responders, clinical remission was maintained in about half of patients at 1 year and in about 30% at 5 years. The UNIFI pivotal study in UC reported a clinical response of 51%–62% at week 8 according to induction regimen, and a rate of approximately 40% of clinical remission at 1 year among responders. 4 Real-world data demonstrated comparable short-term results, and even better long-term efficacy in CD considering a substantial part of patients having intensified treatment that allowed up to 80% regain of response.5,6
Indeed, UST has been subject to dedicated studies of shortened intervals between SC doses, IV reinduction, or IV maintenance, to increase or recapture efficacy, with satisfying outcomes. Patients facing incomplete response or loss of response undergoing SC 90 mg every 8 weeks achieved nearly 50% clinical remission without steroids at 6 months of follow-up after intensifying to SC 90 mg every 4 weeks. 7 With IV reinduction or IV maintenance, in patients mostly already undergoing intensified SC regimen, clinical remission occurred again in up to 50%, while UST serum concentration raised up.8,9 Nevertheless, it is unclear if TDM could be helpful to guide clinicians in deciding whether to optimize UST or change the treatment class. In fact, data about UST levels are limited and contradictory. In the GETECCU consensus document, based on studies conducted to date, it is proposed to achieve a maintenance USTTL range between 1.5 and 3 μg/mL for clinical remission and >4.5 μg/mL for endoscopic response. However, there is a greater limitation in recommending levels for induction, with reference USTTL at week 8 of 3.9 (2–7.3) μg/mL in CD and ⩾3.7 μg/mL in UC to achieve clinical remission. 3
The aim of our study was to analyze the relationship between UST trough levels (USTTL) and clinical outcomes in real-world IBD patients.
Objectives
The primary endpoint of the study was to analyze the relationship between USTTL and clinical outcomes in real-world IBD patients (response and remission).
Secondary endpoints included finding the relationship between USTTL and treatment regimen, differences in USTTL, and clinical and biochemical activity over time in patients with more than one determination.
Materials and methods
Study design and patient population
We conducted an observational, retrospective, single-center study, that included all patients with IBD who had received UST treatment with at least one level determination until January 2023 in our center. Data were retrospectively collected during 2023. All patients had received an induction treatment with a single IV dose of approximately 6 mg/kg. Those patients in dual treatment (with another biologic or Janus Kinase Inhibitor, JAK) were excluded. The sample size was not calculated because all the patients who met the inclusion and exclusion criteria were included.
At the initiation of UST (baseline), we reported demographic and clinical information such as gender, age, weight, albuminemia, and history of IBD including disease localization and phenotype (CD), disease extension (UC), existence of perineal disease (CD), previous surgery, previous use of biologics, and current use of immunosuppressants. At baseline and at the time of each level extraction, we collected details about UST therapy (route, dose, frequency), current use of corticosteroids (including budesonide), disease activity scores using Harvey–Bradshaw Index (HBI) in CD and partial Mayo Index (pMayo) in UC, as well as biochemical markers such as fecal calprotectin (FC) and C-reactive protein (CRP).
Most patients undergo clinical and biochemical assessment at each quarterly review, while endoscopic evaluation was reserved for severe and refractory cases. The intensification regimen is based on two main factors: the patient’s availability to attend a day hospital monthly and the previous intensification regimen. There is little evidence clarifying which intensification regimen is superior, and empirically, we escalate from a SC regimen with shortened intervals (every 4–6 weeks) to IV maintenance every 4 weeks, although recently, we have probed its efficacy. 10
The reporting of this study conforms to the Strengthening the Reporting of Observational Studies in Epidemiology statement. 11
UST serum level assays
USTTL was measured just before the next IV infusion or during a follow-up consultation in case of SC treatment regimen the same day before the next dose, using an ELISA kit from Grifols®. Anti-UST antibody levels were not available.
Definitions
Patients receiving SC UST every 8 or 12 weeks were classified as “SC maintenance,” those receiving SC UST every 4 or 6 weeks as “SC intensification,” and those receiving IV UST every 4 weeks as “IV intensification.”
Clinical response was defined as a decline of at least 50% in HBI, 2 points in pMayo as compared with baseline or achieving clinical remission. Clinical remission was defined as HBI <5 in CD and pMayo <2 in UC.
Biochemical response was defined as a decrease of ⩾50% in CRP or FC, while biochemical remission was defined as CRP <5 mg/L and FC <250 µg/g.
The time elapsed between induction and USTTL1 was considered period 1 (P1), and between USTTL1 and USTTL2 was considered period 2 (P2).
Statistical analysis
Demographic data and baseline characteristics of the disease were documented for all patients. Categorical variables were expressed as percentages, while continuous variables were presented as either the mean with standard deviation (SD) or the median with interquartile range (IQR), depending on the normality assessment using the Shapiro–Wilk or Kolmogorov Smirnov tests depending on the sample size. Statistical comparisons for HBI, pMS, FC, CRP, and UST-TL were conducted against baseline values, employing either the Student’s t-test or the Mann–Whitney U test, based on the normality criteria. Both the Kruskal–Wallis test and one-way analysis of variance were used to assess for significant differences in a continuous dependent variable by a categorical independent variable. A two-sided p-value of 0.05 or less was considered indicative of statistical significance. IBM SPSS Statistics for Windows, version 24.0, was utilized for all data analyses (IBM, Chicago, IL, USA).
Results
Patient characteristics at baseline
We performed 171 UST-TL determinations in 125 patients, from whom 46 had at least 2 available measurements. Table 1 illustrates their baseline characteristics. Right before UST induction, the cohort included patients with median age of 41 years, a slight male predominance, and a great majority of CD (86%). The history of CD showed complicated behavior in 56% and perineal disease in 43%. One-quarter of patients had already faced surgery. They were 92% bioexposed. Almost three-quarters (91/125, 73%) had been treated with immunosuppressants before. More than half of patients had taken corticosteroids in the previous 3 months (58%).
Baseline characteristics of patients.

Results expressed in N (%) or median (IQR).
CD, Crohn’s disease; HBI, Harvey–Bradshaw index; IBD, inflammatory bowel disease; IQR, interquartile range; pMayo, partial Mayo score; TNF, tumor necrosis factor; UC, ulcerative colitis.
USTTL1 and treatment regimen
In our cohort, 125 patients had at least one USTTL measurement (USTTL1). The median duration after first UST infusion was 49 weeks (25–106). This measurement was made 16 weeks or less after first UST infusion, in induction phase, in 15 patients (12.0%). The 110 remaining measurements were performed after week 16 of treatment, as patients were undergoing SC maintenance (N = 78, 62.4%), SC intensification (N = 24, 19.2%), or IV intensification (N = 8, 6.4%). The patients who got their determination of USTTL1 before (induction group) or after (maintenance group) week 16 did not significantly differ in any baseline characteristic, except the baseline FC level which was higher in the early group (median 1840 μg/g (318–4000) vs 564.4 μg/g (124.5–1400), p = 0.013). On another hand, when comparing all regimens of treatment, we found significant differences in basal HBI and basal FC (Table 2). Patients receiving IV intensification were also numerically younger and with lower weight, without reaching significance.
Baseline characteristics of patients according to treatment scheme.

Results expressed in median (IQR).
CRP, C-reactive protein; FC, fecal calprotectin; HBI, Harvey–Bradshaw index; IV, intravenous; pMayo, partial Mayo score; SC, subcutaneous; UST, ustekinumab.
The results of USTTL1 are illustrated in Figure 1. The median USTTL1 was 3.1 μg/mL (1.6–5.3) in the whole cohort, with significant differences between the groups of different treatment regimens. Indeed, USTTL1 was significantly higher during induction phase when compared with SC maintenance (4.4 μg/mL (3.7–6.0) vs 2.2 μg/g/mL (1.3–3.5), respectively, p = 0.024). Moreover, USTTL1 was significantly lower in patients with SC maintenance, when compared with intensified treatment, whether through SC or IV route (2.2 μg/mL (1.3–3.5) vs 7.4 (5.1–10.8) and vs 5.3 (3.3–12.0); p < 0.001 and p = 0.03, respectively). The USTTL1 was not different according to induction dose of 260, 390, or 520 mg (2.31 vs 3.48 vs 3.70 μg/mL, p = 0.58) or previous immunosuppressive treatment or not at induction (4.6 vs 4.0 μg/mL, p = 0.47). In univariate analysis, baseline albumin, CRP, and FC were not associated with elevated USTTL1.
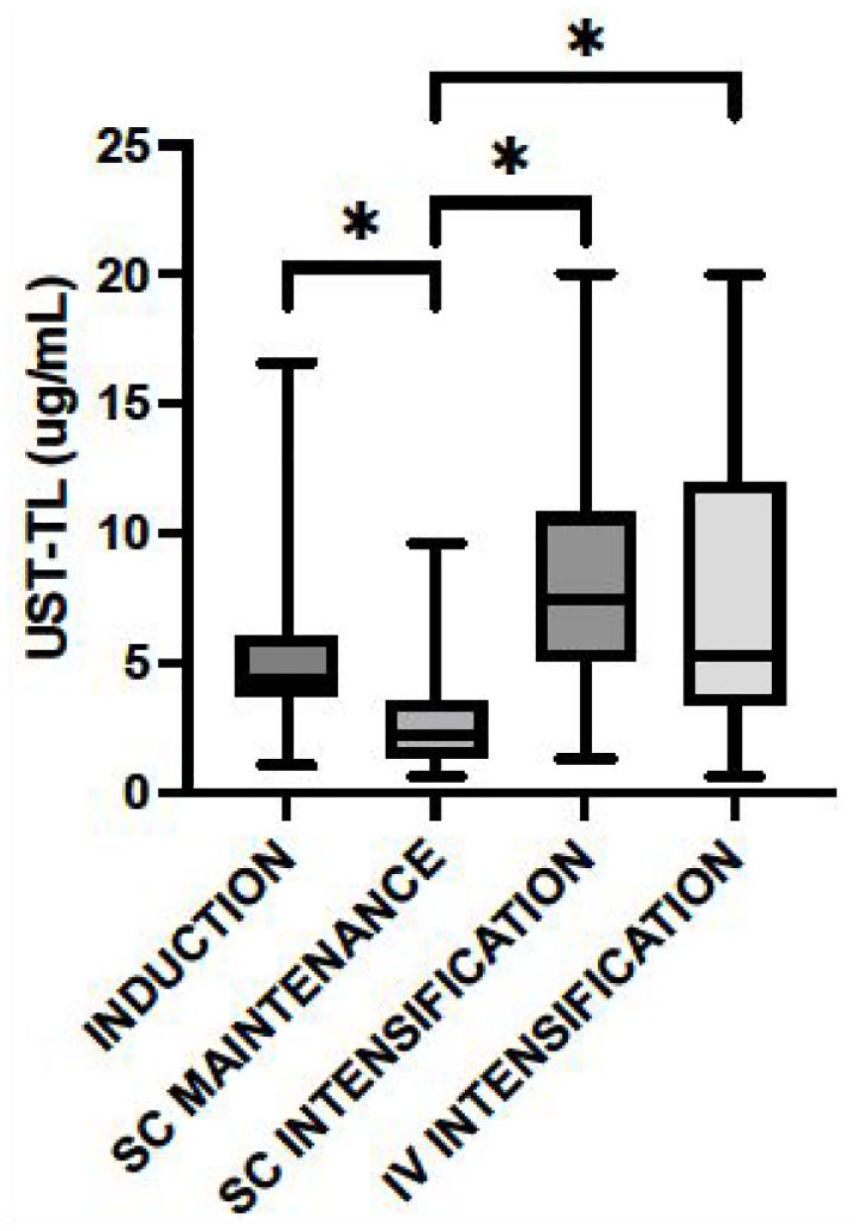
USTTL1 according to treatment scheme.
Clinical response and remission
At the time of USTTL1, 64 patients (51.2%) completed the criteria of clinical response. The USTTL1 was significantly higher in responders than in non-responders (3.9 vs 2.5 μg/mL).
Fifty-two patients (41.6%) completed the criteria of clinical remission. Results in Table 3 show USTTL1 was significantly higher when considering only the measurements performed in CD patients (3.7 vs 2.3 μg/mL; p = 0.04) and no significant differences were found in patients with UC in terms of clinical response (p = 0.125) or remission (p = 0.721).
Results of USTTL1 according to clinical response and remission represented as median and interquartile range (IQR).

Independent T-test for two samples.
Mann–Whitney U test.
USTTL, UST through levels.
Biochemical outcomes
A total of 67/121 patients (55.3%) and 56/121 patients (46.3%) achieved a biochemical response and remission, respectively, at the end of period 1. No statistical difference was noted in USTTL1 between the groups or in CD subgroup as reflected in Table 4.
Results of USTTL1 according to biochemical response and remission represented as median (RIQ).

Mann–Whitney U test.
USTTL, UST through levels.
Results in patients with two determinations of USTTL
As reflected in Table 5, 46 patients had a second determination of USTTL (USTTL2). The median duration after the first UST infusion was 70 weeks. The median duration after USTTL1 was 24 weeks. The patients were undergoing SC maintenance (N = 1, 2.2%), SC intensification (N = 28, 62.2%), or IV intensification (N = 16, 35.6%) at the end of period 2. This represented a total of 45/46 (97.8%) patients receiving an optimized treatment, versus 14/46 (30.4%) at the time of USTTL1. The USTTL2 was significantly higher than the USTTL1 (7.17 vs 3.41 μg/mL). The HBI and pMayo scores were significantly lower (4 vs 8 and 1 vs 4, respectively), as well as FC (400 vs 700 μg/g). The use of corticosteroids was significantly less frequent (26.1% vs 41.3%). 36/46 (78.3%) patients were not in clinical remission in period 1 and 24/36 (66.67%) achieved this goal at the end of period 2, all of them were intensified. Globally, the clinical response and clinical remission were achieved in 80.4% and 73.9%, respectively, at the end of period 2. The biochemical response and biochemical remission were achieved in 61.4% and 48.9%, respectively.
Comparison of the two periods regarding the time USTTL was taken.

Wilcoxon signed-rank test for related samples.
McNemar test.
CRP, C-reactive protein; FC, fecal calprotectin; HBI, Harvey–Bradshaw index; IQR, interquartile range; IV, intravenous; pMayo, partial Mayo score; SC, subcutaneous; USTTL, UST through levels.
In this subgroup of patients, we found that USTTL2 was significantly higher in clinical remitters than in non-remitters (7.7 (5.8–13.1) vs 3.7 (1.5–10.2) μg/mL; p = 0.041) (Figure 2). Significant differences in USTTL2 were also found in biochemical remission (7.9 (6.5–14.7) vs 6.3 (2.2–11.1) μg/mL; p = 0.026).
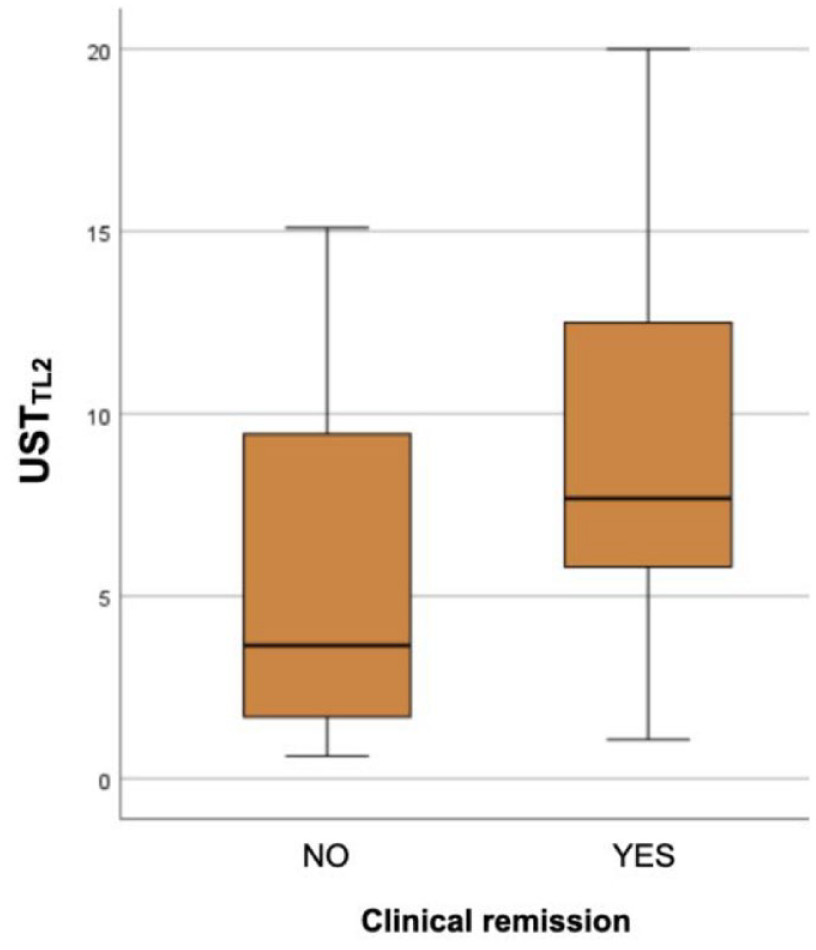
Box and whiskers plot comparing USTTL2 in clinical remitters versus no remitters.
ROC curves for clinical response and remission in period 1
When considering only the measurements in period 1, USTTL1 was significantly higher in responders than in non-responders (Table 3). The corresponding ROC curve indicated an optimal threshold of 2.86 μg/mL to identify responders. Additionally, the corresponding ROC curve to identify CD remitters indicated an optimal threshold of 2,425 μg/mL (Figure 3; Table 6).
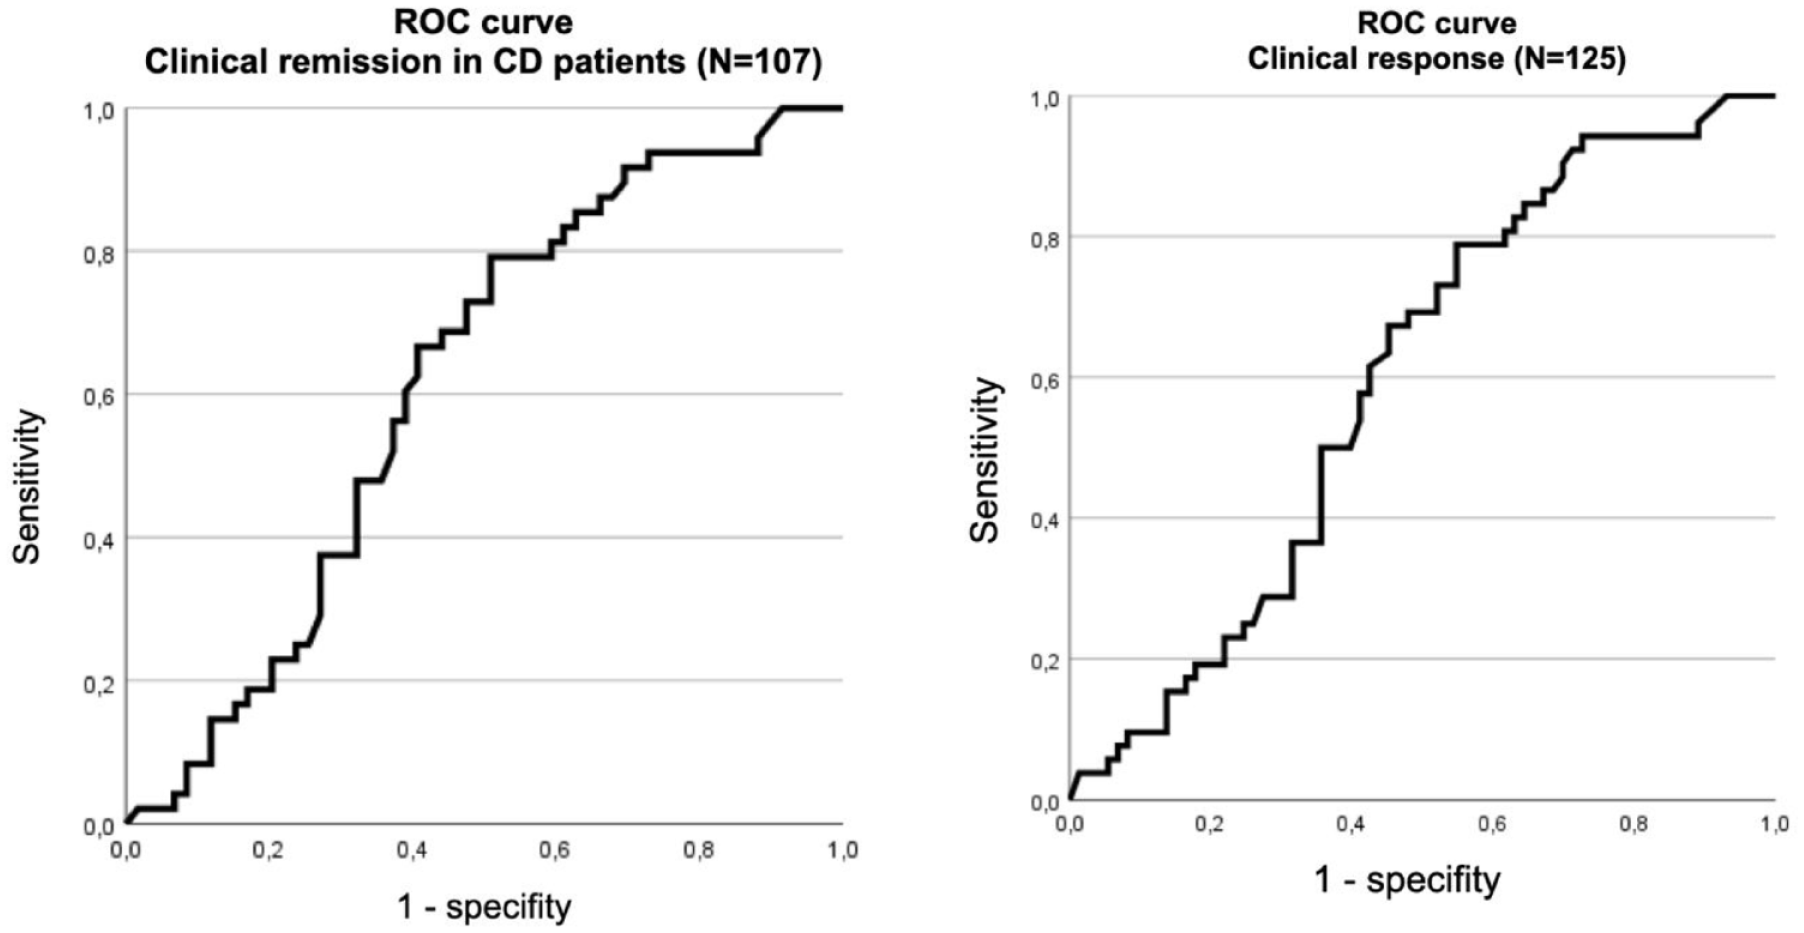
ROC curves for clinical remission in CD and response (N = 125) in the first determination.
ROC curves for clinical remission in CD and response (N = 125) in the first determination.
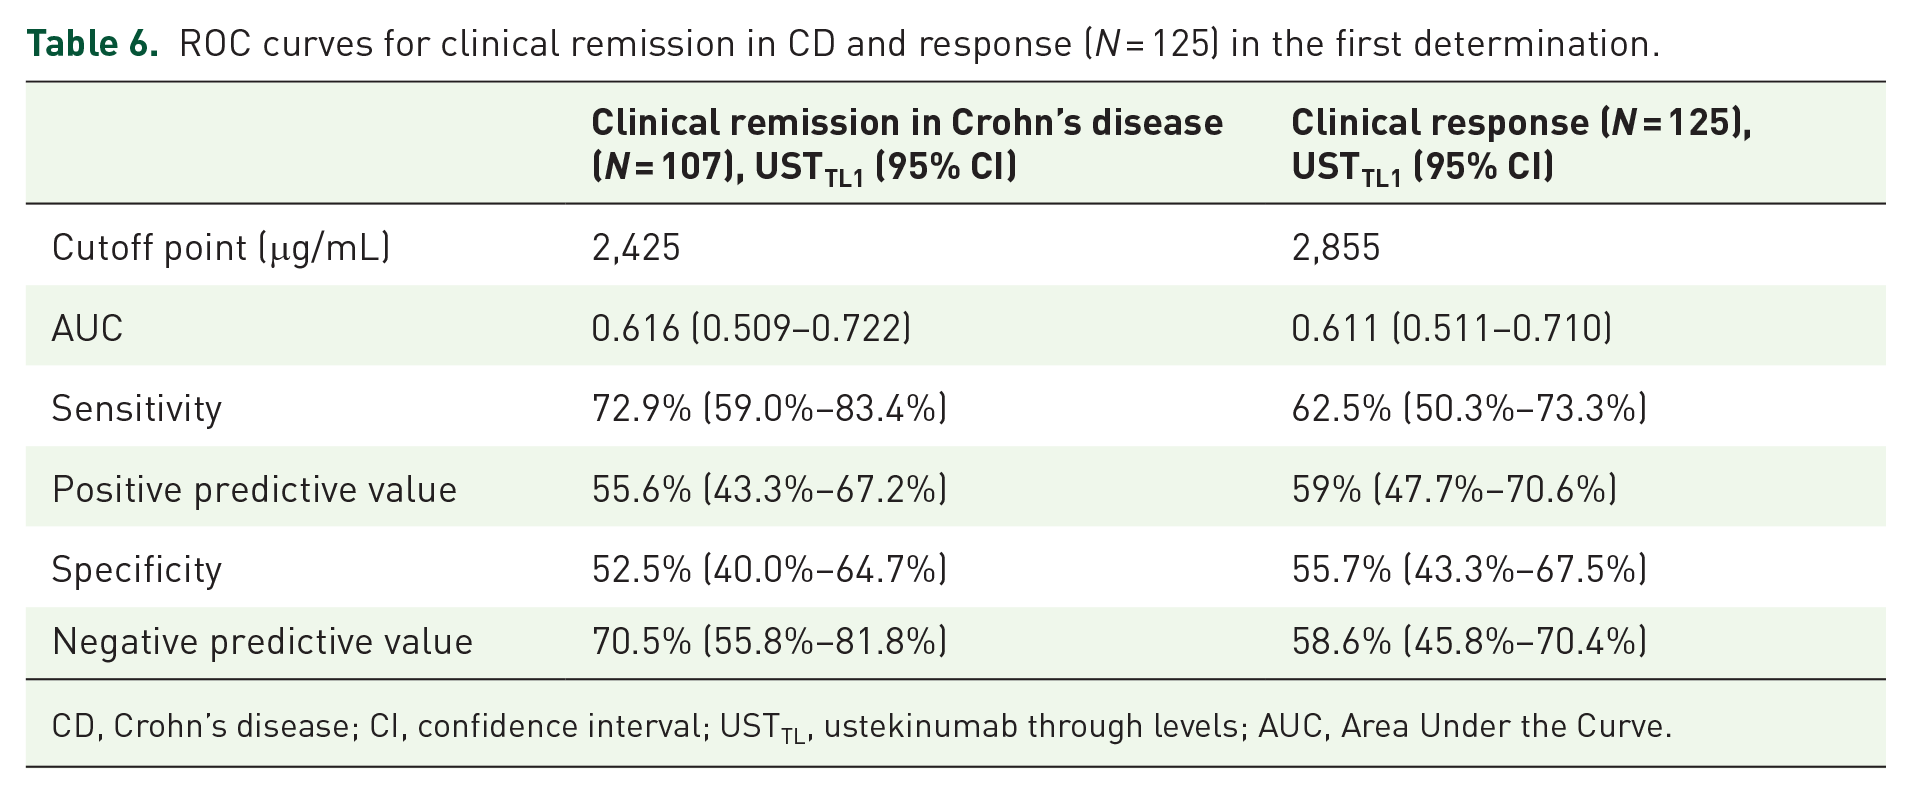
CD, Crohn’s disease; CI, confidence interval; USTTL, ustekinumab through levels; AUC, Area Under the Curve.
ROC curves for clinical response and remission in period 2
When considering only the measurements performed in period 2, USTTL2 was significantly higher in remitters than in non-remitters (7.7 vs 3.7 μg/mL, p = 0.041). The corresponding ROC curve (Figure 4, Table 7) indicated an optimal threshold of 6.34 μg/mL to identify remitters in this period.

ROC curve for clinical remission in the second determination.
ROC curve data for clinical remission in the second determination.

CD, Crohn’s disease; CI, confidence interval; USTTL, ustekinumab through levels.
Discussion
Our study was conducted in a cohort of difficult-to-treat IBD patients, managed in a tertiary care center, and showing elevated rates of complicated CD, perineal disease, or past surgery. Almost all of them had been pretreated with at least one anti-TNF. The rates of clinical response and clinical remission were 51.2% and 42.5% in period 1, with a median time of approximately 1 year of UST treatment.
In our routine practice, patients with good clinical evolution and normalization of biochemical markers do not undergo disease control endoscopies (except for other reasons such as colorectal cancer screening), and the trend is to maintain the same treatment and dosage that is currently working. We are aware that this approach will change in the future, aiming to achieve more ambitious goals, including endoscopic and histological healing, which undoubtedly require many more resources. For those patients in whom the therapeutic approach will not change, new USTTL are not requested and that might explain why only 46 out of 125 patients underwent a second determination after an additional median duration of 6 months and an increase in response and remission rates reaching 80.4% and 73.9%, respectively. In our study, this approach is reflected in the data obtained since the proportion of intensified treatment climbed from 31% up to 98% in the second determination. Thus, the success of UST treatment is rather elevated in our patients, which is probably a consequence of the high proportion of intensified schedules. However, follow-up data are not collected for those patients without a second determination so we cannot determine whether they are patients who continue with the treatment showing good progress or if they abandon it.
We demonstrated significantly higher USTTL in CD patients with clinical remission during UST treatment, with cutoff value of 2.42 μg/mL in period 1. This value is even higher if we analyze every IBD patient with two determinations at the end of period 2, with a cutoff value of 6.34 μg/mL. Considering 98% of them are on an intensified regimen, these data suggest that those refractory patients who present low USTTL levels may opt to intensify the regimen, maximize the effectiveness of UST, and achieve clinical remission.
Our work also highlighted higher USTTL in patients receiving optimized dosing of UST, through SC or IV route. Longitudinal follow-up showed an increase in USTTL while clinical and biochemical parameters were decreasing, significantly. The difference in USTTL between first and second determinations was significantly higher in patients who could recapture clinical response. These data together support the idea that the outcome of the treatment by UST might be related to USTTL and modified by optimizing the dosage.
Those results are consistent with some literature on this topic. In particular, a systematic review and meta-analysis published in 2023 by Vasudevan et al. 12 has concluded from 14 observational studies that there was an association between higher USTTL and clinical remission in CD. Nevertheless, other studies did not find such an association between USTTL and clinical outcomes,10,13–15 but still an association between USTTL and a biochemical or endoscopic outcome.
These studies are prospective, with CD patients who started the treatment and who have been followed since induction, contrary to ours, which is retrospective, including CU patients and 88% were in maintenance treatment. Battat et al. found a cutoff point in endoscopic response of 4.5 μg/mL at week ⩾26 after induction but clinical outcomes were not associated with USTTL. Straatmijer et al. found that USTTL above 6.3 at week 8 after induction was associated to higher biochemical remission rates at week 24. Proietti et al. also explored the tissue drug level in intestinal biopsies, showing a positive correlation with the serum drug concentration. However, this technique did not seem to get better results than serum levels as they did not demonstrate an association between tissue drug levels and clinical response.
Pivotal studies UNITI 1, UNITI 2, and IM-UNITI have led to pharmacokinetics and exposure-response data. In CD, after one IV or SC induction dose at W0 and one SC injection at W8, UST concentrations reached a steady state by the second SC maintenance dose, that is, W16–W20, with a median value of 1.1 μg/mL. 16 In the subsequent studies, median or mean UST-L in maintenance phase (from W16) generally ranged from 0.3 to 2.4 µg/mL,15,17–21 while the proportion of patients treated beyond the approved dosage of SC 90 mg every 8 or 12 weeks represent 0%–17%. In contrast, higher rates have been described with intensified schedules of treatment. McDonald et al. 22 even reported a mean UST-L as high as 16.4 µg/mL in a small sample of 10 patients receiving SC 180 mg every 4 or 8 weeks. Therefore, our fairly high values coincide well with the literature data. Of note, unlike the anti-TNF, the pivotal studies as well as the other concluded in a very low observation of anti-UST antibodies, and the absence of relationship between UST-L, anti-UST antibodies, and concomitant immunosuppressant. There is no well-established predictive factor of elevated USTTL in our study apart from UST dosage, although the UNITI pharmacokinetics study from Adedokun et al. highlighted in a quartile analysis an association with high albumin, low FC, and low CRP at baseline, but no role of previous medication. 22
Despite the concordant serum concentrations of UST in literature, it is difficult to detect adequate cutoff values for each endpoint. Authors have proposed 1.4 μg/mL for clinical remission, 18 1.7 or 2.0 μg/mL for biochemical remission, 1.1 or 2.0 μg/mL for endoscopic remission, 21 1.1–2.3 μg/mL for composite criteria.14,18,20 However, the mentioned above meta-analysis concluded that the comparison of cutoff values did not reach a statistically significant difference, possibly because of a lack of power due to the small effectiveness.
It has been demonstrated that we can get further efficacy by intensifying UST schedule, and this attitude is already widespread in some centers. Consequently, determining USTTL in routine practice could help physicians to guide their decision between UST escalation or change of class. The near-complete absence of anti-UST antibodies eliminates the potentiality of immunization in our reflection on therapeutic strategy. To increment arguments toward the determination of a USTTL target, we should get further understanding of predictive factors of high USTTL and conduct prospective studies of USTTL-based treatment strategies.
The strengths of our study were the substantial number of patients, the high proportion of patients receiving an intensified regimen of treatment with UST, and the existence of longitudinal data. The main limitation was its retrospective design which resulted in heterogeneous USTTL sampling times. Additionally, the selection of patients getting one or more determinations of USTTL was presumably biased. The small proportion of UC patients makes it difficult to interpret the results in this subgroup. At last, the results cannot easily be extrapolated as they concern a cohort of notably high-to-treat patients. However, this leads us to believe that there is a group of IBD patients who require higher USTTL levels to achieve clinical remission.
To conclude, our study emphasizes the existence of an association between USTTL and clinical response in a large real-world cohort including a significant proportion of patients with optimized regimens of UST. This supports the hypothesis that patients undergoing UST treatment may benefit from a change in dosage to increase USTTL and achieve clinical improvement. However, further prospective studies are necessary to validate this approach through an adequate strategic design to collect protocolized data.