
Abstract
Background:
The approval of ustekinumab (UST) has opened new options for the treatment of Crohn’s disease (CD), but potential markers predicting the efficacy of this interleukin-12/23 inhibitor are lacking. Contrast-enhanced ultrasound (CEUS) is non-invasive alternative to endoscopy, demonstrating early transmural changes after treatment induction.
Objectives:
We conducted a prospective monocentric study aiming to explore the value of multimodal intestinal ultrasound (IUS) in predicting the response to UST in patients with active CD who have been previously exposed to anti-tumour necrosis factor α (TNFα).
Design and methods:
Consecutive patients with moderate-to-severe CD involving the terminal ileum who were scheduled to begin UST therapy were enrolled between January 2020 and October 2021 in the inflammatory bowel diseases outpatient centre. A complete IUS evaluation, including B-mode, Doppler, dynamic CEUS and elastography, was performed at the time of induction (T0) and after 8 (T1), 16 (T2), 24 (T3) and 48 (T4) weeks of therapy. Each IUS parameter and their variations from baseline were correlated with endoscopic response and mucosal healing after 1 year.
Results:
A total of 52 patients were included, 29 (55.8%) of which reached endoscopic response at T4. The univariate analysis revealed that, between T3 and T0, the percentage changes of bowel wall thickness, Limberg score, mean signal intensity, rise time, wash-in rate, C reactive protein and Harvey–Bradshaw Index were associated with long-term therapeutic outcome. Based on the above parameters, we developed an IUS score that showed a good performance in predicting 1 year-endoscopic response (area under the curve: 0.91).
Conclusion:
Multimodal ultrasound could be helpful to predict long-term therapeutic outcome in patients with CD treated with UST.
Registration:
NCT05987501.
Plain language summary
Introduction
Crohn’s disease (CD) is an inflammatory bowel disease (IBD) characterized by transmural chronic inflammation of the gastrointestinal tract and alternating episodes of inflammation and remission.
Ustekinumab (UST), a monoclonal antibody targeting the p40 subunit of interleukin (IL)-12 and IL-23, has been introduced as an effective pharmacological option in CD. 1 Recent data show that 12-month response rates to UST are similar to anti-tumour necrosis factor (TNF)-α, with about 57% and 55–76% of patients achieving clinical and endoscopic remission, respectively.2–4
However, there are still many unanswered questions regarding the use of UST, notably the best positioning in the CD management algorithm and optimal timing and modalities for monitoring therapeutic response.
The recently recognized importance of transmural healing of the intestinal wall can be evaluated by cross-sectional imaging modalities, such as computed tomography (CT) and magnetic resonance imaging (MRI). 5 In such a context, intestinal ultrasound (IUS) is gaining a growing interest, due to its large availability, non-invasivity, cost-effectiveness and high accuracy in detecting transmural disease activity. Different trials and meta-analyses showed that IUS is equally sensitive and specific as CT and MRI in diagnosis and follow-up of CD. 6 Bowel wall thickness (BWT) is probably the most robust parameter for determining disease activity whereas several semi-quantitative colour Doppler IUS scores have been developed to assess vascularization.7,8 However, as both inflammation and fibrotic changes are simultaneously present in CD-affected bowel, other activity parameters should also be assessed, especially in patients non-responders to previous anti-inflammatory treatments.
New ultrasonographic tools, particularly dynamic contrast-enhanced ultrasound (D-CEUS) and shear wave elastography (SWE), could provide quantitative estimation of bowel intramural microvascularization9,10 and tissue stiffness (reflecting fibrotic versus inflammatory status of bowel strictures), 11 respectively. In particular, ultrasound contrast agent may improve IUS’s correlation with endoscopic activity and assessment of treatment response. 12 However, this technique is not yet standardized and its role in the evaluation of inflammation remains controversial. 13 On the other hand, a recent systematic review concluded that elastography could be valuable as a supplementary diagnostic method in patients with CD, although its role in the assessment of treatment response needs further evidence. 14
We hypothesized that the combined application of multiple ultrasound technologies could allow for more comprehensive and effective evaluation of CD. However, to our knowledge, there are no reports concerning the role of a multiparametric IUS assessment in the evaluation of treatment response to UST.
Therefore, our main objective was to evaluate the role of a multimodal IUS approach in predicting endoscopic response to UST in patients with active ileal or ileocolonic CD who failed previous biological therapies. The secondary aim was to develop an IUS score that allows one to predict treatment response.
Materials and methods
Patients
Between January 2020 and October 2021, consecutive patients with CD who referred to our IBDs outpatient clinic to begin treatment with UST were evaluated for enrolment.
Inclusion criteria were age older than 18 years, diagnosis of CD with terminal ileum involvement, clinically active CD defined as Harvey–Bradshaw index 15 (HBI) ⩾7, ileal wall thickness ⩾3 mm at IUS, 16 patients experienced to biological therapy and available ileo-colonoscopy performed within 3 months from baseline.
Patients with any change of treatment between baseline endoscopy and IUS were excluded from the study. Other exclusion criteria were involvement of gastrointestinal segments other than the terminal ileal tract, hypersensitivity to SonoVue® (Bracco, Milan, Italy), treatment with UST as post-surgical prophylaxis, heart failure, pregnancy and any condition affecting patient’s ability to provide informed consent.
The study protocol was approved by the University Hospital ‘Agostino Gemelli’ IRCCS Institutional Review Board. All patients provided written informed consent.
Study protocol
This is a prospective, monocentric study including outpatients with moderate-to-severe CD at an Italian university hospital serving as a tertiary referral centre for the treatment of IBDs. The reporting of this study conforms to the Strengthening the Reporting of Observational Studies in Epidemiology statement. 17
UST (Stelara®; Janssen Biotech Inc., Latina Italy) was administered according to standard protocol of clinical practice.
For the purpose of the study, patients were evaluated the same day of induction (T0-baseline) and at 8 (T1), 16 (T2), 24 (T3) and 48 (T4) weeks. At each time point standard IUS, D-CEUS, SWE and laboratory exams were performed and disease activity was calculated trough HBI. All patients underwent ileo-colonoscopy at T4 to evaluate the segmental simplified endoscopic activity score for CD (SES-CD) 18 (Supplemental Figure 1). Endoscopy was performed within 1 month but not the same day of IUS.
Based on endoscopic assessment at T4, patients were classified as responders or non-responders considering the segmental SES-CD score of the same bowel segment investigated by D-CEUS and SWE (terminal ileum). According to STRIDE (Selecting Therapeutic Targets in Inflammatory Bowel Disease), endoscopic response was defined as SES-CD reduction of at least 50% from baseline, whereas mucosal healing was defined as SES-CD < 3. 19
Primary outcome was the assessment of differences in D-CEUS kinetic parameters at different time points and their correlation with endoscopic response and mucosal healing at T4. Secondary outcome was the development of an IUS based multiparametric score to predict endoscopic response.
Ultrasound examination
IUS examination was performed by two expert ultrasonographers (MAZ and MEA, with 18 and 13 years of experience in gastrointestinal imaging, respectively; one clinician for patient), both unaware of the clinical and endoscopic activity status of the patients.
All examinations were performed with Aixplorer Mach 30 (Supersonic®; Aix en Provence France) equipped with an L 10-2 MHz linear probe for detailed evaluation of the intestinal wall.
After at least 6 h of fasting, IUS was performed on the terminal ileum with patients in supine position in two phases. First, the morphologic study was performed in B-mode in order to identify the terminal ileal loop with the probe in the right lower abdomen, using the right iliac artery and vein as landmarks and gradual compression to measure the BWT at the level of the anterior wall. Among basal IUS features, we selected BWT because previous studies demonstrated high accuracy for this parameter to predict endoscopic response and remission after initiation of therapy.20,21
Subsequently, colour Doppler imaging was performed to evaluate the bowel wall vascularization and grade them according to the Limberg scoring system (LS). 22
2D-SWE measurements were obtained using the UltraFast™ software (Supersonic, Aix en Provence France) with suspended normal breathing and the SWE box positioned on the bowel wall in a longitudinal section. The Q-Box was positioned in an area of relative uniform elasticity in the anterior part of the bowel wall including all five layers, excluding surrounding tissue and luminal content. We considered reliable all cases with a stability index (SI) of at least 90%. The median value of at least three successful measurements was considered for analysis and was expressed in kilopascals. An interquartile range to the median ratio (IQR/M) < 30% was used as a measurement reliability criterion.
For D-CEUS, an intravenous bolus of 4.8 ml of sulphur-hexafluoride-filled microbubbles (SonoVue®) was injected, followed by 10 ml of normal saline solution, using a 20-gauge venous catheter that had been inserted into the cubital vein at the level of the left antecubital fossa. A dedicated, contrast-specific technique was used according to a standardized protocol in order to study the whole vascular phase consisting of the arterial phase and the venous phase 15 (Figure 1). Overall gain was set to obtain a complete anechoic image of the bowel for the basal phase, depth was regulated according to the patient’s habitus and focus position was always set below the area to be examined. The imaging parameters (gain, depth and scanning plane) were the same among different examination of the same subject. Signal enhancement of bowel vascularization was evaluated in real time, and a dynamic sequence of 3 min was recorded on a hard disk and exported as Digital Imaging and Communications in Medicine for further analysis.
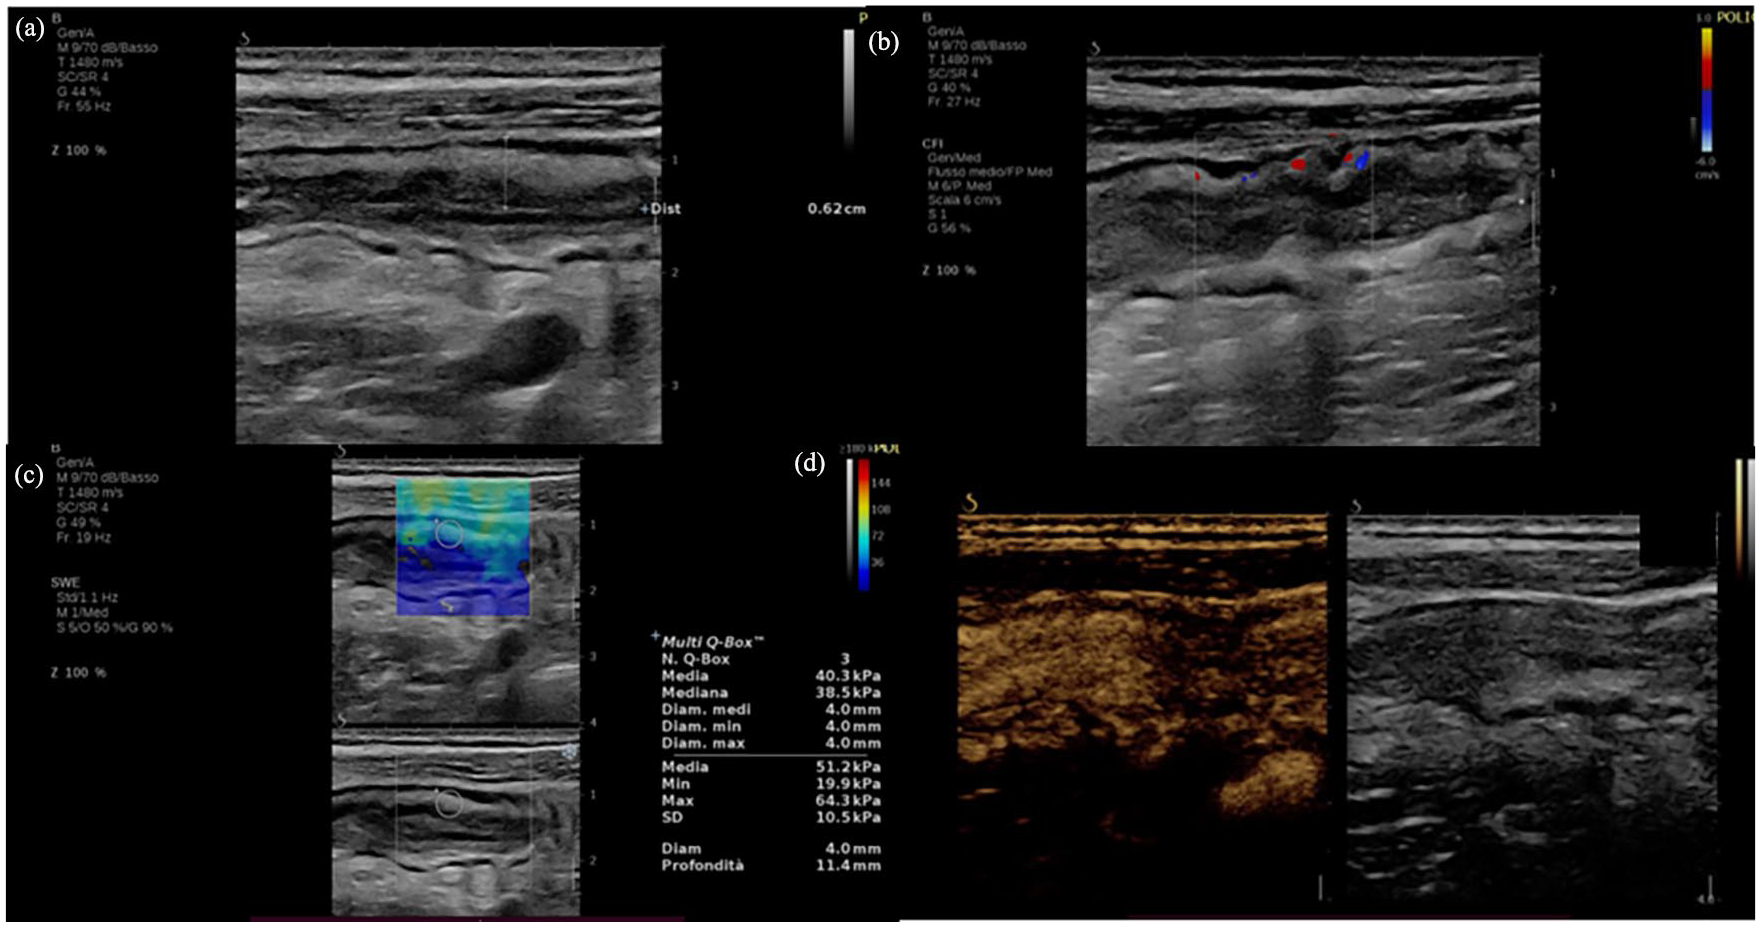
Multiparametric IUS of a 79-year-old patient with active Crohn’s disease. It displays the terminal ileum showing a thickened bowel wall with normal stratification (a), the presence of vascular signals at colour Doppler imaging (LS 2) (b), an elevated bowel stiffness at 2D SWE (c) and (d) hyperperfusion at contrast-enhanced ultrasound.
Digitalized quantification of contrast uptake was performed using the quantitative analysis software package VueBox, Version 7.4 (Bracco, Milano, Italy).
The analysis can display the mean, median and the standard deviation of intensity pixel within the region of interest (ROI) drawn on the image for each frame of the sequence acquired. In our study the time–intensity curves were generated from a manually defined ROI, placed over the anterior bowel wall and large enough to encompass the five bowel layers avoiding lumen and the mesentery fat. Respiratory movement artefacts were eliminated by automatic adjustments and, when necessary, by deleting selected frames in the post-processing analysis. Quantification was done on uncompressed linear data (raw data), which is linearly proportional to microbubble concentration. The results were expressed as intensity values after calculating the arithmetic mean of pixel intensities. A gamma variate fit was used as a statistical model to normalize the dispersion of gamma values in the perfusion analysis.
Eight perfusion parameters were extracted from time–intensity curves: peak enhancement, PE (in arbitrary units, AU); mean signal intensity (meanLin, in AU), area under the wash-in curve, WiAUC (in AU); wash-in rate, WiR (in AU); rise time, RT (in seconds); time to PE, TTP (in seconds); mean transit time local, mTT (in seconds); area under the wash-out curve, WoAUC (in AU); and area under the wash-in and wash-out curve, WiWoAUC (in AU). The percentage change of each semi-quantitative kinetic parameter was calculated from the linear value of each kinetic parameter measured in the bowel wall according to the following equation: (post − pre)/pre × 100, where pre means pre-treatment, and post means different time points after initiation of therapy.
The entire quantification process was performed by one author (MEA), blinded to clinical outcome of the patients.
Statistical analysis
Descriptive statistics were presented as absolute number and percentages for categorical variables and median with IQR or mean ± standard deviation for continuous variables. Baseline US parameters and their variations between T0 and the selected time points (Ta) were calculated as percentage changes (∆%) [(Ta − T0)/T0]. Association between variables at T0 and ∆% with endoscopic response and mucosal healing at 1 year was assessed with Chi-squared test, Student’s t test or Mann–Whitney U test when appropriate.
Unadjusted logistic regression analysis was performed for each predictive variable to assess the association with endoscopic response at 1 year. Odds ratio (OR) estimates for the selected variables were reported together with 95% confidence intervals.
Clinical and IUS parameters, together with percentage changes of D-CEUS parameters at selected time point, were combined into a multivariable logistic regression model with a forward stepwise selection procedure to select the optimal parameters.
Performance of the score was assessed by the goodness of fit and discrimination ability. Discrimination ability was assessed using a receiver operating characteristic (ROC) curve analysis and measuring the area under the curve (AUC). Cut-offs proposed were obtained applying the maximum Youden Index criterion and sensitivity, specificity, positive predictive value (PPV) and negative predictive value (NPV) were computed.
Statistical analysis was performed with STATA® (Version 17; Stata Corporation, College Station, TX, USA), JAMOVI (Version 2.3.19.0) and JASP (Version 0.16.4; University of Amsterdam, Amsterdam, The Netherlands).
Results
Patients’ clinical and US data
During the enrolment period, 65 patients with a proved diagnosis of active CD were scheduled to start treatment with UST and were assessed for eligibility. Among them, seven patients did not enter the study because of the involvement of bowel tracts other than the terminal ileum. In total, 58 patients met the inclusion criteria and were included in the study. Six patients discontinued treatment before the response assessment at 48 weeks: four were lost to follow-up, two required surgery due to bowel obstruction. Therefore, 52 patients [30 men, 22 women; median age (IQR): 50 [42–57] years] completed the study. Demographic and clinical data of the study population are provided in Table 1.
Demographic, biochemical and clinical data of CD patients at baseline.

Data are expressed as percentages (absolute numbers) or median values (interquartile ranges), as appropriate.
BMI, Body Mass Index; CD, Crohn’s disease; SES-CD, simplified endoscopic activity score for CD.
With ileo-colonoscopy used as a reference standard, 29 patients were classified as responders (55.8%) and 23 as non-responders (44.2%). Mucosal healing was obtained in 17 patients (32.7%). The clinical data of the two groups were comparable.
IUS parameters and endoscopic response
Regarding baseline IUS characteristics, there were no significant differences in BWT, LS and SWE values between responders and non-responders. As concerns D-CEUS perfusion parameters, PE and WiR at baseline were significantly higher in responders compared to non-responders (p = 0.02 and p = 0.01, respectively) (Table 1, Figure 2 and Supplemental Material). Similar results were obtained when we considered mucosal healing (Table 1 and Supplemental Material).

Graphic representation of median values at different time-point according to endoscopic response at 1 year.
During treatment, neither BWT nor SWE was associated with endoscopic response both at T1 and T2. Similar results were obtained for LS and most D-CEUS parameters except for mTT at T1 and T2 and LS at T2. On the contrary, the median values of BWT, LS, RT, TTP and WiR at T3 were significantly different in responders and non-responders (Table 1, Figure 2 and Supplemental Material).
As absolute values of D-CEUS parameters are known to be affected by intra- and inter-individual variability, we decided to use differences of the IUS parameters respect to baseline. According to the Analysis of Variance (ANOVA) test and the post hoc analysis, we identify the difference between T3 and T0 (∆) as the best time point for the evaluation of treatment response (Table 2).
Percentage changes of ultrasonographic parameters from baseline to T1, T2 and T3 according to endoscopic response.

Data are expressed as median values (interquartile ranges).
HBI, Harvey–Bradshaw index; mTTI, mean transit time local; PCR, protein C reactive; PE, peak enhancement; RT, rise time; TTP, time to PE; WiAUC, area under the wash-in curve; WiR, wash-in rate; WiWoAUC, area under the wash-in and wash-out curve; WoAUC, area under the wash-out curve.
After 24 weeks of therapy, we found a significant decrease in BWT and LS in responders compared to non-responders (p < 0.01) and the ratio between D-CEUS examinations at T0 and T3 was significantly different in all perfusion parameters (Table 2). In particular, patients with endoscopic response showed a significant decrease of MeanLin, PE, WiR, WiAUC, WoAUC and WiWoAUC (p = 0.01 for MeanLin, PE e WiAUC, p < 0.01 for WiR, p = 0.05 for WoAUC, p = 0.02 for WiWoAUC) and a significant increase of RT, mTT and TTP (p < 0.01 for RT and TTP, p = 0.02 for mTT). The same parameters except for BWT, mTT and WiWoAUC were also associated with mucosal healing (Table 2).
Finally, the percentage variation in SWE values between T3 and T0 was significantly different in responders and non-responders. In particular, responders had a more evident decrease in SWE values compared to non-responders (−25.7 versus −4.2, p = 0.03) (Table 2).
Clinical examples of responder and non-responder with the corresponding time–intensity curves at different time points are shown in Figure 3.

Target bowel loop in patients with CD. (a) Clinical example of responder and (b) non-responder. Contrast-enhanced ultrasound with corresponding time–intensity curve at baseline, T1 and T2 after UST treatment. It is possible to observe a reduced maximum enhancement and lower area under the enhancement curve at T1 and T2 compared to baseline, whereas in non-responders, no significant differences in perfusion parameters among different time points were detected.
According to the univariate analysis, the percentage reduction between T3 and T0 of BWT [OR: 0.95, 95% confidence interval (CI): 0.92–0.99, p = 0.01], LS (OR: 0.96, 95% CI: 0.93–0.99, p = 0.01), meanLin (OR: 0.98, 95% CI: 0.97–0.99, p = 0.03), WiR (OR: 0.97, 95% CI: 0.96–0.99, p < 0.01) and HBI (OR: 0.95, 95% CI: 0.91–0.98, p < 0.01) and the increase of RT (OR: 1.04, 95% CI: 1.02–1.07, p < 0.01) were all associated with endoscopic response (Table 3).
Univariate and multivariate analysis according to endoscopic response.
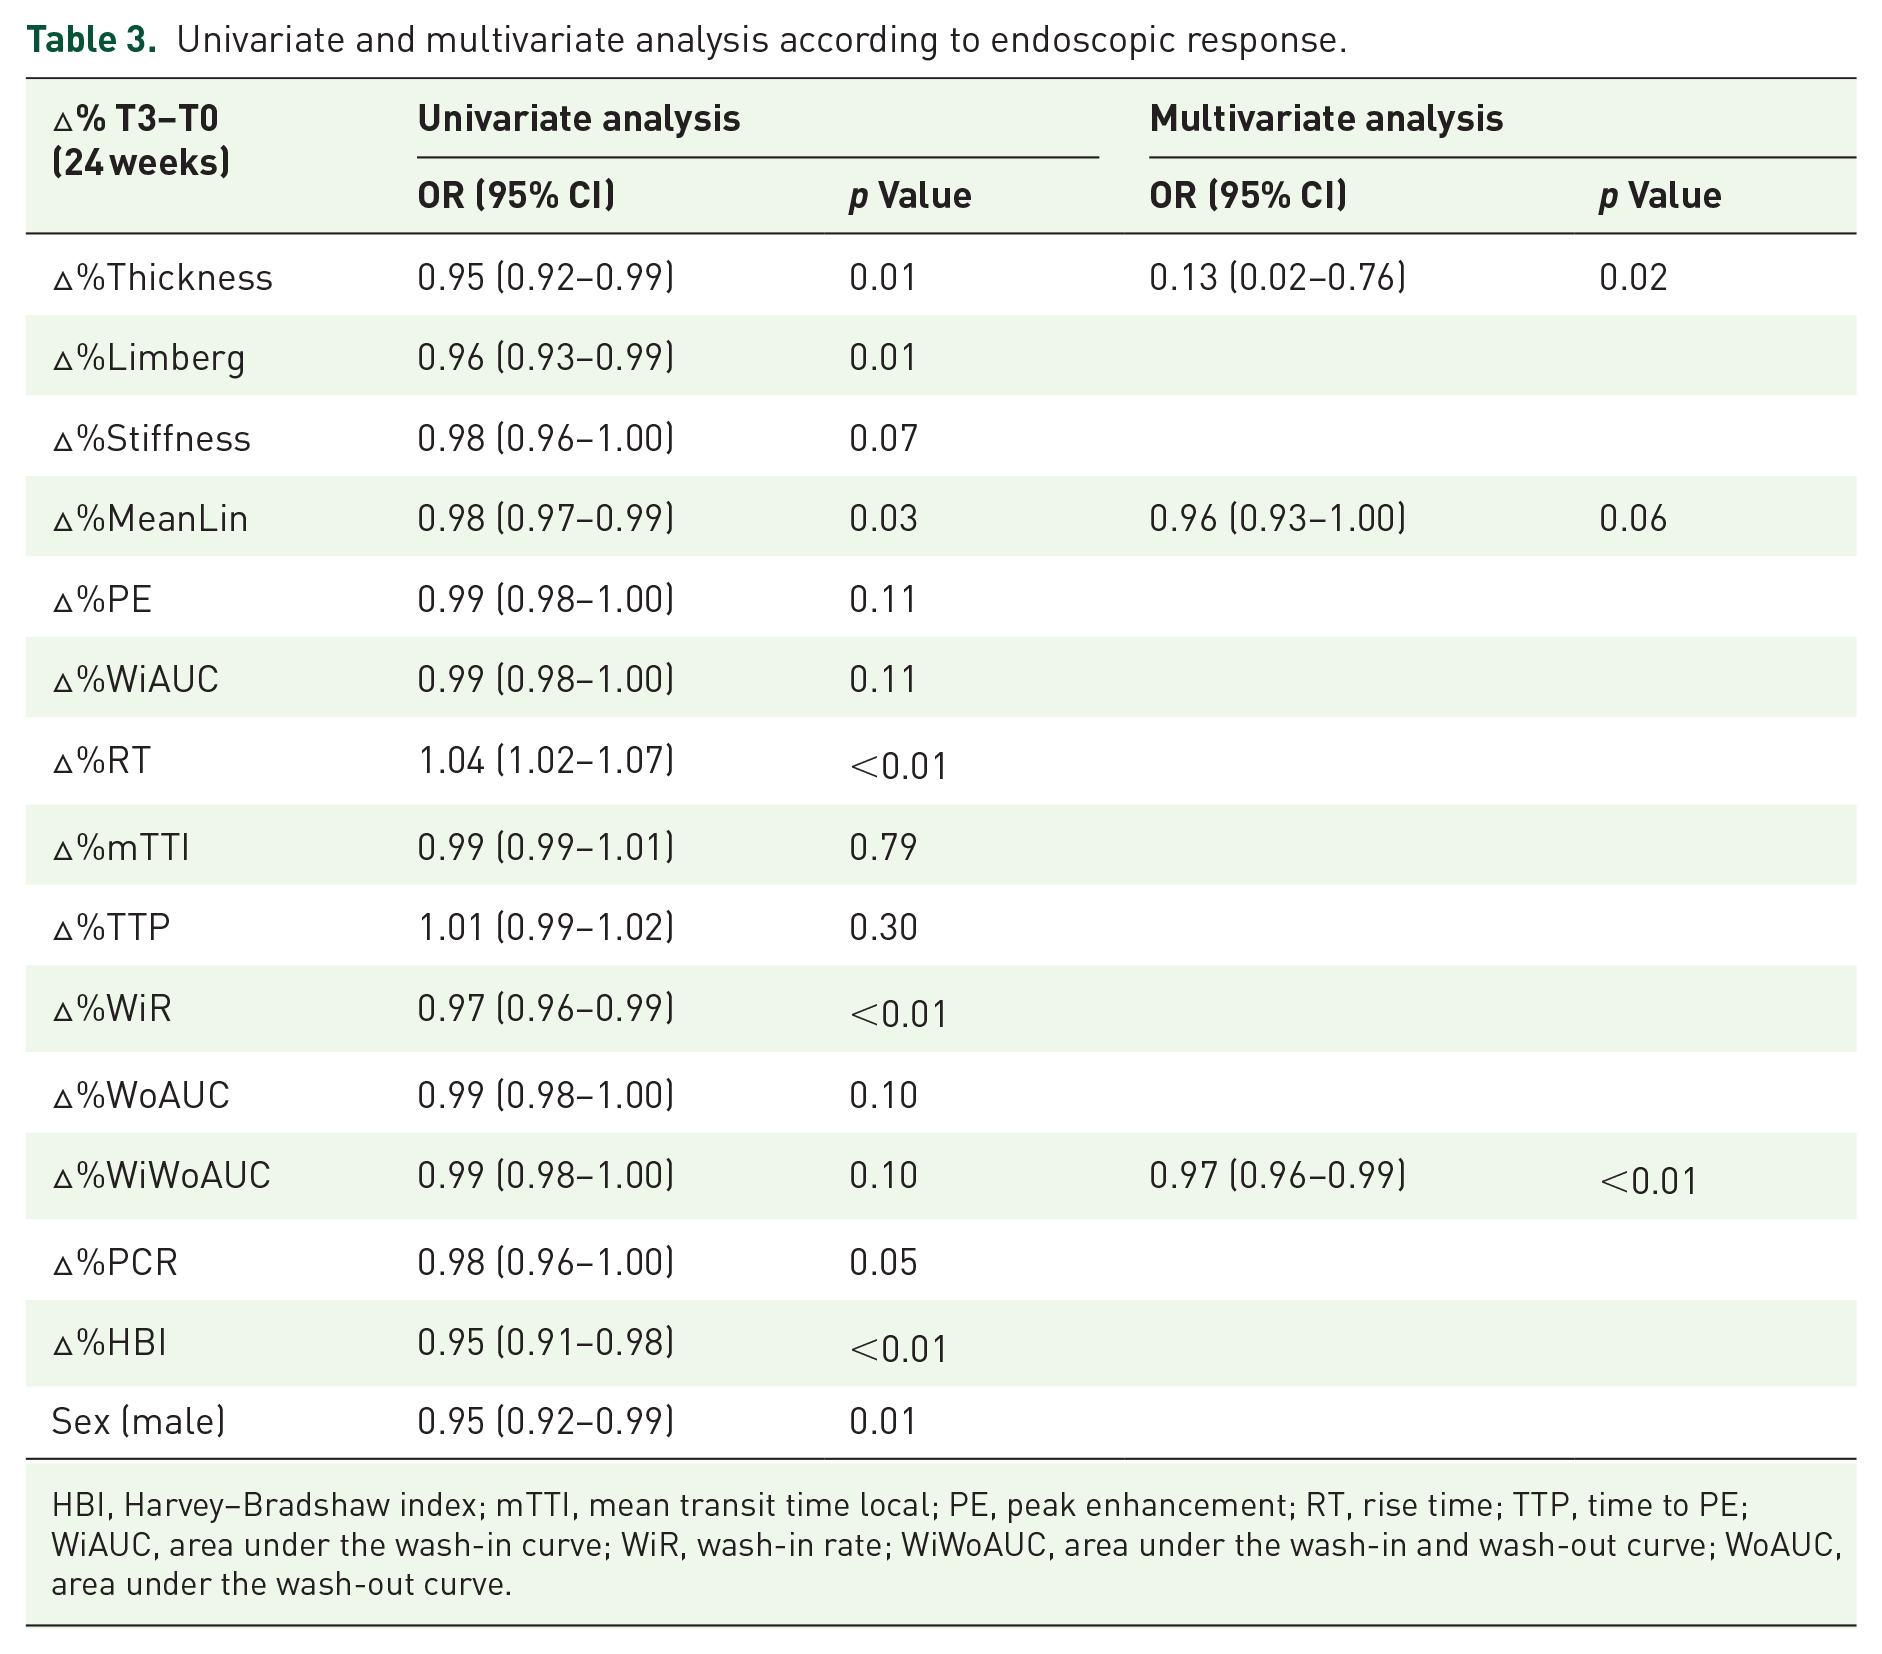
HBI, Harvey–Bradshaw index; mTTI, mean transit time local; PE, peak enhancement; RT, rise time; TTP, time to PE; WiAUC, area under the wash-in curve; WiR, wash-in rate; WiWoAUC, area under the wash-in and wash-out curve; WoAUC, area under the wash-out curve.
Predictive model for assessing endoscopic response
A multivariate logistic regression analysis was carried out to assess the influence of each parameter in predicting endoscopic response (Table 3). According to the forward stepwise selection procedure, three independent predictors were selected: male sex (p < 0.01), percentage change of LS between T3 and T0 (∆%LS, p = 0.10) and percentage change of WiR between T3 and T0 (∆%WiR, p = 0.04). A score based on those variables was highly accurate in predicting endoscopic outcome, with an area under the ROC curve of 0.91 compared to 0.75 of both percentage change of BWT between T3 and T0 (∆%BWT) and ∆%LS. In that way, the predictor equation for detecting endoscopic response at 1 year would be:

P = predicted probability of endoscopic response:

Δ%: percentage difference between T3 (24 weeks) and T0 (baseline).
SEX: 0 if female, 1 if male.
That score was highly accurate in detecting non-responders to UST (sensitivity 96.5%, specificity 78.3%, PPV 84.8% and NPV 94.7%), using a cut-off point under 0.51 (Figure 4, Supplemental Figure 2).
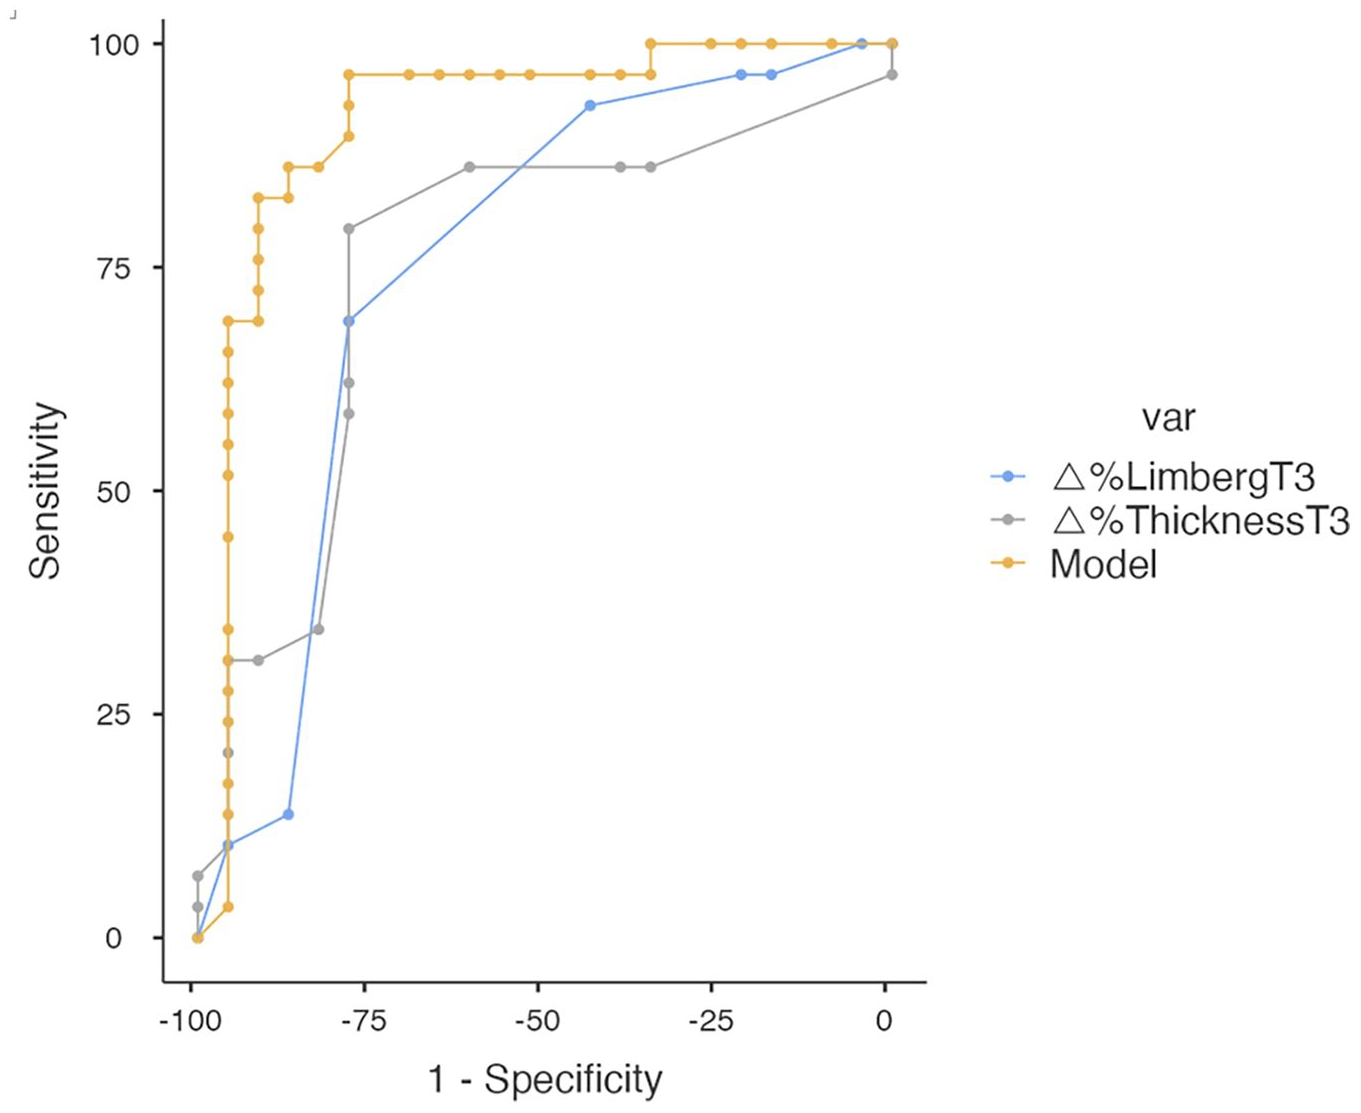
Receiver operating characteristic (ROC) curves of the score’s accuracy in predicting endoscopic outcome compared to.
Discussion
Previous studies have already demonstrated the high accuracy of IUS in detecting disease activity and monitoring treatment response in CD.12,20,23,24 Kucharzik et al. 23 showed a good correlation of IUS parameters with symptoms and serological markers. de Voogd et al. 20 demonstrated a significant decrease of BWT in patients achieving endoscopic response. In a recent study, our group has underlined the role of D-CEUS as a reliable predictor of combined clinical and endoscopic response to therapy in CD. 12
Nonetheless, these results mostly concern anti-TNFα drugs and data about other biologic therapies are limited. UST has been introduced in clinical use for CD only a few years ago, and its efficacy has already been demonstrated in first-line treatment-refractory patients. 25 Therefore, we aimed to update data on multiparametric IUS role in monitoring IBD patients focusing our research on this new biologic drug.
Multi-modal IUS offers advantages over single-modal IUS, providing a global disease assessment, with a high reproducibility thanks to its quantitative measurements and a strong correlation with reference standard methods. 26 A few studies have already evaluated the combination of different IUS techniques to assess the activity in CD, and a multimodal IUS parametric regression model was designed by Jing et al. 27 to distinguish active from inactive patients, but no data on treatment monitoring are available so far.
To our knowledge, this study is the first to combine B-mode IUS, colour-Doppler, D-CEUS and SWE to assess the presence of any predictor parameter of endoscopic response to UST in patients with CD.
Our results demonstrate that multiparametric dynamic IUS variations during treatment can accurately differentiate between responders and non-responders. In particular, by using a multiparametric approach, IUS evaluation at week 24 after UST induction seems to be appropriate to predict endoscopic response.
Interestingly, our results on B-mode parameters were of limited use in predicting endoscopic outcomes at least in the early phases after the beginning of UST treatment. This is in contrast with previous reported data. Hoffmann et al. 28 showed that patients with clinical and serological improvement had a decrease of BWT ⩾ 1 mm 8 weeks after the beginning of UST. More recently, a sub-study from the STARDUST (Study of Treat to Target versus Routine Care Maintenance Strategies in CD Patients Treated with Ustekinumab) trial found a statistically significant agreement between BWT and endoscopic SES-CD at week 48, with a NPV ranging from 73 to 80 at the different time points.29,30 In our study, the decrease in BWT appeared as a predictor of 1-year endoscopic response only after 6 months of treatment. In line with the results of the STARDUST study, the selection of patients with terminal ileal disease could be an explanation of the slower response rate of our population compared to other studies. 24 However, this observation could also be sustained by the refractory nature of the disease in our study group, since we enrolled only patients who failed previous biological therapies whereas in other studies are also included biologic-naïve patients.
Indeed, we observed a correlation between the variation of other features included in the multiparametric IUS and endoscopic response. In particular, 24 weeks after the beginning of UST, responders showed a significant difference in bowel wall vascularization and stiffness as well as in all D-CEUS parameters.
In CD, there is a spectrum of acute to chronic inflammation and associated fibrosis within the bowel wall. Therefore, accurate assessment of both components, inflammation and fibrosis, is crucial. 26
In our study, the decrease of LS among responders is related to reduced intestinal perfusion due to disease activity improvement, consistently with previous results. 20 CEUS can improve the detection accuracy of tiny blood vessels, and some recent studies have focused on D-CEUS as quantitative biomarker of blood flow in patients treated with anti-TNFα drugs.12,31
Although there is no agreement on which quantitative parameter is more important in the assessment of treatment response, the overall trend is that volume parameters (PE, WiR and AUC) are positively correlated with the outcome, while flow parameters (TTP, RT and mTT) are negatively correlated. 31 Our data have confirmed the association between the reduction of parameters associated to blood volume (WiR) and the increase of that related to blood flow (TTP, RT) after 24 weeks of treatment and the achievement of endoscopic response under UST therapy. In particular, the possibility to calculate patient percentage change limits variability and could allow a more reproducible comparison of the results between responders and non-responders. 32
Moreover, we found an association between reduction of bowel stiffness and the therapeutic outcome. This is a new result in the scenario of treatment monitoring. In fact, SWE has been extensively used to judge bowel wall fibrosis and to better characterize CD complications, but not the status of activity.11,33–35 Bowel stiffness tends to increase in inflamed regions of the bowel wall in patients with CD, and limited data showed an even higher increase in SWE in diseased bowel wall with fibrotic change or muscular hypertrophy. 36 We can speculate that the reduction in stiffness values in patients with endoscopic response could be related to improvement and healing of the bowel wall. However, in the multivariable logistic regression model, only D-CEUS parameters together with sex and LS were predictors of response to UST therapy. Based on these parameters, we developed a multiparametric score with high sensitivity for the evaluation of endoscopic response. In contrast to previous studies that fail to demonstrate an additional value of CEUS, our score showed a higher accuracy in predicting endoscopic response compared to standard BWT and LS. 20 These discrepancies could be related to the different population enrolled. In fact, most of the studies were performed with patients naïve to biological therapies or mixed population, whereas our study focused the attention on patients with refractory disease. Naturally, these results should be validated in different cohorts. However, the development of an easily applicable and accurate score could be of great clinical value since it facilitates treatment monitoring and reduces variability, particularly in complex disease phenotypes.
Our study is not free from limitations. First, the sample size is relatively small, and the results obtained by multiparametric assessment need to be validated in independent cohorts. Moreover, we only considered anti-TNFα refractory patients treated with UST and our results should be extended also to biologic-naïve patients. Second, when defining endoscopic response, we classified as responders two different groups of patients, those who achieved mucosal healing (SES-CD = 0) and those who had a mucosal activity improvement (SES-CD decrease of at least 50%). We decided to adopt this broad definition of endoscopic response to be consistent with real-life. In fact, in clinical practice in both cases patients will continue therapy. Third, the exclusion of patients with isolated colonic involvement could introduce a selection bias. However, we decided to select a population that was as homogeneous as possible. Moreover, the terminal ileum is the most affected segment in CD and, due to its position, it is easily identifiable during repeated examinations, allowing a better standardization of the technique.
Finally, some limits belong to IUS technique itself, which is known to be operator-dependent and may be affected by some specific conditions, such as obesity. However, SWE and D-CEUS provide a quantitative and so more objective analysis, thus helping to partially overcome these difficulties.
In conclusion, in patients affected by CD undergoing biologic therapy with UST, a 24-week multiparametric IUS can provide useful information predicting 1-year endoscopic response. This approach may help clinicians in the decision-making process, leading to confirm or modify therapeutic strategies, including the possibility to switch to another biological drug in case of non-response. Further studies on larger cohorts are needed to validate our results in clinical practice.
Supplemental Material
sj-docx-1-tag-10.1177_17562848241259289 – Supplemental material for Multimodal dynamic ultrasound approach as predictor of response in patients with Crohn’s disease treated with ustekinumab
Supplemental material, sj-docx-1-tag-10.1177_17562848241259289 for Multimodal dynamic ultrasound approach as predictor of response in patients with Crohn’s disease treated with ustekinumab by Maria Elena Ainora, Antonio Liguori, Irene Mignini, Marco Cintoni, Linda Galasso, Lucrezia Laterza, Loris Riccardo Lopetuso, Matteo Garcovich, Laura Riccardi, Antonio Gasbarrini, Franco Scaldaferri and Maria Assunta Zocco in Therapeutic Advances in Gastroenterology
Footnotes
References
Supplementary Material
Please find the following supplemental material available below.
For Open Access articles published under a Creative Commons License, all supplemental material carries the same license as the article it is associated with.
For non-Open Access articles published, all supplemental material carries a non-exclusive license, and permission requests for re-use of supplemental material or any part of supplemental material shall be sent directly to the copyright owner as specified in the copyright notice associated with the article.