
Abstract
Background:
The operative link for the gastritis assessment (OLGA) system can objectively reflect the stratification of gastric cancer risk in patients with chronic atrophic gastritis (CAG).
Objectives:
We developed a real-time video monitoring model for the endoscopic diagnosis of CAG and OLGA staging based on U-Net deep learning (DL). To further validate and improve its performance, we designed a study to evaluate the diagnostic evaluation indices.
Design:
A prospective nested case–control study
Methods:
Our cohort consisted of 1306 patients from 31 July 2021 to 31 January 2022. According to the pathological results, patients in the cohort were divided into the CAG group and the chronic non-atrophic gastritis group to evaluate the diagnostic evaluation indices. Each atrophy lesion was automatically labeled and the atrophy severity was assessed by the model. Propensity score matching was used to minimize selection bias.
Results:
The diagnostic evaluation indices and the consistency between OLGA staging and pathological diagnosis of the model were superior to those of endoscopists [sensitivity (89.31% versus 67.56%), specificity (90.46% versus 70.23%), positive predictive value (90.35% versus 69.41%), negative predictive value (89.43% versus 68.40%), accuracy rate (89.89% versus 68.89%), Youden index (79.77% versus 37.79%), odd product (79.23 versus 4.91), positive likelihood ratio (9.36 versus 2.27), negative likelihood ratio (0.12 versus 0.46)], areas under the curves (AUC) (95% CI) (0.919 (0.893–0.945) versus 0.749 (0.707–0.792), p < 0.001) and kappa (0.816 versus 0.291)].
Conclusion:
Our study demonstrated that the DL model can assist endoscopists in real-time diagnosis of CAG during gastroscopy and synchronous identification of high-risk OLGA stage (OLGA stages III and IV) patients.
Trial registration:
ChiCTR2100044458.
Keywords
Introduction
China has high morbidity from gastric cancer (GC), with approximately 400,000 new cases and 350,000 deaths every year, which account for 40% of GC cases worldwide. Reducing the morbidity and mortality of GC in China, a major public health problem, is an urgent need. 1 Chronic atrophic gastritis (CAG) is a precancerous condition that can progress to GC. Long-term follow-up studies have demonstrated that the extent and degree of gastric mucosa atrophy are closely related to the risk of GC, 2 and evaluation of the extent and degree of CAG can predict the occurrence of GC well. 3
The operative link for gastritis assessment (OLGA) grading and staging system was proposed by the International Atrophy Research Group in 2005. It reflects the grading and staging standards of the degree and scope of gastric mucosa inflammatory reaction and atrophy. 4 This system can objectively reflect patients’ GC risk stratification except for chronic autoimmune atrophic gastritis (CAAG)5,6 and has been strongly recommended by guidelines and is still used today. However, in clinical practice, the OLGA system is mainly only used for scientific research and not for actual diagnosis and treatment, primarily because the OLGA system requires the pathological results of a sample of gastric mucosa. 7 At present, many hospitals cannot perform this type of pathological diagnosis; even with pathologic diagnostic capability, it is an additional and burdensome task for the clinician to assess OLGA staging for each patient based on pathological findings. Therefore, how to reasonably and effectively promote the application of OLGA staging in clinical practice is an ongoing challenge.
In recent years, computer applications have shown great potential in the field of image segmentation. With the popularity of deep learning (DL), the U-Net network was proposed.8,9 At present, many segmentation tasks are carried out based on the U-Net network, especially in the field of medical image segmentation, and they have achieved good segmentation results.10,11 The application of DL combined with digestive endoscopy has become a hot topic in the field of digestion. With the progression of research, it has been gradually extended to the field of auxiliary diagnosis of CAG, but most studies are limited to the recognition of retrospective static images.12,13 We developed a real-time video monitoring model for the endoscopic diagnosis of CAG based on U-Net DL. In addition, a prospective cohort study was conducted to verify that, compared with endoscopists, this model can significantly improve the diagnosis rate of endoscopic CAG.14,15
To further validate and improve the performance of this model, we designed a prospective nested case–control study with the cohort. In this study, pathological diagnosis was taken as the gold standard to evaluate the diagnostic evaluation indices of the model for endoscopic diagnosis of CAG and its consistency with OLGA staging and pathological diagnosis.
Methods
Sample size calculation
PASS 15 (NCSS, LCC, Kaysville, UT, USA) was used to calculate the sample size. We planned to use patients in the cohort to conduct a prospective nested case–control study to verify the sensitivity, specificity, and other diagnostic evaluation indices of the DL diagnostic model for CAG. The operational process was as follows. Proportions → One Proportion → Confidence Interval → Confidence Interval for One Proportion. According to the guidelines, 2 with pathological diagnosis as the ‘gold standard’, the sensitivity and specificity of endoscopic diagnosis of atrophy are only 42% and 91%, respectively. We assumed that the DL model could improve the sensitivity by 100%, and we set α = 0.05 and the confidence interval = 10%. According to the estimation of the minimum sample size needed, the sample sizes of the CAG group and chronic non-atrophic gastritis (CNAG) group were equal. The CAG group and the CNAG group each required 225 samples.
Study design and participants
We performed a prospective nested case–control study. Our cohort consisted of 1306 patients who were at least 18 years old and volunteered to participate in this study. They underwent gastroscopy in the digestive endoscopy center of three grade III class A hospitals from 31 July 2021 to 31 January 2022. Olympus GIF-H260 (Olympus Inc., Tokyo, Japan) was used to perform gastroscopy for patients without sedation, and a narrow-band imaging technique was used to improve the accuracy of endoscopic diagnosis. The reporting of this study conforms to the STARD statement. 16
The exclusion criteria were as follows: (1) Patients who could not tolerate gastroscopy and did not complete the entire procedure. (2) Patients were found to have other lesions in addition to chronic gastritis (CG), such as peptic ulcers and gastrointestinal malignancies during gastroscopy. (3) Patients taking anticoagulant or antiplatelet drugs or who had contraindications to biopsy. (4) Patients who decided to drop out of the study during gastroscopy.
Diagnosis of CAG and the OLGA staging system
All of the procedures in this study were performed by endoscopists with more than 10,000 cases of gastroscopy experience and an associated senior title. According to the guidelines, 2 pathological biopsies of CG showing atrophy of the inherent glands can be diagnosed as CAG, regardless of the number and degree of atrophy in the biopsy specimens. The severity of CAG can be classified into mild, moderate, and severe CG according to the pathological conditions.
Figure 1 shows the OLGA staging system. 17
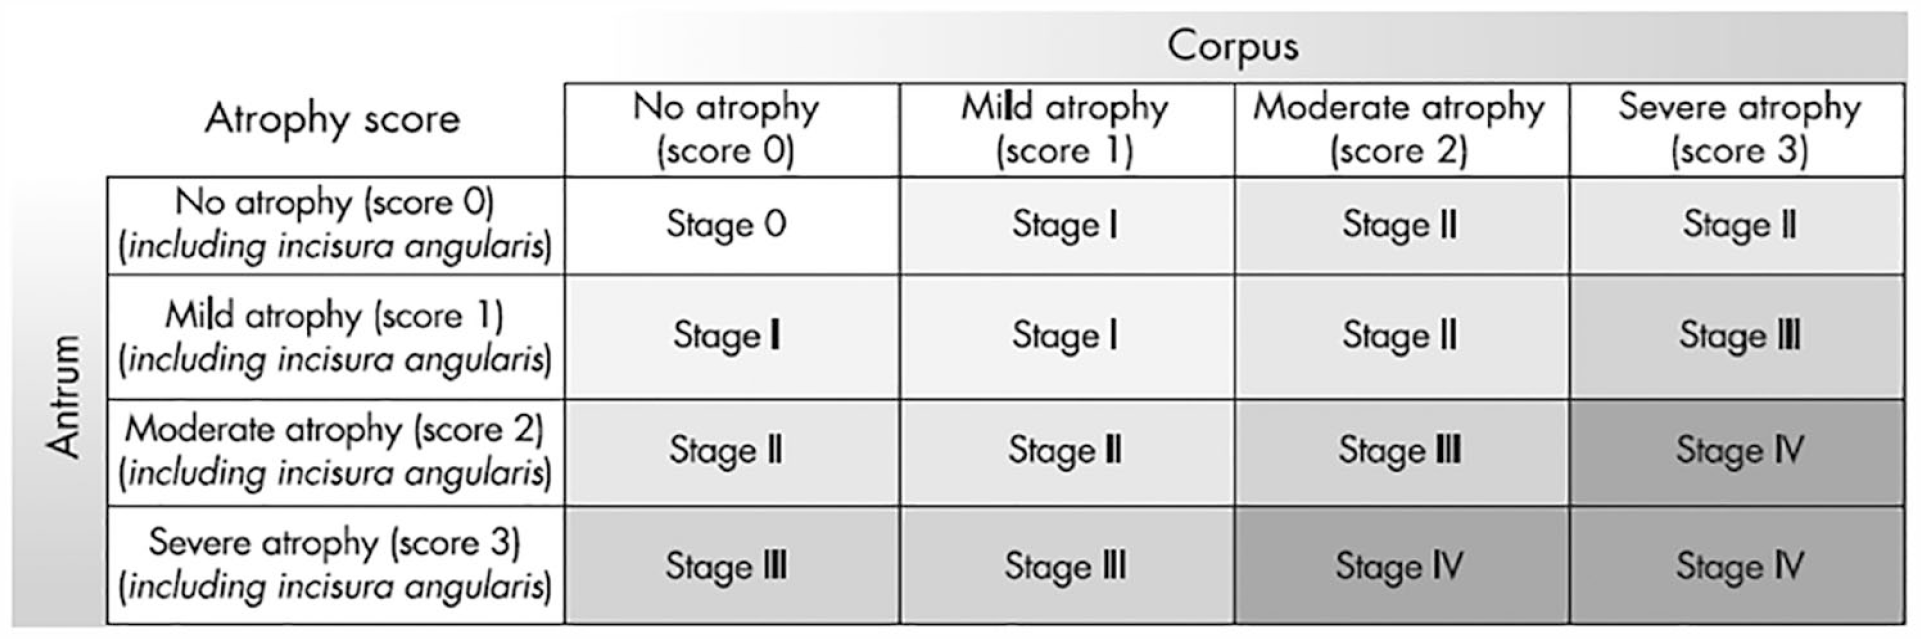
Gastritis staging: the OLGA system. Atrophy is defined as loss of appropriate glands (with or without metaplasia). In each compartment (i.e. mucous-secreting antral and oxyntic/corpus mucosa), atrophy is scored on a four-tiered scale (0–3) according to the visual analog scale of the Houston-updated Sydney system. The stage result from the combination of atrophic changes was assessed in the two mucosal compartments considered.
Application process of the real-time video monitoring model for endoscopic diagnosis of CAG based on U-Net DL
According to the guidelines, 2 the endoscopists routinely take three biopsies from each patient during gastroscopy, from the gastric antrum, gastric angle, and gastric body, and take additional biopsies from any suspected atrophy sites. At the same time, the DL model also marked the suspected atrophy sites during real-time video monitoring. Then, the assistant informed the endoscopist of the suspected atrophy sites not yet identified by the endoscopist that were marked by the DL model, and the endoscopist performed additional biopsies of these sites. After gastroscopy, the endoscopist and the DL model evaluated the biopsy sites, marked the CAG severity (mild, moderate, and severe) of each biopsy site, and evaluated the OLGA staging. According to the pathological results of the biopsies, subjects in the cohort were divided into the CAG group and the CNAG group, and the diagnostic evaluation indices of the model for endoscopic diagnosis of CAG and its consistency with OLGA staging and pathological diagnosis were evaluated.
The real-time video monitoring model for endoscopic diagnosis of CAG based on U-Net DL
The U-Net network model is a U-shaped structure mainly comprised of paths of contraction and symmetric expansion. Contraction paths are used to study the image characteristics of different levels and capture the context information. The expansion path can restore the location of the object, and accurate positioning segmentation boundaries and details will feature maps back to the input image size and resolution. Meanwhile, the hopping connection of the network can combine the semantic information of high and low levels for feature reuse.18,19
In this study, the U-Net network was used to construct a real-time video monitoring model for the endoscopic diagnosis of CAG. The first step was the preparation of the dataset: 5290 high-quality endoscopic images of 1711 patients, who underwent gastroscopy from 1 August 2019 to 2020, were labeled according to the pathological diagnosis by two endoscopists (who had performed more than 10,000 gastroscopes and had senior titles). A total of 4175 images of CAG were labeled, including 2389 images of mild CAG, 977 images of moderate CAG, and 809 images of severe CAG. In addition, 1115 images of CNAG were labeled. Then, 70% of the images were randomly included in the training set, and 30% were randomly included in the test set. A total of 3703 gastroscopic images were used for a fivefold cross to verify and adjust the accuracy of the model.
Second, the concrete structure of the model definition was established: the left half is an encoder, which consists of two 3 × 3 convolution layers (RELU) and a 2 × 2 max-pooling layer to form a module of downsampling. A total of four subsampling modules are connected to form an encoder, which is connected to the decoder in the right half. The decoder is comprised of a deconvolution layer + feature concatenation + two 3 × 3 convolution layers (RELU) repeatedly.
Then, the model is trained. The training process takes a test image as the input of the U-Net model and obtains the output through model processing. The output results were compared with the labeled results of the gastritis lesions, and a current loss value was calculated according to the loss function. The loss was propagated back along the network structure, the gradient of the parameters of this layer was calculated at each layer of the network, and the parameters were updated according to the gradient. Here, the BCEWithLogitsLoss function is adopted, and the adaptive optimization algorithm RMSProp is adopted for the parameter updating algorithm. The whole dataset was divided into multiple batches, and each batch repeated the above process to update the model parameters until convergence. When all batches are trained, the new model parameters can better fit the characteristics of the training data and are suitable for the CAG diagnosis task.
After the training, 1587 gastroscopic images were used to test the model. The sensitivity, specificity, and accuracy of CAG diagnosis were 92.73%, 92.24%, and 92.63%, respectively.
The training hardware platform is a single-card server. The CPU is Intel Xeon (Cascade Lake)Platinum 8269 2.5 GHz, and the GPU is NVIDIA A100. The server that applies the DL model can be an ordinary computer, and the basic configuration requirements are as follows: The CPU is Intel i9-10900K, and the GPU is GeForce RTX 3090.
Outcomes
Taking pathological diagnosis as the gold standard after matching, the primary outcome of this study was the sensitivity, specificity, accuracy, and other diagnostic evaluation indices of the real-time video monitoring model for endoscopic diagnosis of CAG based on U-Net DL. We also evaluated the consistency between OLGA staging and the pathological diagnosis and drew a receiver operating characteristic (ROC) curve.
Our secondary outcome was to use the pathological diagnosis as the gold standard to conduct subgroup analysis to evaluate the sensitivity, specificity, accuracy, and other diagnostic evaluation indices of the real-time video monitoring model for endoscopic diagnosis of CAG based on U-Net DL for the establishment of OLGA stage after matching.
Statistical analysis
We assessed the diagnostic evaluation indices of the DL model after propensity score matching (PSM) to minimize the selection bias in this real-world study.
Given the differences in the baseline characteristics between eligible participants in the two groups (Table 1), PSM was used to identify a cohort of patients with similar baseline characteristics. The propensity score is a conditional probability of having a particular case–control (CAG versus CNAG) given a set of baseline measured covariates. 20 The propensity score was estimated with the use of a non-parsimonious multivariate logistic regression model, with CAG as the dependent variable and all of the baseline characteristics outlined in Table 1 as covariates. Matching was performed with a 1:1 matching protocol without replacement (nearest-matching algorithm), with a caliper width equal to 0.2 of the standard deviation of the logit of the propensity score. 21 Standardized differences were estimated for all of the baseline covariates before and after matching to assess the pre-match imbalance and post-match balance. Standardized differences of less than 0.1 for a given covariate indicate a relatively small imbalance. 22
Baseline characteristics before and after propensity score matching.

CAG, chronic atrophic gastritis; CHD, coronary heart disease; CNAG, chronic non-atrophic gastritis; HP, Helicobacter pylori; HT, hypertension.
Continuous variables are expressed as the mean and standard deviation or median and interquartile range for skewed data, and categorical variables are expressed as frequencies (%). Continuous variables were compared using the t-test if normally distributed and the Mann–Whitney U test if not. Categorical variables were compared using the chi-square test or Fisher’s exact test. Using the data for the propensity-matched patients, ROC curves were constructed to assess the sensitivity, specificity, and respective areas under the curves (AUCs) with 95% CIs. Rstudio was used to draw Partial AUCs, and Delong’s test was used to compare the ROC curves.
A two-tailed p value <0.05 was considered statistically significant. All of the analyses were conducted using SPSS software, version 23.0 (IBM Corp., Armonk, NY, USA) and Rstudio, version 1.1.463 (RStudio, Inc.).
Sensitivity analysis
To test the robustness of the main results, several additional analyses were conducted. First, using the data for all of the patients before matching, we assessed the diagnostic evaluation indices of the DL model. Second, subgroup analysis with the data before matching was also conducted by stratifying patients into the OLGA (stages I and II) group and OLGA (stages III and IV) group.
Results
Study population
Figure 2 shows the study flowchart. A total of 1306 patients undergoing gastroscopy were enrolled. A total of 399 patients were excluded. The reasons for exclusion included patients who could not tolerate gastroscopy and did not complete the entire procedure (n = 30, 2.3%), patients with peptic ulcers found on gastroscopy (n = 93, 7.1%), patients with gastroesophageal varices (n = 7, 0.5%), patients with gastrointestinal malignancy (n = 22, 1.7%), patients with gastric polyps (n = 31, 2.4%), patients taking anticoagulant or antiplatelet drugs (n = 190, 14.5%), and patients who decided to drop out of the study during gastroscopy (n = 26, 2.0%).

Flow chart of the identification of the study sample.
A total of 907 patients were enrolled in the study cohort, including 262 patients (28.9%) in the CAG group and 645 patients (71.1%) in the CNAG group. Before PSM, there were differences between the two groups in several of the baseline variables (Table 1). With the use of PSM, 262 CAG patients were matched with 262 CNAG patients. After matching, the standardized differences were less than 0.1 for all variables, indicating only small differences between the two groups (Table 1).
Primary outcomes
After matching, with pathological diagnosis as the gold standard, the diagnostic evaluation indices and the consistency between OLGA staging and pathological diagnosis of the real-time video monitoring model for endoscopic diagnosis of CAG based on U-Net DL were superior to those of endoscopists [sensitivity (89.31% versus 67.56%), specificity (90.46% versus 70.23%), positive predictive value (90.35% versus 69.41%), negative predictive value (89.43% versus 68.40%), accuracy rate (89.89% versus 68.89%), Youden index (79.77% versus 37.79%), odd product (79.23 versus 4.91), positive likelihood ratio (9.36 versus 2.27), negative likelihood ratio (0.12 versus 0.46), AUC (95% CI) (0.919 (0.893–0.945) versus 0.749 (0.707–0.792)) and kappa (0.816 versus 0.291)] (Table 2, Figure 3).
The diagnostic evaluation indices and the consistency between OLGA staging and pathological diagnosis of the DL model before and after propensity score matching.

AUC, areas under the curve; CAG, chronic atrophic gastritis; CNAG, chronic non-atrophic gastritis; DL, deep learning; LR−, negative likelihood ratio; LR+, positive likelihood ratio; OLGA, operative link for gastritis assessment; PV−, negative predictive value; PV+, positive predictive value.

After matching, with pathological diagnosis as the gold standard, the diagnostic evaluation indices and the consistency between OLGA staging and pathological diagnosis of the real-time video monitoring model for endoscopic diagnosis of CAG based on U-Net DL were superior to those of endoscopists. The diagnostic performance comparison between the DL group and the endoscopist group when taking pathological diagnosis as the gold standard. (a) Partial AUC (the black shaded part) at the sensitivity ⩾0.8 for the DL group. (b) Partial AUC (the dark gray shaded part) at the sensitivity ⩾0.8 for the endoscopist group. (c) Partial AUC (the black shaded part) at the specificity ⩾0.8 for the DL group. (d) Partial AUC (the dark gray shaded part) at the specificity ⩾0.8 for the endoscopist group. (e) ROC curves for the DL group and endoscopist group, respectively.
Secondary outcomes
With a pathological diagnosis as the gold standard, subgroup analysis was conducted. After matching, the sensitivity, specificity, accuracy, and other diagnostic evaluation indices of the real-time video monitoring diagnosis model for CAG based on U-Net DL were superior to those of endoscopists in the diagnosis of OLGA (stages I and II) and OLGA (stages III and IV) CAG (Table 3, Figure 4).
The diagnostic evaluation indices of the DL model in the diagnosis of OLGA (stages I and II) and OLGA (stages III and IV) CAG after propensity score matching.

AUC, areas under the curve; DL, deep learning; LR−, negative likelihood ratio; LR+, positive likelihood ratio; OLGA, operative link for gastritis assessment; PV−, negative predictive value; PV+, positive predictive value.

After matching, the diagnostic evaluation indices of the real-time video monitoring diagnosis model for CAG based on U-Net DL were superior to those of endoscopists in the diagnosis of OLGA (stages III and IV) CAG. The diagnostic performance comparison between the DL group and the endoscopist group when taking pathological diagnosis as the gold standard. (a) Partial AUC (the black shaded part) at the sensitivity ⩾0.8 for the DL group. (b) Partial AUC (the dark gray shaded part) at the sensitivity ⩾0.8 for the endoscopist group. (c) Partial AUC (the black shaded part) at the specificity ⩾0.8 for the DL group. (d) Partial AUC (the dark gray shaded part) at the specificity ⩾0.8 for the endoscopist group. (e) ROC curves for the DL group and endoscopist group, respectively.
Sensitivity analysis
We performed statistical analysis on all patients before matching and obtained similar results (Table 2).
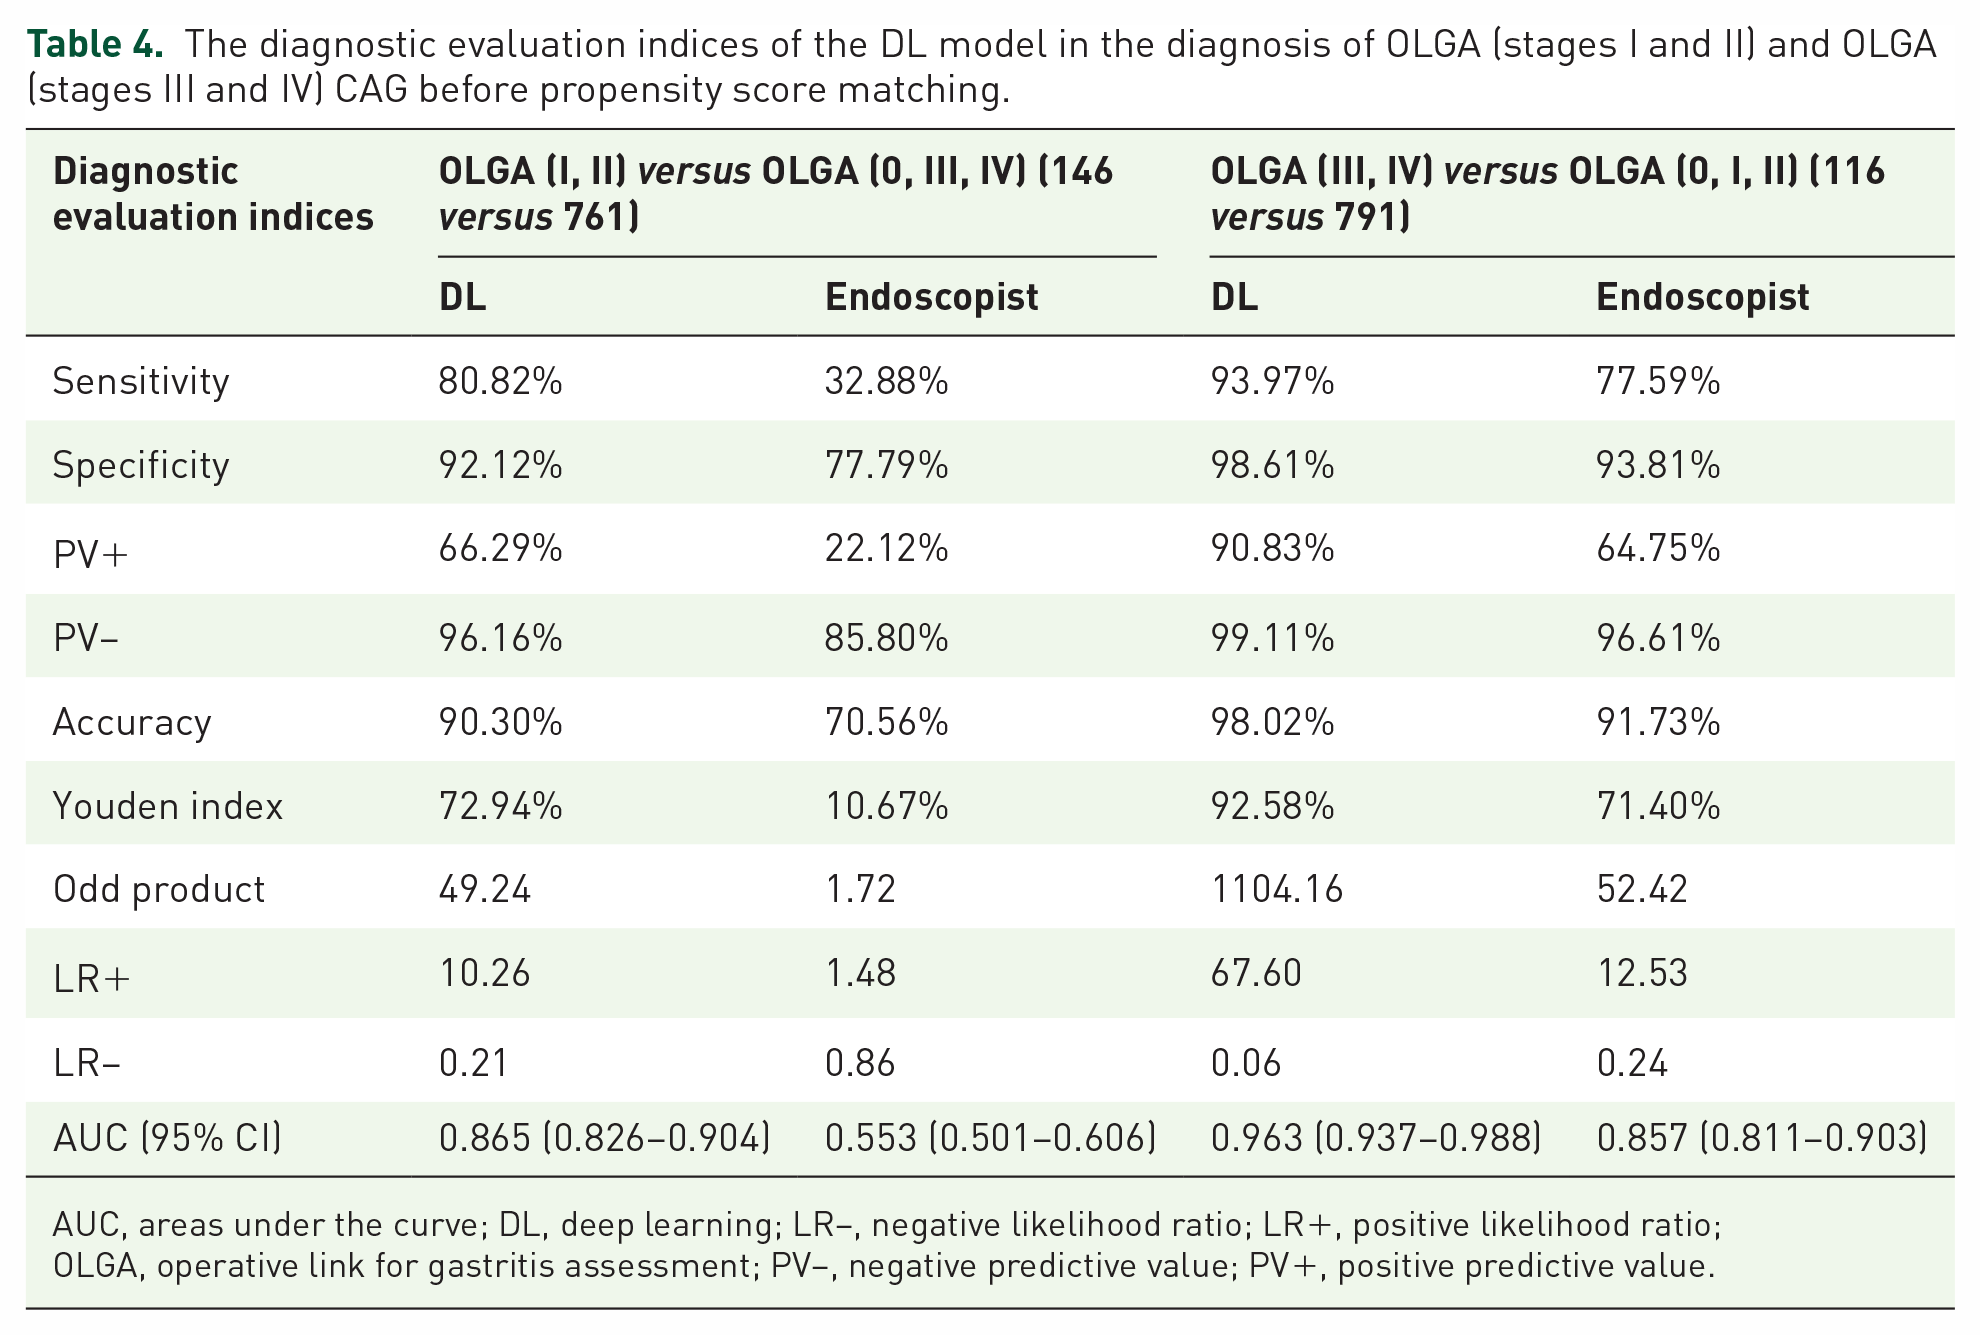
Subgroup analysis with the data before matching was also conducted by stratifying CAG patients into the OLGA (stages I and II) and OLGA (stages III and IV) groups. With pathological diagnosis as the gold standard, before matching, the sensitivity, specificity, accuracy, and other diagnostic evaluation indices of the real-time video monitoring diagnosis model for CAG based on U-Net DL were superior to those of endoscopists for the diagnosis of OLGA (stages I and II) and OLGA (stages III and IV) CAG (Table 4).
The diagnostic evaluation indices of the DL model in the diagnosis of OLGA (stages I and II) and OLGA (stages III and IV) CAG before propensity score matching.
AUC, areas under the curve; DL, deep learning; LR−, negative likelihood ratio; LR+, positive likelihood ratio; OLGA, operative link for gastritis assessment; PV−, negative predictive value; PV+, positive predictive value.
Discussion
To our knowledge, this is the first time that a U-Net-based DL diagnosis model of CAG has been applied to real-time video monitoring of gastroscopy and the OLGA staging system. The diagnostic evaluation indices and consistency evaluation of OLGA staging and pathological diagnosis of CAG by this model were superior to those of endoscopists.
The OLGA grading and staging system is a semiquantitative scoring method for inflammation and atrophy degrees based on the new Sydney system for CG. The staging represents the extent and degree of gastric mucosa atrophy, which links the histopathology of CG with the risk of GC and provides more intuitive information for clinicians to predict the progression of the disease and formulate disease management measures.4,23 Rugge et al. 24 followed 93 patients with CG for more than 12 years (144–204 months) and found that the majority of OLGA stages 0–II patients at enrollment remained unchanged, with the majority of high-grade intraepithelial neoplasia and noninvasive tumors occurring in high-risk OLGA/OLGIM patients (OLGA/OLGIM stages III and IV) (97.6% OLGA stages III and IV, 92.7% OLGIM stages III and IV). A retrospective study of 474 patients with GC in Korea showed that the proportion of OLGA stages III and IV in the GC group was significantly higher than that in the control group. OLGA stages III and IV were associated with an increased risk of GC (especially intestinal GC), and high OLGA/OLGIM stages (stages III and IV) were independent risk factors for GC. The OLGA/OLGIM staging system can be used to evaluate the risk of GC, especially intestinal GC in high-morbidity areas. 25 It can be seen from the above studies that the OLGA staging system plays an important role in predicting the occurrence and development of GC.
Although the OLGA staging system has been strongly recommended by clinical guidelines and consensus for nearly 20 years, its application in clinical diagnosis and treatment is still not widespread because there are many difficulties in the clinical application of OLGA. The OLGA staging system relies heavily on pathological diagnosis of gastric mucosa, 26 while many hospitals do not have a pathological diagnosis capability. Even if the hospital is capable of pathological diagnosis, it is still a heavy task to ask the endoscopist to recall the endoscopic characteristics of each patient and evaluate the OLGA staging for each patient after the pathological results are reported sometime later, creating a considerable burden in terms of personnel, material resources, and time. 27 Therefore, the widespread acceptance of the OLGA system in clinical work is quite difficult to achieve. The U-Net DL model designed by us can precisely solve the above problems. Our model, after being trained on the server, can be pre-installed on computers and easily deployed in digestive endoscopy centers of various levels of hospitals, making it easy to promote. It can automatically evaluate the OLGA staging while performing gastroscopy. Primary hospitals without pathological diagnostic capabilities or insufficient experience in diagnosing during endoscopy can assist endoscopists in identifying high-risk patients for GC during gastroscopy. This prompts endoscopists to perform biopsies and refer them to higher-level hospitals’ pathology departments, thus avoiding misdiagnosis due to inadequate clinical experience. In grade III class A hospitals, it can assist endoscopists in identifying high-risk GC patients accurately and consistently during their busy work, thus avoiding misdiagnosis caused by heavy workload and visual fatigue. It plays a significant role in promoting the homogeneity of endoscopic examination quality.
With the rapid development of DL, the application of DL in medical imaging has attracted extensive research and attention. The application of DL combined with digestive endoscopy has become a research hotspot, especially for the diagnosis of upper gastrointestinal diseases. 28 At present, the main research directions of DL are the auxiliary detection of Barrett’s esophagus, esophageal cancer, GC, Helicobacter pylori infection, and the auxiliary identification of anatomical sites, especially for early cancer.29,30 With the deepening of the research on the combination of DL and digestive endoscopy, the research on its auxiliary detection of CAG is also gradually carried out.12,13 However, at present, it is mostly limited to the identification of retrospective static images, and there is no research related to OLGA staging. A U-Net model combined with context information and training can quickly, using a small amount of data, meet the demands of medical image segmentation and save considerable personnel and material resources. 31 Therefore, we designed a real-time video monitoring model for the endoscopic diagnosis of CAG based on U-Net DL. At the same time, during gastroscopy, the DL model can assist endoscopists in evaluating the severity of CAG in real time and automatically estimate the OLGA stage. The diagnostic evaluation indices of CAG and the consistency evaluation of OLGA staging and pathological diagnosis of the DL model are superior to those of endoscopists alone. The sensitivity (89.31% versus 67.56%) and specificity (90.46% versus 70.23%) showed that the model had a good ability to detect CAG and identify CNAG. The positive predictive value (90.35% versus 69.41%) and negative predictive value (89.43% versus 68.40%) showed that the positive patients were more likely to be diagnosed with CAG, and the negative patients were more likely to be diagnosed with CNAG. The accuracy rate (89.89% versus 68.89%) showed that its diagnostic ability for CAG and CNAG was better than endoscopists. The Youden index (79.77% versus 37.79%) showed that the model is more authentic. The odds product (79.23 versus 4.91) showed that the model has a high diagnostic value. The positive likelihood ratio (9.36 versus 2.27) and negative likelihood ratio (0.12 versus 0.46) indicated that the model had a good ability to detect CAG and identify CNAG without the influence of prevalence. The AUC (95% CI) [0.919 (0.893–0.945) versus 0.749 (0.707–0.792)] of this model was >0.9, indicating high accuracy of diagnosis. The kappa value of the OLGA system (0.816 versus 0.291) was >0.8, indicating good consistency between the OLGA staging system and pathological diagnosis.
A clinical study included 7436 patients with nonneoplastic lesions who underwent gastroscopy and OLGA staging, and OLGA stages 0, I, II, III, and IV accounted for 80.8%, 12.6%, 4.3%, 2.0%, and 0.3% at the time of enrollment, respectively. The mean follow-up was 6.3 years. The morbidity of the stage of neoplastic lesions (low-grade intraepithelial neoplasia, high-grade intraepithelial neoplasia, and GC) per 1000 person-years was 0.03, 0.34, 1.48, 19.1, and 41.2, respectively. Multivariate analysis showed that OLGA staging was a predictor of tumor development, and the HRs of OLGA stages III and IV were up to 712.4 and 1450.7, respectively. 32 In a prospective cohort study of 1755 patients with dyspepsia with a median follow-up of 55 months, the risk of neoplasia was 0 for OLGA stages 0 to II, 36.5 per 1000 person-years (95% CI: 13.7–97.4) and 63.1/1000 person-years (95% CI: 20.3–195.6) for OLGA stages III and IV, respectively. 33 These studies further confirmed that the key to predicting the risk of GC by OLGA staging is to identify patients with OLGA stages III and IV.
To this end, we also studied the ability of the DL model to identify stages III and IV OLGA and showed that the sensitivity, specificity, accuracy, and other diagnostic evaluation indices of the real-time video monitoring diagnosis model for CAG based on U-Net DL were superior to those of endoscopists in the diagnosis of OLGA stages III and IV. The sensitivity (93.97% versus 77.59%) and specificity (98.77% versus 91.67%) showed that the model had a good ability to detect OLGA stages III and IV and distinguish it from OLGA stages 0–II. The positive predictive value (95.61% versus 72.58%) and negative predictive value (98.29% versus 93.50%) indicated that the patients diagnosed as positive had a higher probability of being diagnosed with OLGA stages III and IV, and the patients diagnosed as negative had a higher probability of being diagnosed with OLGA stages 0–II. The accuracy rate (97.71% versus 88.55%) showed that it had a better ability to diagnose OLGA stages III and IV. The Youden index (92.74% versus 69.26%) showed that the model is more realistic. The odd product (1255.06 versus 38.08) indicated that the model has a high diagnostic value. The positive likelihood ratio (76.40 versus 9.31) and negative likelihood ratio (0.06 versus 0.24) showed that the model had a good ability to detect OLGA stages III and IV and distinguish OLGA stages 0–II without the influence of prevalence. The AUC (95% CI) [0.964 (0.938~0.990) versus 0.846 (0.799~0.894)] was >0.9, indicating that it had high accuracy in diagnosing OLGA stages III and IV.
In the European Guidelines for the Management of Gastric Precancerous Lesions updated in 2019, 34 relevant recommendations emphasized that high-resolution endoscopic examination should be performed for patients with high-risk OLGA stages (OLGA stages III and IV) to avoid missing GC, especially early GC. However, OLGA staging can only be determined after pathological examination results, and because OLGA staging has not become a routine part of clinical diagnosis, many patients with a high risk of GC are being missed. 35 The DL diagnosis model of CAG solves the above problems well. During gastroscopy, it can assist endoscopists in evaluating the degree of CAG in real time and in calculating the OLGA stage. If the patient is assessed as a high-risk OLGA stage (OLGA stages III and IV), the patient can be given a high-resolution endoscopy at the same time as the current examination to avoid missing GC, especially early GC. In this way, the first gastroscopy and follow-up gastroscopy can be combined into one examination, which can not only reduce the pain of repeated examinations for patients but also reduce the time and cost burdens. This diagnostic model can effectively reduce the workload of endoscopists and, at the same time, move the screening threshold of early GC forward to achieve early detection and early treatment.
Since the risk of CG developing into GC varies with the OLGA stage in the initial state, gastroscopy monitoring for all patients with CG is neither necessary nor feasible,36,37 but a regular gastroscopy follow-up plan should be formulated for patients with high-risk OLGA stages (OLGA stages III and IV). 34 Patients with high-grade atrophic gastritis (OLGA/OLGIM stages III and IV) are recommended to receive high-quality endoscopic monitoring every 3 years. For high-grade atrophic gastritis patients with a family history of GC, the interval of endoscopic monitoring should be shortened to once every 1–2 years. Our model can simultaneously develop a gastroscopy follow-up plan according to the guidelines while patients are undergoing gastroscopy to avoid repeated visits and thus reduce the burdens on personnel and the use of material resources.
Of course, there are some limitations to this study. First, since it is an exploratory study, we conducted a nested case–control study with a cohort population of three grade III class A hospitals in the region. The enrolled cases were only representative of the region, and there may be selection bias. Later, we will include different regions in multicenter studies to make the results of this study more widely representative. Second, to avoid risks to the patients and improve the accuracy of the model, the exclusion criteria of this study were relatively strict, excluding patients with lesions other than CG, such as peptic ulcers and digestive tract malignant tumors, which introduced a certain bias into the cohort. After the successful experience of this study, a broader population of CG complicated with other lesions will be enrolled in a subsequent study to verify our model more scientifically. Third, CAAG is relatively rare in China, and our study did not separate it. However, the accuracy of the OLGA system in assessing the risk of CAAG is low, which may reduce the performance of our model. In the future, we will expand the sample size to specifically study the diagnostic evaluation of our model for CAAG. Fourth, our study only focuses on diagnostic evaluation indices and consistency between OLGA staging and pathological diagnosis, without clinical elements. After obtaining the preliminary results, we plan to refine the research items in the follow-up study, include more detailed clinical data, and conduct a systematic and objective study. Fifth, in accordance with consensus on CG and clinical norms in China, biopsies were performed at three sites for each patient in our study, and antiplatelet drugs were stopped before gastroscopy. In the follow-up study, to be in line with international guidelines, we will perform five biopsies per patient and continuously take antiplatelet drugs during gastroscopy, to make our model more scientific and reasonable.
Conclusion
In conclusion, our prospective nested case–control study demonstrated that with pathological diagnosis as the gold standard, the diagnostic evaluation indices and the consistency between OLGA staging and pathological diagnosis of the real-time video monitoring model for endoscopic diagnosis of CAG based on U-Net DL was superior to that of endoscopists. It can assist endoscopists in real-time diagnosis of CAG during gastroscopy and synchronous identification of high-risk OLGA stage (OLGA stages III and IV) patients. Immediately following the initial examination, a gastroscopy follow-up plan can be developed for the patients according to the guidelines to advance the screening threshold of early GC and realize early detection and early treatment for patients with high-risk OLGA stages (OLGA stages III and IV).