
Abstract
Background:
Patients with chronic constipation (CC) show altered gut microbial composition.
Objectives:
To compare the fecal microbiota with different constipation subtypes and to identify potential influencing factors.
Design:
This is a prospective cohort study.
Methods:
The stool samples of 53 individuals with CC and 31 healthy individuals were analyzed using 16S rRNA sequencing. The associations between microbiota composition and colorectal physiology, lifestyle factors, and psychological distress were analyzed.
Results:
In all, 31 patients with CC were classified as having slow-transit constipation, and 22 were classified under normal-transit constipation. The relative abundance of Bacteroidaceae was lower, and the relative abundance of Peptostreptococcaceae, Christensenellaceae, and Clostridiaceae was higher in slow-transit than in normal-transit group. In all, 28 and 25 patients with CC had dyssynergic defecation (DD) and non-DD, respectively. The relative abundance of Bacteroidaceae and Ruminococcaceae was higher in DD than in non-DD. Rectal defecation pressure was negatively correlated with the relative abundance of Prevotellaceae and Ruminococcaceae but positively correlated with that of Bifidobacteriaceae in CC patients. Multiple linear regression analysis suggested that depression was a positive predictor of Lachnospiraceae relative abundance, and sleep quality was an independent predictor of decreased relative abundance of Prevotellaceae.
Conclusion:
Patients with different CC subtypes showed different characteristics of dysbiosis. Depression and poor sleep were the main factors that affected the intestinal microbiota of patients with CC.
Plain language summary
Patients with chronic constipation (CC) show altered gut microbial composition. Previous studies in CC are limited by lacking of subtype stratification, which is reflected in the lack of agreement in findings across the large number of microbiome studies. We analyzed stool microbiome of 53 CC patients and 31 healthy individuals using 16S rRNA sequencing. We found that the relative abundance of Bacteroidaceae was lower, and the relative abundance of Peptostreptococcaceae, Christensenellaceae, and Clostridiaceae was higher in slow-transit than in normal-transit CC patients. The relative abundance of Bacteroidaceae and Ruminococcaceae was higher in dyssynergic defecation (DD) than in non-DD patients with CC. In addition, depression was a positive predictor of Lachnospiraceae relative abundance, and sleep quality was an independent predictor of decreased relative abundance of Prevotellaceae in all CC patients. This study emphasizes patients with different CC subtypes have different characteristics of dysbiosis. Depression and poor sleep may be the main factors that affect the intestinal microbiota of patients with CC.
Introduction
Chronic constipation (CC) is a highly prevalent condition that has an incidence of 2–28% in western countries.1–3 In the Chinese adult population, CC has an overall incidence of 16–20% across all age groups. 4 Its etiology and pathophysiology remains unclear and is most likely multifactorial.1,5 Delayed colonic transit and dyssynergic defecation (DD) are the most widely recognized pathogenic mechanisms of CC.6,7 Patients with slow-transit constipation (STC) typically experience abdominal distension and bloating as well as reduced bowel movement. 8 Patients with DD report excessive straining while defecating, a perception of blocked bowel movement, and a feeling of incomplete evacuation. 7 The clinical features of STC and DD are different, and they, therefore, require different treatment approaches. Patients with normal-transit constipation (NTC) can typically be treated with lifestyle modifications and orally administered drugs. In contrast, clinical worsening of CC has been observed on treatment of STC with standard laxatives. Instead, based on the features of STC, neuromodulation of the sacral nerve and partial colectomy with ileorectal anastomosis could be more effective.9,10 For patients with DD, anorectal biofeedback therapy should be the first choice because it has been demonstrated to be more effective than sham therapy and laxatives.5,11
Recent studies support the idea that changes in the gut microbiota are closely associated with the pathophysiology and clinical symptoms of CC.12–14 For example, 16S rRNA gene sequencing in constipated, obese children showed a significantly lower relative abundance of Prevotella and greater relative abundance of many Firmicutes genera, such as the butyrate-producing Coprococcus, Roseburia, and Faecalibacterium. 13 In contrast with these findings, a metagenomic investigation showed that the relative abundance of Coprococcus 3, Roseburia, and Bacteroides was reduced, while the relative abundance of Faecalibacterium was increased in CC stool samples. 15 In addition, no difference was found between the CC and control samples in terms of the relative abundance of Prevotella. 15 Another study that used 16S rRNA sequencing showed that the relative abundance of the Comamonadaceae and Odoribacteraceae families tended to increase, whereas that of Flavobacteriaceae and Caulobacteraceae decreased in female patients with CC. 12 The inconsistency in these previous findings may be explained by different subtypes of constipation, which may experience different changes in gut microbiota. This can also explain why the effects of the same probiotic, such as Bifidobacterium, on constipation are inconsistent.16,17
Apart from disease, various environmental, demographic, dietary, and behavioral factors influence the gut microbial community. 18 The quality of the gut microbiome is associated with factors such as age, sex,18,19 body mass index (BMI),20,21 diet,22,23 and psychological distress.24,25 In fact, a low-fiber diet, sleep disorders, and psychological distress are frequently observed in patients with CC.26,27 However, it is not clear which gut microbiota parameters can be considered as indicators of relative abundance at the phylum and family levels in patients with CC.
Therefore, the objectives of the present investigation are (i) to examine and compare the gut microbiota in healthy people and patients with CC of different subtypes, (ii) ascertain whether the differences in fecal microbiota between groups are associated with defecation symptoms, colonic transit time (CTT), high-resolution anorectal manometry (HRARM) parameters, demographic features, diet, sleep quality, and psychological distress.
Methods
Participation
In total, 53 patients with CC were consecutively recruited from the Department of Gastroenterology, the First Affiliated Hospital of Nanjing Medical University, between September 2017 and September 2019. The patients were diagnosed based on the Rome III criteria for CC. 28 In all, 31 healthy participants were also recruited from the physical examination center of the same institution and assigned to a healthy control (HC) group. The frequency of spontaneous bowel movements of healthy participants should be more than 3 times per week. Individuals who were pregnant, those who had a history of abuse, and those were on drugs that could affect defecation (e.g. antidepressants, spasmolytics, and opioids, but not hypnotics) were excluded. Subjects with a history of antibiotic treatment or intentional probiotic consumption 1 month prior to starting this study were also excluded. The other exclusion criteria were the presence of structural diseases (e.g. tumor, rectocele, and intussusception) based on colonoscopic or barium enema findings); chronic conditions; and previous gastrointestinal surgery. The reporting of this study conforms to the Strengthening the Reporting of Observational Studies in Epidemiology (STROBE) statement. 29
Fecal DNA extraction and gut microbiota analysis
Stool specimens were collected from the participants’ homes, immediately frozen at −20°C, and taken to our laboratory, where they were maintained at −80°C. A part of the sample (0.25 g) was used for DNA isolation. After repeated bead beating, automated isolation and purification were performed with a Qiagen DNeasy Blood & Tissue kit (Qiagen, Valencia, CA, USA), according to the manufacturer’s protocol. Genomic DNA was spectrophotometrically measured (Nanodrop 1000; Thermo Fisher Scientific, Wilmington, DE, USA), and DNA integrity was examined using agarose gel electrophoresis. The genomic DNA concentration was standardized to 20 ng μL−1. Relative bacterial relative abundance was measured using 16S rRNA gene sequencing at the GENOME Institute (Hangzhou, China). The hypervariable V4 region (515–806) of the 16S rRNA gene was amplified using universal primers 515F (5′-GTGCCAGCMGCCGCGGTAA-3′) and 806R (5′-GGACTACHVGGGTWTCTAAT-3′). The protocol for the bioinformatics methods has been previously published. 30 High-quality sequencing reads were obtained using GENOME, an in-house pipeline. Operational taxonomic units (OTUs) were clustered based on an identity cutoff of 97%, and OTUs with a relative abundance of <0.005% were eliminated to reduce the effect of potentially spurious OTUs. A Venn diagram was drawn based on principal component analysis (PCA) of the OTUs, and the OTU rank curves were drawn using the R software (v3.1.1). Furthermore, alpha diversity analysis (e.g. observed species, Shannon index, Chao1 index, and Simpson index) was conducted on the OUT data using the QIIME software (Version, 1.7.0). Effect size of the OTUs was determined using linear discriminant analysis (LDA) to identify potential microbial biomarkers based on a cutoff LDA score of > 2.00. The phylum and family levels of the identified biomarkers were determined with GraphPad Prism 5 (GraphPad Software Inc., La Jolla, CA, USA).
Fecal short-chain fatty acids measurement
Short-chain fatty acids (SCFAs) in the fecal contents were measured using high-performance liquid chromatography (HPLC, Model 5975C-7890A, Agilent) as described by Parameswaran et al. with minor modifcations. 31 We measured the amount of SCFAs in 1 g of stool sample. Briefly, temperature was kept at 50°C and used 50 min as elution time. Acetic acid, propionic acid, isobutyric acid, butyric acid, isovaleric acid, valeric acid, hexanoic acid, octanoic acid, nonanoic acid and decanoic acid were separated using an Aminex HPX-86H column (BioRad Laboratories, Hercules, CA, USA).
Constipation severity
A modified version of the questionnaire created by the Cleveland Clinic (Supplemental Table S1) was used to obtain information about defecation-related symptoms. 32 According to this questionnaire, frequency of spontaneous bowel movements was assigned a scored from 0 to 3, which is as follows: 0 = a defecation interval of 1–2 days, 1 = an interval of 3 days, 2 = an interval of 4–5 days, and 3 = an interval of >5 days. The consistency of stool was assessed using the Bristol Stool Scale, which is a 7-point scale from 1 (separate, nut-like hard lumps) to 7 (watery). 33 In this study, Bristol type 4–7 was assigned 0 points; Bristol type 3, 1 point; Bristol type 2, 2 points; and Bristol type 1, 3 points. Furthermore, bloating, abdominal pain, straining during evacuation, a feeling of incomplete evacuation, a feeling of blockage, and experience of pain during defecation were scored from 0 to 3, which is as follows: 0 = never, 1 = occasionally, 2 = 25% of the time, and 3 = 50% of the time.
Lifestyle survey
Level of physical activity, work-related stress, and sleep quality were assessed with the help of questionnaires that were completed at the time of first contact. The level of physical activity was evaluated based on the frequency of weekly exercise sessions for at least 30 min each: the responses included 0–1 times, 2–3 times, and 4–7 times per week. The patients were asked to rate their work-related pressure as low, normal, or high. Sleep quality was evaluated with the Pittsburg Sleep Quality Index (PSQI) questionnaire. 34 For reference, a PSQI global score of >7 is considered to indicate poor sleep quality in Chinese populations. 35
Dietary intake was evaluated based on the frequency and/or volume (low, normal, or high) of intake of specific foods: water (low, <500 mL/d; normal, 500–1000 mL/d; and high, >1000 mL/d), fiber (low, <10 g/d; normal, 10–25 g/d; and high, >25 g/d), vegetables (low, 250–500 g/d; normal, 500–1000 g/d; and high, >1000 g/d), and fruits (low, 100–200 g/d; normal, 200–500 g/d; and high, >500 g/d). In addition, predilection for a high-fat diet was also noted as a ‘yes’ or ‘no’ response.
Assessment of psychological distress
Zung’s Self-Rating Anxiety Scale (SAS) and Self-Rating Depression Scale (SDS) were used for the assessment of anxiety and depression, respectively.36,37 An SAS score of ⩾50 and an SDS score of ⩾53 are considered to indicate diagnosable anxiety and depression, respectively, in Chinese populations. 38
Colonic transit test
For assessment of colonic transit, patients were asked to ingest a capsule containing 24 cylindrical radiopaque markers (diameter, 2 mm; length, 6 mm) on day 1. On Day 3 (i.e. after 72 h), an abdominal radiograph was obtained with the patient in the supine position, and the number and distribution of these markers in the colon were assessed. The presence of more than four markers was considered to indicate delayed colonic transit. The colonic emptying rate was calculated as follows: (24 − number of radiopaque makers left in the colon at 72 h)/24. 39
High-resolution anorectal manometry
Anorectal manometry was conducted with a novel solid-state HRARM device (Manoscan AR 360; Given Imaging, Yoquem, Israel) with 12 sensors. With the patient in the left lateral decubitus position and hips at 90° flexion, a rectal balloon with an attached catheter was placed 3 cm proximal to the upper part of the anal sphincter. The following measurements were obtained in sequential order: resting pressure of the anus and rectum (over a duration of 20–30 s), pressure during squeezing of the balloon (value obtained from the best of three attempts, with a maximum duration of 20–30 s per attempt), and pressure during bearing down as occurs during defecation (value obtained from the best of three attempts, with 20–30 s per attempt). 39 For examining rectal sensation, the balloon was gradually distended in 10-mL increments till the volume reached 50 mL (from a starting volume of 0 mL), and the threshold volumes at which first sensation, urgency, and maximum discomfort occurred were noted. DD was defined as inappropriate contraction or failure to induce relaxation of the pelvic floor muscles over several tries according to the results of HRARM. 28
Statistical analysis
All the statistical analyses were performed using SPSS version 20.0 (IBM Corp., Armonk, NY, USA). Continuous variables were presented by their mean ± standard deviation or median (range) values, and categorical variables were presented as relative frequencies. Continuous variables were analyzed with the Student’s t-test or the Mann–Whitney U-test, and categorical variables were analyzed using the chi-squared test or Fisher’s exact test. Associations between different species of fecal microbiota and constipation symptoms, colonic physiological index were evaluated by Spearman’s correlation coefficient. Univariate and multivariate analyses were used to identify the predictors of the dysbiosis in CC patients. Some key outcome analyses were controlled for the false discovery rate using the Benjamini–Hochberg method, and adjusted p values < 0.05 were considered as statistically significant. 40
Results
Demographic characteristics
In total, 53 patients with CC and 31 HC were included in this study. Patients with CC and HC were comparable in age (45.89 ± 16.40 years versus 51.32 ± 13.61 years, p = 0.123) and gender [15/38 (28.30%) versus 11/20 (35.48%) male, p = 0.625). Significantly lower BMI was observed in the CC than in the HC group (p < 0.001). Compared with HC, CC patients experienced lower frequency of spontaneous bowel movements and higher rate of laxative use in 3 months prior to the study (p < 0.001, p < 0.001; Table 1)
Demographic characteristics.
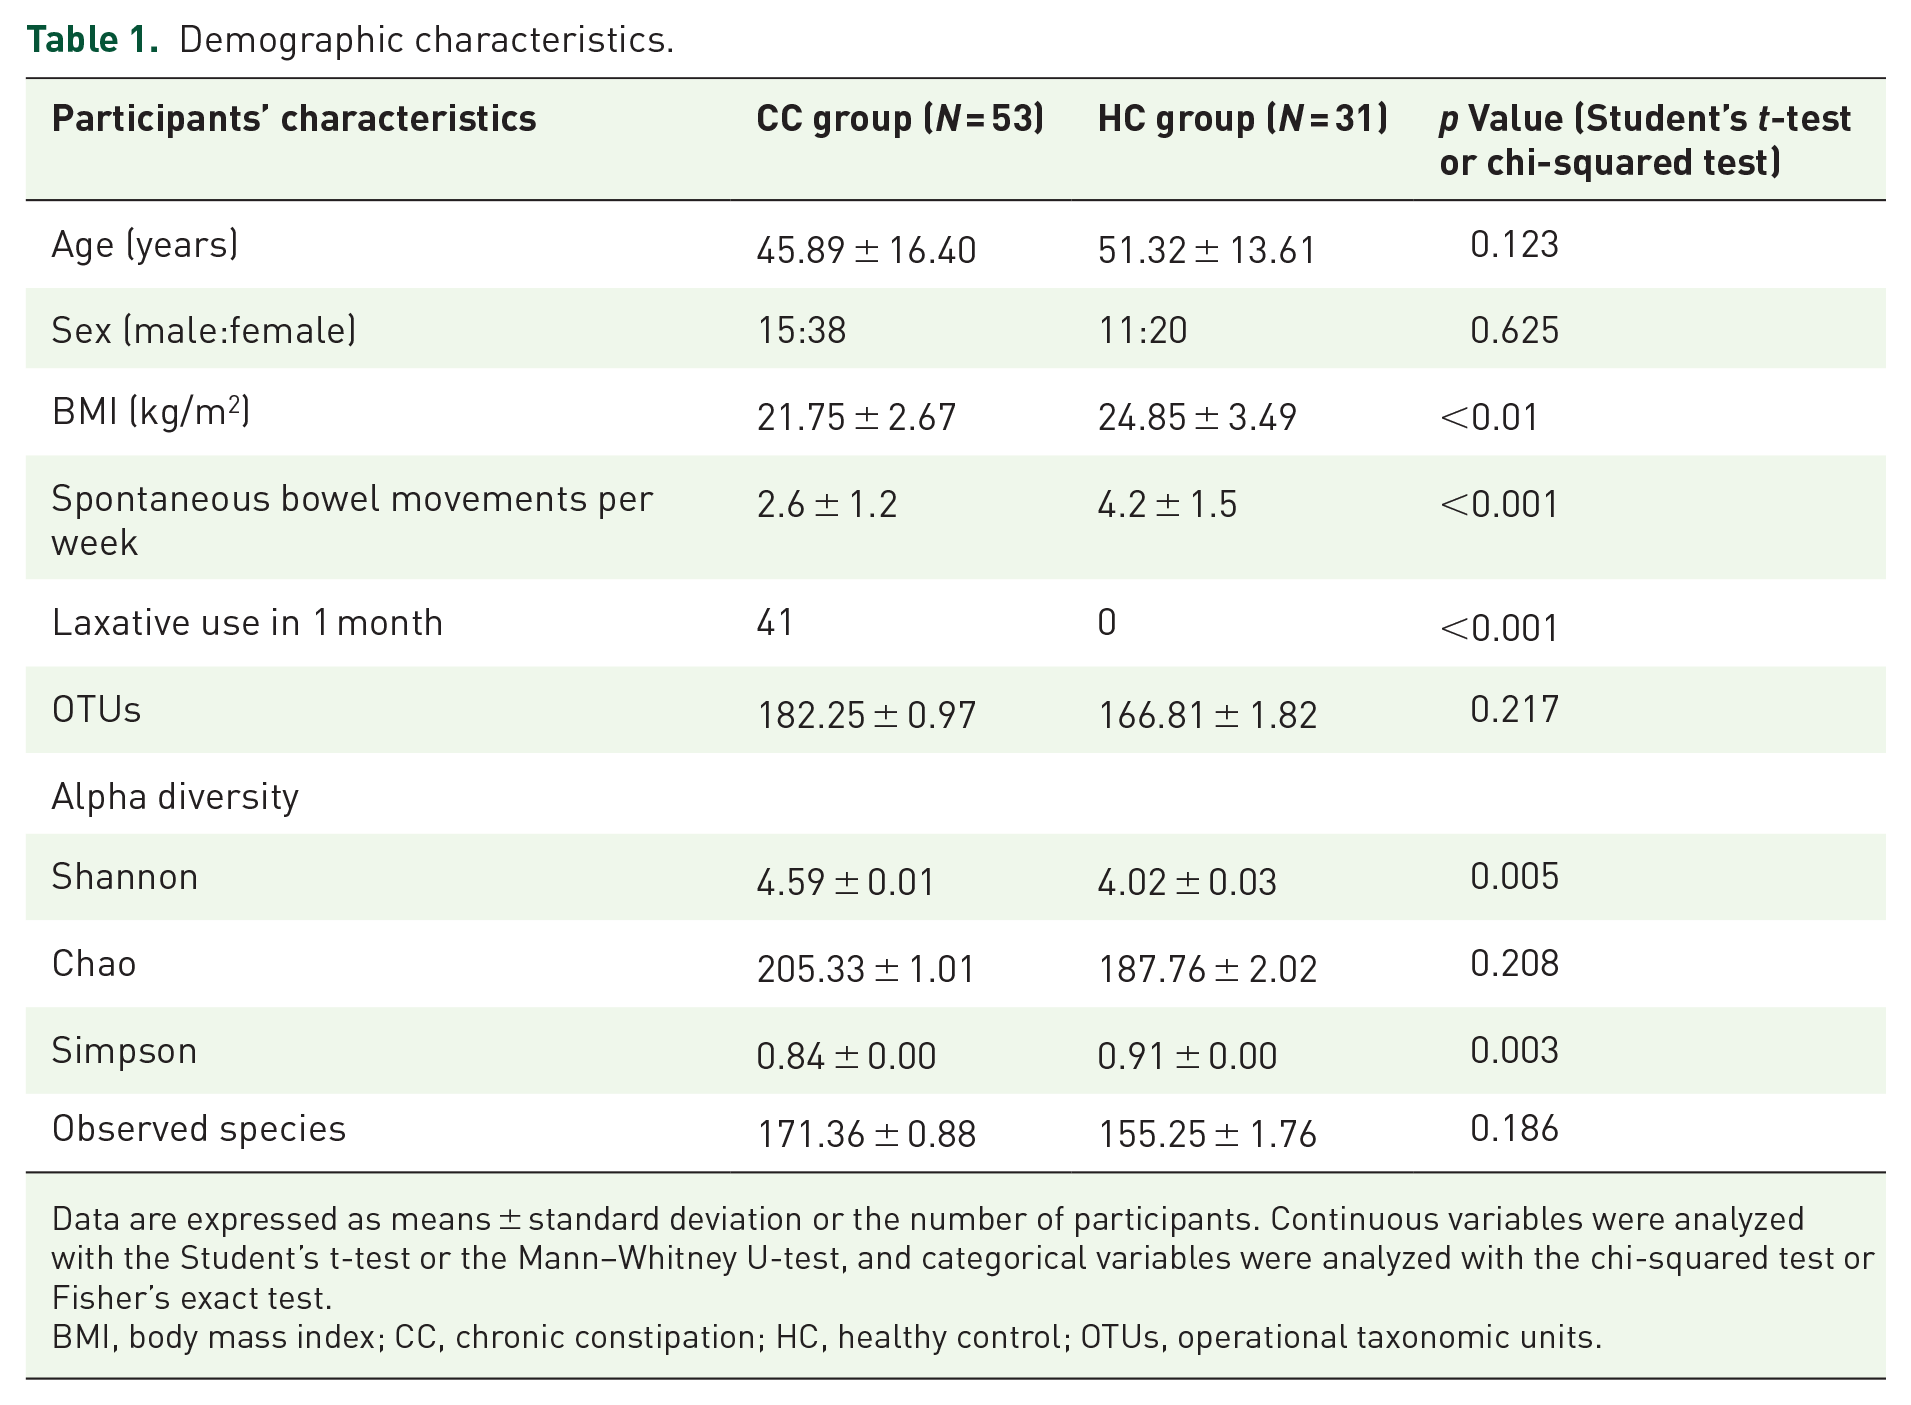
Data are expressed as means ± standard deviation or the number of participants. Continuous variables were analyzed with the Student’s t-test or the Mann–Whitney U-test, and categorical variables were analyzed with the chi-squared test or Fisher’s exact test.
BMI, body mass index; CC, chronic constipation; HC, healthy control; OTUs, operational taxonomic units.
Quantitative determination of gut microbiota
In total, 333,258 sequencing reads were derived from the 84 samples. There was no significant difference in the number of OTUs between the two groups (p = 0.271; Table 1). The PCA classified the data from CC and HC groups into different clusters (Supplemental Figure 1). Moreover, a significantly higher Shannon index value (p = 0.005) and lower Simpson index value (p = 0.003) were observed in the CC group; this indicates that the diversity of fecal microbiota was significantly higher in the CC group (Figure 1 and Table 1).

Beta diversity of fecal microbiota in the CC and HC groups.
In all, 13 bacterial phyla were found in total: four commonly detected phyla, namely, Firmicutes, Bacteroidetes, Proteobacteria, and Actinobacteria, and nine minor phyla, namely, Verrucomicrobia, Fusobacteria, Tenericutes, Synergistetes, Saccharibacteria, Cyanobacteria, Lentisphaerae, Euryarchaeota, and Chloroflexi (Figure 2(a)). The relative abundance of Firmicutes, Actinomycetes, Saccharibacteria, and Cyanobacteria was significantly higher (adjusted p < 0.01), whereas Bacteroidetes relative abundance was lower (adjusted p < 0.01) in the CC group than in the HC group (Figure 2(b)). Family-level evaluation indicated significant differences between the two groups with regard to six families: Lachnospiraceae, Ruminococcaceae, Prevotellaceae, Bifidobacteriaceae, Streptococcaceae, and Coriobacteriaceae. Prevotellaceae belongs to the Bacteroidetes phylum; Bifidobacteriaceae and Coriobacteriaceae are families in Actinobacteria; and the others belong to Firmicutes (Figure 2(c) and (d)). The Lachnospiraceae, Ruminococcaceae, and Streptococcaceae families showed increased relative abundance in patients with CC, and they majorly accounted for the relative abundance of the Firmicutes phyla in these patients (Figure 2(d)). Among the detected families, only Prevotellaceae exhibited significantly lower relative abundance in patients with CC (Figure 2(d)).

Distribution of fecal microbiota in the CC and HC groups. (a) Bacterial taxonomic profiling in the phylum level of fecal microbiota. (b) Statistic analysis of bacterium in the phylum level. (c) Bacterial taxonomic profiling in the family level of fecal microbiota. (d) Statistic analysis of bacterium in the family level.
Comparison of gut microbiota across different subtypes of CC
According to the results of CTT, the patients with CC were divided into the STC group (n = 31) and NTC group (n = 22). Compared with the NTC group, the STC group showed greater Firmicutes relative abundance (adjusted p = 0.043) and lower Bacteroidetes relative abundance (adjusted p = 0.045; Figure 3(a)). Prevalence of Actinobacteria was comparable between STC and NTC (adjusted p = 0.41; Figure 3(a)). Families Lachnospiraceae belonging to Firmicutes, Bifidobacteriaceae belonging to Actinobacteria and Prevotellaceae belonging to Bacteroidetes showed no significant difference in their relative abundance between the STC and NTC groups (adjusted p > 0.05 for all; Figure 3(b)). Remarkably, Bacteroidaceae showed a significantly lower relative abundance in the STC group than in the NTC and HC groups (adjusted p < 0.01; p = 0.05) but comparable relative abundance between the NTC and HC groups (adjusted p = 0.95), indicating that the relative abundance of Bacteroidaceae may be highly influenced by colonic transit (Figure 3(b)).

Distribution of fecal microbiota in patients with different subtypes of CC and HC groups. (a) Statistic analysis of bacterium in the phylum level in STC, NTC, and HC groups. (b) Statistic analysis of bacterium in the family level in STC, NTC, and HC groups. (c) Statistic analysis of bacterium in the phylum level in DD, non-DD, and HC groups. (d) Statistic analysis of bacterium in the family level in DD, non-DD, and HC groups. (e) Statistic analysis of SCFAs level in STC, NTC, and HC groups. (f) Statistic analysis of SCFAs level in DD, non-DD, and HC groups.
On the basis of the HRARM, 38 patients with CC were assigned to a DD group, and the other 15 were assigned to a non-DD group. No differences of the Firmicutes and Bacteroidetes phyla were identified between the DD and non-DD groups (adjusted p > 0.05 for all; Figure 3(c)). Significantly higher Lachnospiraceae relative abundance and lower Prevotellaceae relative abundance were observed in the constipation groups (DD and non-DD) than in the HC group (adjusted p < 0.05 for all), but there was no significant difference in their relative abundance between the DD and non-DD groups (adjusted p > 0.05 for all; Figure 3(d)). The non-DD showed significantly lower relative abundance of Bacteroidaceae than the HC group (adjusted p = 0.049), but Bacteroidaceae relative abundance was significantly higher in the DD group than in the HC group (adjusted p = 0.037; Figure 3(d)). It is noteworthy that significantly higher relative abundance of Ruminococcaceae belonging to the phylum Firmicutes was observed in the DD group than in the non-DD and HC groups (adjusted p = 0.044; p = 0.023), but there was no significant difference between the non-DD and HC groups (adjusted p = 0.85), indicating that Ruminococcaceae represent the characteristic bacteria of DD (Figure 3(d)).
The underlying associations between gut dysbiosis and constipation may involve some changes in the metabolites of gut microbiota. Among the major metabolites endogenously produced in the colon, SCFAs provide a link in the interaction between intestinal fora and the host. 41 Therefore, SCFAs were detected in feces by HPLC. Compared with the HC and NTC groups, the STC group showed significantly decreased concentrations of acetic acid (adjusted p = 0.029) in feces and increased concentration of isobutyric acid and isovaleric acid (adjusted p = 0.038; p = 0.039; Figure 3(e)). Butyric acid showed a significantly increased concentration in the DD group than in the non-DD and HC groups (adjusted p = 0.046; p = 0.027) but comparable relative abundance between the non-DD and HC groups (adjusted p = 0.96; Figure 3(f)).
Association between different species of fecal microbiota and constipation symptoms, colonic physiological index in patients with CC
In patients with CC, prevalence of Ruminococcaceae was negatively correlated with straining and blockage (p = 0.029; p = 0.049; Table 2). A positive correlation was found between Bacteroidaceae relative abundance and colonic emptying rate of patients with CC, but the correlation was not statistically significant on account of the small sample size (p = 0.073; Table 3). The relative abundance of Prevotellaceae and Ruminococcaceae was negatively correlated with rectal defecation pressure (p = 0.018; p = 0.020; Table 3). Ruminococcaceae relative abundance and first sensation urge to defecate volume were positively correlated (p = 0.036; p = 0.026; Table 3).
Association between different family species of fecal microbiota and constipation symptoms in patients with CC.

p < 0.05 (Spearman correlation test).
CC, chronic constipation.
Association between different family species of fecal microbiota and colonic physiological index in patients with CC.

p < 0.05 (Spearman correlation test).
CC, chronic constipation; CTT, colon transit test.
Impact of lifestyle factors and psychological distress on gut microbiota
At present, the recognized factors affecting intestinal microbiota include age, 42 diet, 43 sleep quality, 24 psychological distress, 44 and medications. 45 Vegetable intake, fruit intake, water intake, sleep quality, SAS and SDS scores, and BMI were significantly different between the CC and HC groups (p < 0.05 for all; Table 4). In brief, patients with CC consumed less vegetables, fruits, and water than controls (p < 0.05 for all; Table 4). Patients with CC had poorer sleep quality than the HC group (p = 0.025; Table 4). Physical activity and work pressure were comparable between the two groups (p = 0.51; p = 0.24; Table 4). The SAS and SDS scores were both significantly greater in the CC group (p < 0.01; p < 0.01; Table 4).
Lifestyle characteristics and psychological status in the CC and HC groups.

Data are expressed as means ± standard deviation or median (interquartile range) or the number of participants (%).
CC, chronic constipation; HC, healthy control; SAS, Zung’s Self-Rating Anxiety Scale; SDS, Zung’s Self-Rating Depression Scale.
For all the participants, univariate analysis showed that the relative abundance of family Bacteroidaceae belonging to Bacteroidetes was positively correlated with vegetable intake (p < 0.01; Table 5). The relative abundance of family Lachnospiraceae belonging to Firmicutes was positively correlated with the SDS score (p < 0.01) and negatively correlated with vegetable intake (p < 0.01; Table 5). The relative abundance of family Prevotellaceae belonging to Bacteroidetes was positively correlated with vegetable and water intake (p < 0.01 for both), and showed an inverse correlation with the PSQI score (p < 0.01; Table 5). The relative abundance of family Ruminococcaceae belonging to Firmicutes was positively correlated with the SAS and SDS scores (p < 0.01; Table 5). According to the findings of multiple linear regression analysis, SDS score was identified as an independent predictor of increased Lachnospiraceae and Ruminococcaceae relative abundance (p = 0.03; p < 0.01), and vegetable intake was a positive predictor of the relative abundance of Bacteroidaceae (p = 0.01; Table 6). It is noteworthy that PSQI score was an independent predictor of the decreased relative abundance of Prevotellaceae (p < 0.01; Table 6).
Correlations between family species of fecal microbiota and lifestyle characteristics, psychological status.

Data are expressed as r value (p value, spearman correlation test).
BMI, body mass index; SAS, Zung’s Self-Rating Anxiety Scale; SDS, Zung’s Self-Rating Depression Scale.
Independent predictors of family species of fecal microbiota by logistic regression analysis.

SAS, Zung’s Self-Rating Anxiety Scale; SDS, Zung’s Self-Rating Depression Scale.
Discussion
The human gut houses more than 1000 microbial species that predominantly comprise bacteria; in fact, the microbial cell count is almost equivalent to the human cell count.46,47 Many studies have reported that alterations in the gut microbiota can cause gastrointestinal disorders via alterations in metabolic activity. 48 Importantly, changes in the gut microbiota were found to be related with the development of CC. However, to date, no studies have reported the difference in microbiota between CC subtypes. Here, we have described the structure of the gut microbiota in different subtypes of CC and in healthy volunteers and focused on differences related to symptoms, colon physiology, lifestyle factors, and psychological distress. CC was characterized by decreased relative abundance of Bacteroidetes, which was probably related to the decrease in the relative abundance of the Prevotellaceae family. In contrast, the relative abundance of families Lachnospiraceae and Ruminococcaceae in Firmicutes increased in patients with CC. These findings are consistent with previous findings.12,13,48 Recently, a highly pertinent review also declared that the Prevotella enterotype, known to prevail on fiber-rich diets, has been associated with loose stools while the opposite has been observed for the Ruminococcaceae enterotype, which has been characterized by increased proteolytic capacity. 48
This study is the first one, to our knowledge, to compare fecal microbiota between patients with STC and NTC and between DD and non-DD patients. Notably, in comparison with HC, the relative abundance of Bacteroidaceae decreased only in the STC group and not in the NTC group. Moreover, the relative abundance of Bacteroidaceae was lower in the STC group than in the NTC group, indicating that Bacteroidaceae comprise the characteristic bacteria for distinguishing patients with STC from patients with other subtypes of CC. To further examine the effect of Bacteroidaceae relative abundance on the development of STC, we assessed the association between Bacteroidaceae and colon physiological test metrics. A positive correlation was found between Bacteroidaceae relative abundance and colonic emptying rate. A recent study by Tap et al. on patients with constipation-predominant irritable bowel syndrome showed that Bacteroidaceae-predominant intestinal microbiota is associated with significantly higher colonic transit time than Clostridiaceae-predominant intestinal microbiota. 49 These findings suggest that Bacteroidaceae may be associated with increased colonic transit and decreased relative abundance of Bacteroidaceae may be an important reason or result for delayed colonic transit in patients with STC. For instance, Bacteroidaceae can promote gut motility by enhancing the expression of γ-aminobutyric acid, vesicle-associated protein-33, and enteric γ-actin. 50
Our results revealed that the relative abundance of Lachnospiraceae and Prevotellaceae was comparable between patients in the DD and non-DD groups. Notably, significantly greater relative abundance of Ruminococcaceae was observed in the DD group (versus the non-DD and HC groups), but no significant difference was observed between the non-DD and HC groups. This indicates that Ruminococcaceae constitute the characteristic bacteria for distinguishing DD patients from patients with other forms of CC. Next, we investigated the association between Ruminococcaceae and symptoms and colon physiological test metrics. We found that the relative abundance of Ruminococcaceae was negatively correlated with rectal defecation pressure. Inadequate defecatory propulsion is one of the mechanisms for defecatory disorder, and it is classified as the F3a type of functional gastrointestinal disorders by the ROME IV criteria. 51 Ruminococcaceae is one of the main butyrate-producing bacteria. 52 Increase in butyrate production may play a role in the development of constipation by inhibiting mucin secretion and promoting the absorption of water and electrolytes in the colon.53,54
Many studies have reported the effects of probiotics, prebiotics, and synbiotics on constipation. 55 Probiotics such as Lactobacillus and Bifidobacterium can shorten the migratory myoelectric complex period and accelerate small intestine transit, as well as prebiotics such as fructo-oligosaccharides and galacto-oligosaccharides. 56 However, some recently published randomized controlled trials on this topic have reported conflicting results. 57 Their clinical efficacy in alleviating constipation remains controversial because of bacteria species, treatment dosage, duration, and characteristics of patients, especially CC subtypes. In our study, we found decreased Bacteroidaceae and increased Ruminococcaceae comprise the characteristic bacteria for distinguishing patients with STC and DD, respectively. Recently, Kim et al reported one kind of symbiotic ID-HWS1000, composed of Lactobacillus and Bifidobacterium species, xylooligosaccharide, and dietary fiber, improves the perception of bowel activity and exerts positive changes in individuals with CC. 58 There was a decrease in the proportion of Ruminococcaceae and Lachnospiraceae and an increase in Bacteroidaceae after treatment of ID-HWS1000, indicating this kind of symbiotic maybe useful to both STC and DD patients.
It is reported that SCFAs provide a link in the interaction between intestinal fora and the host. 41 We found that the STC group showed significantly decreased concentrations of acetic acid compared with the NTC and HC groups, while the butyric acid level was increased in the DD group than in the non-DD and HC groups. These results indicate that decreased acetic acid may contribute to slow transit while increased butyric acid may be related to DD. Soret et al. reported that acetic acid can increase the proportion of enteric neurons expressing ChAT, which can promote colonic motility by cholinergic pathways. 59 Roager summarized that the depletion of carbohydrates ultimately leads to a decrease in SCFA; consequently, increasing the luminal pH that creates a selective pressure on the microbial community, thereby redirecting the microbial metabolism toward proteolysis. Long CTT has been associated with reduced fecal SCFA indicating either increased absorption, lower availability of fermentable polysaccharides in the colon, and/or changed activity, indicating that acetic acid may be one target for the treatment for STC. 48
Multiple factors affect the gut microbiota composition in healthy subjects, but the association between lifestyle factors (including physical activity, food intake, work stress, and sleep quality), physiological distress, and dysbiosis in patients with CC remains known. We found that there were significant differences in vegetable intake, fruit intake, water intake, sleep quality, and SAS and SDS scores between the constipation and control groups. Univariate analysis showed a positive correlation between the relative abundance of Prevotellaceae and the volume of vegetable intake. Vegetables are good sources of dietary fiber. In agreement with these findings, the relative abundance of Prevotellaceae was found to be greatly influenced by a low-fiber diet.13,60 Therefore, the present findings indicate that dysbiosis caused by a low-fiber diet is a result of a decrease in the relative abundance of Prevotellaceae in the gut of individuals with CC. Multiple linear regression analysis showed that the SDS score was independently and significantly predictive of an increased relative abundance of Lachnospiraceae and Ruminococcaceae. Accordingly, it has been reported that anxiety and depression may cause changes in the gut microbiota through the microbiome–gut–brain axis.24,25 Depression may activate the sympathetic nervous system and then lead to visceral hypersensitivity and colon dysmotility. 61 Therefore, it can be inferred that mental state is another key reason for dysbiosis in patients with constipation.
Conclusions
This study found that patients with different CC subtypes showed different characteristics of dysbiosis. A decreased relative abundance of Bacteroidaceae and increased relative abundance of Ruminococcaceae were the typical changes in gut microbiota for STC and DD, respectively. Depression and insufficient vegetable intake were the main factors affecting the intestinal microbiota of patients with CC.
Supplemental Material
sj-docx-1-tag-10.1177_17562848231154101 – Supplemental material for Characteristics of fecal microbiota in different constipation subtypes and association with colon physiology, lifestyle factors, and psychological status
Supplemental material, sj-docx-1-tag-10.1177_17562848231154101 for Characteristics of fecal microbiota in different constipation subtypes and association with colon physiology, lifestyle factors, and psychological status by Ting Yu, Yu Ding, Dong Qian, Lin Lin and Yurong Tang in Therapeutic Advances in Gastroenterology
Supplemental Material
sj-docx-2-tag-10.1177_17562848231154101 – Supplemental material for Characteristics of fecal microbiota in different constipation subtypes and association with colon physiology, lifestyle factors, and psychological status
Supplemental material, sj-docx-2-tag-10.1177_17562848231154101 for Characteristics of fecal microbiota in different constipation subtypes and association with colon physiology, lifestyle factors, and psychological status by Ting Yu, Yu Ding, Dong Qian, Lin Lin and Yurong Tang in Therapeutic Advances in Gastroenterology
Footnotes
References
Supplementary Material
Please find the following supplemental material available below.
For Open Access articles published under a Creative Commons License, all supplemental material carries the same license as the article it is associated with.
For non-Open Access articles published, all supplemental material carries a non-exclusive license, and permission requests for re-use of supplemental material or any part of supplemental material shall be sent directly to the copyright owner as specified in the copyright notice associated with the article.