
Abstract
Background:
Sarcopenia is a progressive generalized loss of skeletal muscle mass commonly observed in advanced stages of cancer.
Objective:
To assess the relationship between sarcopenia and the prognosis of patients with hepatocellular carcinoma (HCC) treated with a programmed cell death 1 (PD-1) inhibitor.
Design:
This is a retrospective study.
Methods:
This study included patients with HCC treated with camrelizumab between 1 March 2020 and 1 December 2021. The skeletal muscle area at the L3 vertebra middle level was used to calculate the skeletal muscle index. Propensity score matching (PSM) analysis was used to balance the variables between the two groups.
Results:
In all, 97 patients with HCC were included in the study, with 46 and 51 patients in the sarcopenia group and the non-sarcopenia group, respectively. The baseline characteristics of albumin, Child-Pugh class, albumin–bilirubin score, neutrophil-to-lymphocyte ratio, and platelet-to-lymphocyte ratio were significantly different between the two groups. In total, 26 patients from each group (n = 52) were selected after the PSM analysis. The progression-free survival (PFS) in the non-sarcopenia group was significantly longer than that in the sarcopenia group before and after PSM analysis (6.5 versus 4.8 months, p = 0.038). In addition, the disease control rate was similar before and after PSM analysis (57.7% versus 69.2%, p = 0.388). The objective response rate in the non-sarcopenia group tended to be higher than that in the sarcopenia group (11.5% versus 30.8%, p = 0.090, after PSM), but no statistically significant difference was found. The median overall survival (OS) in the non-sarcopenia group tended to longer than it in the sarcopenia group before PSM without significant differences (16.3 versus 11.3 months, p = 0.090) and the median OS was similar between the two groups after PSM (16.3 versus 16.8 months, p = 0.735).
Conclusions:
HCC patients with sarcopenia tended to have higher levels of inflammation and lower levels of albumin than patients without sarcopenia. Sarcopenia is associated with a shorter PFS in HCC patients treated with PD-1 inhibitor.
Keywords
Introduction
Immune checkpoint inhibitors (ICIs) targeting programmed cell death 1 (PD-1), programmed cell death-ligand 1 (PD-L1), and cytotoxic T lymphocyte antigen 4 have been the treatment of choice for various cancer types since the introduction and development of immunotherapy.1,2 Hepatocellular carcinoma (HCC) is the most common primary liver cancer and the fifth most prevalent malignancy worldwide. 3 In the recent IMbrave150 study (NCT03434379), the combination of atezolizumab and bevacizumab demonstrated impressive efficacy in patients with HCC. 4 Aside from the combination of atezolizumab and bevacizumab, tremelimumab and durvalumab is another noteworthy combination from the clinical trial HIMALAYA, and has shown favorable tolerability and promising therapeutic effects as first-line therapy in patients with unresectable HCC. 5 However, despite their impressive efficacy, not all patients with HCC respond to ICIs.6,7 Therefore, an objective and measurable biomarker that can predict the efficacy of ICI therapy is urgently required to identify patients who will benefit from ICIs and avoid unnecessary immune-related adverse events.
Sarcopenia is a progressive generalized loss of skeletal muscle mass and strength commonly observed in advanced stages of cancer.8,9 Previous studies have linked sarcopenia to prognosis of cancer patients who underwent surgery, and with the use of tyrosine kinase inhibitors (TKIs).10–14 Mounting evidence has recently demonstrated that sarcopenia influences ICI treatment efficacy.15–18 Meta-analyses have reported poor survival and poor response in patients with sarcopenia, suggesting a negative correlation between sarcopenia and ICI efficacy.19,20 However, to the best of our knowledge, only a few studies have examined the effect of sarcopenia on HCC patients who received ICI.
Therefore, we retrospectively reviewed the electronic medical records of patients diagnosed with HCC and treated with a PD-1 inhibitor (camrelizumab) to assess the overall survival (OS) and progression-free survival (PFS) of HCC patients with or without sarcopenia. In addition, the prognostic factors influencing PFS were investigated using univariable and multivariable analyses.
Material and methods
Study design and patient selection
The institutional review board of our hospital has confirmed that no ethical approval is required because this is an observational study. Clinical data were analyzed retrospectively and anonymously; as such, the local ethics committee and the institutional review board of the Huazhong University of Science and Technology waived the requirement for informed consent. Consecutive HCC patients treated with therapy including PD-1 inhibitor (camrelizumab) between 1 March 2020 and 1 December 2021 at Union Hospital, Tongji Medical College, China, were reviewed retrospectively. The reporting of this study conforms to the STROBE guidelines. 21
The inclusion criteria were as follows: (1) patients diagnosed with HCC following the guidelines of the European Association for the Study of Liver and Barcelona Clinic Liver Cancer (BCLC) stage; (2) patients aged >18 years; (3) patients classified as Child-Pugh class A or B; and (4) patients who received camrelizumab treatment or camrelizumab with TKIs. The exclusion criteria were as follows: (1) patients who did not undergo computed tomography (CT) and/or magnetic resonance imaging (MRI) before the beginning of treatment and (2) patients classified as Child-Pugh class C.
We retrospectively collected baseline information for each patient, including gender, age, BCLC stage, presence of macrovascular invasion and/or extrahepatic spread, Eastern Cooperative Oncology Group (ECOG) performance, Child-Pugh class, hepatitis, total bilirubin, albumin, albumin–bilirubin (ALBI) score, prothrombin time, aspartate aminotransferase, alanine aminotransferase, platelet-to-lymphocyte ratio (PLR), neutrophil-to-lymphocyte ratio (NLR), tumor size, tumor number, α-fetoprotein level, and TKI usage.
Imaging analysis of skeletal muscle mass
The skeletal muscle index (SMI, cm2/m2) was used to assess skeletal muscle mass status and was calculated as the muscle area (cm2) measured at the L3 level after adjusting for height (m2). 22 Two independent radiologists (F.H.W. and C.S.Z. with 6- and 30-year imaging experience, respectively) manually delineated the region of interest of skeletal muscles on axial CT or MRI at the middle level of the L3 vertebra on the Phillips Intelli Space Portal workstation (version 10.1, Best, the Netherlands) (Figure 1). The muscles included the psoas, rectus, transversus abdominis, internal and external oblique, quadratus lumborum, longissimus thoracis, iliocostalis lumborum, and spinalis thoracis; the intramuscular fat area was excluded. Any disagreements were resolved by consensus. The total muscle area was measured, and the average was calculated for subsequent analysis.

Measurement of muscle mass at the middle level of the L3 vertebra in the sarcopenia (a) group and non-sarcopenia group (b).
The optimal cutoff points for SMI classification were determined using the X-tile software (Yale University School of Medicine, New Haven, Connecticut, USA), which provided a simple and comprehensive approach to dividing cohorts into low-level and high-level marker expressions based on survival or PFS outcomes.23,24 Based on these cutoff values, the patients in this study were divided into sarcopenia and non-sarcopenia groups.
Definition and evaluation of data
All the patients were tracked until December 2021. A follow-up CT or MRI (every 4–6 weeks after the initial PD-1 inhibitor treatment) was compared to pre-treatment imaging to determine the time of PFS based on the Modified Response Evaluation Criteria in Solid Tumors. 25 The objective response rate (ORR) was defined as the proportion of patients with complete response (CR) or partial response (PR), while the disease control rate (DCR) was defined as the proportion of patients with CR, PR, or stable disease. The OS of the patients in the two groups was recorded. PFS was defined as the time elapsed between the start of camrelizumab treatment and the onset of tumor progression or patient death. The time from the start of camrelizumab treatment to the last follow-up or patient death was defined as OS.
Statistical analyses
All analyses were performed with SPSS version 24.0 software (IBM, Armonk, NY, USA). The mean and standard deviation of continuous variables were calculated using the student’s t-test, and the percentages of discrete variables were calculated using the chi-square test. The Kaplan–Meier method and log-rank test were used to compare the differences in PFS, OS, and survival rates between the two groups. The log-rank test was used for univariable analysis. Variables with a p value < 0.10 from the univariable analysis were entered into a Cox proportional hazards model for multivariable analysis to identify risk factors influencing PFS. All the tests were two-tailed; a p value of less than 0.05 denoted statistical significance. Propensity score matching (PSM) analysis was conducted to reduce the patient selection bias and balance the variables between the two groups. Matching was performed based on patients’ baseline characteristics. One-to-one matching without replacement was applied, and the caliper value was 0.05.
Results
Patient characteristics
This study included 97 HCC patients (79 males and 18 females) who were treated with camrelizumab between 1 March 2020 and 1 December 2021. Table 1 shows the baseline characteristics of patients before and after PSM. The sarcopenia group consisted of 46 patients, whereas the non-sarcopenia group consisted of 51 patients. The baseline characteristics of albumin-related factors (albumin, Child-Pugh class, and ALBI score) were significantly different between the two groups. Except for albumin-related indicators and inflammation-related indicators (NLR and PLR), there were no significant differences in the baseline factors between the two groups. After PSM, 26 patients from each group (n = 52) with balanced baseline characteristics were included in the subsequent analyses (Table 1).
Baseline characteristics of patients between the two groups before and after PSM analysis.

AFP, alpha-fetoprotein; ALBI, albumin–bilirubin; ALT, alanine aminotransferase; AST, aspartate aminotransferase; BCLC, Barcelona Clinic Liver Cancer; ECOG, Eastern Cooperative Oncology Group; NLR, neutrophil-to-lymphocyte ratio; PLR, platelet-to-lymphocyte ratio; PSM, propensity score matching; PT, prothrombin time; SD, standard deviation; TB, total bilirubin; TKIs, tyrosine kinase inhibitors.
The optimum cutoff value of SMI
The cutoff value for determining sarcopenia has a high degree of heterogeneity, which is likely due to differences in race, statistical approach, or geographic location. 23 The X-tile software was used for X-tile plot analysis to determine the best cutoff value.
Previous evidence has shown a significant difference in skeletal muscle mass status between males and females 26 ; hence, we calculated different cutoff values with respect to sex. The SMI cutoff value for females was 34.3 cm2/m2 (Figure 2(b)), which was used to assign 10 patients (55.5%) to the sarcopenia group and eight patients (44.5%) to the non-sarcopenia group. Males accounted for 81.4% (79 patients) of the patients included in this study. The SMI cutoff value for males was 37.7 cm2/m2 (Figure 2(e)), which resulted in 36 male patients (45.6%) and 43 male patients (54.4%) being included in the sarcopenia and non-sarcopenia groups, respectively. Kaplan–Meier curves of PFS for different genders between the two groups are displayed in Figure 2(c) and (f) (female: p = 0.008; male: p = 0.006).
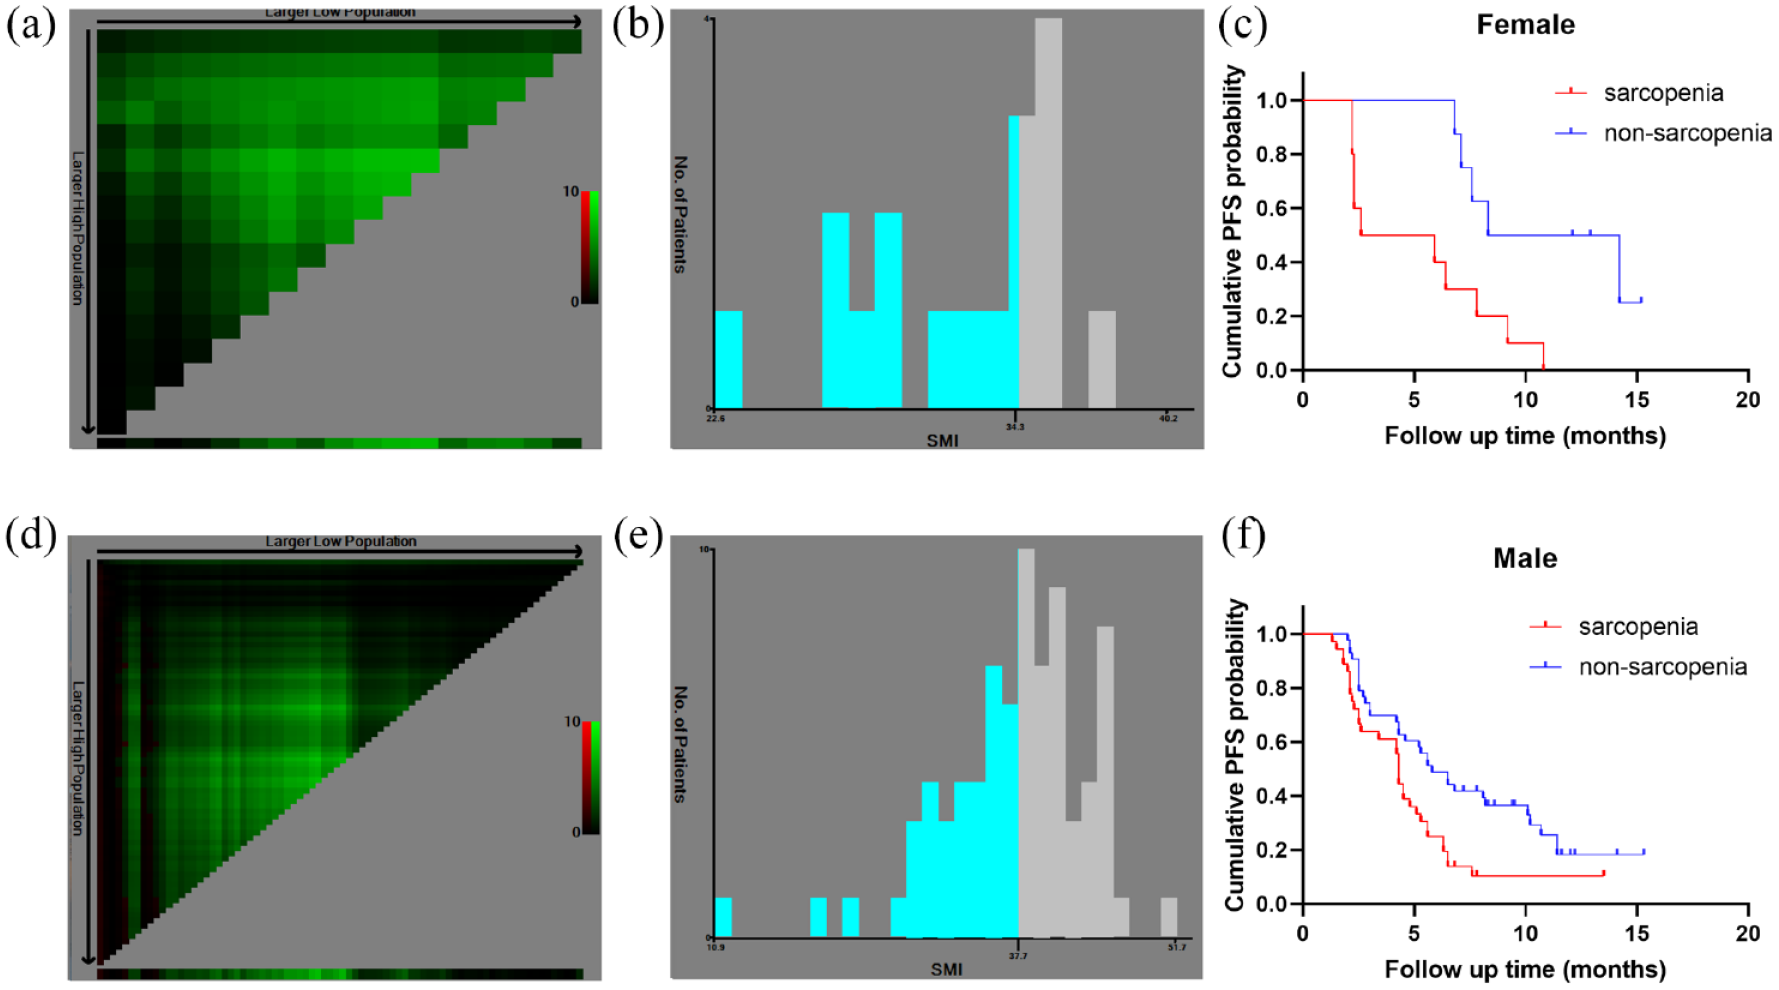
The optimal cutoff points for SMI classification were determined with the X-tile software. Histograms, X-tile plots, and Kaplan–Meier curves were made for females (a–c) and males (d–f) separately.
Tumor response and PFS
The tumor responses in the two groups before and after PSM are shown in Supplement Table S1. Before the PSM, there was no statistically significant differences between the sarcopenia group and non-sarcopenia group in terms of DCR (63.0% versus 72.4%, p = 0.316) and ORR (17.4% versus 33.3%, p = 0.073). After the PSM, there was also no significant difference for DCR (57.7% versus 69.2%, p = 0.388) and ORR (11.5% versus 30.8%, p = 0.090) between these two groups.
In this study, the median PFS was 5.30 months [95% confidence interval (CI), 4.16–6.44] in 97 patients. Before the PSM analysis, the non-sarcopenia group (6.8 months, 95% CI: 4.5–9.1) had a significantly longer PFS than the sarcopenia group (4.3 months, 95% CI: 3.4–5.2) (p < 0.001, Figure 3(a)). Similarly, after the PSM analysis, the non-sarcopenia group (6.5 months, 95% CI: 3.5–9.5) had a significantly longer PFS than the sarcopenia group (4.8 months, 95% CI: 3.6–6.0) (p = 0.038, Figure 3(b)).
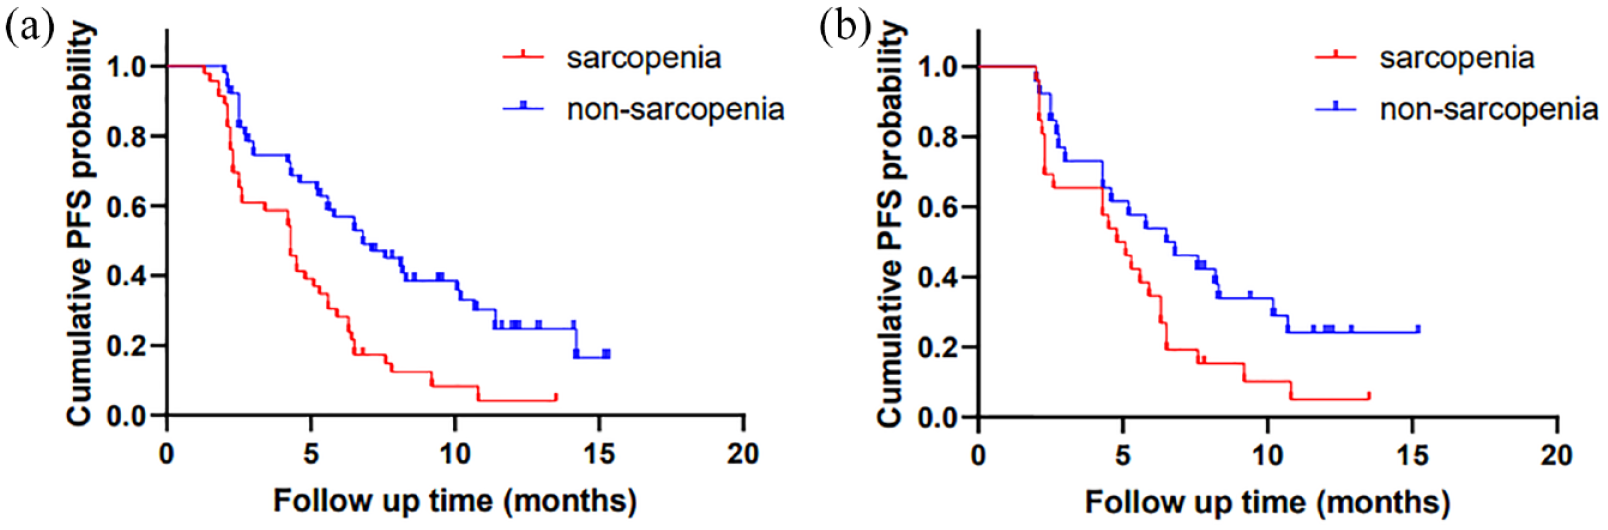
Kaplan–Meier curves of PFS in patients with and without sarcopenia before PSM analysis (a); in patients with and without sarcopenia after PSM analysis (b).
The PFS of patients with ALBI score ⩽− 2.6 (10.8 months, 95% CI: 7.8–13.8) was significantly longer than that of patients with ALBI score >− 2.6 (4.3 months, 95% CI: 3.8–4.9) (p < 0.001, Figure 4(a)). The curve trends suggested a better PFS in patients with NLR ⩽ 5 than in patients with NLR > 5; however, with no statistical significance (PFS: NLR ⩽ 5 group: 5.8 months, 95% CI: 5.0–6.6; NLR > 5 group: 4.2 months, 95% CI: 2.9–5.5; p = 0.151, Figure 4(b)). Patients with PLR ⩽ 300 (5.6 months, 95% CI: 4.5–6.7) had a longer PFS than those with PLR > 300 (2.7 months, 95% CI: 0.7–4.7) (p < 0.001, Figure 4(c)). Of note, PFS did not differ significantly between patients who received TKIs and those who did not (TKIs group: 4.8 months, 95% CI: 3.7–5.9; no TKIs group: 5.6 months, 95% CI: 4.0–7.2; p = 0.238, Figure 4(d)). Moreover, patients with tumor number ⩽ 3 (7.8 months, 95% CI: 3.7–11.9) had a longer PFS than patients with tumor number > 3 (4.5 months, 95% CI: 3.7–5.3) (p = 0.001, Figure 4(e)). In addition, the Supplemental Material includes more subgroups (Child-Pugh class, ALBI scores, BCLC stages, and NLR) comparing PFS in the sarcopenia and non-sarcopenia groups (Supplemental Figure S1A–H).

Kaplan–Meier curves of PFS in patients with ALBI ⩽− 2.6 and > −2.6 (a); in patients with NLR ⩽ 5 and >5 (b); in patients with PLR ⩽ 300 and >300 (c); in patients with and without TKIs use (d); in patients with tumor number ⩽3 and > 3 (e).
Univariable and multivariable analyses of PFS
Before PSM analysis, tumor number, Child-Pugh class, macrovascular invasion, extrahepatic spread, ECOG performance status, tumor size, PLR, NLR, and sarcopenia were identified as potential predictors for PFS in the univariable analysis. However, in the multivariable analysis, tumor size, PLR, NLR, and ECOG performance status were not significantly associated with PFS. In both univariable and multivariable analyses, tumor number > 3, Child-Pugh class B, macrovascular invasion, extrahepatic spread, and sarcopenia were significant risk factors associated with a shorter PFS (Table 2).
Univariate and multivariate analyses of prognostic factors for PFS before PSM analysis.

AFP, alpha-fetoprotein; ALT, alanine transaminase; AST, aspartate aminotransferase; CI, confidence interval; ECOG, Eastern Cooperative Oncology Group; HBV infection, hepatitis B virus infection; HR, hazard ratio; NLR, neutrophil-to-lymphocyte ratio; PLR, platelet-to-lymphocyte ratio; PSM, propensity score matching; TKIs, tyrosine kinase inhibitors.
After PSM analysis, only macrovascular invasion and sarcopenia were considered as potential predictors of PFS in the univariable analysis, and were also significant risk factors associated with a shorter PFS in the multivariable analysis (Table 3).
Univariate and multivariate analyses of prognostic factors for PFS after PSM analysis.

AFP, alpha-fetoprotein; ALT, alanine transaminase; AST, aspartate aminotransferase; CI, confidence interval; ECOG, Eastern Cooperative Oncology Group; HBV infection, hepatitis B virus infection; HR, hazard ratio; NLR, neutrophil-to-lymphocyte ratio; PLR, platelet-to-lymphocyte ratio; PSM, propensity score matching; TKIs, tyrosine kinase inhibitors.
Overall survival
The median OS in patients with sarcopenia was 11.3 months (95% CI: 8.2–14.4 months), while the median OS in the non-sarcopenia group was 16.3 months (95% CI: not attained). The Kaplan–Meier curves indicated a trend toward decreased survival in patients with sarcopenia, but this did not reach statistical significance (p = 0.090, Figure 5(a)). Patients with sarcopenia had a half-year survival rate of 73.9%, whereas those without sarcopenia had a half-year survival rate of 90.2% (p = 0.032). The 1-year survival rate was estimated to be 42.7% in the sarcopenia group and 60.5% in the non-sarcopenia group (p = 0.107). Similarly, after PSM analysis, there was no statistically significant difference (p = 0.735, Figure 5(b)) between the sarcopenia group (16.8 months, 95% CI: 6.8–26.8) and the non-sarcopenia group (16.3 months, 95% CI: not attained). The half-year survival rate and 1-year survival rate of patients with sarcopenia were 76.9% and 59.4%, respectively, and those of patients without sarcopenia were 84.6% and 59.2%, respectively, with no statistical difference between the two groups (p = 0.458; p = 0.958).

Kaplan–Meier curve of OS in patients with and without sarcopenia before PSM analysis (a); in patients with and without sarcopenia after PSM analysis (b).
Discussion
In previous literatures, the efficacy of TKI therapy, liver transplantation, intra-arterial chemoembolization, and transarterial radioembolization has been linked to muscle status in patients with HCC.13,14,23,27–29 A recent study suggested that sarcopenia may not be associated with an increased risk in patients with HCC receiving PD-1 inhibitors. 15 Given the small sample size of the mentioned study and the lack of a report on whether the baseline information of the two groups was balanced, further investigation is required to validate these findings.
To the best of our knowledge, this is the first study to examine the relationship between sarcopenia and prognosis of patients with HCC receiving camrelizumab. We found that patients with sarcopenia may have lower mean albumin levels and higher systemic inflammation. Albumin, like SMI, is a widely used indicator of systemic nutritional status,30,31 and serum albumin in patients with sarcopenia is expected to be lower than that in patients without sarcopenia. Consistent with our findings, a recent large meta-analysis found a negative association between albumin level and sarcopenia, regardless of age group and clinical settings. This may be because the downregulation of albumin synthesis helps conserve amino acids to produce ‘positive’ acute phase proteins more efficiently in the context of chronic inflammation. 32 In addition, some studies showed that a higher circulation of systemic inflammation biomarkers were associated with higher sarcopenia risk in patients with cancer, and higher NLR and PLR levels were found in patients with sarcopenia than in patients without sarcopenia, which was in agreement with our results.33,34 Two recent studies reported that patients with sarcopenia or with decrease in SMI showed a worse radiological response when compared with those without, although this difference was not significant.35,36 Similarly, the ORR in patients without sarcopenia tended to be higher than patients with sarcopenia in this study.
The relationship between skeletal muscle and tumor is complicated. Compelling evidence shows that skeletal muscle can release cytokines into circulation such as interleukin 15, which increases the number of circulating natural killer cells and CD8+ T cells, and this has been demonstrated to improve ICI efficacy in mice.37–39 Contrary reports have shown that skeletal muscle waste increases systemic inflammation, which increases the risk of HCC development and reduces the efficacy of PD-1 immunotherapy.27,40 In this study, inflammation-related indicators (NLR and PLR) were higher in the sarcopenia group and were related to a shorter PFS in the univariable analysis.
Furthermore, we investigated the relationship between sarcopenia and PFS in different populations. Sarcopenia can predict PFS in patients with Child-Pugh Class A, ALBI score >− 2.6, BCLC stage B, BCLC stage C, or NLR ⩽ 5. In addition, patients with ALBI scores ⩽− 2.6 tended to have a shorter PFS. In both the univariable and multivariable analyses, sarcopenia was a significant risk factor associated with a shorter PFS before and after PSM analysis. The upper and lower limit of OS in the non-sarcopenia group were not reached because of the short duration of the study. Similar to a previous study, 17 the Kaplan–Meier curves showed a trend toward poor survival in sarcopenia patients without significance before the PSM analysis. However, this trend and the significant difference in the half-year survival rate disappeared after balancing the baseline characteristics. We speculated that this was because we selected similar levels of systemic inflammation and serum albumin in patients with and without sarcopenia after PSM analysis. However, despite the balanced baseline characteristics, some information may have been lost after PSM analysis. In addition, we thought that other risk factors such as tumor metastasis or thrombus formation were the more important reason leading to death in the patients with intermediate-advanced HCC.
Given that sarcopenia may have a negative impact on the treatment of HCC patients, a greater emphasis on rehabilitation treatment and prevention of sarcopenia is required. It has been reported that levocarnitine supplementation may help HCC patients improve skeletal muscle mass during lenvatinib therapy, and patients with levocarnitine supplementation tended to have a longer median time to treatment failure compared to patients without levocarnitine supplementation. 14 In-hospital exercise has also been reported to increase muscle mass in HCC patients who underwent transarterial chemoembolization, 41 suggesting the necessity of nutritional support and physical exercise in HCC patients treated with ICI.
There were some limitations to our study. This was a single-center, retrospective study with a small sample size. However, a strength of this study was that we improved the statistical reliability and reduced selection bias through PSM analysis and detailed subgroup analysis. In addition, due to the relatively short period of follow-up time, we did not get the mature survival data. Therefore, prospective multi-center clinical trials are required to validate our findings.
Conclusion
HCC patients with sarcopenia tend to have higher levels of inflammation and lower levels of albumin than those without sarcopenia. Sarcopenia is related to a shorter PFS in HCC patients treated with a PD-1 inhibitor.
Supplemental Material
sj-docx-1-tag-10.1177_17562848221142417 – Supplemental material for Prognostic impact of sarcopenia in patients with hepatocellular carcinoma treated with PD-1 inhibitor
Supplemental material, sj-docx-1-tag-10.1177_17562848221142417 for Prognostic impact of sarcopenia in patients with hepatocellular carcinoma treated with PD-1 inhibitor by Yusheng Guo, Yanqiao Ren, Feihong Wu, Xiangjun Dong and Chuansheng Zheng in Therapeutic Advances in Gastroenterology
Supplemental Material
sj-docx-2-tag-10.1177_17562848221142417 – Supplemental material for Prognostic impact of sarcopenia in patients with hepatocellular carcinoma treated with PD-1 inhibitor
Supplemental material, sj-docx-2-tag-10.1177_17562848221142417 for Prognostic impact of sarcopenia in patients with hepatocellular carcinoma treated with PD-1 inhibitor by Yusheng Guo, Yanqiao Ren, Feihong Wu, Xiangjun Dong and Chuansheng Zheng in Therapeutic Advances in Gastroenterology
Footnotes
References
Supplementary Material
Please find the following supplemental material available below.
For Open Access articles published under a Creative Commons License, all supplemental material carries the same license as the article it is associated with.
For non-Open Access articles published, all supplemental material carries a non-exclusive license, and permission requests for re-use of supplemental material or any part of supplemental material shall be sent directly to the copyright owner as specified in the copyright notice associated with the article.