
Abstract
Background:
Pancreatic cystic fluid (PCF) analysis is frequently used for cyst diagnosis with carcinoembryonic antigen (CEA) being the most accepted biomarker. Low glucose levels in PCF were previously suggested as a marker for mucinous cysts. A bed-side glucometer is a point-of care, immediate, simple, and cheap method which requires a small volume of PCF.
Objectives:
The aim of our study was to identify the optimal glucose cut-off level for identifying mucinous cysts, evaluate the diagnostic accuracy of glucose compared to CEA, and validate glucometry against reference laboratory biochemical analysis.
Design:
A single-center prospective cohort study.
Methods:
Consecutive patients aged 18 and older, who underwent pancreatic cyst evaluation, at the Tel Aviv Medical Center between 2016 and 2021 were analyzed. Cyst type was defined based on clinical, laboratory, and radiologic findings. Glucose was measured using laboratory biochemical analysis and two glucometers. Receiver operating characteristic analysis derived sensitivity, specificity, and accuracy were calculated and McNemar test was used to compare between methods.
Results:
One hundred and one PCF samples were evaluated. The areas under the receiver operating characteristics curve for identifying mucinous cysts using glucometer, glucose laboratory, and their combination were 0.88 (p < 0.001), 0.92 (p < 0.001), and 0.93 (p < 0.001), respectively. A glucose level of 87 mg/dL was identified as the optimal laboratory glucose threshold value to detect mucinous cyst with a sensitivity of 90.9%, specificity of 83.3%, and accuracy of 89.3, higher in comparison to cyst fluid CEA. Furthermore, PCF glucose levels had the strongest association with mucinous cysts.
Conclusion:
Our findings suggest that PCF glucose level is more accurate than CEA for the diagnosis of mucinous cysts. Glucometry glucose level assessment demonstrated an excellent correlation with laboratory glucose measurements and may become a useful diagnostic test.
Introduction
The availability and improvement of noninvasive imaging modalities such as computed tomography (CT) and magnetic resonance imaging (MRI) caused an increase in incidental pancreatic cystic lesions (PCLs) detection. The incidence of pancreatic cysts in the American population ranges between 3 and 15%. A small portion of PCLs can transform into invasive ductal adenocarcinoma of the pancreas. 1 Therefore, management decisions for PCLs must take into account their low risk of malignancy, their frequent detection, and the dire consequences of a missed diagnosis.
The historical classification of PCLs includes benign cysts [pseudocysts and serous cystadenomas (SCAs)] and malignant or premalignant cysts [mucinous cystic neoplasms (MCNs), intraductal papillary mucinous neoplasms (IPMNs), solid pseudopapillary neoplasms, and pancreatic neuroendocrine tumors (pNETs)]. 2 A definitive diagnosis for PCLs is possible only through excision and histological analysis, which is not readily available since most PCLs are benign and do not require surgical resection. 1 Thus, the current classification of PCLs as mucinous or non-mucinous and their malignant potential are usually based on assessment of multiple parameters including patient history, demographics, physical examination, radiologic findings, endoscopic ultrasound-guided fine needle aspiration (EUS-FNA), and pancreatic cystic fluid (PCF) analysis.2–4 Despite high-quality imaging with CT, MRI, and cyst fluid analysis, the correct classification of cyst type remains challenging. 2
EUS-FNA and PCF analyses are considered when cyst type is unclear and where the results will likely alter management. PCF analysis includes cytopathology assessment and the measurement of fluid markers, including amylase and carcinoembryonic antigen (CEA) levels. CEA is considered the gold standard biomarker of mucinous cysts 5 ; however, CEA levels have been demonstrated to be insufficiently accurate in the identification of pancreatic cyst types.6,7 Few previous studies suggest that low glucose levels in PCF support the diagnosis of mucinous cysts.8–12 A bed-side glucometer is a point-of care, immediate, simple, and cheap method which requires a small volume of PCF [2–4 microliters (μL)] compared to the volume required for the standard biochemical analysis.9,13 Glucose levels measured using glucometry were previously validated in several studies, suggesting glucometry as a feasible, accurate, and reproducible method for the characterization of PCLs.10,13
The aim of this study was to identify the optimal glucose cutoff level; to evaluate glucose specificity, sensitivity, and diagnostic accuracy for mucinous cysts, in comparison to CEA levels; and to re-validate the diagnostic accuracy of on-site glucometry against a reference laboratory procedure.
Methods
Study population
The study population included patients aged 18 and older, who underwent an EUS-FNA for pancreatic cyst evaluation at the Tel Aviv Medical Center between 2016 and 2021. All patients signed an informed consent. The study was approved by the local institutional ethics committee at the Tel Aviv Medical Center, in accordance with the ethical guidelines of the 1975 Declaration of Helsinki and its amendments (approval number 0368-14). Pregnant women, patients under 18 years of age, and patients whose cyst fluid quantity was inadequate for glucose level measurement were excluded. The reporting of this study conforms to the Standards for Reporting of Diagnostic Accuracy (STARD) statement. 14 The STARD 2015 checklist is submitted as supplementary material (Supplemental Table S1).
Data collection
EUS was performed by an expert endosonographer at our endoscopy unit. Linear EUS scopes (Pentax EG38-J10UT and EG34-J10U) attached to an Arieta V70 ultrasound device (Hitachi-Aloka, Japan) were used. All patients were under conscious or sedated by midazolam and/or propofol. FNA was performed with commercially available needles of any size (19G, 22G, or 25G), according to the decision of the endosonographer.
The PCF was collected immediately and was separated into two sterile dry tubes: the first was sent to the cytology laboratory, where it was centrifuged for 10 min at 2000g, for cytospin preparation. The second was sent to the biochemical laboratory for the analysis of CEA, amylase, and glucose levels. Glucose levels were measured by glucose oxidase photometric test, and CEA levels were analyzed using automated analyzer/enzyme-linked immunosorbent assay. The remnant PCF was used for measuring the glucose levels by pipetting the PCF onto the tip of the testing strips. The person performing the measurements was blinded for the final diagnosis. In order to ensure reproducibility of our measurements, two different commercial glucometers were used: FreeStyle Lite (Abbott Diabetes Care, Alameda, CA, USA; abbreviated as glucometer ‘A’) and Accu-Check (Roche, Switzerland; abbreviated as glucometer ‘B’). The minimum required sample volume for glucometry is of 3 and 4 μL for glucometer A and glucometer B, respectively.The measurement range of glucose is 20–500 and 10–600 mg/dL using glucometer A and glucometer B, respectively. Levels below 20 and 10 mg/dL are shown as ‘low’ for glucometer A and glucometer B, respectively, and were considered 20 and 10 mg/dL for the analysis. Patients with no available glucose measurement by either of methods were excluded.
The cyst diagnosis was determined prospectively by two blinded expert pancreatologists from our endoscopy unit at Tel Aviv Medical Center according to clinical, laboratory, sonographic, and radiologic findings. The International consensus Fukuoka guidelines for the management of IPMNs of the pancreas were followed. 3 EUS reports and electronic medical records were anonymized and the following parameters were documented: indication for EUS exam, cyst size, cyst location, presence of worrisome features 3 [i.e., pancreatitis, cyst size ⩾ 30 mm, presence of a mural nodule or an intracystic mass, cyst wall thickening, and main pancreatic duct (MPD) dilation], cyst fluid cytology report, glucose, amylase, and CEA levels, clinical decision, sonographic follow-up, and postoperative diagnosis based on cyst histology (when available). CEA level was grouped into three categories: below 5 ng/mL, 5–192 ng/mL, and above 192 ng/mL, based on the commonly used cutoff level. 2 Patients were excluded from the study and validation cohorts if a consensual final diagnosis between the two experts could not be established.
Statistical analysis
Accuracy (number of correct assessments/number of all assessments), sensitivity, specificity, positive predictive value (PPV), and negative predictive value (NPV) were calculated for laboratory and glucometer glucose measurements, as well as for CEA measurements. McNemar’s test was used to compare between methods. The area under the receiver operating characteristic (ROC) curve was used to evaluate the discrimination ability. The coordinate of the ROC curve, as well as classification and regression tree (CART) and chi-square automatic interaction detector, was used to identify the threshold value of laboratory glucose in order to identify mucinous cysts. Intraclass correlation coefficient (ICC) was used to report the agreement between the laboratory glucose and the glucometer’s results. The ratio of the true positive rate to the false positive rate [i.e., positive likelihood ratio (LR+)] as well as the ratio of the false negative rate to the true negative rate [i.e., negative likelihood ratio (LR−)] were estimated. A Bland and Altman plot was drawn in order to evaluate differences between laboratory glucose and the glucometer’s measurements (Figure 1). Logistic regression was used to identify predictors for mucinous cysts. Fisher’s exact test was used to study the association between categorical variables. Spearman’s correlation coefficient was applied for continued variables, and the Mann–Whitney U test was used for continued-categorical variables. The diagnostic accuracy of on-site glucose measurement was validated in a separated validation cohort. All statistical tests were two-sided and p < 0.05 was considered as statically significant. SPSS software was used for all statistical analysis (IBM SPSS statistics for Windows version 25, IBM Corp., Armonk, NY, USA, 2017).
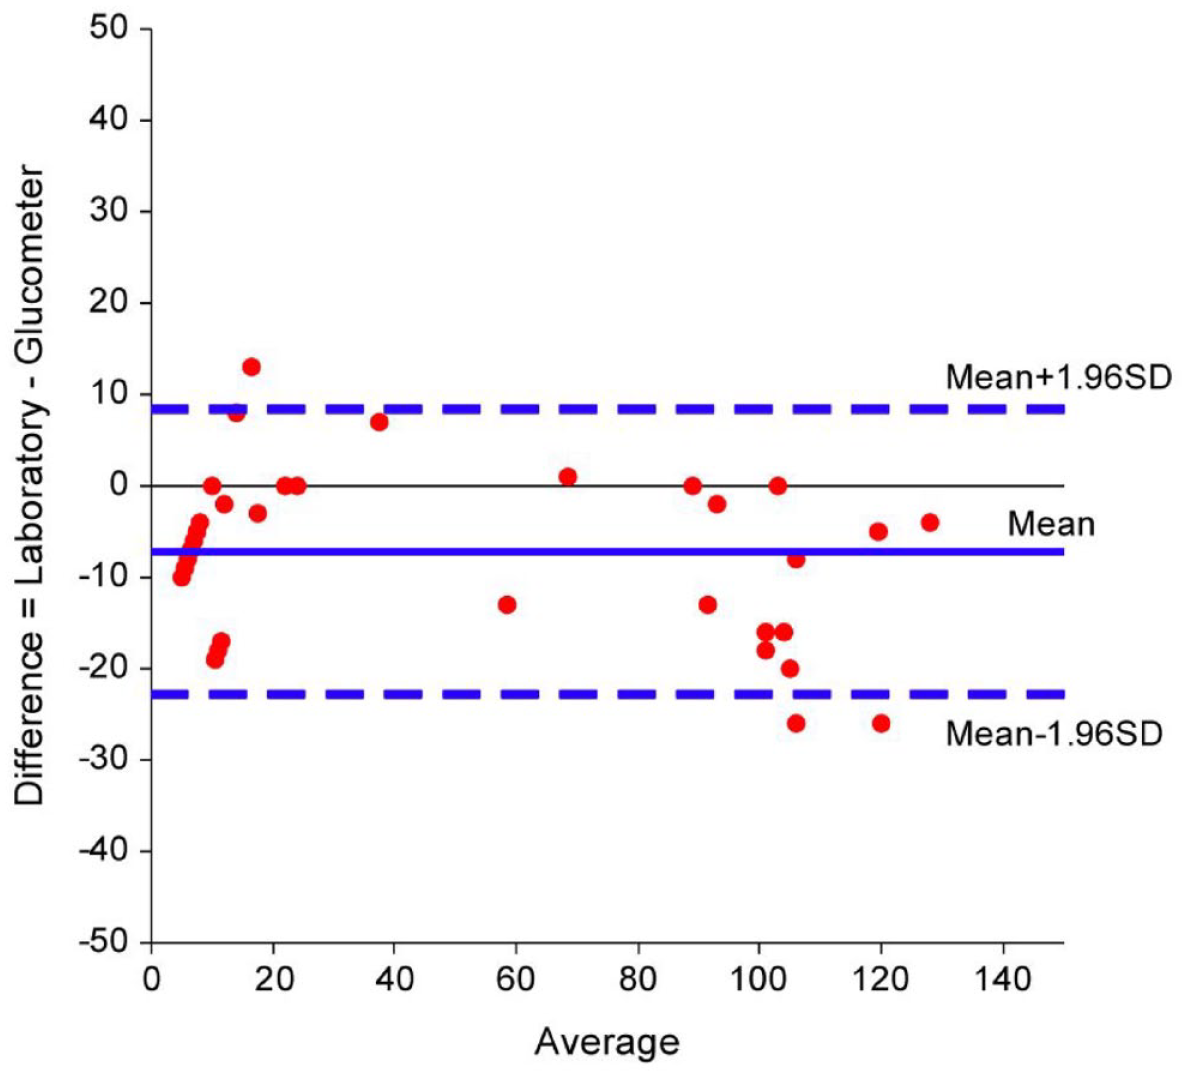
Bland and Altman plot. Glucometry glucose values were slightly higher according to the Bland and Altman plot, with a mean difference of 7.2 mg/dL (95% CI, 5–9.4, p < 0.001) (Figure 1). The overall 95% difference between the two methods ranged between +8.4 and −22.7 mg/dL.
Results
One hundred and one patients were included in the study cohort and 14 consecutive patients were included in the validation cohort. The flow chart of the study is presented in the Supplemental Material, Figure S1. The patient population of the study cohort was composed predominantly of females (59.4%), with a mean age of 67.46 ± 11.86. No cysts were excluded from analysis because of insufficient PCL volume or lack of glucose measurement by either of the methods. One cyst was excluded from the validation cohort due to disagreement between experts. The diagnoses of PCF samples of the study cohort were classified as following: mucinous: 3 MCNs, 74 IPMNs; and non-mucinous: 17 SCAs, 2 cystic pNETs, 4 pseudocysts, 1 lymphoepithelial cyst. Most patients had multiple PCLs which were located in different locations (46.5%), and the most common locations were pancreatic head and tail. The majority of PCLs measured less than 30 mm and 28.7% measured 30 mm or above. The clinical decision for most PCLs (64.9%) was surveillance, and only 3.1% of patients were referred to surgery (Table 1). The median follow-up time was 17 months [interquartile range (IQR) 4–53 months] with a mean follow-up of 33 ± 39 months. The diagnoses of the PCLs from the validation cohort were classified as: mucinous: eight SB-IPMNs, one mixed type IPMN; and non-mucinous: four SCAs, one pseudocyst.
Characteristics of the PCL patients.

BD, branch duct; CEA, carcinoembryonic antigen; IPMN, intraductal papillary mucinous neoplasm; MCN, mucinous cystic neoplasm; MPD, main pancreatic duct; MRCP, magnetic resonance cholangiopancreatography; MRI, magnetic resonance imaging; PCL, pancreatic cyst lesion; pNET, cystic pancreatic neuroendocrine tumor; RF, radiofrequency; SCA, serous cystadenoma.
The median glucose level (either laboratory or glucometry) measured in PCFs of mucinous cysts was 6.5 mg/dL (IQR 2–21 mg/dL), the mean glucose level of 22.5 ± 36 mg/dL, with 90% of mucinous cysts had glucose levels of 75 mg/dL or below. The median glucose level measured in PCFs of non-mucinous cysts was 97 mg/dL (IQR 90–117 mg/dL), the mean glucose level of 96.9 ± 36.2 mg/dL, with 80% of the non-mucinous cysts had glucose levels of 82 mg/dL or above (Figure 2). The areas under the ROCs curve, for identifying mucinous cysts, were 0.88 [95% confidence interval (CI) 0.83–0.97, p < 0.001], 0.92 (95% CI 0.86–0.98, p < 0.001), and 0.93 (95% CI 0.88–0.98, p < 0.001) for glucometer, glucose laboratory, and their combination, respectively [Figures 3(a) to (c)].
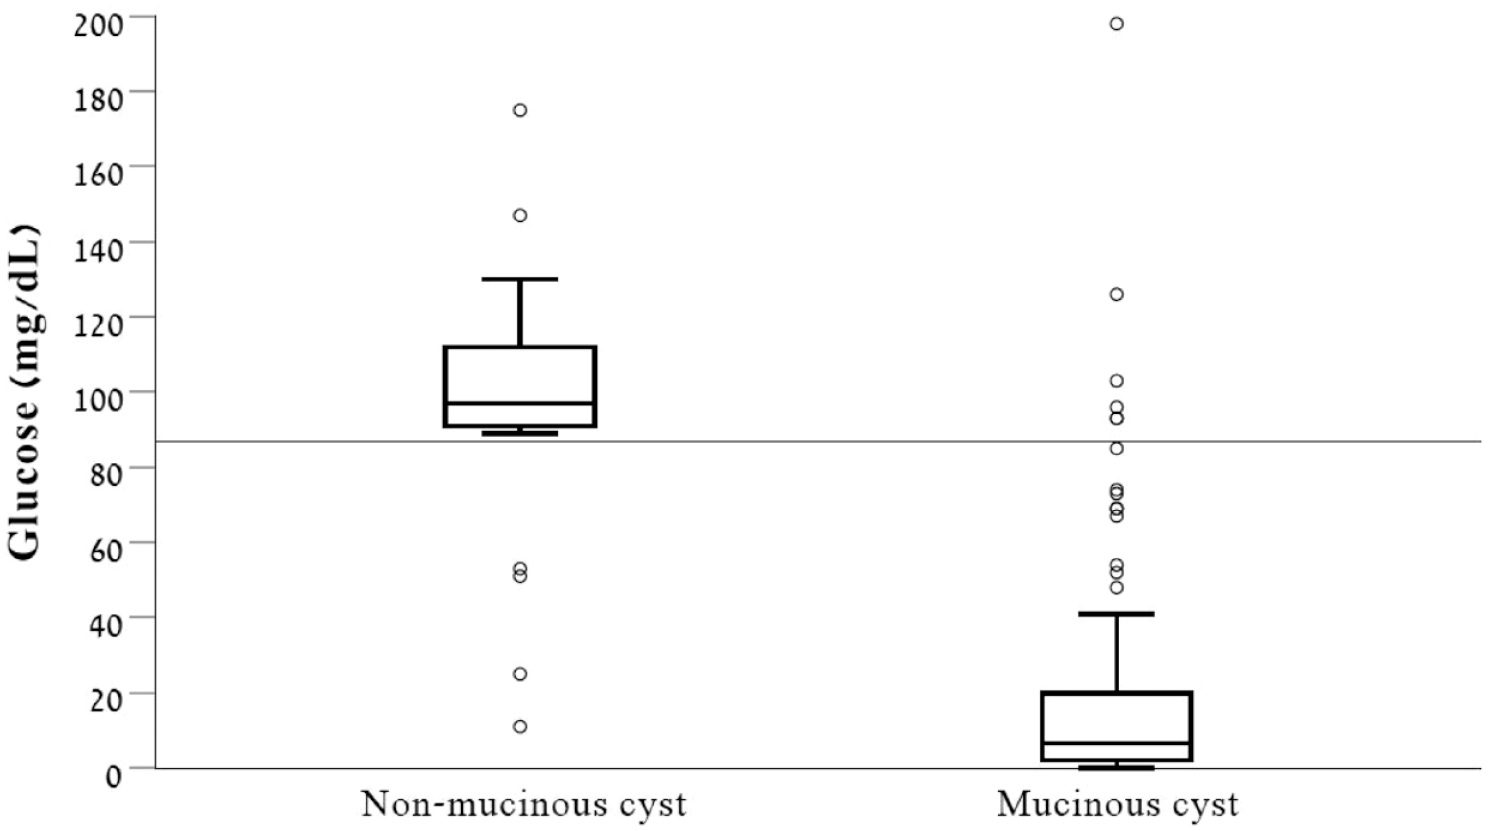
Box plot – laboratory or glucometer glucose measurements. The median glucose level (either laboratory or glucometry) measured in PCFs of mucinous cysts was 6.5 mg/dL, the interquartile range was 2–21 mg/dL, and 90% of mucinous cysts had glucose levels of 75 mg/dL or below. The median glucose level measured in PCFs of non-mucinous cysts was 97 mg/dL, the interquartile range was 90–117 mg/dL, and 80% had glucose levels of 82 mg/dL or above.
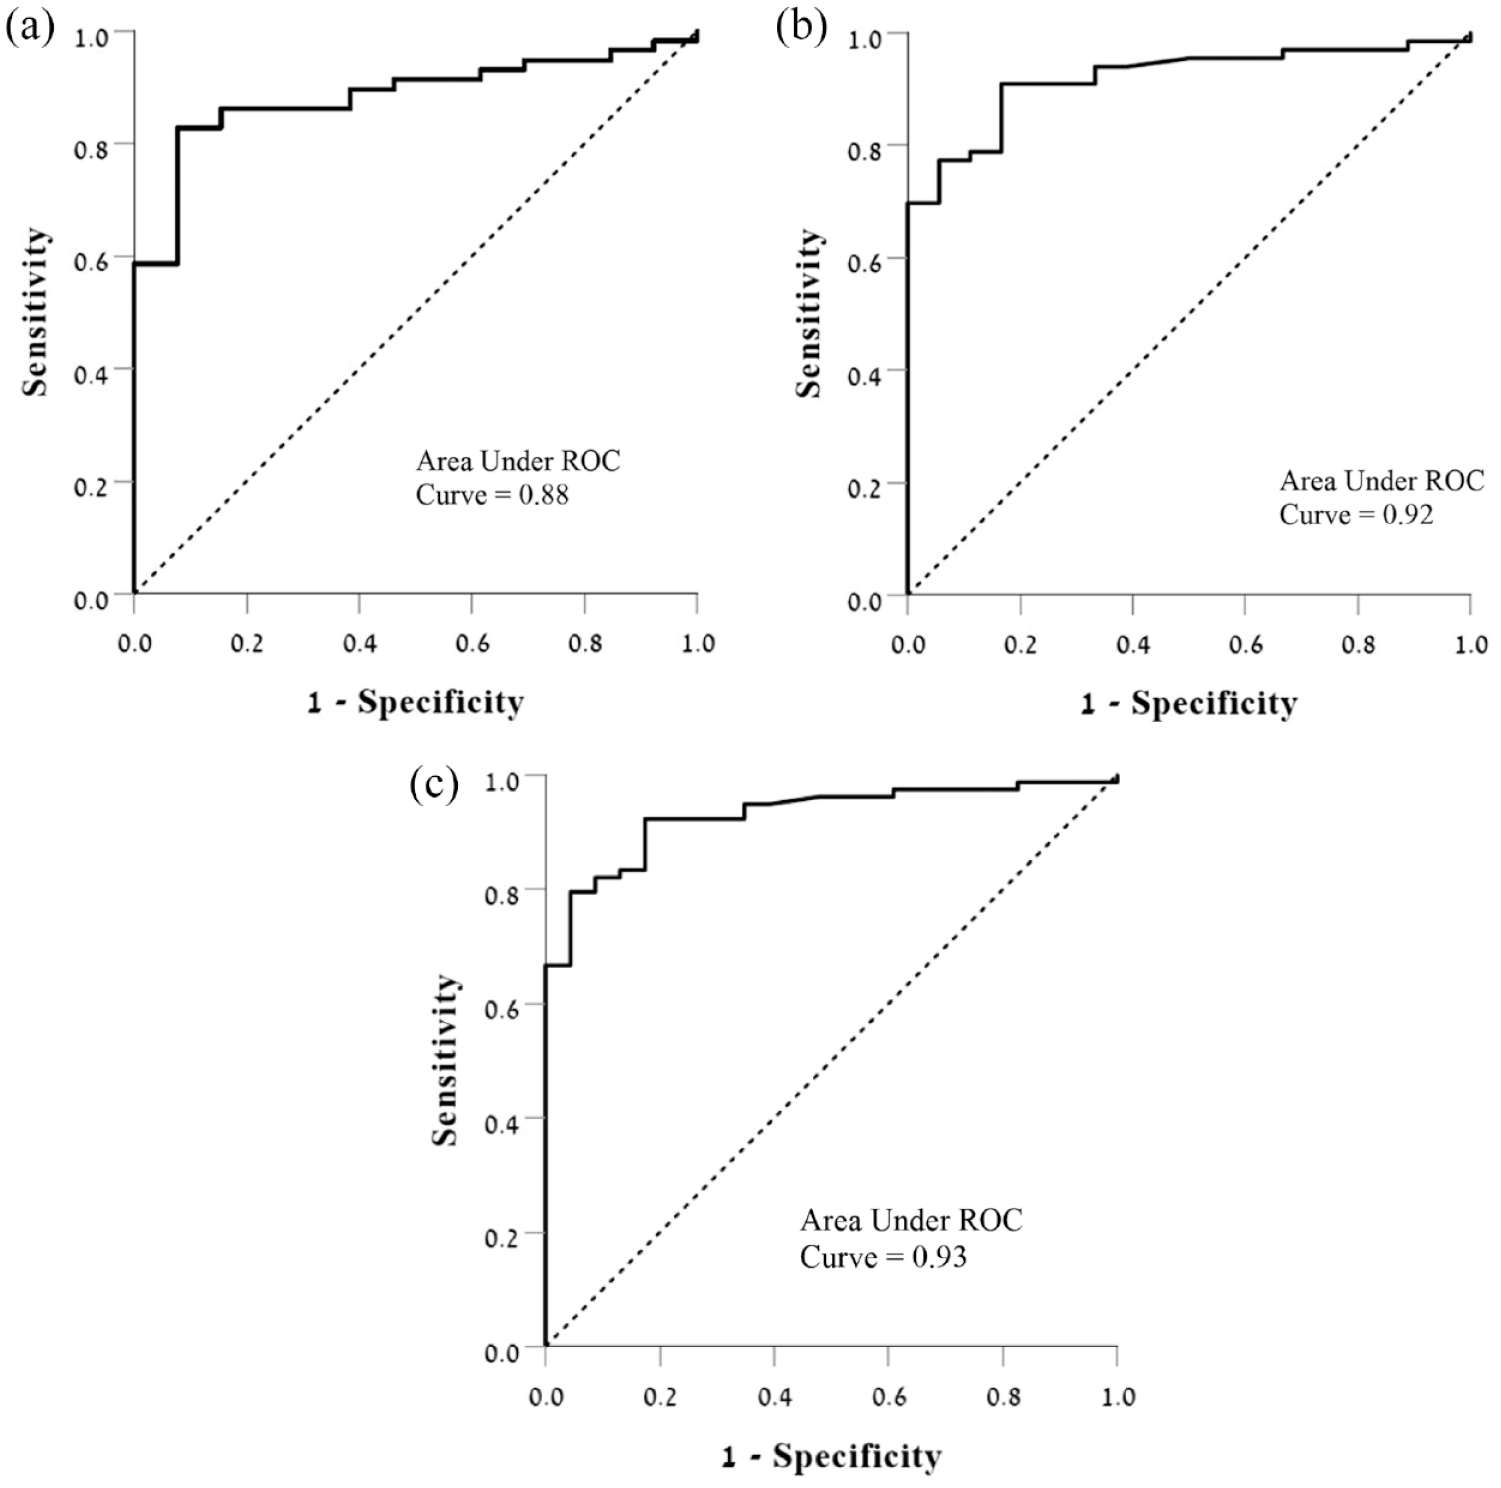
ROC curve plots for the diagnosis of mucinous cysts. (a) ROC for glucometer-based testing. (b) ROC for lab-based glucose testing. (c) ROC for glucose lab or glucometer testing.
Assessment of the optimal glucose cutoff level for mucinous cyst identification
First, we evaluated the specificity, sensitivity, and diagnostic accuracy of glucose using an intermediate glucose cutoff level of 60 mg/dL, since previous studies have used a glucose cutoff level in the range of 50–73 mg/dL.8–13 Second, we used the CART method in order to assess the optimal glucose cutoff level for identifying mucinous cysts. The results are presented in Table 2.
The sensitivity, specificity, diagnostic accuracy, LR+, LR−, PPV, and NPV of glucose.

For PCLs with both glucometer A and B glucometer measurements available, glucose values of glucometer A were preferred in the analysis.
CEA, carcinoembryonic antigen; LR+, positive likelihood ratio; LR−, negative likelihood ratio; NPV, negative predictive value; PCL, pancreatic cystic lesion; PPV, positive predictive value.
A glucose level of 87 mg/dL (0–87 and 88+) was identified as the optimal laboratory glucose threshold value to detect mucinous cysts, with a sensitivity of 90.9%, specificity of 83.3%, accuracy of 89.3%, PPV of 95.2%, and NPV of 71.4%. Cyst fluid glucose, using a glucometer glucose level of 87 mg/dL (0–87 and 88+), was found to have a sensitivity of 86.2%, specificity of 84.6%, diagnostic accuracy of 85.9%, PPV of 96%, and NPV of 58%. LR+ of glucose measured using the glucometer for identifying mucinous lesions was 5.6 and LR− was 0.16. Seventy-one patients who had cyst glucometry glucose measurement values were included in this analysis.
Correlation of glucose concentration as evaluated by laboratory biochemistry analysis and on-site glucometry
ICC was calculated for 54 patients who had both laboratory and glucometry glucose measurements; ICC of 0.851 was found (95% CI, 0.74–0.914, p < 0.001). The sensitivity of laboratory and glucometry glucose measurements using a cutoff level of 87 mg/dL was 90.9% and 86.2% (p = 0.5), respectively. The specificity of laboratory and glucometry glucose measurements using a cutoff level of 87 mg/dL was 83.3% and 84.6% (p > 0.999), respectively. Wide discrepancy between laboratory and glucometry measurement values was noted in two cases, and those cases were excluded from the final ICC calculation; ICC of 0.969 was found (95% CI, 0.82–0.98, p < 0.0001).
Comparison of glucose and CEA levels as predictors for pancreatic mucinous cysts
Both laboratory glucose and CEA measurements were available for 83 patients; cyst fluid laboratory glucose using a cutoff level of 87 mg/dL was significantly more sensitive in comparison to cyst fluid CEA: 90.9 and 46.1%, respectively (ratio 1.97, 95% CI, 1.53–2.53, p < 0.001). Specificity difference could not be compared (CEA specificity of 100% versus laboratory glucose specificity of 83.3%). Both glucometry glucose and CEA measurements were available for 68 patients; specificity difference could not be compared (CEA specificity of 100% versus glucometer glucose specificity of 81.8%). However, cyst fluid glucometry glucose was significantly more sensitive in comparison to cyst fluid CEA measurement, 86 and 50.9% respectively (ratio 1.69, 95% CI, 1.32–2.16, p = 0.001). Cyst fluid glucose (either laboratory or glucometry measurements) and CEA measurements were available for 97 patients. Cyst fluid glucose using a cutoff level of 87 mg/dL was significantly more sensitive in comparison to cyst fluid CEA, 92.1% versus 46.1%, respectively (ratio 2, 95% CI, 1.58–2.53, p < 0.001).
When using both glucose level <87 mg/dL and CEA >192 ng/mL as cutoff for detecting mucinous cysts, the sensitivity was 47.4%, the specificity was 100%, and the diagnostic accuracy was 58.8%. Furthermore, using glucose <87 mg/dL or CEA >192 ng/mL as the cutoff, had a sensitivity of 92.1%, a specificity of 81%, and a diagnostic accuracy of 89.7%.
Clinically relevant variables were evaluated as potential predictors for mucinous cysts (Table 3). PCF glucose levels had the strongest association with mucinous cysts, with odds ratio (OR) of 0.956 (95% CI, 0.938–0.975, p < 0.0001), followed by pancreatic head location with OR of 7.63 (95% CI, 1.382–42.143, p = 0.02); age, sex, CEA level, amylase level, cyst size, and MPD size category were not significantly associated with mucinous cysts in the multivariable regression analysis.
Multivariable analysis of potential predictors for mucinous cysts.
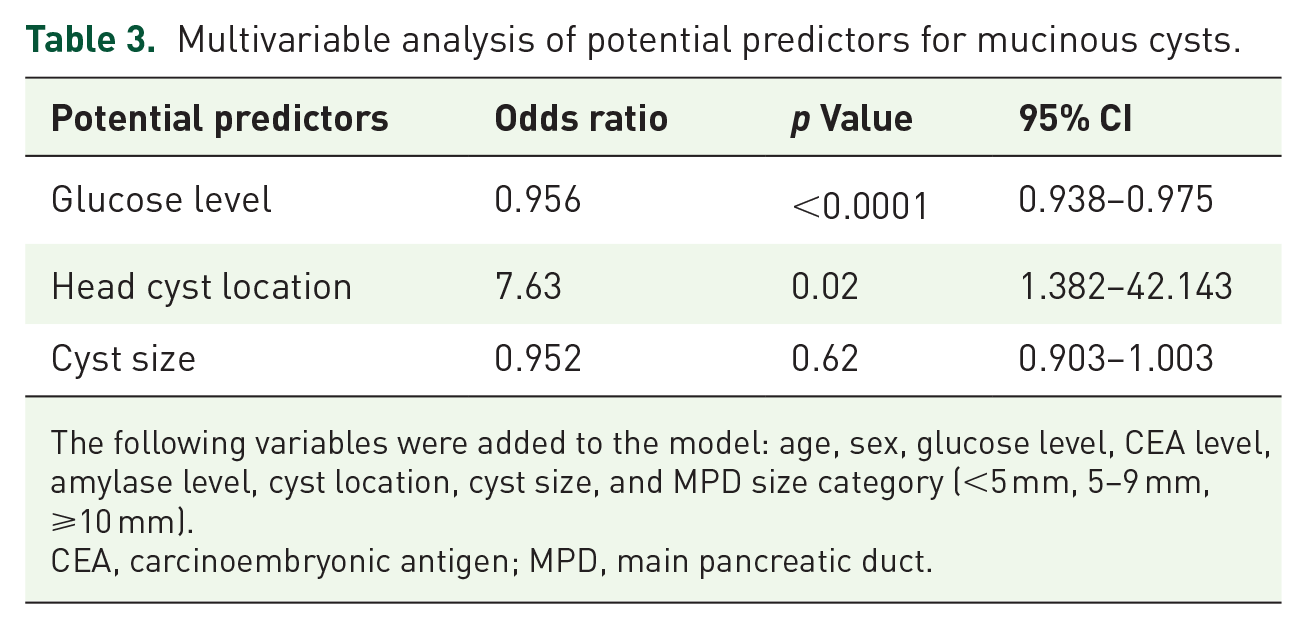
The following variables were added to the model: age, sex, glucose level, CEA level, amylase level, cyst location, cyst size, and MPD size category (<5 mm, 5–9 mm, ⩾10 mm).
CEA, carcinoembryonic antigen; MPD, main pancreatic duct.
Validation cohort
Out of the 14 patients initially included in the validation cohort, on-site glucometer testing was feasible in 10 cases, and laboratory glucose in 4 cases. Using the derivation cohort cutoff (87 mg/dL), the sensitivity, specificity, diagnostic accuracy, PPV, and NPV for the diagnosis of mucinous PCL were similar: 88.8, 100, 92.8, 100, and 83.3%, respectively. The area under the ROC curve, for identifying mucinous cysts in the validation cohort, was 0.93 (95% CI 0.794–1.0, p = 0.009) (Figure 4).

ROC curve for glucose laboratory or glucometer from validation cohort.
Discussion
The current study assesses the accuracy of PCF glucose levels for mucinous cyst diagnosis using laboratory as well as on-site glucometry measurement. Consistent with previous studies, including the original study by Park et al. 8 and the recent meta-analysis by Mohan et al. 15 that demonstrated a pooled sensitivity of 90.5% and a pooled specificity of 88%, our results demonstrated similar findings as low intracystic glucose (using the cutoff of 60 mg/dL) had a sensitivity of 80–87.7% and specificity of 84.6–90% in diagnosing mucinous cysts. Furthermore, although previous studies used glucose cutoff level between 50–73 mg/dL, our statistical analysis using the CART method demonstrated an improved diagnostic ability with higher glucose cutoff level of 87 mg/dL, and according to a recent meta-analysis, the mean intra-cystic glucose for mucinous lesions was 15.92 ± 6.20 and for non-mucinous lesions is 94.03 ± 12.23. 16 A possible explanation for the increased cutoff level and the higher range of the mucinous cysts’ glucose level might be that the minimum glucose level measured by both glucometers is 20 mg/dL for glucometer A and 10 mg/dL for glucometer B which might have shifted the cutoff level upward. Glucose was first offered as an optional marker for mucinous cysts by the novel study by Park et al., 8 using a metabolomics analysis, however, to the best of our knowledge, there is no biological explanation for the lower glucose levels in mucinous pancreatic cysts lesions. One hypothesis refers to rapidly dividing dysplastic/neoplastic cells which use higher rates of glycolysis and the fact that pancreatic tumor cells require a high-glucose metabolism. 17 However, most of the mucinous pancreatic lesions are not malignant.14,18,19
CEA is currently the gold standard marker for mucinous cysts diagnosis, however, according to the meta-analysis by Thornton et al. 20 CEA demonstrated a sensitivity of 63% and specificity of 88% for differentiating mucinous cysts at a cutoff of 192 ng/mL. Our analysis demonstrated that cyst fluid glucose, using the cutoff level of 87 mg/dL, was significantly more sensitive and accurate in diagnosing mucinous cysts compared to cyst fluid CEA (the specificity could not be compared due to a statistical limitation). Furthermore, CEA measurement requires specific laboratory capabilities that are costly and time-consuming. Another drawback of CEA is the significant volume of PCF (at least 200 μL) needed for analysis, precluding measurement in small PCF samples, which are frequently collected during the procedure.6,21,22 However, the necessary volume for glucose measurements using an on-site glucometer is 2–4 μL, which is more feasible in small cysts. Furthermore, CEA measurement average price per test is estimated as $119, 23 although the actual cost of the materials for each measurement is low (approximately $2.65), 9 but still higher than the estimated average cost per testing strip by a glucometry ($0.98). 24
In addition, our study validates glucometry glucose measurement against reference laboratory biochemical analysis (considered as the gold standard test) when drawn from a PCL. Consistent with the study by Noia et al., 13 our analysis also demonstrated an excellent ICC and a comparable sensitivity and specificity calculated by both methods.
The strengths of our study include the use of a non-selected derivation cohort and a confirmatory validation cohort. To our knowledge, most previous studies did not use exclusively EUS-FNA obtained PCF samples but used mostly selected sample of patients referred for surgery. Our study cohort reflects the daily clinical practice of PCL assessment for various indications – mostly incidental, asymptomatic, or low-risk lesions, which also constitutes a major limitation of the study: only 3% of the patients underwent surgery thus limiting the availability of histology. Ideally histology should be taken as the gold standard, which can be obtained either through the needle Micro-forceps, a biopsy of the cyst wall after aspiration or surgical resection. However, this is not recommended as part of the routine evaluation of pancreatic cysts with no high-risk features. This could introduce some subjectivity in the study. Furthermore, the study is a single-center study limiting its generalization across other centers, and therefore translation of our results across other centers should be performed with caution. Medical history of diabetes mellitus, as well as simultaneous fasting blood glucose levels, was not available in the current study. This could have some potential of confounding pancreatic cystic glucose levels. The prevalence of mucinous cysts in our study cohort is relatively higher than previous studies with 76% mucinous cysts, while the average prevalence according to a recent meta-analysis is about 60%. 15 The lower prevalence of non-mucinous cysts in our study cohort is most likely the result of a low neoplastic potential of the non-mucinous cysts according to clinical, radiological, and sonographic features, which usually do not require further analysis by EUS-FNA. The following characteristic can on one hand suggest more realistic glucose range and cutoff level for mucinous cysts, and on the other hand might suggest misclassification of mucinous cysts. However, as presented in Figure 2, the glucose measurements for mucinous cysts are scattered mostly in the lower range of the glucose, excluding few isolated measurements. It is also possible that subcategorization of the cysts would have eliminated this effect; unfortunately, the numbers of some of the cyst subtypes in our study were too low in order to provide a meaningful interpretation; however, this was not the aim of the study.
In conclusion, our study demonstrates that cyst fluid glucose performs better than CEA in differentiating mucinous from non-mucinous PCLs. On-site glucometry of PCFs obtained by EUS-FNA was found feasible, accurate, and reproducible method. Further large-scale studies are needed in order to embrace cyst fluid glucose for routine use in the differential diagnoses of PCLs.
Supplemental Material
sj-docx-1-tag-10.1177_17562848221133581 – Supplemental material for Pancreatic cyst fluid glucose: a rapid on-site diagnostic test for mucinous cysts
Supplemental material, sj-docx-1-tag-10.1177_17562848221133581 for Pancreatic cyst fluid glucose: a rapid on-site diagnostic test for mucinous cysts by Efrat Zamir, Dana Zelnik Yovel, Erez Scapa, Mati Shnell, Nir Bar, Iddo Bar Yishay, Tomer Ziv-Baran, Fadi Younis, Adam Phillips, Nir Lubezky, Oren Shibolet and Dana Ben-Ami Shor in Therapeutic Advances in Gastroenterology
Footnotes
References
Supplementary Material
Please find the following supplemental material available below.
For Open Access articles published under a Creative Commons License, all supplemental material carries the same license as the article it is associated with.
For non-Open Access articles published, all supplemental material carries a non-exclusive license, and permission requests for re-use of supplemental material or any part of supplemental material shall be sent directly to the copyright owner as specified in the copyright notice associated with the article.