
Abstract
Background:
Transient tumor marker elevations caused by chemotherapy were defined as ‘Flare’ and have been demonstrated in some solid tumors. In clinical practice, we observed that some patients were accompanied by elevated tumor markers during treatment, but subsequent imaging proved that the treatment they received was effective.
Objectives:
We aimed to study the Flare and the prognosis in advanced gastric cancer.
Design:
This is an observational retrospective study. A total of 167 patients were enrolled in this study. Carcinoembryonic antigen (CEA), carbohydrate antigen (CA) 19-9 and CA125 values were obtained before the first, second, third, fourth, fifth and sixth cycles of treatment, respectively.
Methods:
Imaging for the first efficacy assessment was reviewed according to the Response Evaluation Criteria in Solid Tumors 1.1 (RECIST 1.1) criteria. Kaplan–Meier analyses and log-rank tests were performed for overall survival (OS) analyses. Univariate and multivariate Cox analyses were used to determine the prognostic factor for OS and progression-free survival (PFS).
Results:
37.1% of patients were accompanied with at least one tumor marker Flare during the course of treatment. The median time to tumor marker peak was 24–30 days and the Flare duration lasted 49–53 days. Patients with tumor markers Flare had a worse OS. Flare may be associated with the use of 5-fluorouracil. Baseline CEA and CA125 levels were the independent prognostic factors for OS and baseline CA125 level was the independent prognostic factor for PFS.
Conclusion:
Initial elevation of tumor markers during treatment is not an indication of tumor progression. Patients with tumor markers ‘Flare’ may had a worse OS.
Introduction
The Response Evaluation Criteria in Solid Tumors 1.1 (RECIST 1.1) criteria more applicable to cytotoxic agents 1 was an attempt to assess the chemotherapeutic efficacy. According to RECIST 1.1 criteria, radiology remains the optimal recommendation for evaluating the efficacy of gastric cancer chemotherapy. However, especially in patients with only bone or peritoneal metastases, radiology is insensitive to evaluate the efficacy of the primary lesion of gastric cancer. Although the changes in iodine concentration on spectral computed tomography (CT) 2 or tumor volume on CT 3 may be able to predict the pathological response of gastric primary lesion, it has not been extensively validated. Previous studies have demonstrated that carcinoembryonic antigen (CEA), CA125 and CA19-9 can improve the accuracy of the diagnosis of gastric cancer and have prognostic significance.4–6 Furthermore, tumor markers have been shown to be valuable in predicting the efficacy of chemotherapy considering the convenience.7,8 Tumor markers often show three types of changes during the treatment process: decreasing, increasing and normal. The viewpoint that an increasing tumor marker as a predictor of disease progression and a decreasing tumor marker as a predictor of disease control is generally accepted. In clinical practice, however, we observed that the majority of patients with elevated tumor markers during the initial treatment did not indicate clinical disease progression. This phenomenon in other solid tumors has been demonstrated and has been named the ‘Flare or Surge’.9–19 Sikander Ailawadhi et al. defined CEA Flare as ‘an increase of >20% from baseline followed by a >20% drop in one or more subsequent CEA levels compared to baseline’ 9 . However, the elevated values of other tumor markers Flare compared to baseline were not clearly defined. Elevated tumor markers due to Flare were not the symbol of treatment failure in either prostate cancer or metastatic colorectal cancer.10,11,14,17 Therefore, the existence of Flare may lead us to make erroneous judgments about the efficacy of the treatment.
In gastric cancer, tumor marker Flare has also been reported in the literature. 20 However, studies on the ‘Flare’ of carbohydrate antigen 125 (CA125) in gastric cancer are rare and the prognosis for patients with ‘Flare’ is unknown. This article takes a deeper look at the value of tumor markers Flare in predicting chemotherapeutic efficacy, and the relationship between ‘Flare’ and prognosis in gastric cancer.
Patients and methods
This retrospective study included 167 eligible patients at Cancer Center, Union Hospital, Tongji Medical College, Huazhong University of Science and Technology between June 2017 and May 2021 (Supplemental Figure 1). CEA, CA19-9 and CA125 values in peripheral blood were collected before the first, second, third, fourth, fifth and sixth cycles of treatment, respectively. The recommended cutoff levels of serum CEA, CA19-9 and CA125 were 5, 37 and 35 U/mL, respectively. Treatment response was assessed radiologically (CT/magnetic resonance imaging) according to RECIST 1.1 criteria.
Flare phenomenon was defined as a tumor marker (CEA, CA19-9 or CA125) initially increased from baseline and then declined during first-line treatment of gastric cancer. Positive tumor marker referred to tumor marker with a value of greater than or equal to recommended cutoff value. Negative tumor marker referred to tumor marker with a value of less than recommended cutoff value. Overall survival (OS) was calculated as the time from diagnosis to the date of any cause of death and progression-free survival (PFS) was calculated as the time from diagnosis to the date of identification of disease progressive.
Survival curves of different groups were estimated and compared by Kaplan–Meier method and log-rank test using Medcalc software at a significance level of p < 0.05. Categorical variables were compared using χ2 and Fisher’s exact tests in IBM SPSS 26.0 version. Univariate and multivariate Cox model analyses were used to identify independent prognostic factors affecting OS and PFS among numerous clinical factors. To analyze independent prognostic factors, univariate Cox regression analysis was first performed with each variable and variables with p value <0.2 were selected. Multivariate Cox regression analysis using enter selection was performed, and the independent prognostic variables of OS and PFS were then determined. The reporting of this study conforms to the STROBE statement.
Results
Patient clinical features
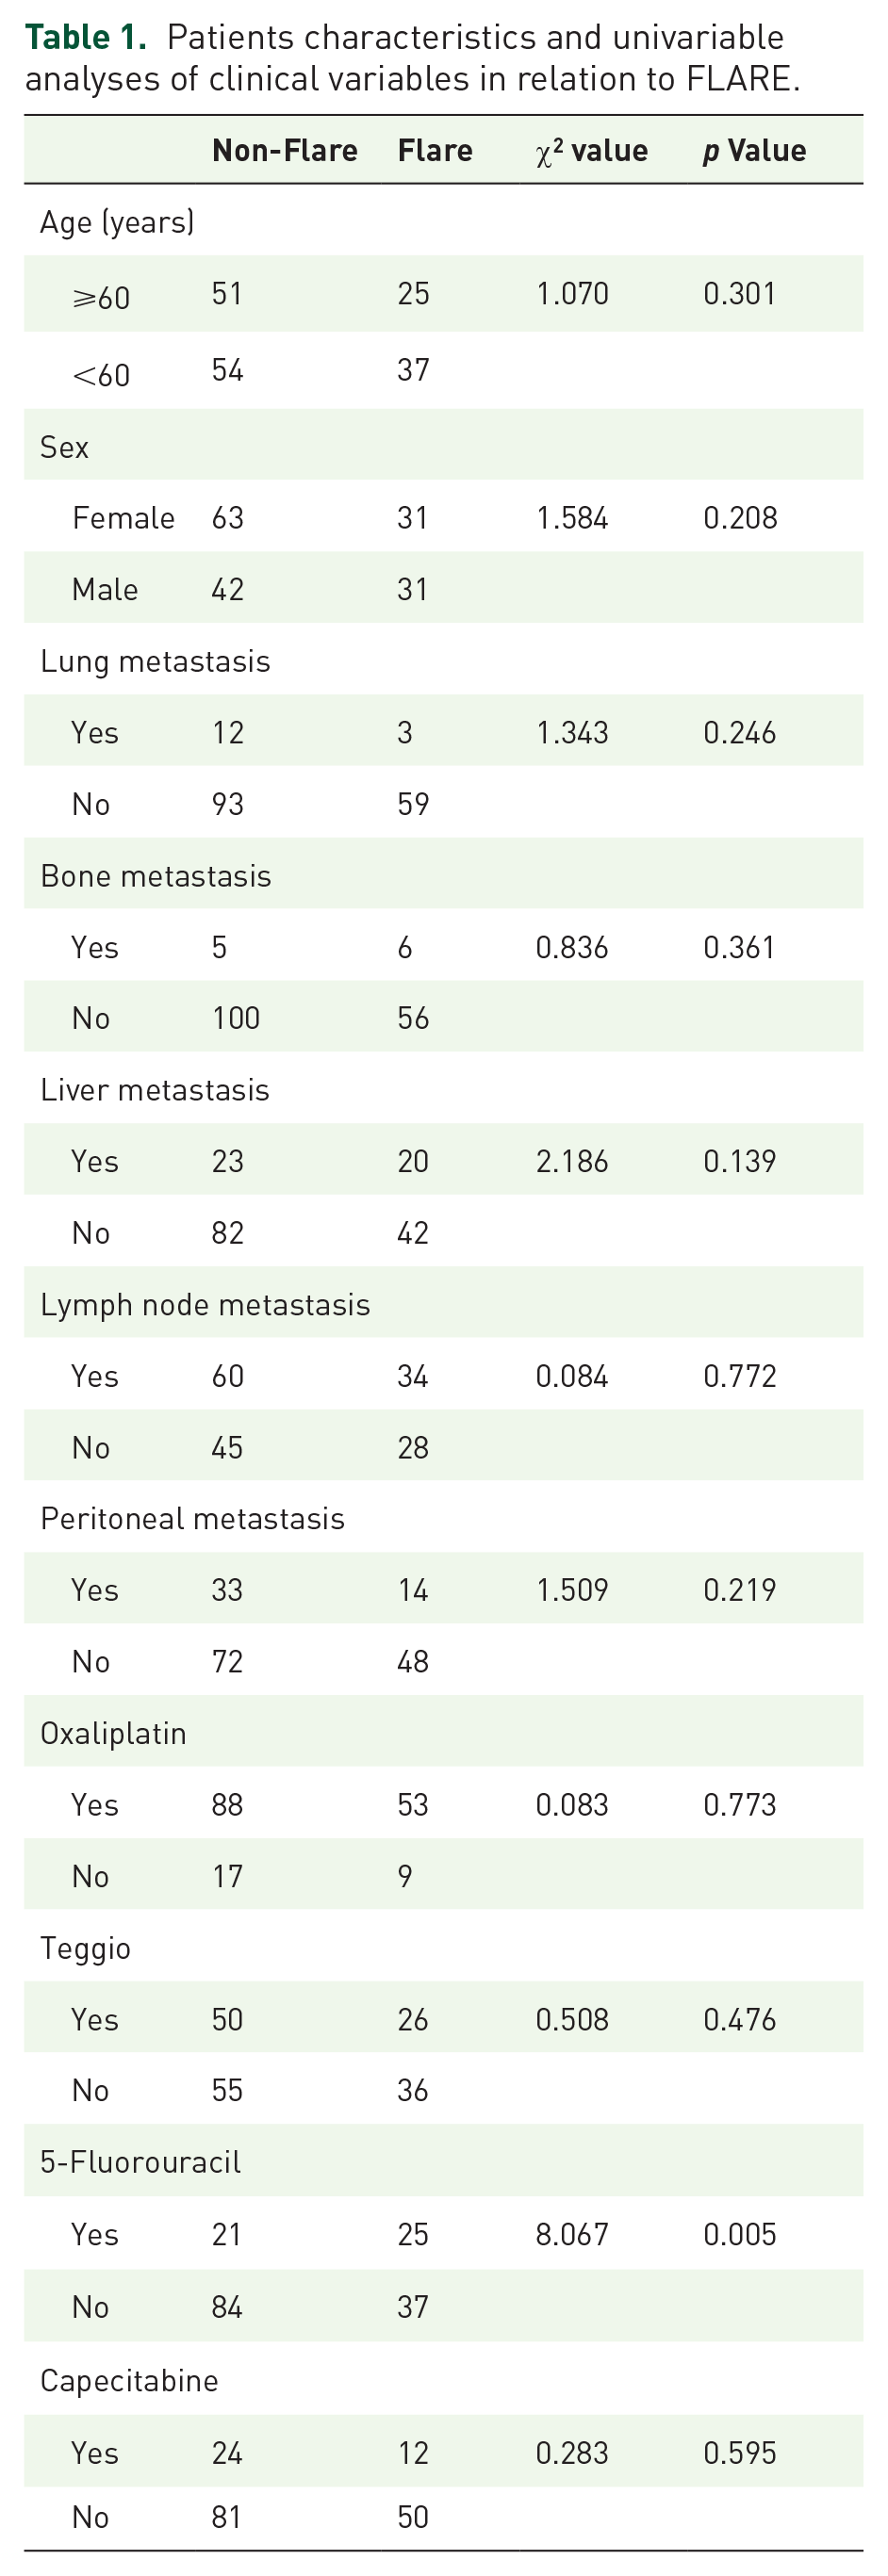
The median follow-up was 14.9 [95% confidence interval (CI): 13.2–16.6] months. The average age of 167 patients was 56.6 years. In all, 73 patients were males and 94 were females. Lung, bone, liver, lymph nodes and peritoneal metastases accounted for 9.0% (15/167), 6.6% (11/167), 25.7% (43/167), 56.3% (94/167) and 28.1% (47/167), respectively. Treatment regimens containing oxaliplatin, Teggio, 5-fluorouracil and capecitabine in ratios of 84.4% (141/167), 45.5% (76/167), 27.5% (46/167) and 21.6% (36/167), respectively (Table 1).
Patients characteristics and univariable analyses of clinical variables in relation to FLARE.
Changes in tumor markers during first-line treatment
Clinically, we always pay more attention to positive tumor markers. Therefore, we defined the changes of tumor markers in patients with negative CEA, CA19-9 and CA125 as normal tumor markers. Patients with at least one tumor marker positive was divided into five categories (regardless of negative tumor markers): (1) decrease; (2) increase; (3) increase after decrease; (4) FLARE: ‘Flare’ exists in at least one tumor marker, whether or not accompanied with (1)–(3); and (5) Other: it cannot be classified as any of the above. Our study suggests that during the first-line treatment, 21% (35/167) of patients are negative for three tumor markers, 30.5% (51/167) of patients have a continuous decrease in tumor markers, 4.8% (8/167) of patients have a progressive upward trend in tumor markers and 37.1% (62/167) of patients are accompanied with the ‘Flare’ of at least one tumor marker. There were 70 patients with elevated tumor markers after treatment, and 88.6% (62/70) of them were caused by ‘Flare’ and the other eight patients were due to disease progression (Supplemental Figure 2).
Relationship between changes in tumor markers and response to systemic therapy
Among the 51 patients with continuous decrease of tumor markers, the overall response to treatment was 94.1% (48/51) [standard deviation (SD): 52.9%, 27/51; partial remission (PR): 41.2%, 21/51]. Of the 62 patients with ‘Flare’, 93.5% (58/62) could benefit from the treatment (SD: 67.7%, 42/62; PR: 25.8%, 16/62). All eight patients (100%) with continuous increase of tumor markers had radiographic evidence of ineffective treatment (Supplemental Figure 2).
CEA Flare
In the biweekly regimen, the peak of CEA Flare occurred before the second and third cycles in 57.14% and 42.86% of the patients, respectively. In the triweekly therapy, the peak of CEA Flare occurred before the second and third cycles in 85% and 15% of the patients, respectively. The Flare peak of CEA emerged at a median of 30 (95% CI: 27–34) days from the beginning of treatment. The Flare duration was 53 (95% CI: 48–58) days (Tables 2 and 3).
The relationship between the timing of CEA, CA199 and CA125 Flare peaks and therapeutic schedule.

2w, biweekly treatment; 3w, triweekly treatment; CA, carbohydrate antigen; CEA, carcinoembryonic antigen; Pre-C2, before the second cycle of treatment; Pre-C3, before the third cycle of treatment; Pre-C4, before the fourth cycle of treatment.
The median time of peak and duration of CEA, CA19-9 and CA125 Flare.

CA, carbohydrate antigen; CEA, carcinoembryonic antigen; CI, confidence interval.
CA125 Flare
The majority of the peaks in CA125 Flare appeared before the second cycle for both biweekly (75%) and triweekly treatment (87.5%). The emergence of the CA125 Flare median time was 24 (95% CI: 21–32) days and the CA125 Flare lasted a median 52 (95% CI: 42–58) days (Tables 2 and 3).
CA19-9 Flare
Similar to CEA and CA125, CA19-9 Flare was most frequently observed before the second cycle of treatment, with only one patient having a Flare peak before the fourth cycle. The median time to peak and duration of CA19-9 Flare was 24 (95% CI: 21–32) days and 49 (95% CI: 37–54) days, respectively (Tables 2 and 3).
Influencing factors of ‘Flare’
Using χ2 test, the associations in age, gender, lung, bone, liver, lymph node or peritoneal metastasis in the ‘Flare’ group versus the ‘Non-Flare’ group were not be observed. There were no significant differences in the use of Teggio, oxaliplatin or capecitabine between ‘Flare’ group and the ‘Non-Flare’ group. However, the use of 5-fluorouracil was associated with ‘Flare’ (p = 0.004) (Table 1).
‘Flare’ and prognosis
For the total cohort, the median OS and PFS were 16.4 (95% CI: 14.4–18.4) months and 8.1 (95% CI: 6.7–9.4) months, respectively. Furthermore, the absence or presence of any of the tumor markers Flare in CEA, CA19-9 and CA125 was associated with OS [17.9 versus 12.1 months, p = 0.0238, hazard ratio (HR): 0.58, 95% CI: 0.36–0.94]. Although there was a benefit in PFS for patients without FLARE, there was no statistically significant differences (8.9 versus 7.1 months, p = 0.2038).
In addition, we analyzed the three tumor markers separately and excluded the interference of the other two tumor markers Flare. For CEA and CA125, the occurrence of ‘Flare’ was associated with reduced OS (CEA: 17.9 versus 8.4 months, p = 0.0411, HR: 0.44, 95% CI: 0.20–0.99; CA125: 17.9 versus 11.6 months, p = 0.0297, HR, 0.49, 95% CI: 0.26–0.95). No differences in PFS between patients with ‘Flare’ and without ‘Flare’ were observed. There were no significant differences between OS/PFS and ‘Flare’ for CA19-9 (Figure 1).

Kaplan–Meier analysis of OS and PFS of the patients in the ‘Non-Flare’ group versus the ‘Flare’ group.
Prognostic factors associated with OS and PFS
Survival analyses of the total cohort were performed for the following 10 criteria: (1) Flare, (2) Age, (3) Sex, (4) Lung metastasis, (5) Bone metastasis, (6) Liver metastasis, (7) Lymph node metastasis, (8) Baseline CEA, (9) Baseline CA19-9, (10) Baseline CA125. Univariate Cox regression showed that three variables (Flare, baseline CEA level ⩾5 ng/mL and baseline CA125 level ⩾35 U/mL) were significant prognostic factors for OS; one variable (baseline CA125 level ⩾35 U/mL) was significant prognostic factor for PFS. Multivariate Cox regression using enter regression techniques was performed with the variables (p < 0.2) that showed that baseline CEA level ⩾5 ng/mL (HR: 0.912, 95% CI: 0.561–1.483) and baseline CA125 level ⩾35 U/mL (HR: 1.714, 95% CI: 1.055–2.783) were selected as the independent factor for OS and baseline CA125 level ⩾35 U/mL (HR: 1.726, 95% CI: 1.170–2.548) was chosen as the independent factor for PFS (Table 4).
Univariate and multivariate cox model analyses of clinicopathological characteristics for OS and PFS (all patients).

CA, carbohydrate antigen; CEA, carcinoembryonic antigen; CI, confidence interval; HR, hazard ratio; OS, overall survival; PFS, progression-free survival.
Survival analyses of the Flare cohort were performed for the following nine criteria: (1) Age, (2) Sex, (3) Lung metastasis, (4) Bone metastasis, (5) Liver metastasis, (6) Lymph node metastasis, (7) Baseline CEA, (8) Baseline CA19-9 and (9) Baseline CA125. Univariate Cox regression and multivariate Cox regression showed that none of the nine included variables was a significant prognostic factor for OS. Baseline CA125 level ⩾35 U/mL (HR: 2.243, 95% CI: 1.106–4.547) was significant prognostic factors for PFS. However, multivariate Cox regression could not be performed due to the lack of sufficient significant variables (Supplemental Table 1).
Discussion
It is commonly believed that there is a consistency between the elevation of tumor markers and disease progression during chemotherapy. However, this viewpoint is untenable in some solid tumors due to the ‘Flare’. 11.1–15% of patients with advanced colorectal cancer will develop CEA surge during chemotherapy,9,12,14,17 three of these studies analyzed the relationship between Flare and chemotherapy efficacy and showed that 100% CEA Flare patients had radiological confirmation of disease control. In prostate cancer, chemotherapy caused prostate-specific antigen (PSA) Flare in 11–18% of patients,7,8,12,21 and in Avishay Sella’s study, 87.5% of the patients who presented with PSA Flare were able to benefit from chemotherapy. This suggested that the presence of Flare did not mean therapeutic failure, on the contrary, most patients can benefit from chemotherapy. Ineffective treatment is not only a waste of resources, but also bring irreversible physical damage to patients, so it is extremely important to properly assess the effectiveness of treatment. In this study, 37.1% of patients could be seen to have at least one tumor marker surge and of these patients, approximately 90% were confirmed to have a clinical response. The median time to tumor marker peak was 24–30 days (CEA: 30 days, CA19-9: 24 days, CA125: 28 days) and the surge duration lasted 49–53 days (CEA: 53 days, CA19-9: 49 days, CA125: 52 days). In addition, 57.1–87.5% of tumor markers surge occurred before the second cycle treatment. Therefore, we should be cautious about the initial elevation of tumor markers during first-line chemotherapy for gastric cancer, especially for patients receiving biweekly regimens.
It is reported that depression and anxiety were detected in 24.5 and 27.7% of gastric patients, respectively. 22 Unfortunately, the quality of life of anxious patients is inferior to that of anxious-free patients. 23 Likewise, negative emotions such as depression can lead to poor prognosis and decreased compliance in cancer patients. 24 Most patients have a weak understanding of the ‘Flare’ and often deem that elevated tumor markers are equivalent to ineffective treatment, which will exacerbate the level of patient distress and increase the prevalence of anxiety. Therefore, helping patients to correctly recognize the initial elevation of tumor markers during chemotherapy can inhibit the growth of adverse emotions in patients.
In prostate cancer, there was no statistical difference in OS between the Flare and non-Flare groups.10,11,15 CEA Flare was a favorable prognostic factor, and the CEA Flare group had better OS (median 17.7 months versus 10.9 months), PFS (median 8.3 months versus 3.1 months) and ORR (73% versus 11%) compared to the CEA elevated group in advanced colorectal cancer. 12 However, alpha fetoprotein (AFP) Flare is an adverse prognostic factor for patients with non-seminomatous testicular cancer 13 . In this study, patients with tumor markers surge had a worse OS (median OS: 17.9 months versus 12.1 months, p = 0.0238). Although patients with tumor markers surge had a worse PFS, there was no statistical difference. For the total cohort, baseline CEA and CA125 levels were the independent prognostic factors for OS and baseline CA125 level was the independent prognostic factor for PFS. We tried to explore the reasons for the appearance of tumor markers surge, but ultimately found that it was independent of age, sex and metastases in lung, bone, liver, lymph nodes or peritoneum. We conjecture that ‘Flare’ may be related to tumor burden, but we were unable to verify this conjecture due to the limitations of measuring the overall tumor burden of the patients. In patients with advanced colorectal cancer who develop CEA Flare, 70% receive oxaliplatin-based regimens and 99% receive fluoropyrimidine-based regimens. 12 In addition to this, irinotecan can also cause CEA Flare. 14 In our cohort, tumor marker Flare was triggered by the use of 5-fluorouracil in gastric cancer patients, whereas oxaliplatin, Teggio and captabine did not. 5-Fluorouracil induced the expression of CEA mRNA which may be the reason of CEA Flare.25,26
With the announcement of CheckMate-649 clinical trial result, immune checkpoint inhibitors have made a new breakthrough in gastric cancer, bringing new hope to more gastric cancer patients. 27 In the National Comprehensive Cancer Network guidelines, nivolumab plus chemotherapy is recommended as the optimal first-line therapy for patients with gastric cancer with programmed death ligand-1 combined positivity score ⩾5. Due to the scarcity of samples of patients receiving immunotherapy in first-line treatment, however, we did not verify the ‘Flare’ separately in this cohort. Nevertheless, the significance of Flare phenomenon in immunotherapy deserves further study.
Conclusion
In conclusion, our study shown that initial elevation of tumor markers during first-line treatment in gastric cancer is not an indication of tumor progression. Elevation of the initial tumor marker cannot be used as evidence for a change in treatment regimen. At the same time, patients with the tumor marker Flare had a worse OS.
Supplemental Material
sj-docx-3-tag-10.1177_17562848221124029 – Supplemental material for ‘FLARE’ of tumor marker in advanced gastric cancer treated with first-line systemic therapy
Supplemental material, sj-docx-3-tag-10.1177_17562848221124029 for ‘FLARE’ of tumor marker in advanced gastric cancer treated with first-line systemic therapy by Fangyuan Zhang, Menglan Zhai, Jinru Yang, Lei Zhao, Zhenyu Lin, Jing Wang, Tao Zhang and Dandan Yu in Therapeutic Advances in Gastroenterology
Supplemental Material
sj-pptx-1-tag-10.1177_17562848221124029 – Supplemental material for ‘FLARE’ of tumor marker in advanced gastric cancer treated with first-line systemic therapy
Supplemental material, sj-pptx-1-tag-10.1177_17562848221124029 for ‘FLARE’ of tumor marker in advanced gastric cancer treated with first-line systemic therapy by Fangyuan Zhang, Menglan Zhai, Jinru Yang, Lei Zhao, Zhenyu Lin, Jing Wang, Tao Zhang and Dandan Yu in Therapeutic Advances in Gastroenterology
Supplemental Material
sj-pptx-2-tag-10.1177_17562848221124029 – Supplemental material for ‘FLARE’ of tumor marker in advanced gastric cancer treated with first-line systemic therapy
Supplemental material, sj-pptx-2-tag-10.1177_17562848221124029 for ‘FLARE’ of tumor marker in advanced gastric cancer treated with first-line systemic therapy by Fangyuan Zhang, Menglan Zhai, Jinru Yang, Lei Zhao, Zhenyu Lin, Jing Wang, Tao Zhang and Dandan Yu in Therapeutic Advances in Gastroenterology
Footnotes
References
Supplementary Material
Please find the following supplemental material available below.
For Open Access articles published under a Creative Commons License, all supplemental material carries the same license as the article it is associated with.
For non-Open Access articles published, all supplemental material carries a non-exclusive license, and permission requests for re-use of supplemental material or any part of supplemental material shall be sent directly to the copyright owner as specified in the copyright notice associated with the article.