
Abstract
Introduction:
Tofacitinib is an oral, small molecule Janus kinase inhibitor for the treatment of ulcerative colitis (UC). Outcome prediction based on early treatment response, along with clinical and laboratory variables, would be very useful for clinical practice. The aim of this study was to determine early variables predictive of responder status in patients with UC treated with tofacitinib.
Methods:
Data were collected from patients treated with tofacitinib 10 mg twice daily in the OCTAVE Induction 1 and 2 studies (NCT01465763 and NCT01458951). Logistic regression and random forest analyses were performed to determine the power of clinical and/or laboratory variables to predict 2- and 3-point partial Mayo score responder status of patients at Weeks 4 or 8 after baseline.
Results:
From a complete list of variables measured in OCTAVE Induction 1 and 2, analyses identified partial Mayo score, partial Mayo subscore (stool frequency, rectal bleeding, and Physician Global Assessment), cholesterol level, and C-reactive protein level as sufficient variables to predict responder status. Using these variables at baseline and Week 2 predicted responder status at Week 4 with 84–87% accuracy and Week 8 with 74–79% accuracy. Variables at baseline, Weeks 2 and 4 could predict responder status at Week 8 with 85–87% accuracy.
Conclusion:
Using a limited set of time-dependent variables, statistical and machine learning models enabled early and clinically meaningful predictions of tofacitinib treatment outcomes in patients with moderately to severely active UC.
Introduction
Ulcerative colitis (UC) is a chronic inflammatory disease of the colon and rectum characterized by recurrent periods of relapsing and remitting symptoms that can cause significant disease burden.1–4 Although UC was previously more predominant in developed countries, the prevalence is growing worldwide. 5 Given the diversity of patients and the growing and wide range of treatment options in UC,5,6 there is interest in identifying ways to more effectively and efficiently predict which patients will respond to treatment, such that ineffective therapies can be avoided and rapid improvements can be achieved. 7 There is also a need for precision medicine in UC, where an individual patient’s biology and disease pathophysiology are taken into account when making treatment decisions. 8
Tofacitinib is an oral, small molecule Janus kinase inhibitor for the treatment of UC. Tofacitinib treatment has been shown to result in significantly improved outcomes versus placebo in two 8-week induction studies (OCTAVE Induction 1 and 2 (NCT01465763 and NCT01458951, respectively)) and a 52-week maintenance study (OCTAVE Sustain (NCT01458574)) in patients with moderately to severely active UC.9,10
The Mayo score is a combination of four physician- and patient-reported outcomes (stool frequency, rectal bleeding, endoscopic appearance, and Physician Global Assessment) that measure UC disease activity, and is widely used in clinical trials. 11 A non-invasive partial Mayo score does not include endoscopic appearance, and ranges from 0 to 9 with a score of 9 indicating the most severe disease activity. 11
Many clinical trials use a decrease of 2 points in the partial Mayo score as a marker for clinical response;9,10,12–14 however, it has been suggested that larger decreases may be more indicative of a substantial patient-reported improvement in UC. 11
This post hoc analysis focuses on utilizing traditional statistical methods, as well as machine learning techniques, to create models able to predict the outcomes of tofacitinib-treated patients with UC. The models described herein use data from various time points of the OCTAVE Induction 1 and 2 studies. The overall objective of this research was to determine if early treatment response, and any clinical or laboratory variables, could predict partial Mayo score responder status (defined as either a 2- or 3-point reduction in partial Mayo score) at Weeks 4 and 8 after tofacitinib induction therapy in patients with moderately to severely active UC.
Methods
Patients and study design
Full details of OCTAVE Induction 1 and 2 study design, inclusion and exclusion criteria, and patient demographics and disease characteristics have been extensively described previously.9,10 Demographics and baseline disease characteristics relevant to the current analysis are shown in Supplemental Table S1. Briefly, patients with moderately to severely active UC were randomized to receive tofacitinib 10 mg twice daily (b.i.d.) or placebo, with final efficacy assessment at Week 8. Patients were required to have failed or be intolerant to corticosteroids, immunosuppressants, or tumor necrosis factor inhibitors. Patients could remain on stable doses of concomitant 5-aminosalicylates and oral corticosteroids but were not allowed to use concomitant tumor necrosis factor inhibitors, azathioprine, methotrexate, or 6-mercaptopurines. Patients in the intent-to-treat population who received tofacitinib 10 mg b.i.d. in OCTAVE Induction 1 and 2 were included in this analysis.
The study protocols were approved by the Institutional Review Board or independent ethics committee for each participating center. Written informed consent was obtained from all patients, per the ethics committee-approved protocols. All studies were conducted in compliance with the ethical principles derived from the Declaration of Helsinki and in compliance with all International Conference on Harmonization Good Clinical Practice Guidelines.
Outcomes and models
Definitions
Partial Mayo score: partial Mayo score was the sum of three subscores, including stool frequency (0–3), rectal bleeding (0–3), and Physician Global Assessment (0–3), where partial Mayo scores of 0–1 indicated remission and scores of 7–9 indicated severe disease.
Responder: a decrease of ⩾2 points from baseline in partial Mayo score was an exploratory endpoint in OCTAVE Induction 1 and 2; 10 however, it has previously been postulated that clinical response may be best defined as a ⩾3-point decrease from baseline in partial Mayo score. 11 Therefore, in this analysis, two definitions of responder status were tested: a decrease of 2 or 3 points from baseline in partial Mayo score.
Monotonicity: monotonicity measured the consistency of decreasing or increasing trends in partial Mayo score and ranged from –1 to 1, where –1 indicated that the partial Mayo score had a linearly decreasing trend, and 1 indicated that the partial Mayo score had a linearly increasing trend.
Path length: path length measured the extent that the partial Mayo score fluctuated over time. The smaller the path length, the more stable the partial Mayo score (with a minimum value of 0, indicating an unchanging partial Mayo score).
Random forest: random forest model was a machine learning algorithm that utilized a set of decision trees. Random forest models were defined by the number of trees and the number of variables randomly chosen for each tree.
Analyses
Objectives: analyses were performed to identify variables capable of predicting responder status (clinical response according to the definition of either a 2- or 3-point decrease in partial Mayo score) at Week 8 using data from baseline, Week 2, and Week 4. Identical analyses were also used to identify variables capable of predicting responder status at Weeks 4 or 8 using data from baseline and Week 2.
Selection of variables: the full set of variables initially explored is shown in Supplemental Table S2. With the full set of variables, a forward selection was used for logistic regression, starting from an intercept-only model and adding one significant variable at a time until no significant variables met the significance level to enter the model. From these iterative results, a reduced set of variables with the highest predictive value for responder status was identified. Table 1 shows the measures and corresponding time points from which the variables used in the models were derived. Of note, prior or concomitant use of steroids and previous use of tumor necrosis factor inhibitor therapies were not identified as significant predictive factors for partial Mayo score responder status at Week 8.
Reduced list of variables incorporated into the final models.
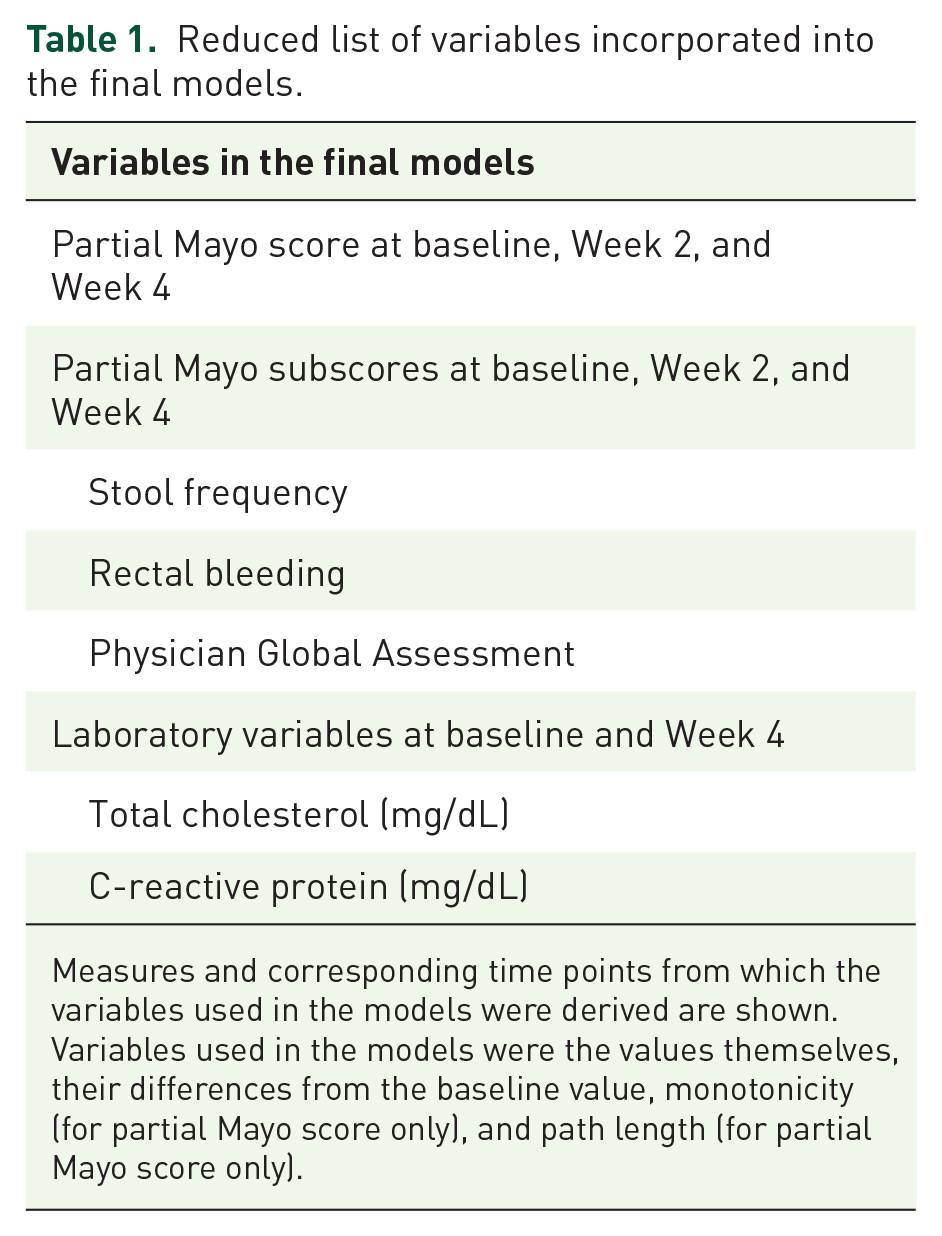
Measures and corresponding time points from which the variables used in the models were derived are shown. Variables used in the models were the values themselves, their differences from the baseline value, monotonicity (for partial Mayo score only), and path length (for partial Mayo score only).
Summary of all AUROC values from logistic regression and random forest analyses using the reduced list of variables and a training/testing split dataset or a cross-validation protocol to predict either 2- or 3-point partial Mayo score responder status at Weeks 4 or 8.

AUROC, area under the receiver operating characteristic curve.
Data shown are AUROC values. Responses were defined as either a 2- or 3-point reduction in partial Mayo score. Analyses were performed using the variables derived as shown in Table 1.
Using the same logistic regression technique, as well as random forest models, differences in partial Mayo score and individual subscores (stool frequency, rectal bleeding, and Physician Global Assessment) from baseline to Weeks 2 or 4, partial Mayo score path length and monotonicity, and differences in laboratory values from baseline to Week 4, were analyzed to determine how well they could predict responder status. Area under the receiver operating characteristic curve (AUROC) values were used to determine the predictive power of the models, and odds ratios (ORs) and 95% confidence intervals (CIs) for variables were calculated as a result of the regression modeling.
For each analysis performed, patients who had missing values in at least one of the variables used in that model were excluded from the analysis.
Random forest model: this analysis utilized a random forest model with n-fold cross-validation to improve prediction of responder status. To select the best model, a set of values for each hyperparameter (300, 500, or 1000 trees, and either 2, 3, 4, 5, 6, 7, 8, 9, 10, 11, or 12 variables randomly chosen for each tree) was defined. A model was then fit using the dataset for each combination of values. The model was fit using a repeated cross-validation approach, and a performance metric was computed for each repetition. The average value of the performance metric on all of the repetitions was associated with the combination of parameter values that defined the model. This tuning process was repeated for each possible combination of parameter values. The model with the best performance metric was chosen. The tuning process incorporated a 10-fold cross-validation (10 partitions) with 5 repetitions using each partition. The metric used to evaluate the model’s performance was the AUROC value.
K-fold cross-validation with repetitions: in addition to the above tuning process models, a k-fold cross-validation approach with repetitions was utilized in a subsequent prediction step. This entailed randomly splitting the whole dataset into k different partitions (k = 5) and iteratively considering one partition at a time in the chosen analysis. The remaining k − 1 partitions were used to predict outcomes for the patients in the omitted partition. The whole cross-validation approach was repeated three times (i.e. three repetitions). The aim of the k-fold cross-validation was to have predictions on the whole set of patients, and the aim of the repetitions was to randomly change the partition each time in order to check if results were robust. The metric used to evaluate the model’s performance was the average AUROC value over the repetitions.
Results
Patients and responders
Of the 905 patients randomized, a total of 841 patients with UC treated with tofacitinib 10 mg b.i.d. were included in the analyses. Patients who did not complete the study (N = 63) and one patient with proctitis were excluded. The response rates at Week 4 were 70% and 54.9% using a 2- and 3-point reduction in the partial Mayo score, respectively. Response rates at Week 8 were 73.8% and 61.2% using a 2- and 3-point reduction in the partial Mayo score, respectively. The actual number of patients included in the logistic regression and random forest analyses may have been slightly different due to missing values in the variables used or in the partial Mayo score. For prediction of responder status at Week 8, 24 (2.9%) and 38 (4.5%) patients had missing values from baseline to Weeks 2 and 4, respectively; therefore, data from 817 and 803 patients without missing values were included. For predictions of responder status at Week 4, 27 (3.2%) patients had missing values from baseline to Week 2; therefore, data from 814 patients without missing values were included.
A summary of AUROC values for both logistic regression and random forest analyses encompassing all testing scenarios is shown in Table 2. Similar results using the k-fold cross-validation method are shown in Table 2.
Predicting responder status at Week 8 using data at baseline, Week 2, and Week 4
Logistic regression
Logistic regression analyses were performed using the variables shown in Table 1. For predicting a 2-point responder status at Week 8, the AUROC value was 0.87 (Figure 1(a), Table 2), and significant predictors of response were change in partial Mayo score and total cholesterol levels from baseline to Week 4 (odds ratio (OR): 2.97, 95% confidence interval (CI): 2.43–3.63 and OR: 0.99, 95% CI: 0.98–1.00, respectively). The AUROC value for predicting a 3-point responder status at Week 8 was 0.87 (Figure 1(b), Table 2) with change in partial Mayo score and cholesterol levels from baseline to Week 4 being significant predictors of response (OR: 2.59, 95% CI: 2.20–3.04 and OR: 0.99, 95% CI: 0.98–1.00, respectively).
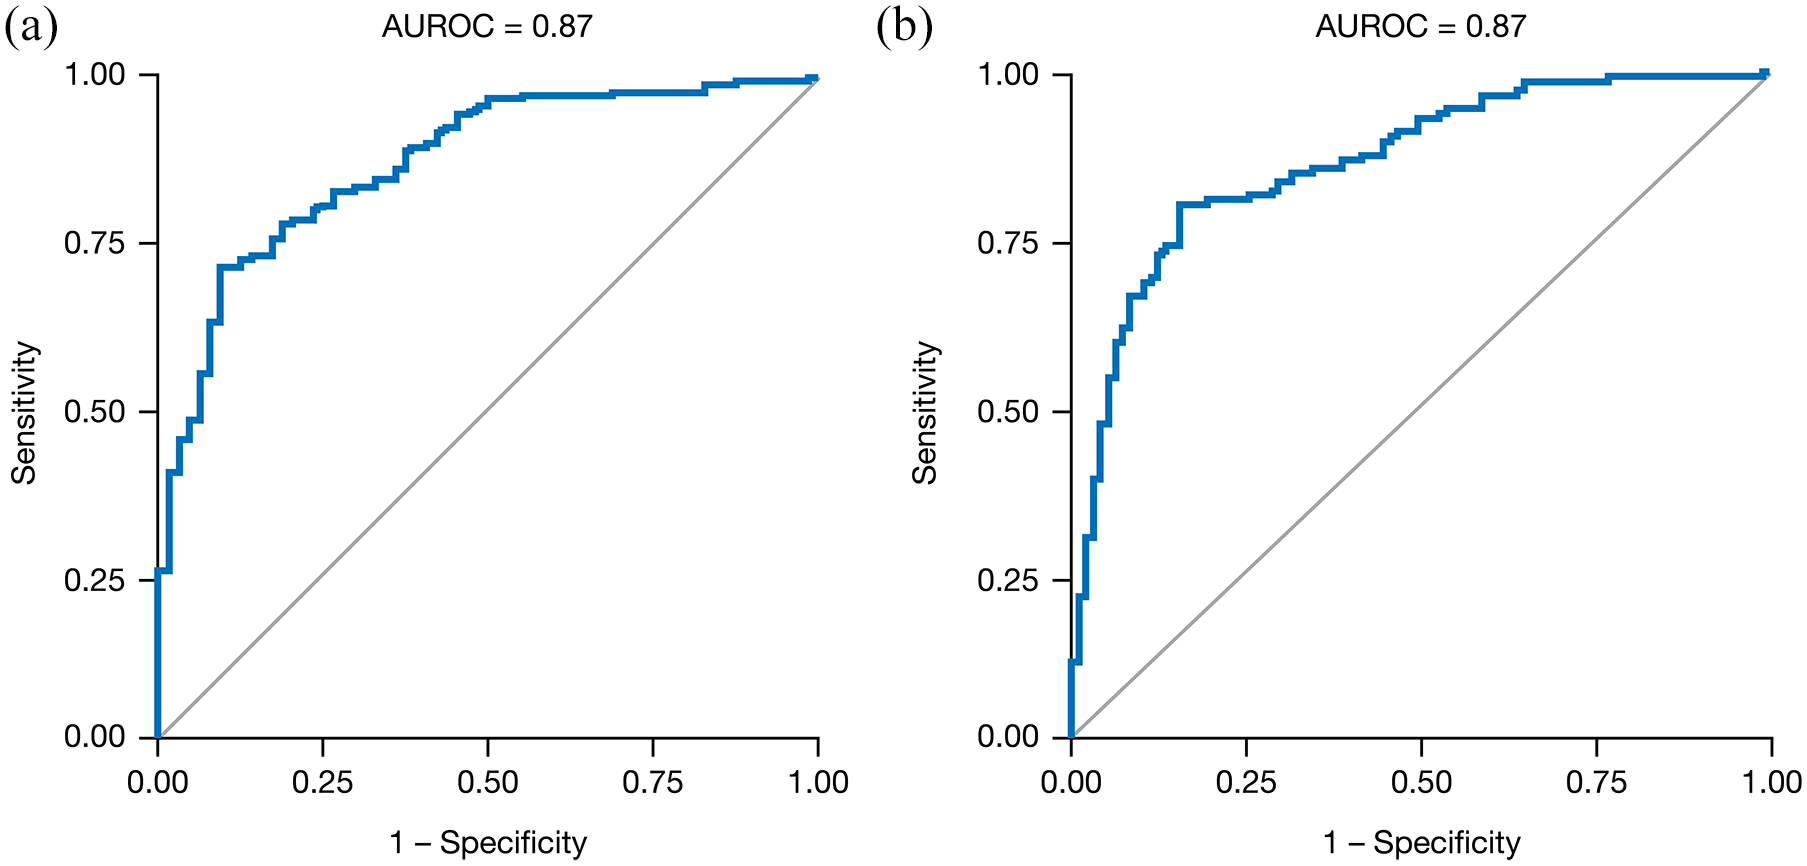
Logistic regression for the prediction of (a) 2-point and (b) 3-point responders at Week 8 using data from baseline, Week 2, and Week 4. Regressions were performed using the path length (partial Mayo score only), monotonicity (partial Mayo score only), and differences between baseline and Week 2 and/or Week 4 of the variables shown in Table 1.
Random forest
The random forest algorithm with the highest performance contained 1000 trees with two variables randomly chosen for each tree. The AUROC value for this model was 0.85 in predicting both a 2- and 3-point response at Week 8 (Table 2). The partial Mayo score difference between baseline and Week 4 and the partial Mayo score path length from baseline to Week 4 were the two most important variables in the prediction of 2- and 3-point responder status at Week 8 (Table 3).
Predictors of response at Week 8 using data from baseline, Week 2, and/or Week 4.

The variable in the first row is the one with the highest importance, and the importance of the other variables is shown as a percentage relative to the first one. Random forest analyses were performed using the path length (partial Mayo score only), monotonicity (partial Mayo score only), and differences between baseline and Week 2 and/or Week 4 of the variables shown in Table 1.
Predicting responder status at Week 8 using only data from baseline and Week 2
Logistic regression
For predicting a 2-point responder status at Week 8 using only baseline and Week 2 data, the AUROC value was 0.78 (Table 2) with change in partial Mayo score and stool frequency subscore between baseline and Week 2 as significant predictors (OR: 0.99, 95% CI: 1.50–2.16 and OR: 0.61, 95% CI: 0.46–0.82, respectively). The AUROC value for predicting a 3-point responder status at Week 8 was 0.79 (Table 2) with the difference in partial Mayo score between baseline and Week 2 as a significant predictor (OR: 2.04, 95% CI: 1.78–2.35).
Random forest
The AUROC value for this model was 0.74 in predicting a 2-point response and 0.78 in predicting a 3-point response at Week 8 (Table 2). The partial Mayo score difference between baseline and Week 2 and the partial Mayo score at Week 2 were the two most important variables in the prediction of 2- and 3-point responder status at Week 8 (Table 4).
Predictors of response at Week 8 using data from baseline and Week 2.

The variable in the first row is the one with the highest importance, and the importance of the other variables is shown as a percentage relative to the first one. Random forest analyses were performed using the values and differences between baseline and Week 2 values of the variables shown in Table 1.
Predicting responder status at Week 4 using data from baseline and Week 2
Logistic regression
For predicting a 2-point responder status at Week 4, the AUROC value was 0.86 (Table 2), with change in partial Mayo score between baseline and Week 2 (OR: 2.51, 95% CI: 2.02–3.12), stool frequency subscore at Week 2 (OR: 0.62, 95% CI: 0.46–0.84), and C-reactive protein (CRP) levels at baseline (OR: 0.99, 95% CI: 0.98–1.00) as predictors in the final model. The AUROC value for predicting a 3-point responder status at Week 4 was 0.87 (Table 2), with change in partial Mayo score and rectal bleeding subscore between baseline and Week 2 identified as significant predictors (OR: 3.37, 95% CI: 2.66–4.26 and OR: 0.63, 95% CI: 0.42–0.96, respectively).
Random forest
The AUROC value for this model was 0.84 in predicting both a 2-point response and a 3-point response at Week 4 (Table 2). The partial Mayo score difference between baseline and Week 2 was the most important variable in the prediction of 2- and 3-point responder status at Week 4 (Table 5).
Predictors of response at Week 4 using data from baseline and Week 2.
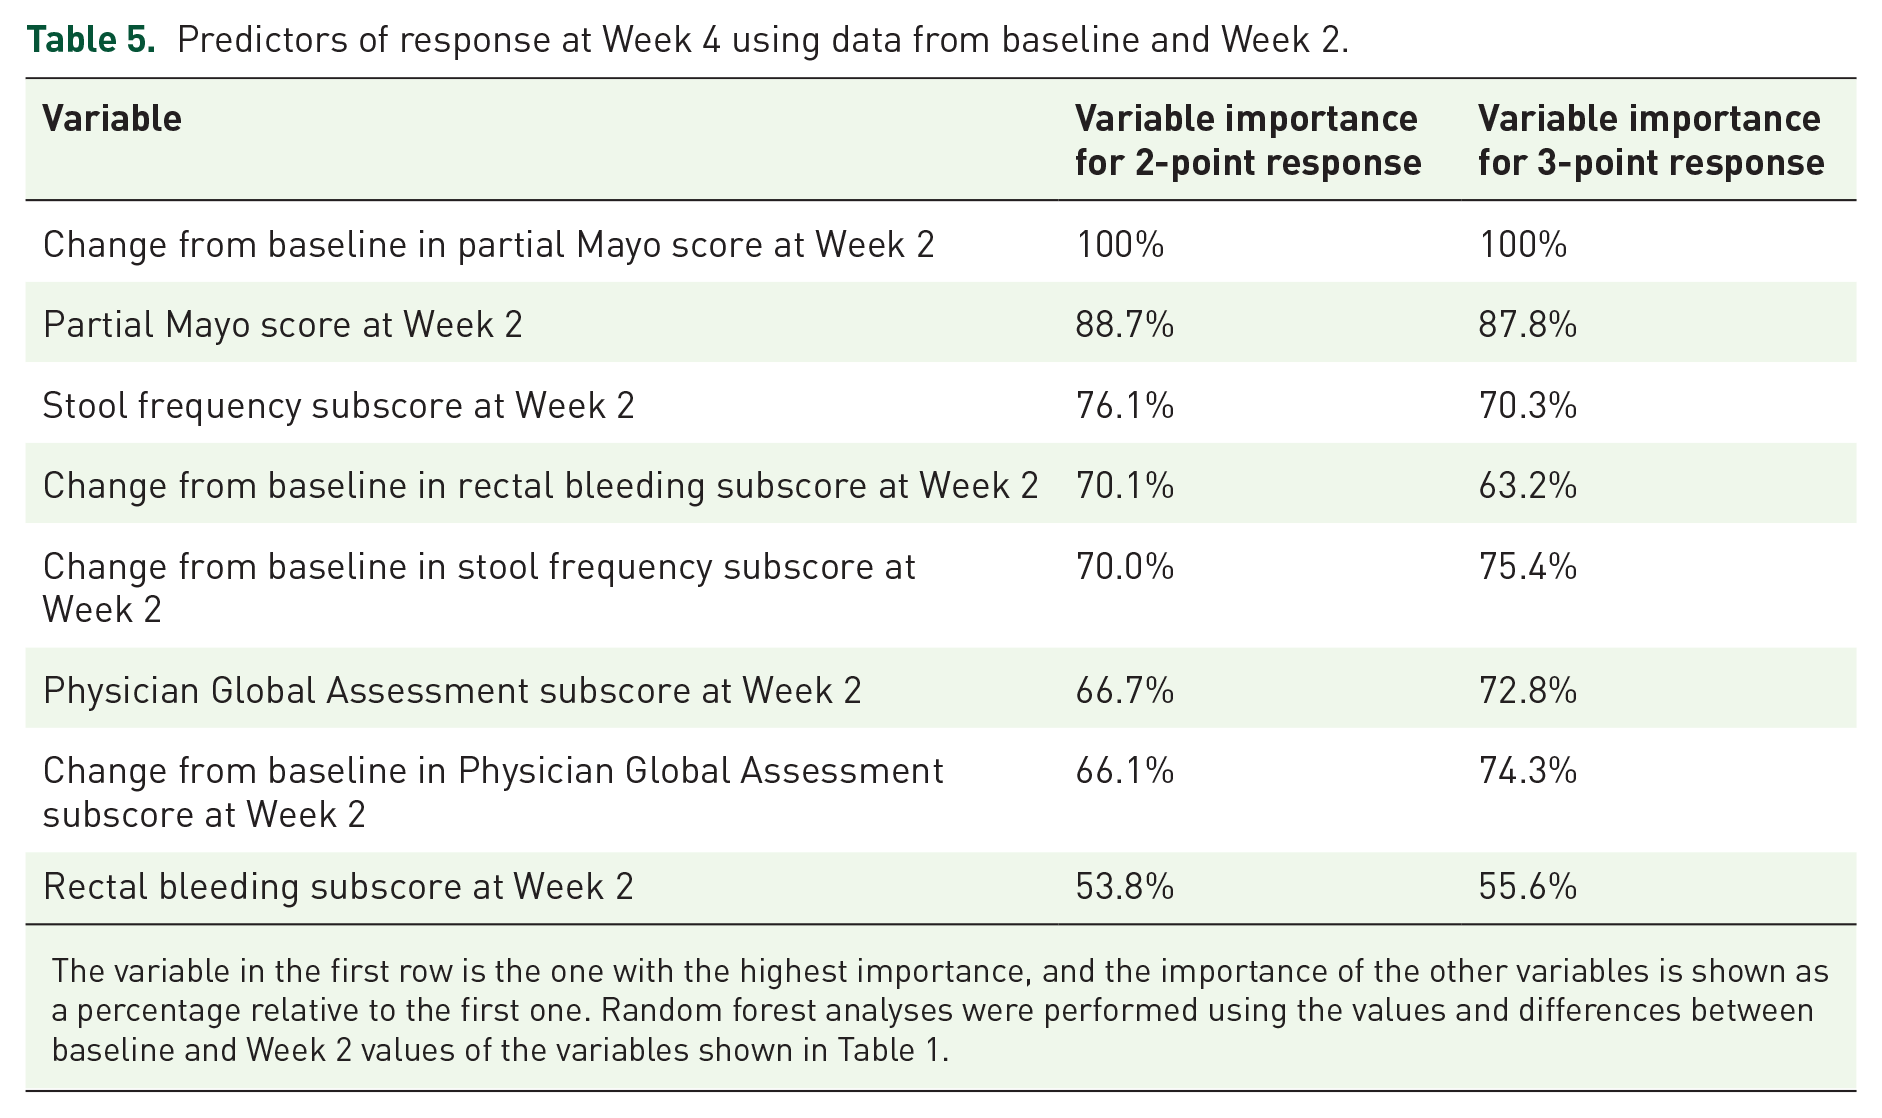
The variable in the first row is the one with the highest importance, and the importance of the other variables is shown as a percentage relative to the first one. Random forest analyses were performed using the values and differences between baseline and Week 2 values of the variables shown in Table 1.
Discussion
In this post hoc analysis of data from the OCTAVE Induction 1 and 2 studies, we utilized statistical modeling and machine learning techniques to create models that identified important variables, and a model that predicts partial Mayo score responder status at either Weeks 4 or 8 of tofacitinib treatment in patients with UC. Two different quantitative models (logistic regression and random forest) were able to predict Week 4 and Week 8 responder status with 74–87% accuracy, using just four measures at different time points (partial Mayo scores, partial Mayo subscores, total cholesterol, and CRP). The combination of subjective (partial Mayo score) and objective (cholesterol and CRP levels) measures, and the exclusion of many additional variables, provides a robust and easy-to-implement model for supporting clinical decision-making.
Partial Mayo score differences from baseline to Week 2 and from baseline to Week 4 were the most important variables to predict responder status in all models. The k-fold cross-validation approach confirmed the robustness of the findings from the testing/training approach, and the AUROC values of both approaches reinforced the role of early treatment response in predicting outcomes at Weeks 4 and 8. These results indicate that response to tofacitinib induction therapy can be predicted by early improvement in clinical and biochemical variables, including CRP. Another post hoc analysis of the OCTAVE Induction 1 and 2 studies showed that a subgroup of patients with moderately to severely active UC experienced a significant clinical response as early as 3 days after starting therapy, compared with placebo. 15 Further investigation is warranted into the underlying cause of early response during tofacitinib induction therapy.
For each partial Mayo subscores, early improvements from baseline were typically important predictors of responder status. A previous meta-analysis showed that rectal bleeding, but not stool frequency, was indicative of endoscopic remission. 16 However, the current analysis found no clear differences between subscores in terms of prediction of response, possibly since partial Mayo subscores are subjective and may correlate with one another. The stool frequency subscore at Week 2 was identified as particularly important in predicting responder status at Weeks 4 and 8 when only baseline and Week 2 data were considered. Overall, important variables identified using random forest analyses to predict either a 2- or 3-point responder status at either Week 4 or Week 8 were very similar. These results demonstrate that the differences from baseline in partial Mayo score and subscores are powerful, early predictive tools for responder status, regardless of responder definition, in patients receiving tofacitinib for moderately to severely active UC.
Cholesterol and CRP levels were identified as significant predictors of responder status in some of the logistic regression analyses. Patients with UC and rheumatoid arthritis, also a chronic inflammatory disease, have been shown to have lower levels of circulating lipids compared with the general population.17,18 Previous analyses in patients with UC or rheumatoid arthritis treated with tofacitinib have shown reversible increases in lipids, which stabilize after a period of 8 weeks, as a result of tofacitinib treatment.19,20 This is also an effect of the drug class.21–23 Importantly, for those patients with UC, it was further reported that there were minimal changes in total cholesterol: high-density lipoprotein-cholesterol or low-density lipoprotein-cholesterol: high-density lipoprotein-cholesterol ratios, and increases in lipids were associated with reduced systemic inflammation.
Reductions in CRP levels have also been noted with tofacitinib treatment in patients with UC, 10 possibly due to inhibition of interleukin-6-driven pathways, including downstream cholesterol metabolism and CRP production.24,25 Changes in CRP and cholesterol associated with partial Mayo score response, therefore, are likely due to these patients experiencing both biochemical and clinical responses to tofacitinib treatment. As such, tofacitinib response may differ in patients who do or do not experience changes in systemic inflammation (CRP) or cholesterol levels after treatment initiation. Further investigation on the clinical significance of using cholesterol and CRP levels to predict outcomes is warranted, because the ORs and corresponding 95% CIs were very close to 1.00. In addition, it should be noted that prior tumor necrosis factor inhibitor use at baseline was considered as part of the models, but was not included in the reduced list of variables as it was not identified as a significant predictive variable.
This analysis was designed to compare a machine learning technique (random forest analyses) with traditional logistic regressions. The results showed consistency between the two methods, which helps to validate the findings. Comparison of logistic regression and random forest analyses has been done in very large datasets, 26 as well as in the prediction of outcomes for other disease states.27,28 Specifically, one study determined that logistic regression and machine learning techniques could accurately determine if patients did or did not have chronic kidney failure based solely on data available within electronic health records. 27 Furthermore, a machine learning algorithm successfully identified early clinical variables able to predict prolonged acute hypoxaemic respiratory failure in influenza-infected and critically ill children admitted to hospital. 28 Our current study adds to the body of literature showing that machine learning techniques can be very beneficial to potentially improving the quality of care by providing additional inputs to clinical decision-making.
This study had a number of strengths. Utilization of two different types of models yielded the same predictive power of responder status in patients with UC treated with tofacitinib. Other regression analyses (e.g., least absolute shrinkage and selection operator logistic regression), were also performed and yielded similar results (data not shown), demonstrating further robustness of the data analysis. A potential benefit of the results of this study was that the identification of early predictive markers can better inform clinicians on how to expect their patients to respond over time. This can help clinicians relay pertinent expectation information to their patients, and also quickly determine if a patient will not respond to a treatment so that unnecessary patient discomfort and inflammatory progression might be prevented by switching to another medication. This may be a step toward personalized/precision medicine in UC.
A limitation of this study was that it used data from a controlled population of patients enrolled in a clinical study. Although not necessarily representative of the real-world population with UC, this clinical study population was large and offered a plethora of data to analyze for predictive power. Indeed, real-world or prospective validation of the algorithm will be needed for further confirmation of the model. In addition, variables such as disease extent and endoscopic response could be assessed in future analyses. It is also worth noting that steroid use was not identified as a significant predictive variable. This could be explained by the fact that steroid dose was kept stable over time in the OCTAVE Induction 1 and 2 studies. Analysis of patients who successfully tapered steroid use in the OCTAVE Sustain study would be of interest. These models predicted tofacitinib efficacy; however, the analysis did not attempt to identify baseline characteristics that could be used as predictors of response before commencing tofacitinib therapy. In addition, early prediction of safety outcomes was not assessed in this analysis. Further application of machine learning to predict safety outcomes as a result of tofacitinib treatment are planned and would be very beneficial.
Using a limited set of time-dependent variables, statistical and machine learning models enabled early and precise prediction of tofacitinib treatment outcomes in patients with moderately to severely active UC. This may be another step toward prediction and precision medicine for patients with UC treated with tofacitinib. Validation in the real-world clinical practice is warranted.
Supplemental Material
sj-docx-1-tag-10.1177_17562848211054710 – Supplemental material for Prediction of early clinical response in patients receiving tofacitinib in the OCTAVE Induction 1 and 2 studies
Supplemental material, sj-docx-1-tag-10.1177_17562848211054710 for Prediction of early clinical response in patients receiving tofacitinib in the OCTAVE Induction 1 and 2 studies by Charlie W. Lees, J. Jasper Deuring, Michael Chiorean, Marco Daperno, Gianluca Bonfanti, Rebecca Germino, Pritha Bhadra Brown, Irene Modesto and Roger A. Edwards in Therapeutic Advances in Gastroenterology
Supplemental Material
sj-docx-2-tag-10.1177_17562848211054710 – Supplemental material for Prediction of early clinical response in patients receiving tofacitinib in the OCTAVE Induction 1 and 2 studies
Supplemental material, sj-docx-2-tag-10.1177_17562848211054710 for Prediction of early clinical response in patients receiving tofacitinib in the OCTAVE Induction 1 and 2 studies by Charlie W. Lees, J. Jasper Deuring, Michael Chiorean, Marco Daperno, Gianluca Bonfanti, Rebecca Germino, Pritha Bhadra Brown, Irene Modesto and Roger A. Edwards in Therapeutic Advances in Gastroenterology
Footnotes
Acknowledgements
Medical writing support, under the guidance of the authors, was provided by Eric Comeau, PhD, CMC Connect, McCann Health Medical Communications and was funded by Pfizer Inc, New York, NY, USA in accordance with Good Publication Practice (GPP3) guidelines (Ann Intern Med 2015;163:461–464).
Author contributions
JJD, RAE, GB, MC, CWL, and MD contributed to the conception and design of the analysis. JJD and RAE were responsible for oversight and leadership of the analysis planning and execution. GB conducted the analysis. JJD, RAE, GB, MC, CWL, and MD contributed to the drafting and revising of the manuscript. All authors approved the final version of the article, including the authorship list.
Conflict of interest statement
The authors declared the following potential conflicts of interest with respect to the research, authorship, and/or publication of this article: CWL has served as a speaker for AbbVie, Dr Falk, Ferring, Hospira, Janssen, MSD, Pfizer Inc, Shire, Takeda, and Warner-Chilcott; has served as a consultant for AbbVie, Dr Falk, Gilead, GSK, Hospira, Iterative Scopes, Janssen, MSD, Oshi Health, Pfizer Inc, Pharmacosmos, Takeda, Topivert, Trellus Health, and Vifor Pharma; and has received research funding from AbbVie and Gilead. MC has served as a speaker for AbbVie, Janssen, Medtronic, Pfizer Inc, and Takeda; and has served as a consultant for AbbVie, Arena, BMS, Medtronic, Pfizer Inc, Prometheus, and Takeda. MD has received personal fees from AbbVie, Chiesi, Ferring, Janssen, MSD, Pfizer Inc, and Quintiles; has received grants and personal fees from Takeda; has received non-financial support from SOFAR; and has been involved in clinical trials for Eli Lilly, Galapagos, Gilead, Janssen, MSD, Roche, and Takeda. GB owns stocks and shares in Fair Dynamics Consulting, which is a paid consultant contracted by Health Services Consulting Corporation in connection with this study. JJD, RG, PBB, and IM are employees of, and owns stocks and shares in, Pfizer Inc. RAE is a Principal in Health Services Consulting Corporation, and was a paid consultant to Pfizer Inc in connection with this study.
Funding
The authors disclosed receipt of the following financial support for the research, authorship, and/or publication of this article: These studies were sponsored by Pfizer Inc.
Data sharing statement
Upon request and subject to certain criteria, conditions, and exceptions (see ![]() for more information), Pfizer will provide access to individual de-identified participant data from Pfizer-sponsored global interventional clinical studies conducted for medicines, vaccines, and medical devices (1) for indications that have been approved in the United States and/or European Union or (2) in programs that have been terminated (i.e., development for all indications has been discontinued). Pfizer will also consider requests for the protocol, data dictionary, and statistical analysis plan. Data may be requested from Pfizer trials 24 months after study completion. The de-identified participant data will be made available to researchers whose proposals meet the research criteria and other conditions, and for which an exception does not apply, via a secure portal. To gain access, data requestors must enter into a data access agreement with Pfizer.
for more information), Pfizer will provide access to individual de-identified participant data from Pfizer-sponsored global interventional clinical studies conducted for medicines, vaccines, and medical devices (1) for indications that have been approved in the United States and/or European Union or (2) in programs that have been terminated (i.e., development for all indications has been discontinued). Pfizer will also consider requests for the protocol, data dictionary, and statistical analysis plan. Data may be requested from Pfizer trials 24 months after study completion. The de-identified participant data will be made available to researchers whose proposals meet the research criteria and other conditions, and for which an exception does not apply, via a secure portal. To gain access, data requestors must enter into a data access agreement with Pfizer.
Supplemental material
Supplemental material for this article is available online.
References
Supplementary Material
Please find the following supplemental material available below.
For Open Access articles published under a Creative Commons License, all supplemental material carries the same license as the article it is associated with.
For non-Open Access articles published, all supplemental material carries a non-exclusive license, and permission requests for re-use of supplemental material or any part of supplemental material shall be sent directly to the copyright owner as specified in the copyright notice associated with the article.