
Abstract
Introduction:
Two-dimensional shear wave elastography (2D-SWE) and vibration-controlled transient elastography (VCTE) provide noninvasive assessment of hepatic fibrosis. We compared performance of 2D-SWE and VCTE for fibrosis detection in nonalcoholic fatty liver disease (NAFLD).
Methods:
We performed a prospective study of adults with NAFLD who underwent 2D-SWE, VCTE, and liver biopsy analysis (using Nonalcoholic Steatohepatitis Clinical Research Network scoring system). The primary outcome was hepatic fibrosis (stage ⩾ 1); secondary outcomes included dichotomized fibrosis stages. Area under receiver operating characteristic curve (AUROC) analyses were used to compare 2D-SWE and VCTE performance.
Results:
A total of 114 adults with a median BMI of 31.2 kg/m2 were included. The VCTE was better than 2D-SWE for the detection of fibrosis (AUROC: 0.81 versus 0.72, p = 0.03). The VCTE detected fibrosis stage 2, 3, or 4 with AUROCs of 0.86 (95% CI, 0.80–0.93), 0.91 (95% CI, 0.82–0.99), and 0.96 (95% CI, 0.91–1.00). The 2D-SWE detected fibrosis stage 2, 3, or 4 with AUROCs of 0.84 (95% CI, 0.76–0.92), 0.88 (95% CI, 0.81–0.96), and 0.93 (95% CI, 0.86–0.99).
Conclusion:
In a prospective study including more than 100 adults with NAFLD, we found VCTE to be more accurate than 2D-SWE in detecting fibrosis; these modalities, however, are comparable in assessing for higher stages of fibrosis.
Introduction
Accurate assessment of the severity of hepatic fibrosis is important in the management of adults with nonalcoholic fatty liver disease (NAFLD), as hepatic fibrosis is closely associated with long-term outcomes such as liver-related related morbidity and mortality.1–3 While liver biopsy remains the gold standard for staging of fibrosis in NAFLD, biopsy is not without procedural risks and is prone to sampling error. Furthermore, recent studies have demonstrated significant inter-and intrareader variability in fibrosis stratification in adults with NAFLD, suggesting that the reliability of liver biopsy evaluation in this patient population is suboptimal. 4 Given these limitations, a number of objective and quantitative ultrasound-based techniques to estimate hepatic fibrosis have been developed, which includes vibration-controlled transient elastography (VCTE) and two-dimensional shear wave elastography (2D-SWE).5–7
Choice of noninvasive techniques for fibrosis assessment in NAFLD must weigh various factors such as accessibility, technical expertise, ease of use, cost, and sensitivity and specificity.5,8 One disadvantage of VCTE is that it is blind to exact localization of the region of interest. Furthermore, prior studies have shown that the accuracy and reliability of VCTE decrease with high body mass index (BMI) in persons with NAFLD.9–12 To mitigate this problem, the obesity-specific (XL) probe was developed, and subsequently, the reliability of VCTE improved with combined use of the M and XL probe.13,14 Similar to VCTE, 2D-SWE estimates the speed of a shear wave to provide a quantitative estimate of tissue stiffness. Potential advantages of 2D-SWE techniques compared with VCTE are that liver stiffness is measured on a conventional B-mode ultrasound image in real time with exact localization of the region of interest, which may reduce variability in liver stiffness measurements. 15 While recent studies have examined diagnostic performance of SWE methods in chronic liver disease, most have either utilized point SWE instead of 2D-SWE and/or included participants with a diverse range of liver disease etiologies.15–25 Data on disease-specific accuracy and cutoff values of 2D-SWE for staging hepatic fibrosis in adults with NAFLD, 26 especially when compared with VCTE,27–29 are limited.
In this study, we compared the diagnostic accuracy of VCTE and 2D-SWE for hepatic fibrosis in a well-characterized cohort of prospectively recruited adults with biopsy-proven NAFLD and varying degrees of hepatic fibrosis.
Methods
Study population and liver histology
This is a cross-sectional analysis of consecutive adults (⩾18 years of age) with NAFLD enrolled in prospective cohort study who underwent 2D-SWE and VCTE on the same day at the University of California at San Diego. The diagnosis of NAFLD was determined based on the presence of hepatic steatosis on liver biopsy and/or by an imaging modality [MRI proton density fat fraction (MRI-PDFF) > 5% or controlled attenuation parameter (CAP) > 288 dB/m] in the absence of any clinical, laboratory, or histological evidence of a liver disease other than NAFLD. Exclusion criteria for this study included any of the following: excessive alcohol use [⩾14 (men) or ⩾7 (women) drinks per week], use of steatogenic or hepatotoxic medications, and inadequate liver biopsy (biopsy length was <10 mm or portal triads <10). All participants provided written informed consent underwent a standardized history, anthropometric measurements, physical examination, and biochemical testing. Liver biopsy was considered as the reference standard for liver fibrosis stage, and all liver biopsies were reviewed by one expert liver pathologist blinded to all clinical and histological data and scored using the Nonalcoholic Steatohepatitis Clinical Research Network (NASH CRN) histological scoring system. 30
VCTE and 2D-SWE
Trained operators, blinded to all clinical and histological data, performed all VCTE and 2D-SWE examinations in fasting patients using standardized protocols. Five trained operators performed VCTE and 2D-SWE examinations, although the majority were performed by one operator (n = 65 participants). All liver stiffness measurements were obtained in the right liver lobe during a 10-s breath hold. The VCTE was performed using the FibroScan® 502 Touch model (Echosens, Paris, France) according to previously described methods. 31 According to manufacturer protocol, all patients were first scanned by applying the M probe (3.5 MHz) over the area of abdomen at the location of the right liver lobe. When indicated by the equipment upon initial assessment, patients were rescanned using the XL probe (2.5 MHz). Data generated from the probe recommended by the manufacturer’s Automatic Probe Selection tool were used. The 2D-SWE was performed using the SuperSonic Imagine Aixplorer Ultimate ultrasound system and the Xc6-1 transducer (Aixplorer, Aix-en-Provence, France). Three to five measurements were performed on each patient, and the mean value expressed in kilopascals (kPa) was used as the representative measurement. 32 Technical failure was defined as inability to obtain ⩾10 or ⩾3 valid measurements for VCTE and 2D-SWE, respectively. 17 Liver stiffness measurement was considered unreliable when interquartile range (IQR)/median was >0.30 in patients with median ⩾ 7.1 kPa. 33 Patients with a technical failure and/or unreliable examination were excluded from analyses, which included four patients (three unreliable, one technical failure) that met study inclusion criteria (4/118, 3.4%).
Outcome measures
The primary outcome was the presence of hepatic fibrosis (⩾stage 1). Secondary outcomes included dichotomized stages of fibrosis as follows: stage 2–4 (significant fibrosis) versus stage 0–1, stage 3–4 (advanced fibrosis) versus stage 0–2, and stage 4 (cirrhosis) versus stage 0–3.
Statistical analysis
Categorical data were compared using the chi-square and Fisher’s exact tests. Distributions of continuous variables were analyzed using the Mann–Whitney U test. The association between liver stiffness and histological fibrosis stage was evaluated by Spearman’s rank correlation test. Receiver operating characteristic (ROC) curve analysis was performed for VCTE and 2D-SWE as a classifier of the presence of fibrosis (stages 1–4 versus stage 0), and the optimal threshold of VCTE and 2D-SWE was determined by Youden index. Similarly, ROC analyses were performed, and the corresponding area under receiver operating characteristic curve (AUROCs) were computed for VCTE and 2D-SWE as a classifier of other outlined dichotomizations of fibrosis stage. The DeLong test for two correlated ROC curves was used to compare the AUROCs of VCTE and 2D-SWE. To evaluate factors associated with discrepancy between VCTE and 2D-SWE, we performed subgroup analysis to evaluate test characteristics associated with BMI. Subgroups were defined according to BMI quartiles: patients with BMI < 34.3 kg/m2 and patients with BMI ⩾ 34.3 kg/m2 (75th percentile).
All analyses were performed using EZR (Saitama Medical Center, Jichi Medical University, Shimotsuke, Japan), a graphical user interface for R version 3.2.2 (The R Foundation for Statistical Computing, Vienna, Austria). A two-tailed p value of ⩽0.05 was considered statistically significant for all analyses. The reporting of this study conforms to the STROBE statement. 34 This study approved by the Institutional Review Board at the University of California, San Diego (UCSD) and the UCSD Clinical and Translational Research Institute. All authors had access to the study data and reviewed and approved the final manuscript.
Results
Patient characteristics
The demographic, clinical, laboratory, and histological parameters of the 114 adults included in this study are summarized in Table 1. The median (IQR) age was 55 (45–64) years, and 54% of patients were women. The median (IQR) body mass index (BMI) was 31.2 (29–34.3) kg/m2. The median (IQR) interval between biopsy and liver stiffness assessment was -1 (-21 to 53) days. The distribution of hepatic fibrosis was as follows: stage 0 (41/114, 36%), stage 1 (36/114, 31.6%), stage 2 (17/114, 14.9%), stage 3 (11/114, 9.6%), and stage 4 (9/114, 7.9%). Median (IQR) liver stiffness was 7.6 (5.3–10.8) kPa with VCTE and 6.8 (5.2–8.6) kPa with 2D-SWE, respectively. For VCTE, the M probe was utilized in 70 (61%) participants, whereas the XL probe was utilized in 44 (39%) participants (Table 1). Probe usage was similar among those with stage 0 fibrosis and those with liver fibrosis (stages 1–4).
Patient characteristics.

ALP, alkaline phosphatase; ALT, alanine aminotransferase; AST, aspartate aminotransferase; BMI, body mass index; 2D-SWE, two-dimensional shear wave elastography; GGT, gamma glutamyl transferase; HDL, high-density lipoprotein; LDL, low-density lipoprotein; NASH CRN, Nonalcoholic Steatohepatitis Clinical Research Network; TG, triglycerides; VCTE, vibration-controlled transient elastography.
Data are shown in median (interquartile range).
NASH CRN scoring system was used.
Median VCTE and 2D-SWE values for stage 0 fibrosis did not differ between trained operator 1 (n = 65) and other operators (n = 49), with median values of 5.3 and 5.2 kPa (p = 0.9) for VCTE and 5.7 and 5.9 kPa (p = 0.9) for 2D-SWE. We did not find significant difference in median values for VCTE or 2D-SWE between trained operators (operator 1 versus others) for fibrosis stages 1–4.
Comparison of diagnostic performance of VCTE and 2D-SWE for staging hepatic fibrosis
The median liver stiffness (IQR) of VCTE in fibrosis stages 0, 1, 2, 3, and 4 was 5.3 (4.5–6.9), 7.0 (5.6–8.7), 8.0 (7.6–11.6), 11.9 (10.8–15.2), and 24.2 (17.3–28.1) kPa, respectively, and liver stiffness measured by VCTE increased as the fibrosis stage increased (p < 0.001, Figure 1). The median liver stiffness (IQR) of 2D-SWE in fibrosis stages 0, 1, 2, 3, and 4 was 5.7 (5.0–6.7), 6.2 (4.9–7.5), 8.2 (6.8–9.7), 9.9 (7.8–10.9), and 12.4 (10.9–15.9) kPa, respectively, and liver stiffness measured by 2D-SWE also increased as the fibrosis stage increased (p < 0.001, Figure 2). When the diagnostic accuracy of VCTE and 2D-SWE was investigated, VCTE had an AUROC of 0.81 [95% confidence interval (CI), 0.73–0.89] for diagnosing hepatic fibrosis (Table 2). Using a threshold of 7.8 kPa, VCTE had a sensitivity of 64.4% and specificity of 87.8% for detecting any hepatic fibrosis. The 2D-SWE had an AUROC of 0.72 (95% CI, 0.62–0.81) for diagnosis of hepatic fibrosis (Table 2). Using a threshold of 7.5 kPa, 2D-SWE had a sensitivity of 53.4% and specificity of 90.2% for detecting any hepatic fibrosis. Comparison among methods showed that the AUROC for detecting the presence of hepatic fibrosis was significantly higher for VCTE compared with 2D-SWE (p = 0.03, Figure 3).

Liver stiffness measured by vibration-controlled transient elastography (VCTE). The boxplot of liver stiffness is shown by fibrosis stage. The bottom and top of each box represent the 25th and 75th percentiles, giving the interquartile range. The line through the box indicates the median value, and the error bar indicates 10th and 90th percentiles.
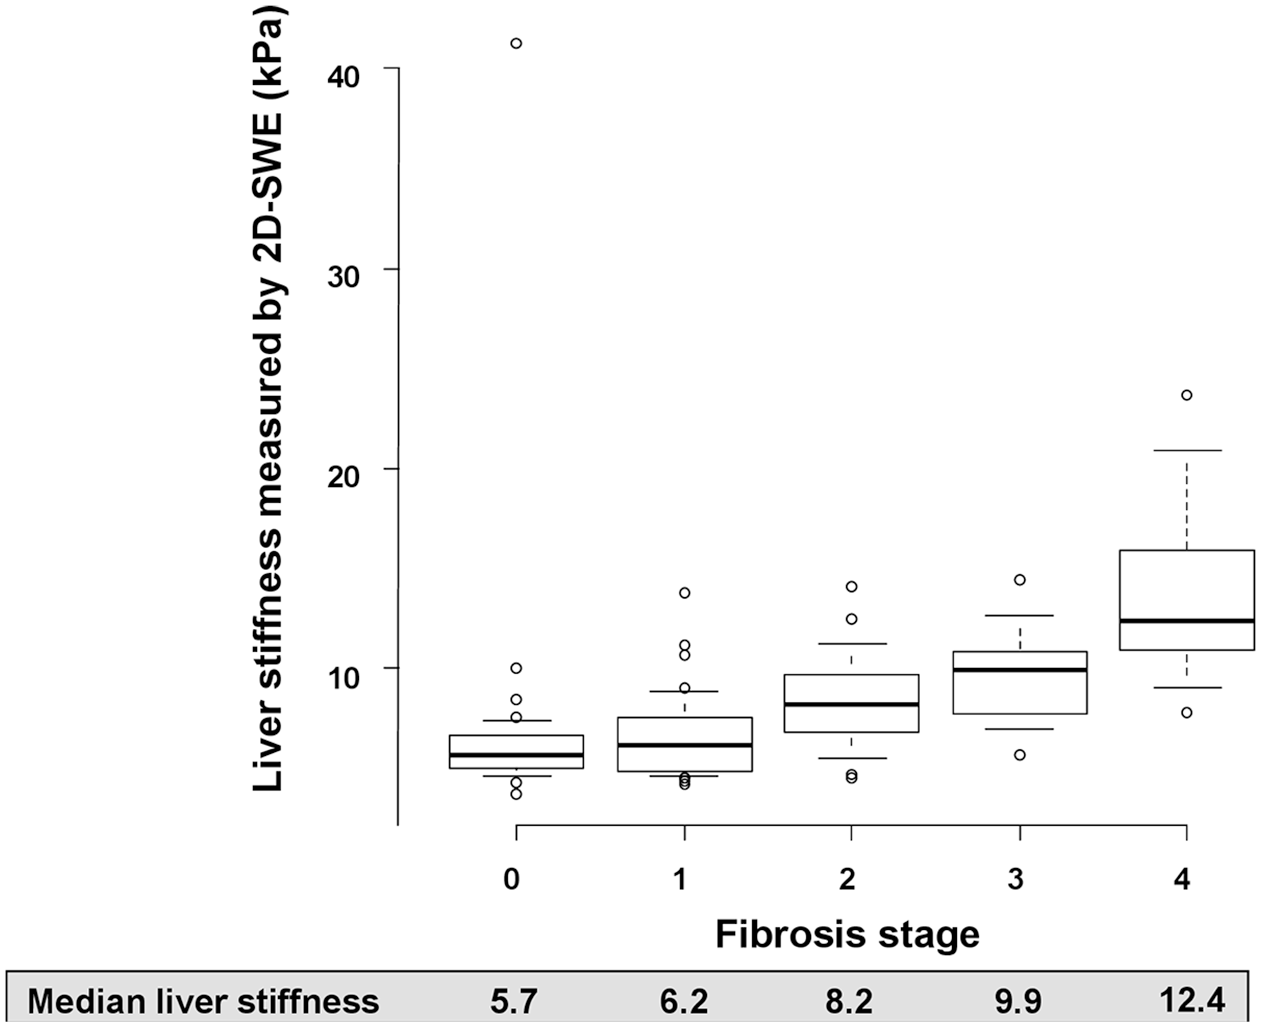
Liver stiffness measured by two-dimensional supersonic shear wave elastography (2D-SWE). The boxplot of liver stiffness is shown by fibrosis stage. The bottom and top of each box represent the 25th and 75th percentiles, giving the interquartile range. The line through the box indicates the median value, and the error bar indicates 10th and 90th percentiles.
Diagnostic accuracy of VCTE and 2D-SWE in adults with nonalcoholic fatty liver disease.
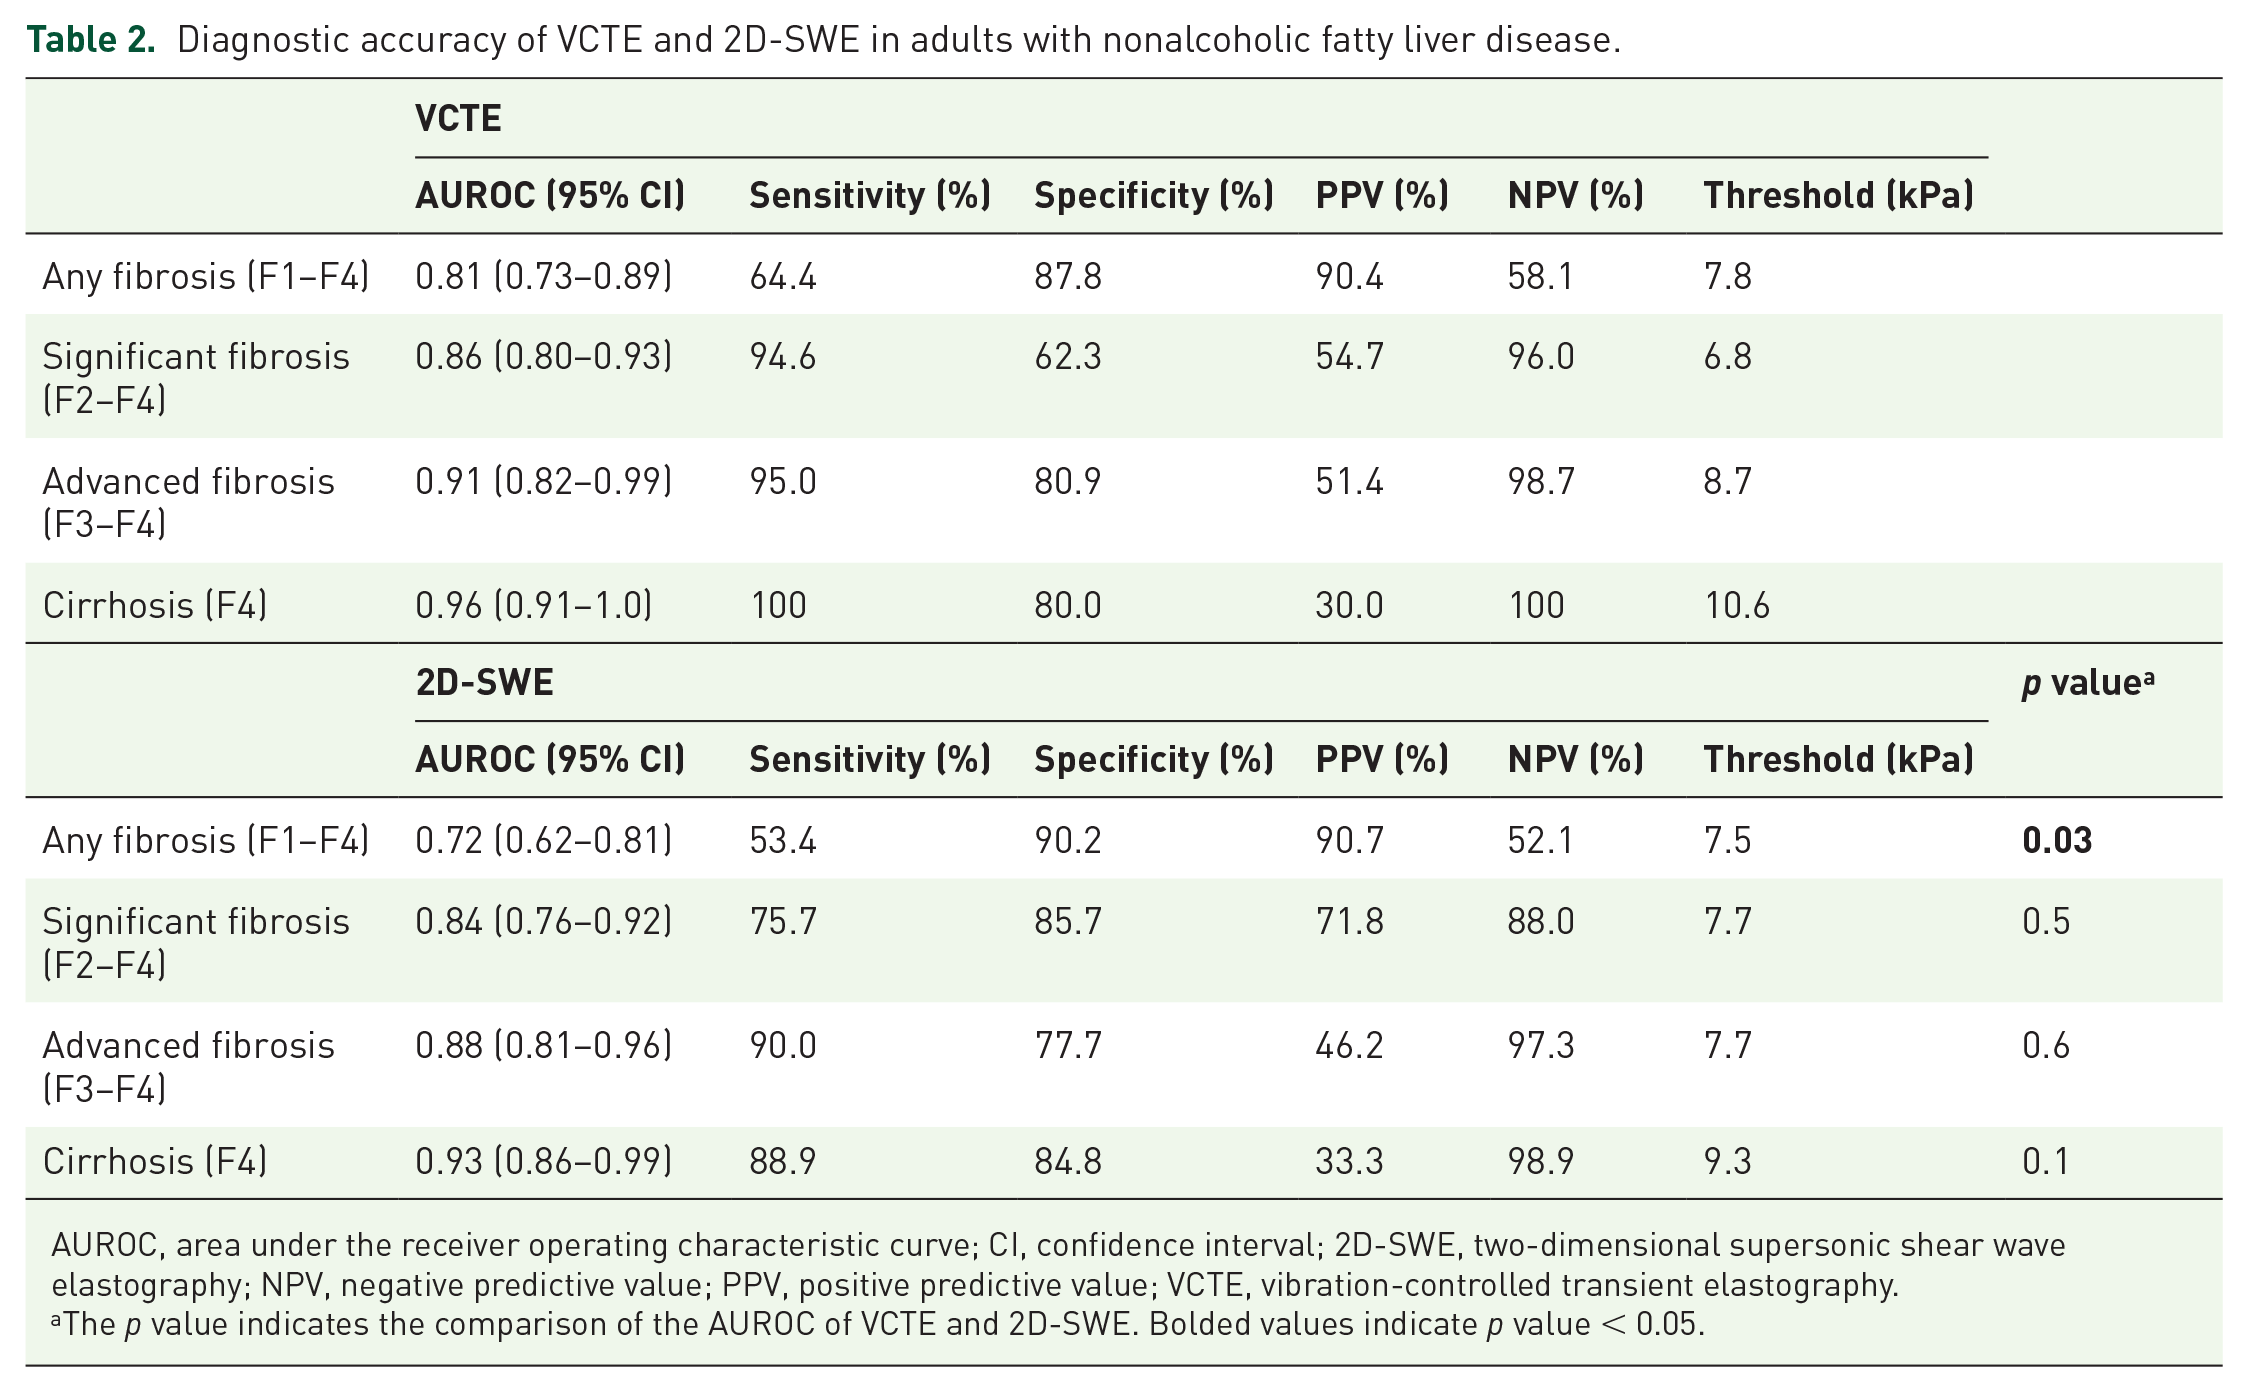
AUROC, area under the receiver operating characteristic curve; CI, confidence interval; 2D-SWE, two-dimensional supersonic shear wave elastography; NPV, negative predictive value; PPV, positive predictive value; VCTE, vibration-controlled transient elastography.
The p value indicates the comparison of the AUROC of VCTE and 2D-SWE. Bolded values indicate p value < 0.05.

Receiver operating characteristic (ROC) for the prediction of any hepatic fibrosis.
The AUROCs of VCTE and 2D-SWE for the diagnosis of other dichotomized stages of fibrosis are summarized in Table 2. There was no significant difference in diagnosis between VCTE and 2D-SWE in any other dichotomized stage of fibrosis. The VCTE had AUROCs of 0.86 (95% CI, 0.80–0.93), 0.91 (95% CI, 0.82–0.99), and 0.96 (95% CI, 0.91–1.0) for significant fibrosis, advanced fibrosis, and cirrhosis, respectively. The 2D-SWE had AUROCs of 0.84 (95% CI, 0.76–0.92), 0.88 (95% CI, 0.81–0.96), and 0.93 (95% CI, 0.86–0.99) for significant fibrosis, advanced fibrosis, and cirrhosis, respectively.
Next, patients were classified into two subgroups based on BMI, defined by BMI quartiles [<34.3 kg/m2 and ⩾34.3 kg/m2 (75th percentile), Supplemental Table 1). In patients with BMI <34.3 kg/m2, there was no significant difference in the AUROC between VCTE and 2D-SWE for detecting hepatic fibrosis (p = 0.3, Figure 4). When comparing diagnostic performance of VCTE and 2D-SWE in those in the highest BMI quartile (BMI ⩾ 34.3 kg/m2), the AUROC of 2D-SWE for any fibrosis decreased to 0.59 and it was significantly lower than the AUROC of VCTE (AUROC: 0.83, p = 0.01, Figure 4). The diagnostic accuracy for significant fibrosis, advanced fibrosis, and cirrhosis was equivalent in VCTE and 2D-SWE in both BMI groups (Supplemental Table 2).
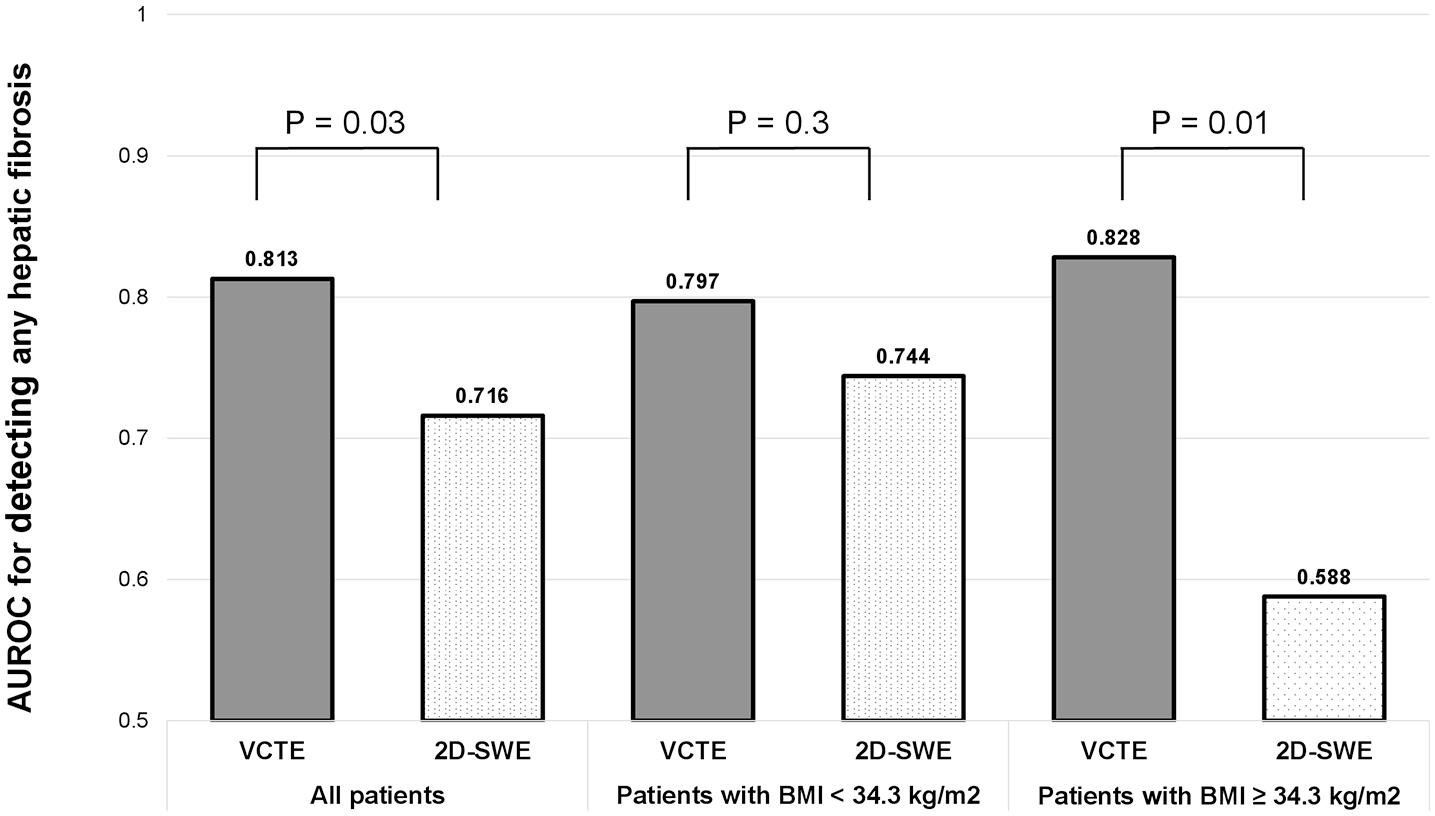
Area under the receiver operative characteristic curve (AUROC) for predicting any hepatic fibrosis by body mass index (BMI).
Discussion
Main findings
In this prospective study, we found that 2D-SWE was less accurate in distinguishing the presence of any hepatic fibrosis compared with VCTE in a well-characterized cohort of adults with biopsy-proven NAFLD. These findings indicate that there could be risk of fibrosis misclassification, specifically underestimation of the presence of hepatic fibrosis (⩾stage 1), with 2D-SWE in adults with NAFLD.
Decreased accuracy of 2D-SWE in detecting any hepatic fibrosis was in part secondary to worse performance of 2D-SWE in those patients with BMI in the highest quartile [AUROC: 0.59 (2D-SWE) versus 0.83 (VCTE)]. The AUROC for any hepatic fibrosis with VCTE and 2D-SWE was not significantly different in those patients in lower BMI quartiles <34.3 kg/m2 (0.80 versus 0.74, respectively). Furthermore, the ability for detecting significant fibrosis, advanced fibrosis, and cirrhosis in VCTE and 2D-SWE was equivalent and not different in BMI subgroups.
Context with published literature
Staging of hepatic fibrosis in NAFLD is important in order to identify persons with advanced fibrosis at higher risk for liver-related morbidity and mortality.1–3 Noninvasive ultrasound-based methods for assessment of liver fibrosis, including VCTE and 2D-SWE, are increasingly replacing liver biopsy for staging liver fibrosis and monitoring changes in liver fibrosis over time. 35 VCTE has been shown to be useful for differentiation of fibrosis in NAFLD, although prior studies have suggested that VCTE may be less accurate in distinguishing lower fibrosis stages.36,37 While emerging evidence suggests that 2D-SWE is also accurate in differentiation of hepatic fibrosis, most studies to date have included persons with diverse etiologies of liver disease,15–17,20,38 highlighting the need for a better understanding of the diagnostic accuracy and optimal diagnostic thresholds of 2D-SWE in adults with NAFLD. Furthermore, prospective studies that directly compare diagnostic accuracy between VCTE and 2D-SWE in adults with NAFLD are limited.27,28
A recent prospective study that enrolled 62 NAFLD patients demonstrated the comparable diagnostic accuracy of SWE and VCTE for significant fibrosis, advanced fibrosis, and cirrhosis, 27 and our study corroborates these findings. Only one patient without hepatic fibrosis, however, was enrolled, and therefore, the diagnostic accuracy for the presence of any fibrosis could not be investigated. Our study indicates the diagnostic ability of 2D-SWE for the presence of any hepatic fibrosis is more limited than VCTE and expands our understanding of the diagnostic ability of 2D-SWE in the NAFLD patient population.
In regard to the diagnostic ability for obese patients, our results are corroborated by findings from a recent study examining 2D-SWE in obese adults (mean BMI: 45.5 kg/m2) undergoing bariatric surgery. 23 The AUROC for detecting hepatic fibrosis with 2D-SWE was 0.77, which is lower than published data for VCTE performance in adults with severe obesity.39,40 The lack of discordance associated with BMI between VCTE and fibrosis stage may be due to the use of XL probe. In contrast, the optimal positioning of the probe for 2D-SWE in patients with more severe obesity may be more technically difficult and explain the inferior diagnostic ability. Ultimately, the accuracy of 2D-SWE in detecting mild/early hepatic fibrosis in obese persons with NAFLD requires further investigation.
A study including 291 NAFLD patients demonstrated a tendency of higher diagnostic accuracy in 2D-SWE than VCTE. 28 In this study, all VCTE measurements were performed by only M probe. In our study, we used M probe and XL probe for assessing liver stiffness and it may contribute to improving the diagnostic accuracy of VCTE, especially in an NAFLD cohort including high BMI patients. Consequently, the discriminatory ability of 2D-SWE compared much more favorably with VCTE in assessment of significant fibrosis (F2–F4), advanced fibrosis (F3–F4), and cirrhosis (F4). Negative predictive values for ruling out significant fibrosis (stage 2 or greater) were 96% and 88% for VCTE and 2D-SWE, respectively. These findings suggest that 2D-SWE can be used similarly to VCTE for the assessment of significant fibrosis. A recent meta-analysis of individual patient data reported an AUROC of 0.855 for detecting significant fibrosis in an NAFLD subgroup, 20 which is comparable with our findings (AUROC: 0.84). It is worth noting that the accuracy of 2D-SWE was noted to be highest in viral hepatitis in this meta-analysis, highlighting the need for more data to refine disease-specific cutoffs for 2D-SWE. 20
Strengths and limitations
The strengths of the study are that this study enrolled prospectively recruited well-characterized NAFLD patients in a specialized research setting. All participants underwent a systematic and standardized liver disease assessment, and other causes of liver disease were systematically excluded. Similar to VCTE, the performance of 2D-SWE is dependent on operator experience. 15 A single operator did not perform all VCTE and 2D-SWE measurements. The operators performing VCTE and 2D-SWE at our center, however, are all highly trained, and we did not find a difference in median values of VCTE and 2D-SWE between operators. We only utilized SuperSonic Imagine Aixplorer, and therefore, other types of 2D-SWE were not evaluated. Skin-capsule distance was not recorded in all participants, and we could not evaluate this as a factor associated with discrepancy between VCTE and 2D-SWE. Finally, our analyses were carried out in a relatively modest number of patients with NAFLD at a single center, and therefore, it would be important to validate these results in larger NAFLD cohorts.
Future implications
To our knowledge, our study encompasses one of the larger series to date comparing the diagnostic accuracy of VCTE and 2D-SWE in a well-characterized cohort of adults with NAFLD cohort and offers insight into factors affecting use. Our findings suggest that VCTE is more accurate than 2D-SWE in assessing any hepatic fibrosis (⩾stage 1), particularly in persons with high BMI; these two modalities, however, are comparable in assessing for higher degrees of fibrosis (⩾stage 2) in persons with NAFLD. Future directions should include validation of our NAFLD-specific cutoffs in addition to investigation into how to perform an accurate 2D-SWE examination without negatively affecting liver stiffness measurement.
Supplemental Material
sj-docx-1-tag-10.1177_17562848211050436 – Supplemental material for Diagnostic accuracy of two-dimensional shear wave elastography and transient elastography in nonalcoholic fatty liver disease
Supplemental material, sj-docx-1-tag-10.1177_17562848211050436 for Diagnostic accuracy of two-dimensional shear wave elastography and transient elastography in nonalcoholic fatty liver disease by Suzanne R. Sharpton, Nobuharu Tamaki, Ricki Bettencourt, Egbert Madamba, Jinho Jung, Amy Liu, Cynthia Behling, Mark A. Valasek and Rohit Loomba in Therapeutic Advances in Gastroenterology
Footnotes
Acknowledgements
Suzanne R. Sharpton and Nobuharu Tamaki share co-first authorship.
Author contributions
SS: analysis and interpretation of data, drafting of the manuscript, critical revision of the manuscript, obtained funding, approved final submission.
NT: analysis and interpretation of data, drafting of the manuscript, critical revision of the manuscript, obtained funding, approved final submission.
RB: data analysis, critical revision of the manuscript, approved final submission
JJ: data analysis, drafting of the manuscript, critical revision of the manuscript, approved final submission
EM: data analysis, critical revision of the manuscript, approved final submission
AL: data analysis, critical revision of the manuscript, approved final submission
CB: data analysis, critical revision of the manuscript, approved final submission
MV: data analysis, critical revision of the manuscript, approved final submission
RL: study concept and design, analysis and interpretation of data, drafting of the manuscript, critical revision of the manuscript, obtained funding, study supervision, approved final submission
Conflict of interest statement
The authors declared the following potential conflicts of interest with respect to the research, authorship, and/or publication of this article: SS serves as a consultant for Ionis. RL serves as a consultant for Alnylam/Regeneron; Amgen; Arrowhead Pharmaceuticals; Astra Zeneca; Bristol-Myer Squibb; CohBar; Eli Lilly; Galmed; Gilead; Glympse Bio, Inipharm; Intercept; Ionis; Janssen Inc; Madrigal; Metacrine, Inc; NGM Biopharmaceuticals; Novartis; Novo Nordisk; Pfizer; Sagimet; 89bio; and Viking Therapeutics. In addition, his institution has received grant support from Allergan, AstraZeneca, Boehringer-Ingelheim, Bristol-Myers Squibb, Eli Lilly, Galectin Therapeutics, Galmed Pharmaceuticals, Genfit, Gilead, Intercept, Inventiva, Janssen, Madrigal Pharmaceuticals, Merck, NGM Biopharmaceuticals, Pfizer, and Siemens. He is also co-founder of Liponexus, Inc. All other authors have no conflicts of interest to disclose.
Funding
The authors disclosed receipt of the following financial support for the research, authorship, and/or publication of this article: SS received funding support from the American Association for the Study of Liver Diseases (AASLD) Foundation. NT received funding support from the Uehara Memorial Foundation. RL received funding support from National Institute of Environmental Health Sciences (NIEHS) (5P42ES010337); National Center for Advancing Translational Sciences (NCATS) (5UL1TR001442); Department of Defense Peer Reviewed Cancer Research Program (DOD PRCRP) (W81XWH-18-2-0026); National Institute of Diabetes and Digestive and Kidney Diseases (NIDDK) (U01DK061734, R01DK106419, R01DK121378, R01DK124318, P30DK120515); National Heart, Lung, and Blood Institute (NHLBI) (P01HL147835); and National Institute on Alcohol Abuse and Alcoholism (NIAAA) (U01AA029019). The content is solely the responsibility of the authors and does not necessarily represent the official views of the National Institutes of Health (NIH).
Supplemental material
Supplemental material for this article is available online.
References
Supplementary Material
Please find the following supplemental material available below.
For Open Access articles published under a Creative Commons License, all supplemental material carries the same license as the article it is associated with.
For non-Open Access articles published, all supplemental material carries a non-exclusive license, and permission requests for re-use of supplemental material or any part of supplemental material shall be sent directly to the copyright owner as specified in the copyright notice associated with the article.