
Abstract
Background:
Anastomotic recurrence is frequent in patients with Crohn’s disease (CD) following ileocecal resection. The degree of endoscopic recurrence, quantified by the Rutgeerts score (RS), correlates with risk of clinical and surgical recurrence. Several studies demonstrate the accuracy of fecal calprotectin (FC) for detection of endoscopic recurrence, however the optimal threshold FC value remains to be established. The aim of our meta-analysis was to evaluate the accuracy of common FC cut-offs for detection of endoscopic recurrence.
Methods:
We performed a systematic literature search for studies evaluating postoperative recurrence in CD which reported RS and FC levels. Endoscopic recurrence was defined as RS = 2–4 (or RS ⩾ 2). We calculated pooled diagnostic sensitivity, specificity, diagnostic odds ratio (DOR) and constructed summary receiver operating characteristic (SROC) curves for each available FC cut-off value.
Results:
A total of 54 studies were retrieved; 9 studies were eligible for analysis. Diagnostic accuracy was calculated for FC values of 50, 100, 150 and 200 µg/g. A significant threshold effect was observed for all FC values. The optimal diagnostic accuracy was obtained for FC value of 150 µg/g, with a pooled sensitivity of 70% [95% confidence interval (CI) 59–81%], specificity 69% (95% CI 61–77%), and DOR 5.92 (95% CI 2.61–12.17). The area under the SROC curve was 0.73.
Conclusion:
FC is an accurate surrogate marker of postoperative endoscopic recurrence in CD patients. The FC cut-off 150 μg/g appears to have the best overall accuracy. Serial FC evaluations may eliminate or defer the need for colonoscopic evaluation in up to 70% of postoperative CD patients.
Introduction
Surgery to manage stenotic or penetrating complications will be required by at least 30% of patients with Crohn’s disease (CD) once during the course of their disease. 1 Disease recurrence occurs almost inevitably, with 70–90% of patients developing inflammatory lesions within the first postoperative year.2–4 The severity of these lesions, graded by the Rutgeerts score (RS), is associated with the risk of symptomatic disease recurrence. 5 Ileocolonoscopy is considered the reference standard for assessment of endoscopic recurrence and is recommended within the first 6–12 months following surgery. 6 However, it is possible to establish and accurately evaluate postoperative recurrence with non-invasive methods. Imaging modalities such as magnetic resonance enterography (MRE), intestinal ultrasound (IUS) and capsule endoscopy (CE) may provide an accurate assessment of postoperative recurrence at the anastomotic site. 7
Calprotectin is a calcium- and zinc-binding protein which constitutes 60% of neutrophil cytosolic protein. 8 Fecal calprotectin (FC) has demonstrated being a reliable predictor of active bowel inflammation, and is useful for diagnosis of inflammatory bowel disease (IBD) and monitoring response to treatment.9–24 Several studies in recent years demonstrate an excellent correlation between FC levels and endoscopic recurrence.16,22,25–32 However, these studies differ in the FC threshold values used, and it remains unclear which FC levels are most reliably associated with endoscopic recurrence.
The aim of this study was therefore to evaluate the diagnostic accuracy of FC cut-off levels for the detection of postoperative endoscopic recurrence in CD patients, by performing a systematic review and meta-analysis of the current literature.
Methods
A comprehensive literature search was conducted on 22 July 2017 using both PubMed and Embase databases. In order to capture as many citations as possible, a broad search strategy using the following search string was employed: ((((((post-operative) OR postoperative) OR postsurgical) OR post-surgical)) AND calprotectin) AND Crohn’s. All terms were searched as keywords and MeSH headings where available. References of included studies and relevant reviews were manually searched for additional suitable publications.
We included studies which met the following criteria:
(1) studies evaluating postoperative CD patients using both ileocolonoscopy and FC;
(2) adult patients only;
(3) studies that utilized RS for definition of endoscopic recurrence;
(4) studies including at least 15 patients;
(5) those published in full form in peer-reviewed literature.
Data extraction and quality control were performed independently by two reviewers (YST, SF). Any disagreements were resolved by consensus and involvement of the senior authors. Where additional data were required, the corresponding author of the relevant article was contacted by email in an attempt to obtain the necessary data.
Statistical analysis
For each FC threshold value of 50, 100, 150 and 200, as available in each included study, the number of true positive (TP), true negative (TN), false positive (FP) and false negative (FN) results per study was extracted. Ileocolonoscopy was considered the reference standard for all studies and FC thresholds. RS ⩾ 2 was used to define endoscopic recurrence. Where there was insufficient information from the published articles, the authors of the original studies were approached for the relevant additional data.
In the first step, univariate diagnostic accuracy measures of pooled sensitivity, specificity, diagnostic odds ratio (DOR) and positive and negative likelihood ratios (LRs) with 95% confidence intervals (CI) were assessed. The I2 statistic was used to quantify heterogeneity between the included studies. This is a percentage value of the amount of total variation across studies attributable to heterogeneity rather than chance. Low heterogeneity occurs when I2 = 0–25 %, moderate at I2 = 26–50 %, and high at I2 = 51–75% . 33 The Mantel–Haenszel fixed effects model was applied for pooling of summary measures unless heterogeneity was high, when the DerSimonian–Laird random effects model was applied instead. High heterogeneity was assessed by examining the forest plots and systematically removing any outliers seen, to determine if a significant difference was made to the results. Attempts were then made to examine appropriate subgroups to assess whether any subgroups were a source of heterogeneity.
Following this, the bivariate model was then used to assess the relationship between pooled sensitivity and false positive rate (FPR) as an overall measure of diagnostic test accuracy. Bivariate summary receiver operating curves (SROC) of sensitivity versus FPR were plotted as a visual representation of test accuracy at each FC threshold value. Estimated area under the curve (AUC) was used to gauge test accuracy. AUC can range from 0.5 (poor accuracy) to 1.0 (excellent accuracy). Only direct test comparisons were performed. 34 Spearman’s correlation coefficient (rho) was also used to assess the relationship between sensitivity and FPR, where rho ⩾ 0.6 suggests presence of a significant threshold effect. 35
Risk of bias and overall quality of the included studies was assessed using the quality assessment of diagnostic accuracy studies (QUADAS)-2 scale. 36 Statistical analyses in this study were carried out using the meta4diag, 37 mada 38 and INLA 39 packages in R version 3.4.2.
Results
Fifty-four articles were returned in the initial search. These were then screened for potential relevance by title and abstract. One further study was identified by manual search (TOPPIC trial), with 20 papers proceeding to full text review. A final nine studies met inclusion criteria (Figure 1), published between 2006 and 2016. Studies were excluded for the following reasons: pediatric population,41,42 published as a letter, 29 nonuse of RS,15,43 meta-analysis, 22 small sample size (n < 15),44,45 insufficient data regarding FC results despite repeated efforts and contact with study authors 25 (TOPPIC) and extension of previously reported results. 32

Flow diagram detailing process of study selection for this review and meta-analysis.
Of the nine included studies, most were of European origin apart from one study from Australia 31 and another from Japan. 46 All but one were prospective in design; the study by Bachiller and colleagues 47 was a retrospective cross-section observational study. RS = 2–4 (or RS ⩾ 2) was used to define endoscopic recurrence in all studies although Bachiller and colleagues used the definition of RS = 2b–4. 3 The enzyme-linked immunosorbent (ELISA) calprotectin assay was used to quantify FC levels in all included studies. Overall study data are summarized in Table 1.
Summary of data from included studies.

FC, fecal calprotectin; FN, false negatives; FP, false positives; IC, ileocolonoscopy; NS, not specified; pts, patients; Prosp, prospective; RS, Rutgeerts score; TN, true negatives; TP, true positives.
Diagnostic accuracy of fecal calprotectin = 50µg/g
Seven studies with a total of 528 patients provided data on the diagnostic accuracy of FC with threshold 50µg/g. At this value, FC had a sensitivity of 90% (95% CI 83–96%), specificity 36% (95% CI 25–47%), and DOR 5.72 (95% CI 2.41–13.73). The AUC of the SROC (Figure 2) was 0.72.

Summary receiver operating characteristic curve showing diagnostic accuracy for the fecal calprotectin threshold of 50 µg/g.
Diagnostic accuracy of fecal calprotectin = 100 µg/g
All nine included studies, with a total of 588 patients, provided data on the diagnostic accuracy of FC at threshold 100 µg/g. This cut-off had sensitivity of 81% (95% CI 71–91%), specificity 57% (95% CI 48–64%), and DOR 6.35 (95% CI 2.93–13.04). The AUC of the SROC (Figure 3) was 0.67.

Summary receiver operating characteristic curve showing diagnostic accuracy for the fecal calprotectin threshold of 100 µg/g.
Diagnostic accuracy of fecal calprotectin = 150 µg/g
Six studies with 340 patients provided data on the diagnostic accuracy of FC at threshold 150 µg/g. At this level, FC had sensitivity 70% (95% CI 59–81%), specificity 69% (95% CI 61–77%), and DOR 5.92 (95% CI 2.61–12.17). The AUC of the SROC (Figure 4) was 0.73.

Summary receiver operating characteristic curve showing diagnostic accuracy for the fecal calprotectin threshold of 150 µg/g.
Diagnostic accuracy of fecal calprotectin = 200 µg/g
Six studies with 284 patients provided data on the diagnostic accuracy of FC threshold 200 µg/g. The sensitivity of FC at this level was 55% (95% CI 43–69%), specificity 71% (95% CI 62–79%), and DOR 3.32 (95% CI 1.50–7.14). The AUC of the SROC (Figure 5) was 0.69.

Summary receiver operating characteristic curve showing diagnostic accuracy for the fecal calprotectin threshold of 200 µg/g.
A summary of the diagnostic accuracy measures is shown in Table 2. The summary of the pooled diagnostic sensitivity and specificity is depicted in Figure 6.
Summary of diagnostic accuracy measures.
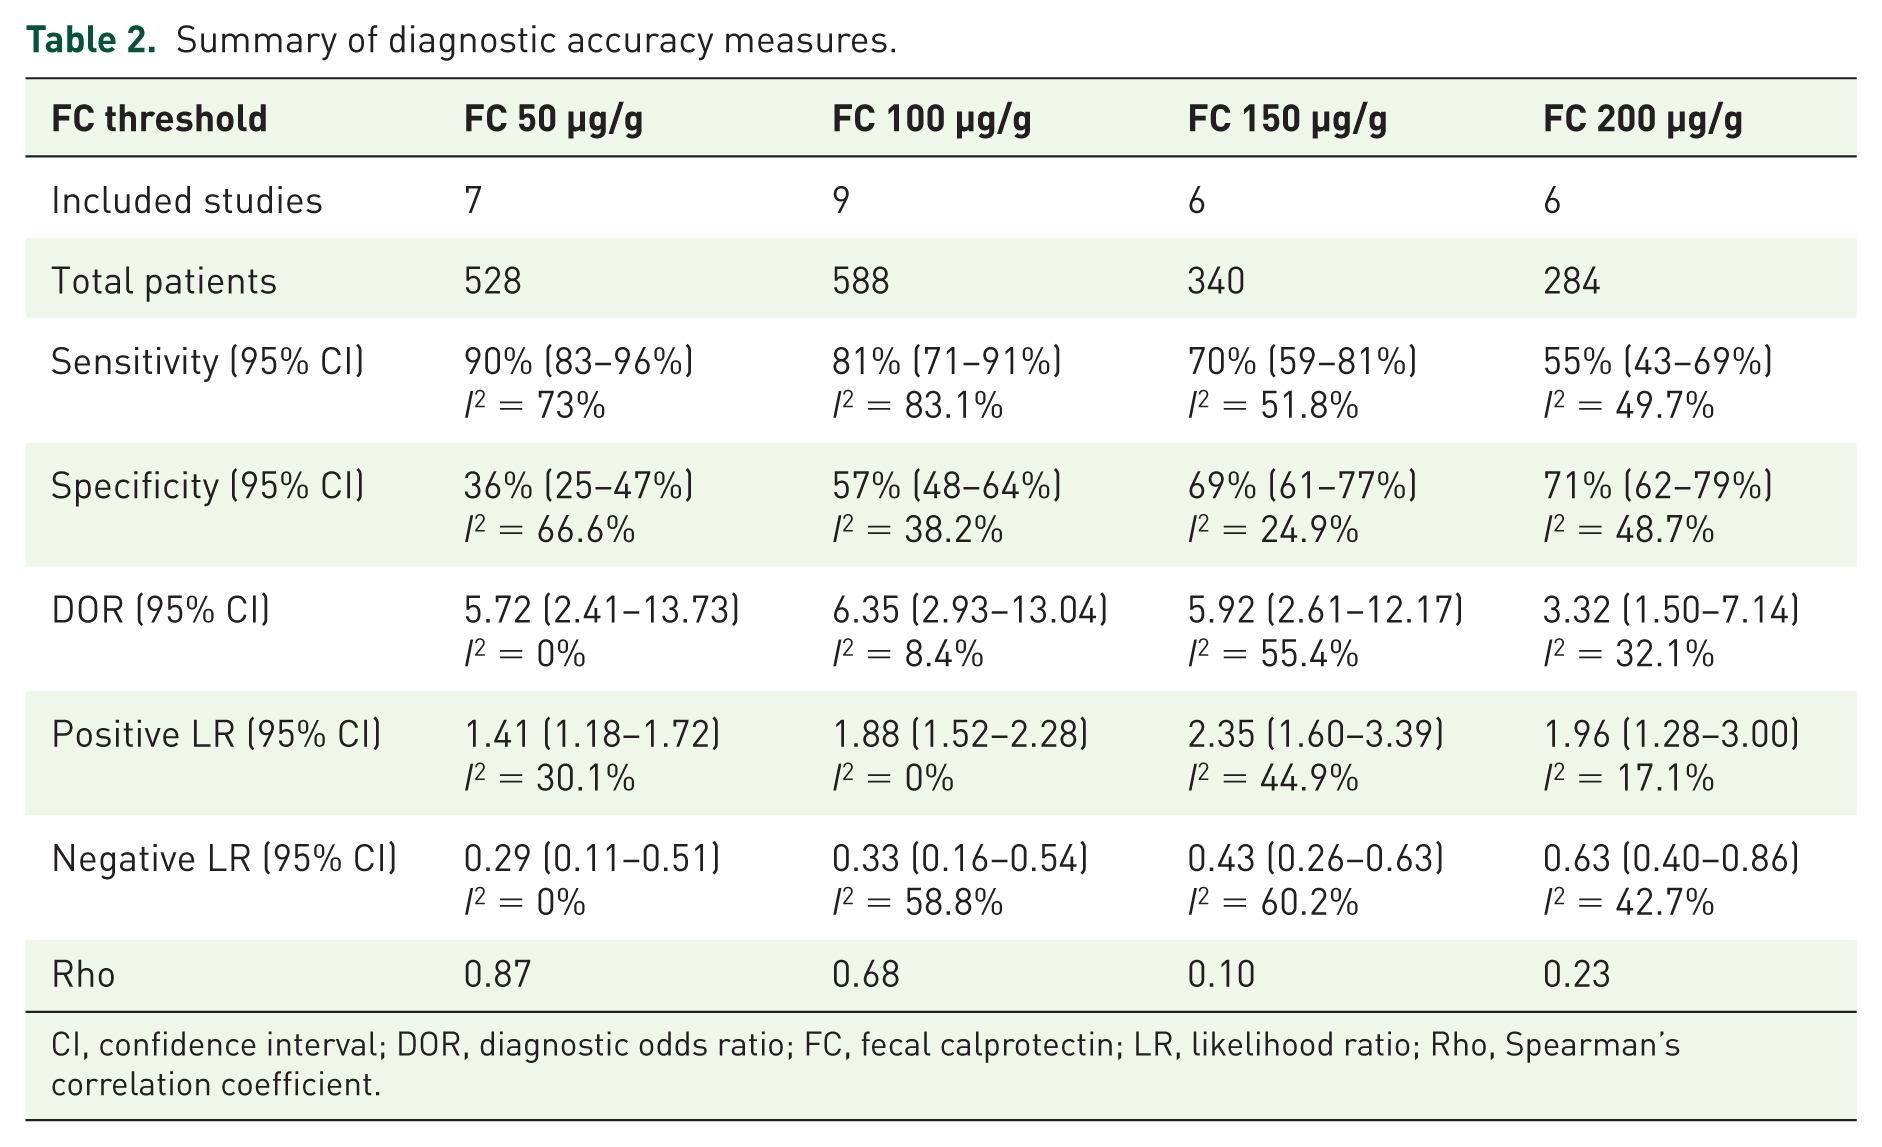
CI, confidence interval; DOR, diagnostic odds ratio; FC, fecal calprotectin; LR, likelihood ratio; Rho, Spearman’s correlation coefficient.

Graph of sensitivities and specificities of the fecal calprotectin cut-off values examined, illustrating threshold effect.
Bias assessment of included studies
A summary of the QUADAS-2 assessment is given in Table 3. The included studies were generally of good quality with mostly low risk of bias.
Quality assessment of included studies using QUADAS-2 framework.

FC, fecal calprotectin; IC, ileocolonoscopy.
Discussion
The results of our meta-analysis confirm the strong correlation between FC levels and postoperative endoscopic recurrence in patients with CD. The pooled available data suggest that a cut-off level of 150 µg/g is associated with optimal diagnostic accuracy for postoperative endoscopic recurrence. Generally, higher cut-off levels were associated with decreasing sensitivity and increasing specificity (Figure 6), illustrating a significant threshold effect.
In CD, disease recurrence after surgery occurs in a significant proportion of patients. 5 Endoscopic recurrence often precedes and predicts clinical recurrence, as well as the possible future need for repeat surgery.3,5 Current guidelines recommend ileocolonoscopy within 6–12 months of surgery; the endoscopic findings, along with clinical risk factors should guide the selection of secondary prevention strategy. 6 However, ileocolonoscopy can be an inconvenient and unpleasant procedure, especially in this patient group, and is associated with not-insignificant procedural risks. Non-invasive monitoring modalities such as IUS, MRE and CE have been shown to be accurate, safe and convenient diagnostic alternatives to endoscopy (IBD paper); 48 however the use of these modalities for routine postoperative surveillance is still not widespread.
FC is an accurate surrogate marker of bowel inflammation and is useful for diagnosis, monitoring of treatment response and early identification of a pending flare.9–23 In a recent meta-analysis, the sensitivity and specificity of FC for detection of endoscopic activity in symptomatic IBD were 88% and 73%, respectively. 21 A treat-to-target strategy guided by FC and CRP levels is associated with superior clinical and endoscopic outcomes, in comparison with symptom-based treatment. 51 Furthermore, in patients undergoing small bowel evaluation for suspected CD following negative ileocolonoscopy, the sensitivity of FC for the presence of small bowel inflammation on CE was 89%. 24
Our results suggest that the optimal cut-off value for FC associated with significant endoscopic recurrence in patients with CD lies within the range 100–150 μg/g. As these cut-offs appear to have similar diagnostic accuracies, and may also be affected by the choice of assay, we suggest that in clinical practice, a range rather than a specific value is addressed. Indeed, in the largest study included in the analysis, 31 the optimal cut-off was determined to be 135 μg/g. However, as this cut-off did not appear in other included studies, we could not perform a formal diagnostic meta-analysis for this particular value. When the value of 150 μg/g is selected, specificity is higher and the AUC of the SROC somewhat superior to that of 100 μg/g. The results of our current analysis suggest that FC may reduce the need for follow-up endoscopies carried out for postoperative surveillance in up to 70% of CD patients, as evidenced by the sensitivity of 70% for detection of RS ⩾ 2 at FC cut-off of 150 μg/g. In addition to the absolute values, a significant change in FC values is another indicator of possible recurrent endoscopic disease activity following surgery. In a recent pediatric study, an FC increase of 79 μg/g compared with the first postoperative value was suggestive of endoscopic recurrence. 42
There are some limitations to our work, most of which are inherent to all diagnostic meta-analyses. Although there was some variability in the diagnostic techniques used across the included studies, importantly, all the included studies utilized quantitative ELISA calprotectin assays. In addition, the definition of endoscopic recurrence had slight differences between included studies; all but one study 47 defined endoscopic recurrence as RS = 2–4 (or RS ⩾ 2), a simplification of the original scoring system which suggested RS 2b as the score associated with significantly higher risk of clinical recurrence. 3 An additional limitation is a moderate reproducibility of RS between observers, especially when differentiating <I2 from ⩾I2 (kappa value of 0.47), which may lead to incorrect therapeutic decisions in >10% of patients. 52 Importantly, however, in a recent large cohort study from Leuven, no difference in the clinical outcomes of patients with RS 2a and 2b was demonstrated, so the importance of such distinction for clinical purposes may not be as significant. 53 Furthermore, our study demonstrates there was a limited number of studies with outcomes which could be pooled, suggesting that larger and more standardized population-level studies on the assessment of postoperative CD recurrence would be more useful in future.
Despite these limitations, our analysis demonstrates that FC is an accurate surrogate marker of postoperative endoscopic recurrence in CD patients. The FC cut-off of 150 μg/g appears to have the best overall accuracy for this indication. Serial calprotectin evaluations may eliminate or defer the need for colonoscopic evaluation for postoperative recurrence surveillance in up to 70% of patients.
Footnotes
Conflicts of interest
UK received consultancy fees from Jannsen, Abbvie, Takeda and CTS; grant support was received from Jannsen and Takeda.
Funding
This research received no specific grant from any funding agency in the public, commercial, or not-for-profit sectors.
Author contributions
UK and AK conceived the study and oversaw the process as a whole. SF, UK and YST performed the database searches. SF, UK, YST and DY extracted the data and YST performed quality analyses of the included studies. DY and YST conducted the statistical analyses. UK drafted the manuscript for submission. SBH, AK, TY and RE reviewed the manuscript and provided invaluable scientific input. All authors reviewed and approved the final manuscript.