
Abstract
Background:
The treatment goal of Crohn’s disease (CD) has moved towards achieving mucosal healing, resolution of transmural inflammation, and normalization of biomarkers. The purpose of this study was to evaluate how well computed tomography enterography (CTE) and fecal calprotectin (FC) correlated with endoscopic activity in newly diagnosed patients with CD and after 1 year of therapy.
Methods:
Consecutive patients with newly diagnosed CD were evaluated by endoscopy, CTE, and FC at diagnosis and 12 months after beginning immunosuppression. Endoscopic severity was assessed using the Simplified Endoscopic Score for Crohn’s Disease (SES-CD). Biomarkers, clinical indexes, and FC were recorded on the day of ileocolonoscopy at diagnosis and 1 year after diagnosis. We adapted a CTE score for disease activity based on radiological signs of inflammation (i.e. mural thickness, mural hyperenhancement, mesenteric fat proliferation, mesenteric fat densification, comb sign, presence of strictures, fistulas, abscesses, ascites, and lymphadenopathy). Correlations between endoscopy, CTE, and FC were assessed using Spearman’s rank correlation.
Results:
A total of 29 patients (48% women; median age 30 (24.5–35.5) years) were included in this prospective cohort. CTE findings significantly correlated with endoscopic findings. Endoscopic remission (ER) at 1-year follow up significantly correlated with improvement in mural hyperenhancement (p = 0.004), mesenteric fat densification (p = 0.001), comb sign (p = 0.004), and strictures (p = 0.008) in CTE. None of the CTE findings improved in patients without ER. FC correlated with SES-CD (rs = 0.696, p < 0.001) and with CTE features of inflammation (rs = 0.596, p < 0.001). A cut-off of 100 µg/g predicted ER with 92% sensitivity, 65% specificity, and 83% accuracy (area under curve 0.878, p < 0.001).
Conclusions:
CTE findings and FC levels correlated with endoscopic activity in CD both at diagnosis and at 1-year follow up. These two noninvasive markers of disease activity may be used as an alternative to endoscopy to monitor disease response to therapy.
Keywords
Introduction
Crohn’s disease (CD) is a chronic relapsing inflammatory bowel disease (IBD) characterized by transmural inflammation often affecting multiple sites of the gastrointestinal tract. 1 In recent decades, treatment goals in CD have evolved greatly 2 ; although symptomatic control was once considered the goal of therapy, with the introduction of antitumor necrosis factor (TNF)-α agents in the 1990s, endoscopic remission (ER) and histological remission, both reflecting mucosal healing, have become accepted therapeutic targets.3,4 A wealth of data suggest that mucosal healing may alter the natural course of disease by decreasing the rates of hospitalization and reducing the need for surgery.5,6 However, since CD often affects the small bowel beyond the terminal ileum, ileocolonoscopy alone may be inadequate for the correct evaluation of mucosal inflammation in CD. 7
Cross-sectional imaging including computed tomography enterography (CTE) and magnetic resonance enterography (MRE) have been introduced recently into clinical practice and have emerged as preferred modalities for the evaluation of small bowel involvement in CD. 8 These imaging modalities not only allow the accurate assessment of small bowel disease activity, extent, and location, but also aid in diagnosing extraluminal manifestations and CD complications during a single examination.8,9 CTE and MRE perform similarly in the assessment of disease, 10 but inter-observer agreement and image quality may be superior with CTE.11,12 In a preliminary study, Hara and colleagues reported that CTE may also have the potential for longitudinal disease monitoring, noting its reliability in predicting CD progression or regression. 13 In addition, a more recent retrospective study showed that 63% of patients had a significant radiological response to anti-TNF-α agents as assessed by serial CTEs. 14 However, this study was marred by its retrospective nature and by the fact that repeated CTE was performed in symptomatic patients only, 14 and therefore the real accuracy of CTE to assess therapeutic responses remains to be prospectively assessed.
Fecal calprotectin (FC), a 36 kDa calcium- and zinc-binding protein complex derived from leukocytes infiltrating the intestinal wall, has recently emerged as a noninvasive biomarker of intestinal inflammation. 15 Several studies have shown that FC reflects endoscopic disease activity in CD, predicting endoscopic inflammation and being a surrogate marker of mucosal healing.16,17 However, the most appropriate cut-off value for FC to predict endoscopic activity in patients with clinical remission has yet to be determined.
Despite their widespread availability in clinical practice, the performance of CTE and FC compared with endoscopy as diagnostic tools and/or as measures to evaluate therapeutic response in CD are yet to be determined. This prospective study was designed to evaluate the correlation between endoscopic disease activity, fecal markers, and CTE findings of inflammatory activity in newly diagnosed patients with CD and 1 year after initiation of immunosuppressive therapy.
Materials and methods
Patients
Consecutive newly diagnosed adult patients with CD were prospectively enrolled between January 2013 and October 2014 at Centro Hospitalar Sao Joao in Porto, Portugal. Patients were included if the following criteria were met: (a) a definitive diagnosis of CD based on accepted clinical, radiological, endoscopic, and histological criteria 18 ; (b) therapy required with steroids, azathioprine, and/or anti-TNF-α agents; (c) presence of endoscopic activity, defined by a Simplified Endoscopic Score for CD (SES-CD) >3 points. 19 Patients younger than 18 years old, or patients who were pregnant, needed immediate surgery, or did not have endoscopically active disease at the time of enrollment were excluded.
Eligible patients underwent ileocolonoscopy, CTE, and FC determination at diagnosis and at 1 year of follow up. Time between ileocolonoscopy and CTE was less than 4 weeks and no therapeutic changes were performed during that time period. Considering strict inclusion and exclusion criteria, sample size at the end of the recruitment period was 29 patients.
Disease phenotype was determined according to the Montreal classification. 20 Smoking habits, Harvey–Bradshaw index (HBI), and laboratory workup at diagnosis and at 1 year of follow up were recorded. An HBI score <5 was considered as clinically inactive disease, and a two-point drop on HBI was considered as disease improvement.
Endoscopy
Ileocolonoscopy was performed under propofol sedation by a single board-certified gastroenterologist experienced in the endoscopic examination of patients with CD. All patients had the distance of the ileum scoped–specified in their endoscopic report, with a median distance of 10 cm. A solution of polyethylene glycol was used the night before for bowel preparation. Endoscopic lesions were assessed using the SES-CD. 19 ER was defined in the protocol as a SES-CD of ≤ 3.
CTE technique
All CTE were performed at our institution, using a 64 row-multidetector CT Siemens Somaton Sensation scanner (Erlangen, Germany) under American College of Radiology guidelines for CTE. Axial, coronal, and sagittal images 2 mm in thickness were obtained.
Patients were asked to be nil by mouth for 6 h before the procedure. Just before scanning patients were asked to drink 2000 ml of water with 40 g of mannitol (200 ml Baxter solution with 20% of mannitol diluted with 1800 ml water), over 60 min, at a steady rate of approximately 500 ml every 15 min. Contrast-enhanced CT images were acquired at enteric phase 50 s after intravenous injection of 80 ml of ioversol (Optiray 320, Mallinckrodt Canada, Quebec, Canada). CTE images were analyzed using transverse and multiplanar views. Multiplanar images were reconstructed with 2 mm slice thickness.
CTE image interpretation
Images were evaluated using the PACS system (SECTRA AB, Linköping, Sweden). Radiological interpretation and scoring were performed by a senior radiologist with more than 8 years of experience dedicated to IBD imaging. He was blinded to all the clinical, laboratory, and endoscopic data and was asked to identify all bowel segments with signs of inflammation. Six CT signs of active CD (mural thickness, mural hyperenhancement, mesenteric fat proliferation, mesenteric fat densification, comb sign, and presence of strictures) were evaluated in five predefined ileocolonic segments (ileum, right colon, transverse colon, left colon, and rectum). 21 Mural thickening was assumed for a small bowel wall thickness of more than 3 mm in a distended loop. Stricture was suggested when there was visual luminal narrowing and upstream bowel dilation of more than 30 mm. Each variable was scored as either 0 (absent) or 1 (present) per segment. In addition, fistulas, abscesses, ascites, and lymphadenopathy were globally scored as either 0 (absent) or 1 (present). Thus, the total CTE score was 34.
FC
Stool samples were collected the day before beginning bowel preparation (preferably from the first stool in the morning) and then kept in the fridge until they were brought to the hospital. Within a maximum of 7 days after collection, stools were extracted in accordance with the manufacturer’s instructions, using a fecal sample preparation kit (Roche Diagnostics, Mannheim, Germany). Sample extracts were stored at -80ºC until the assays were performed at the Department of Pharmacology and Therapeutics, Faculty of Medicine of the University of Porto. Samples were thawed and analyzed using a commercially available fluoroenzyme immunoassay (EliA Calprotectin®, ThermoFisher Scientific, Freiburg, Germany).
Statistical analysis
Categorical variables were described through absolute and relative frequencies and continuous variables were described as median and interquartile range (IQR). McNemar’s test was used to compare paired samples. The Spearman’s rank correlation coefficient was applied for assessing the correlations between CTE score and SES-CD, HBI, FC, as well as other laboratory parameters.
Receiver operating characteristic (ROC) analysis was applied for determining the optimal cut-off values with the sensitivity and specificity based on the ER (SES-CD ⩽3). All the reported p values were two-sided, and p values of < 0.05 were considered statistically significant. All data were arranged, processed, and analyzed with the Statistical Package for Social Sciences (SPSS ®) v.20.0 data (SPSS Inc., Chicago, IL, USA).
Ethical considerations
This study was conducted according to the Declaration of Helsinki. The study protocols were approved by the Ethics Committee of Centro Hospitalar São João, Porto, Portugal on 27 February 2012 (ethics approval number 145/12 and 84/12). All patients gave informed consent to participate in this study in accordance with the local institutional board regulations.
Results
Population
A total of 29 newly diagnosed patients with CD were enrolled. Table 1 depicts baseline demographic characteristics. A total of 14 (48%) patients were women with a median age of age 30 (24.5–35.5) years. At diagnosis, nearly all patients (n = 28, 97%) were aged between 17 years and 40 years. A total of 19 (65.5%) patients had exclusively ileal involvement (L1) and 14 (48%) had nonstricturing nonpenetrating behavior. Seven (24%) had evidence of perianal disease. A total of 10 (34%) patients were smokers while 2 (7%) were former smokers. All patients had clinical and endoscopic active disease at baseline, with a median SES-CD score of 10.7–16
Baseline characteristic of patients with Crohn’s disease.

CTE, computed tomography enterography; IQR, interquartile range; SES-CD, Simplified Endoscopic Score for Crohn’s Disease.
All patients received systemic steroids (equivalent to prednisolone 1 mg/kg) at diagnosis after all the contraindications were solved (e.g. abscesses in three patients). Around 97% (n = 28) of patients were started on azathioprine, while 62% (n = 18) started biologic therapy (infliximab: 11; adalimumab: 6), with treatment starting at a median of 9 (1.25–37.5) days and 162 (88.25–290.75) days after diagnosis, respectively (Figure 1).

Study flowchart.
At 1-year follow up 24 (83%) patients were in clinical remission, with a median HBI of 1 (0.0–2.0) and 19 (66%) patients were in ER. Compared with baseline, median values of hemoglobin and albumin were significantly higher at 1-year follow up, while C-reactive protein levels were significantly lower (Table 2).
Laboratory workup, Simplified Endoscopic Score for Crohn’s Disease, and computed tomography enterography score changes between baseline and at 1 year of follow up.
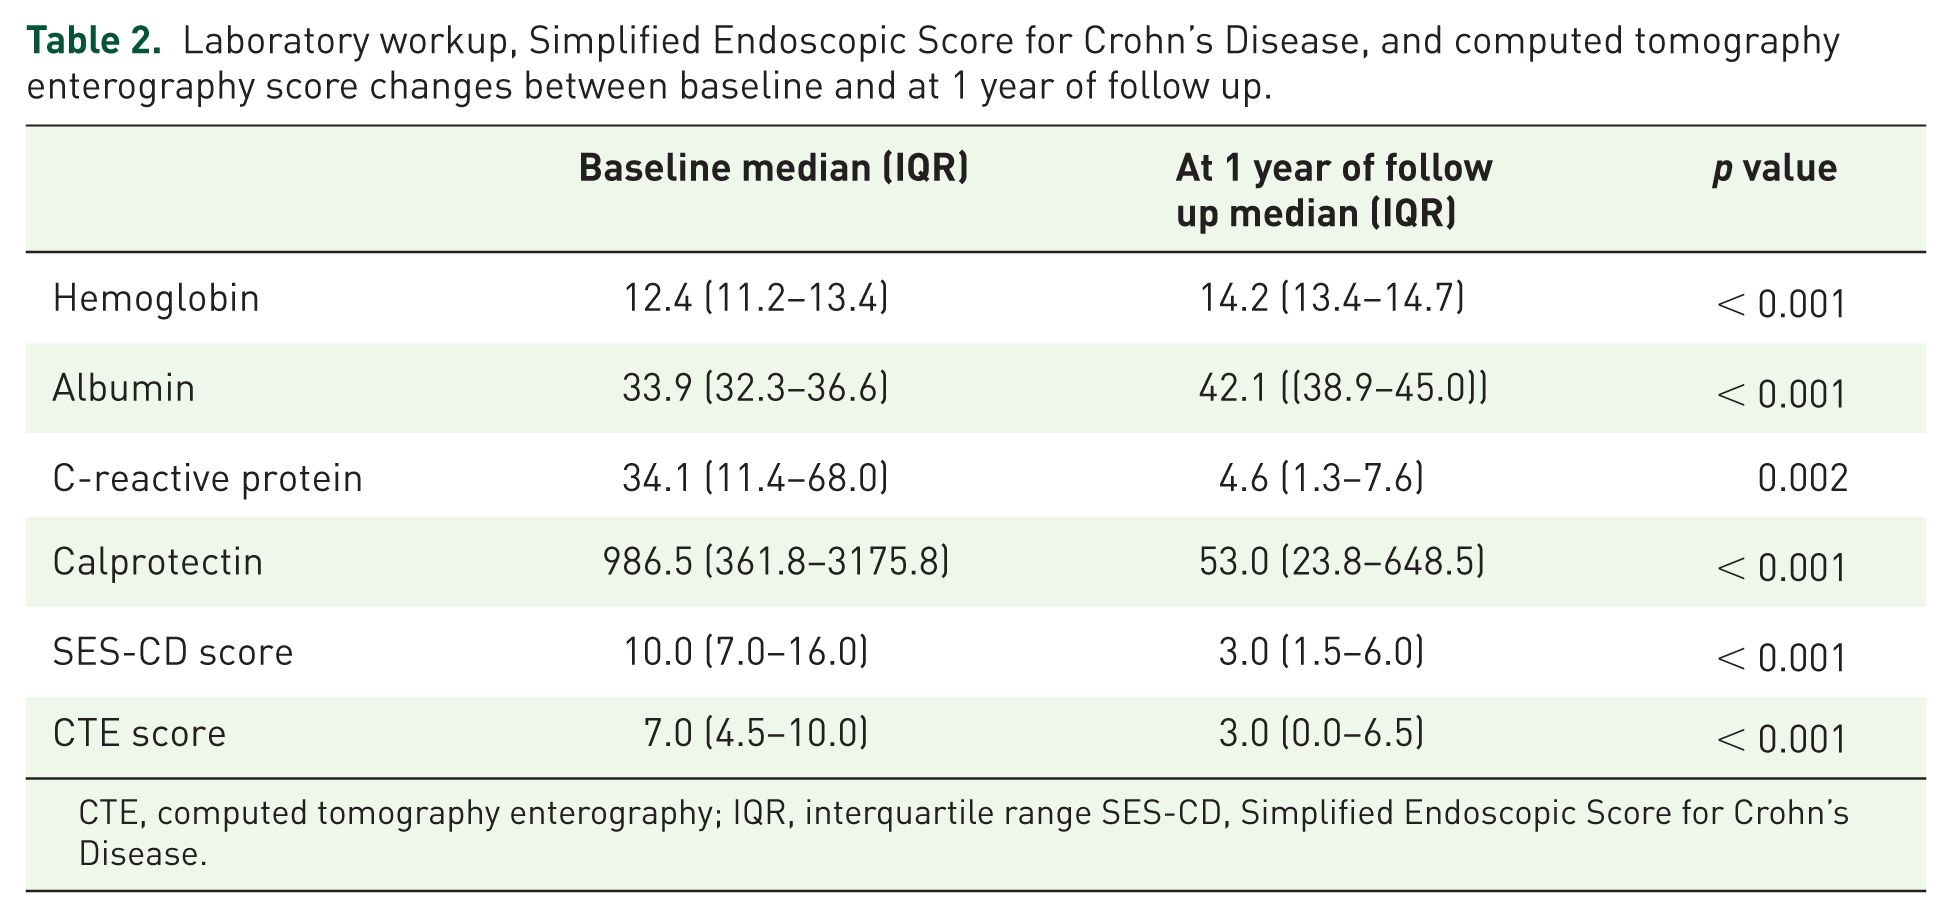
CTE, computed tomography enterography; IQR, interquartile range SES-CD, Simplified Endoscopic Score for Crohn’s Disease.
Comparison of colonoscopy and CTE findings
At baseline, all patients had ileal involvement at CTE, with 59% (n = 17) having exclusively ileal involvement, while 24% (n = 7) had two different locations involved, 10% (n = 3) three different locations involved, and 7% (n = 2) four different locations involved. Around 17% of patients (n = 5) had disease proximal to the reach of the colonoscope.
CTE findings at baseline showed mural thickening and hyperenhancement in 29 (100%) and 28 (97%) patients, respectively. A total of 21 (72%) patients presented fat densification and comb sign of at least one bowel segment. Strictures were observed in 18 (62%) patients. Fistulas were identified in nine (31%) patients and abscesses in three (10%) patients.
Most of the CTE findings improved at 1 year of follow up. Baseline and 1-year follow up individual CTE findings are shown in Table 3. An example of a patient’s endoscopic findings and corresponding CTE images at baseline and at 1 year of follow up are shown in Figures 2 and 3, respectively.
Changes in computed tomography enterography findings between baseline and at 1 year of follow up considering endoscopic activity.


Endoscopic findings at baseline (a and b) and corresponding computed tomography enterography images (c, d, e, and f).
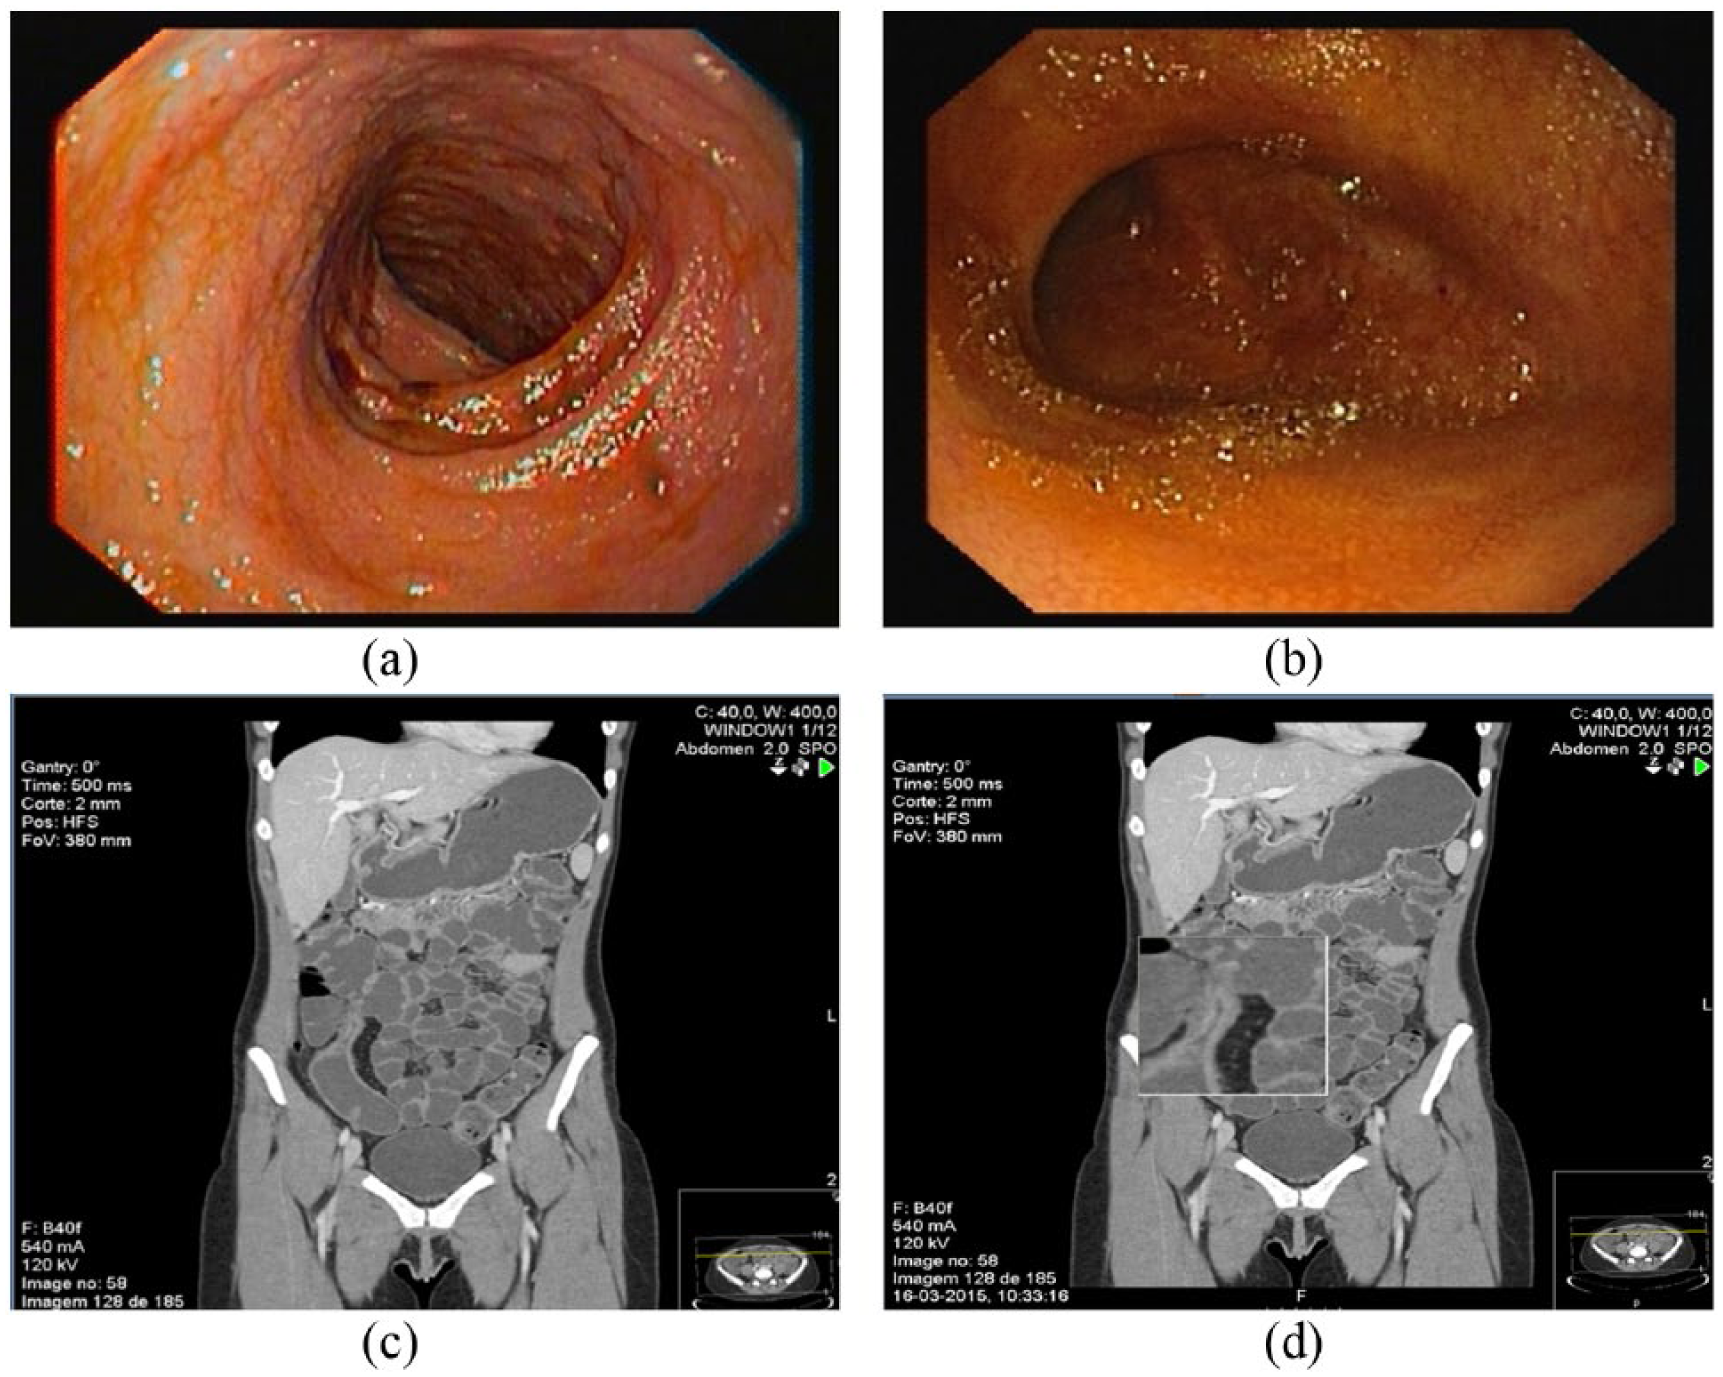
Endoscopic findings after 1 year of follow up (a and b) and corresponding computed tomography enterography images (c and d).
ER at 1-year follow up was significantly associated with improvement in mural hyperenhancement (p = 0.004), mesenteric fat densification (p = 0.001), comb’s sign (p = 0.004), and strictures (p = 0.008) in CTE. None of the CTE findings improved in patients without ER (Table 3). Five patients in ER showed complete disappearance of disease signs at CTE.
CTE score and correlation with clinical, laboratory and endoscopic parameters.
At diagnosis, the median CTE score was 7.0 (4.5–10.0), while at 1-year follow up it decreased to 3.0 (0.0–6.5; p < 0.001). The CTE score showed significant correlation with either HBI (rs = 0.787, p < 0.001), SES-CD score (rs = 0.746, p < 0.001), C-reactive protein (rs = 0.671, p < 0.001), and hemoglobin (rs = −0.580, p < 0.001).
FC and correlation with clinical and laboratory parameters and CTE findings/CTE score
At diagnosis, the median FC value was 986.5 (361.8–3175.8), while at 1-year follow up it decreased to 53.0 (23.8–648.5; p < 0.001). FC significantly correlated with HBI (rs = 0.450, p = 0.001), SES-CD score (rs = 0.696, p < 0.001), C-reactive protein (rs = 0.609, p < 0.001), CTE score (rs = 0.596, p < 0.001), and hemoglobin (rs = -0.383, p = 0.003). The location of the disease did not influence the accuracy of FC (L1 [rs = 0.695, p < 0.001] and L3 [rs = 0.678, p < 0.001]). We found that FC significantly correlated with the same CTE variables that reflected endoscopic activity: mural hyperenhancement (rs = 0.458, p < 0.001), fat densification (rs = 0.508, p < 0.001), comb’s sign (rs = 0.437, p = 0.001), and strictures (rs = 0.329, p = 0.012); in addition, FC also correlated with the presence of lymphadenopathy (rs = 0.426, p = 0.001). CTE findings distributed per ileocolonic segment at baseline and after 1 year of follow up are depicted in a supplementary table.
Higher values of FC significantly correlated with a higher number of CTE findings per ileocolonic segment (rs = 0.521, p < 0.001).
FC, CTE, and ER
A total of 19 patients were in ER at 1-year follow up. Patients in ER had lower C-reactive protein levels (3 mg/L [0.2–16.4] versus 20.1 mg/L [0.7–125.7]; p < 0.001), lower FC levels (42.1 [2.6–1208] versus 857 [26.7–10600]; p < 0.001), an HBI < 5 (94.7% versus 15.4%; p < 0.001), and a CTE score ⩽ 3 (73.7% versus 12.8%; p < 0.001).
In ROC analyses (Figure 4), ER at ileocolonoscopy was predicted by a CTE score of 3 points or lower with 87.2% sensitivity, 73.7% specificity, 87.2% positive predictive value (PPV), 73.7% negative predictive value (NPV), and 82.8% accuracy (AUCROC 0.866; p < 0.001, 95% confidence interval [CI] 0.761–0.970), and by a FC value of less than 100 µg/g with 92.1% sensitivity, 65% specificity, 83.3% PPV, 81.3% NPV, and 82.7% accuracy (AUCROC 0.878; 95% CI 0.781–0.976, p < 0.001).
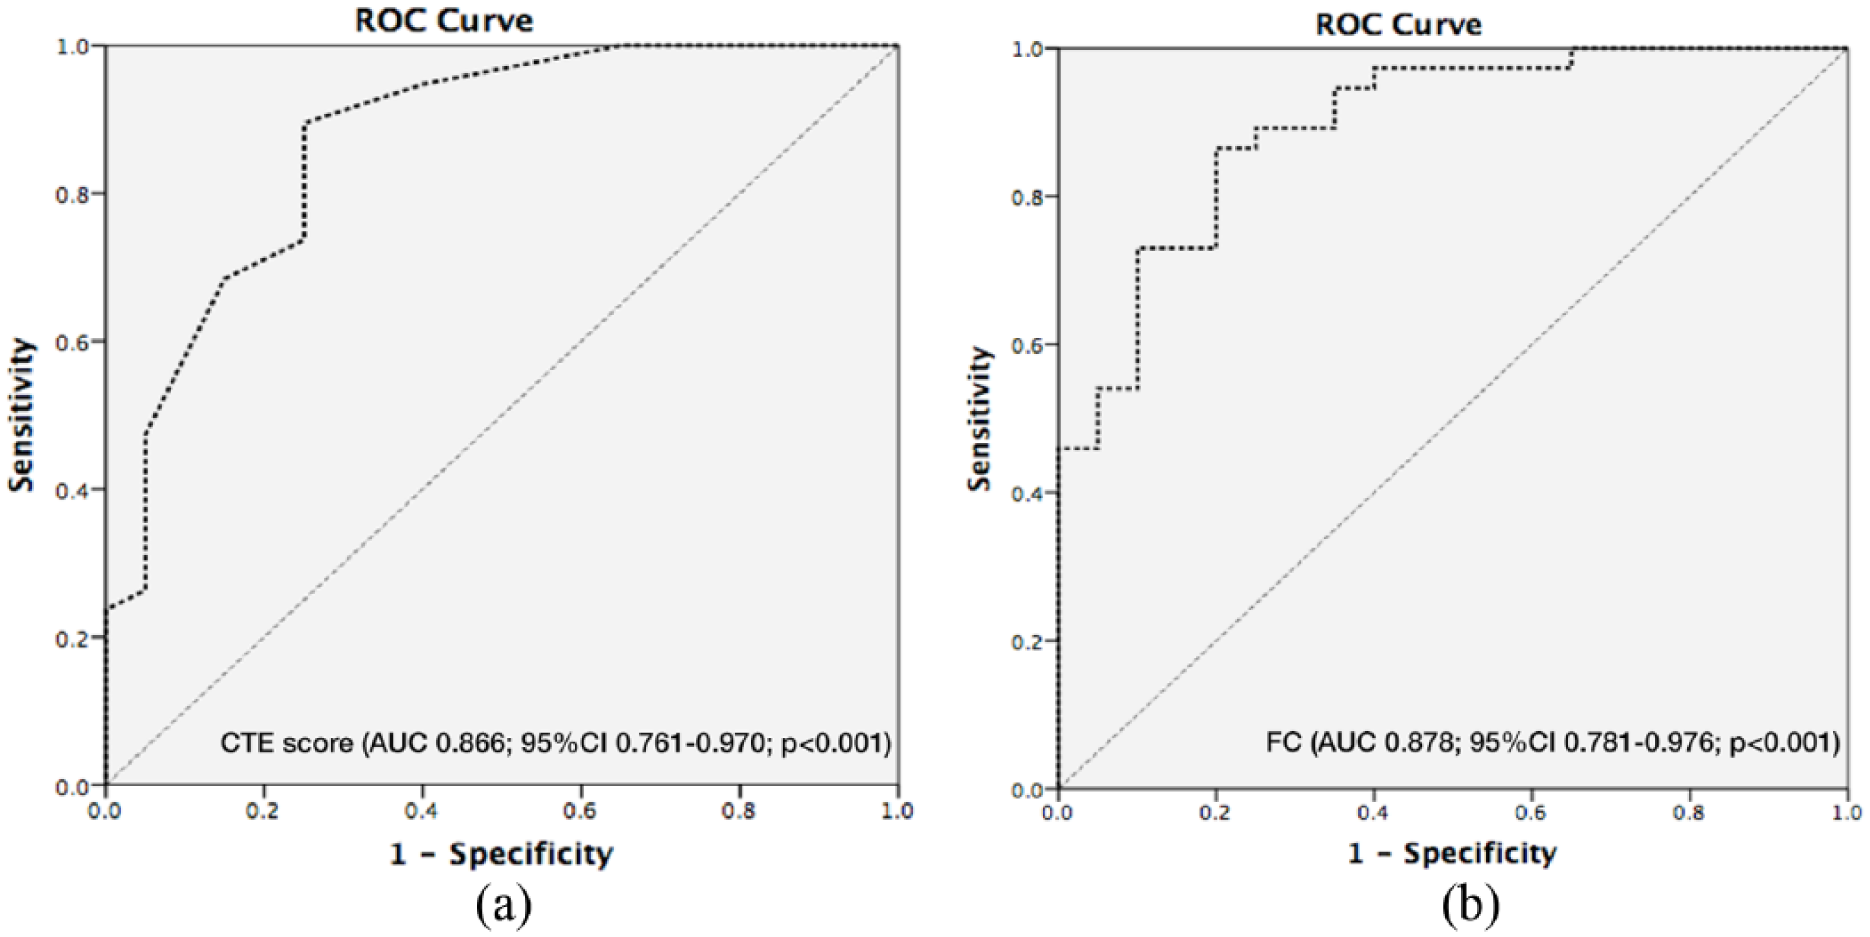
Receiver operating characteristic (ROC) curves for computed tomography enterography score (a) and fecal calprotectin (b) for discriminating between endoscopic activity and remission.
With the aim of simplifying the application of these results on a daily basis so a likelihood of ER at ileocolonoscopy could be achieved, a model combining FC value and CTE score was created by applying the following logistic function:

Assuming a sensitivity of 89.5% and a specificity of 89.7%, we consider the cut-off of -0.3146 as clinically relevant, with a PPV of 94.6%, an NPV of 80.9%, and an accuracy of 89.6%, regarding likelihood of ER at ileocolonoscopy (AUROC 0.946; 95% CI 0.892–1.000).
Discussion
In this study we showed that CTE findings and FC levels mirror endoscopic activity in newly diagnosed patients with CD. In addition, both CTE findings and FC levels are able to predict ER at1 year suggesting that these two noninvasive markers of disease activity may be used as an alternative to endoscopy to monitor disease response to therapy.
As the paradigm in CD treatment has shifted from clinical response to ‘bowel healing’ (mucosal and transmural healing), it is now essential to define the best way to monitor disease activity. Attempts to correlate outcomes with radiological signs of inflammation have produced variable findings.22–26 However, most studies have focused on mural findings rather than on mesenteric signs of inflammation. 12 It is known that at least some of the mural thickening observed despite ER may not be due to active inflammation, but rather histological alterations secondary to transmural healing.27,28 We have therefore adapted a CTE scoring system that also factored features such as mural hyperenhancement, mesenteric fat proliferation and densification, and the comb sign, since these CTE findings are closely related to inflammation. 9 In this work we were able to establish a strong correlation not only between mural findings but also mesenteric findings of inflammation (comb sign and fat densification) and endoscopic activity defined by SES-CD. Previous studies25,27 have also described the comb sign, enlarged lymph nodes, and increased fat density as good markers of endoscopic and histological activity. These studies suggested that the CTE variables associated with more severe endoscopic disease were mesenteric in origin rather than mural. In line with these findings, here we have shown that fat densification, comb sign, and mural hyperenhancement are the best predictors of disease activity in CD. In addition, we found a significant reversal in CTE signs of inflammation 1 year after treatment, reflecting disease response to immunosuppressive therapy. This radiological improvement correlated significantly with clinical response as assessed by the HBI. Lastly, CTE score accurately predicted ER.
On the other hand, FC has proved to correlate with disease activity and to be a good predictor of disease relapse and recurrence.29–31 A better correlation between SES-CD and FC than with serological markers has also been demonstrated.17,32 Our group has recently shown that FC performed better than C-reactive protein in predicting endoscopic activity in the postoperative setting. 33 In the current study, we show that FC significantly correlated with both endoscopic activity and CTE findings. Defining ER as a SES-CD ⩽ 3, we found FC to have 92% sensitivity and 65% specificity for predicting ER at a cut-off value of 100 µg/g. Interestingly, disease location seemed not to influence the diagnostic performance of FC.
One limitation that could be pointed out in this study is the use of CTE to monitor CD, with regard to radiation concern. Although MRE has emerged as a nonionizing alternative method to CTE 34 not all centers have MRE readily available. CTE is cheaper, more readily accessible, faster, with higher spatial resolution, and better tolerated by patients. CTE may even be superior compared with MRE in terms of image quality and inter-observer agreement. Nowadays there are several strategies available to reduce radiation dose exposure with no compromise of diagnostic accuracy. Nevertheless, cumulative radiation exposure of patients with CD undergoing repeated CT examination needs to be carefully considered.
Another limitation of this study is the single reader analysis of CTE images, as we know that CTE interpretation is subject to inter-observer variation, the use of a CTE score not yet validated (but actually no CTE score is validated), and also the relative small simple size.
In conclusion, FC and CTE are good markers of disease activity in CD. In this group of newly diagnosed patients we found a good correlation between FC and SES-CD and CTE score, and between SES-CD and CTE score. Both FC and CTE score significantly improved at 1 year of follow up after beginning immunosuppressive therapy and strongly correlated with endoscopic findings. A CTE score of 3 points or lower and a FC lower than 100 µg/g accurately predicted ER at 1 year of follow up. Therefore, CTE and FC could be used as alternatives to endoscopic evaluation in newly diagnosed patients with CD to monitor response to therapy.
Supplemental Material
Supplementary_table – Supplemental material for Monitoring Crohn’s disease activity: endoscopy, fecal markers and computed tomography enterography
Supplemental material, Supplementary_table for Monitoring Crohn’s disease activity: endoscopy, fecal markers and computed tomography enterography by Susana Lopes, Patrícia Andrade, Joana Afonso, Rui Cunha, Eduardo Rodrigues Pinto, Isabel Ramos, Guilherme Macedo and Fernando Magro in Therapeutic Advances in Gastroenterology
Footnotes
Acknowledgements
SL contributed to the study design and conception, data collection, and drafting of the manuscript. PA contributed to data collection and statistical analysis. JA performed all laboratory procedures. ERP contributed to statistical analysis. RC and IR performed all radiological analysis. GM supervised the study and revised the manuscript. FM contributed to study design and conception, supervised the study, and revised the manuscript.
Funding
This study was partially supported by a grant from GEDII.
Conflict of interest statement
The authors declare no conflicts of interest in preparing this article.
References
Supplementary Material
Please find the following supplemental material available below.
For Open Access articles published under a Creative Commons License, all supplemental material carries the same license as the article it is associated with.
For non-Open Access articles published, all supplemental material carries a non-exclusive license, and permission requests for re-use of supplemental material or any part of supplemental material shall be sent directly to the copyright owner as specified in the copyright notice associated with the article.