
Abstract
Inventory management is central to efficient management systems for increased productivity and tracking of resources. Industry 4.0 (I4.0) revolutionises the manufacturing sector by integrating advanced digital technologies like the Internet of Things (IoT), leading to smart factories with enhanced efficiency and flexibility. Inventory management compliments this transformation, particularly if it includes tracking technology and Visual Management Systems (VMS), which convert tracking data into actionable insights, optimising processes and reducing waste. This paper presents a novel application of Radio Frequency Identification (RFID) tracking technology in conjunction with a Business Intelligence (BI) VMS for tracking inventory trolleys within a large-scale aerospace manufacturing environment. An RFID-VMS system including passive RFID cards, a USB hub for remote connection and a Power BI VMS were implemented providing intuitive key performance indicator (KPI) visuals, mobile accessibility and increased production line efficiency by 45%. Missed takt times decreased by 52.2% and line stops decreased by 75% indicating substantial improvements in maintaining the production schedule and reducing interruptions. The prototype implementation cost $600 covering RFID hardware, software, and infrastructure updates. Scaling to a full production line would require an estimated investment of $36,000 with a projected annual waste cost reduction of approximately $2.45 million. The number of blue cards increased by 7.9% reflecting an increase in throughput and production efficiency. As a result, the system supports sustainability by reducing operational waste and optimising inventory management, aligning with UN Sustainable Development Goals (9: Industry, Innovation, and Infrastructure and 12: Responsible Consumption and Production) and promoting economic growth. This simple, yet effective system framework could be applied to a number of sectors where materials must be tracked and recorded into and out of different locations at different intervals.
Introduction
The implications of Industry 4.0 (I4.0) for the manufacturing sector are profound, prompting industries to move towards smarter, more autonomous operations from design through to production. This can include sustainable manufacturing practices which optimise resource utilisation (Casella et al., 2022). This transition gives rise to smart factories, characterised by highly automated and interconnected production systems, with enhanced operational efficiency, reduced downtime and increased flexibility (Bottani & Bertolini, 2009). These smart factory operations use data to reduce costs through operations planning, enhanced productivity and supply chain and distribution optimisation. Examples can include real-time visibility of inventory and demand data (Geary & Cosgrove, 2022; Qu et al., 2019). I4.0 works on interconnectivity, facilitated by the Internet of Things (IoT), enabling real-time data transfer across machines, devices and systems within the manufacturing ecosystem (Chellaswamy et al., 2021; Harish et al., 2024). The incorporation of advanced digital technologies into manufacturing operations and the introduction of data analytics and automation create significant advances towards Industry 4.0 (I4.0) (Havard et al., 2021; Tadayonrad & Ndiaye, 2023). While I4.0 allows for new technological advancements, ongoing research is seeking to address challenges with regards to security and data privacy. I4.0 is being implemented across diverse industries such as healthcare, automotive and aerospace. Research has proposed the use of IoT with tracking technology to simplify existing inventory tracking processes and enhance its effectiveness throughout the supply chain (Chanchaichujit et al., 2020; Sahay, 2012).
Inventory Management in Manufacturing
Inventory management accounts for approximately 50% of logistics costs within a company (Hassan & Piramuthu, 2021), underlining the importance of an efficient management system for increased productivity and tracking of resources. Tracking technologies collect data on movement, condition and status of objects and assets (Chellaswamy et al., 2021) and play an essential role in inventory management (Berling & Sonntag, 2022; Camdereli & Swaminathan, 2010).
A number of studies have investigated the use of tracking technologies within inventory management (Al-Momani et al., 2020; Jadhav & Jaybhaye, 2020; Rekik et al., 2008; Wang et al., 2008; Zhu et al., 2020;) . For example, multiple studies have assessed the benefits of tracking in supply chain traceability and inventory loss reduction (Jadhav & Jaybhaye, 2020; Wang et al., 2008). Other works have modelled the effect of inventory management systems with inaccuracies and identified potential routes to inventory cost reductions (Rekik, Sahin, & Dallery, 2008). Al-Momani et al. (Al-Momani et al., 2020) defined the unique nature of inventory management in aviation and popular inventory management strategies within it, such as material requirement planning (MRP) (Srebrenkoska et al., 2023), Kanban systems (Ghelichi & Abdelgawad, 2014; Thomas et al., 2015) and Just-In-Time (JIT) (Qu et al., 2012; Xu & Chen, 2018). Different tracking technologies have been assessed in literature and can include Global Positioning Systems (GPS) (Grau et al., 2009; Sardroud et al., 2010), Radio Frequency Identification (RFID) (Sobral et al., 2018; Yuan et al., 2017) and Quick Response (QR) codes (Shukran et al., 2017; Tsai & Hung, 2023). Studies have concluded that QR codes are a convenient way to display a small amount of information that is easily navigated and processed. However, opposing research indicates that they are manual processes and do not provide real-time data regarding the location of inventory (M’hand et al., 2019).
GPS tracking technology relies on satellite signals for location tracking over large areas, while Real Time Location Systems (RTLS) use local sensors for precise indoor or small-scale tracking (Thiede et al., 2022). The technology used for inventory tracking is dependent on the environment; GPS is better suited for outdoor or extensive spaces, while RTLS excels in indoor settings with a need for high accuracy and real-time tracking ((M’hand et al., 2019; Thiede et al., 2022). While real-time location tracking and data collection is enabled through QR codes, GPS and RTLS, tracking technology without a line-of-sight requirement is preferable. As such, Radio-Frequency Identification (RFID) technology is considered more suitable for inventory management (Camdereli & Swaminathan, 2010; Casella et al., 2022; Jadhav & Jaybhaye, 2020).
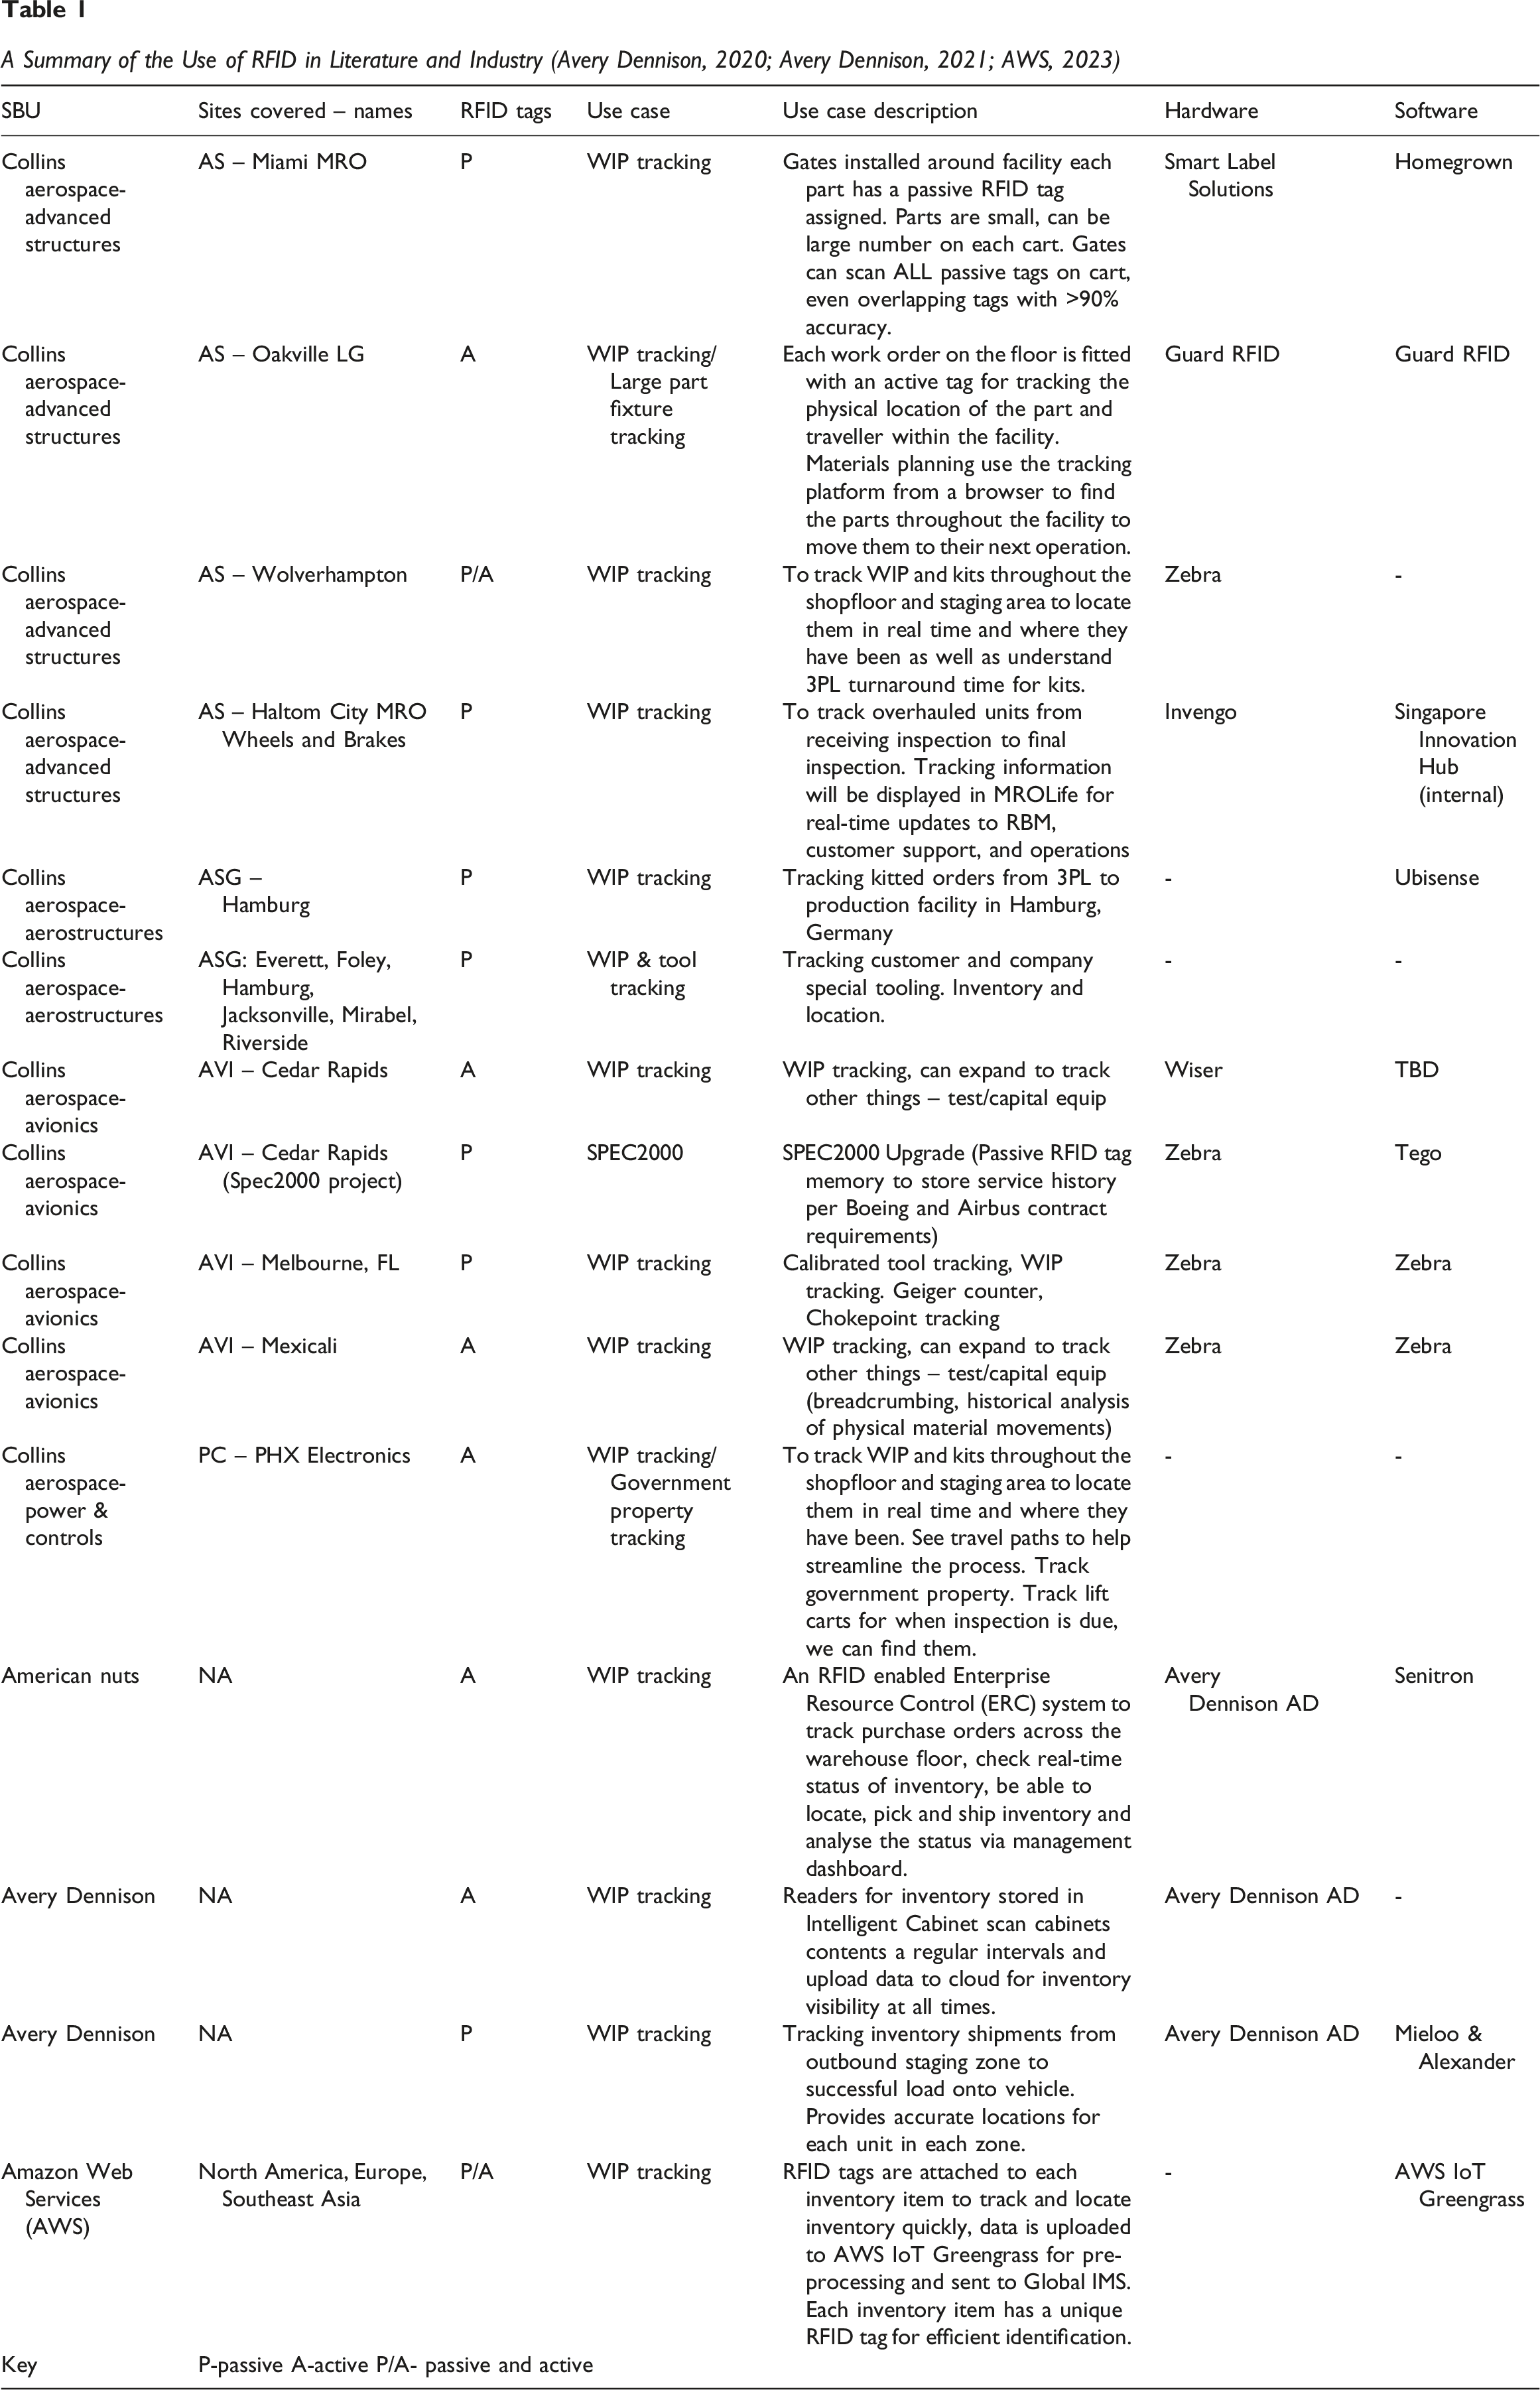
A Summary of the Use of RFID in Literature and Industry (Avery Dennison, 2020; Avery Dennison, 2021; AWS, 2023)
Visual Management Systems
Visual management systems aid the identification of production issues, by converting raw data, such as tracking data/locations, to valuable visual insights, mitigating waste and detecting anomalies, while increasing process transparency and enabling the transfer of information between stakeholders (Mittal et al., 2020; Tezel et al., 2016).
Data displays are widely adopted in I4.0 systems utilising digital information display VMS. These displays, commonly referred to as dashboards, provide real-time data on KPI’s and production line efficiency. According to Abbadi et al. (2020) the VMS is a key enabler for data transparency, transitioning from traditional physical boards to digitised visuals. Recent advancements in visual management practices include the incorporation of dashboards, integrating real-time data analytics. These dashboards aggregate and display metrics and KPI’s in a single screen. Business Intelligence (BI) dashboards go one-step further, combining business analytics, data visualisation, data mining and warehousing to facilitate effective decision-making (Abbadi et al., 2020; Zhang et al., 2021).
Different BI tools have been used for different purposes in the literature. For example (Hoelscher & Mortimer (2018) used Tableau in the healthcare industry to emphasise the importance of data analysis and visualisation, making use of its drag-and-drop functionality. Belghith et al. (2024) and Libby et al. (2022) used Power BI in the financial sector to develop dashboards for performance evaluation, facilitating visualisation and data-driven decision-making.
While different authors have used different BI tools for specific applications, researchers have systematically evaluated and ranked these tools based on different operational criteria. Rafif (2019) created a Multiple Criteria Decision Making (MCDM) scale on which twenty-one BI tools were compared and evaluated. The tools and parameters were compared, scored and ranked according to their capacity to combine data, store queries and produce and export information. Each tool was assigned a score of one, two or three depending on their performance. An average was then calculated. Through this evaluation, the author recommended Tableau as the preferred BI system. Rafif conducted this analysis to differentiate Self-Service Business Intelligence (SSBI) tools based on several parameters. However, as this evaluation may not be universally applicable, it is recommended that each user conducts evaluations specific to their application.
To fully understand the strengths of various BI tools, such as Tableau and Power BI, users should also examine the methods for connecting received data to these tools.
Data Connection Types
Advantages, Disadvantages and Data Refresh Rates of Various Connection Types (Odrynska, 2023; Rad, 2023)
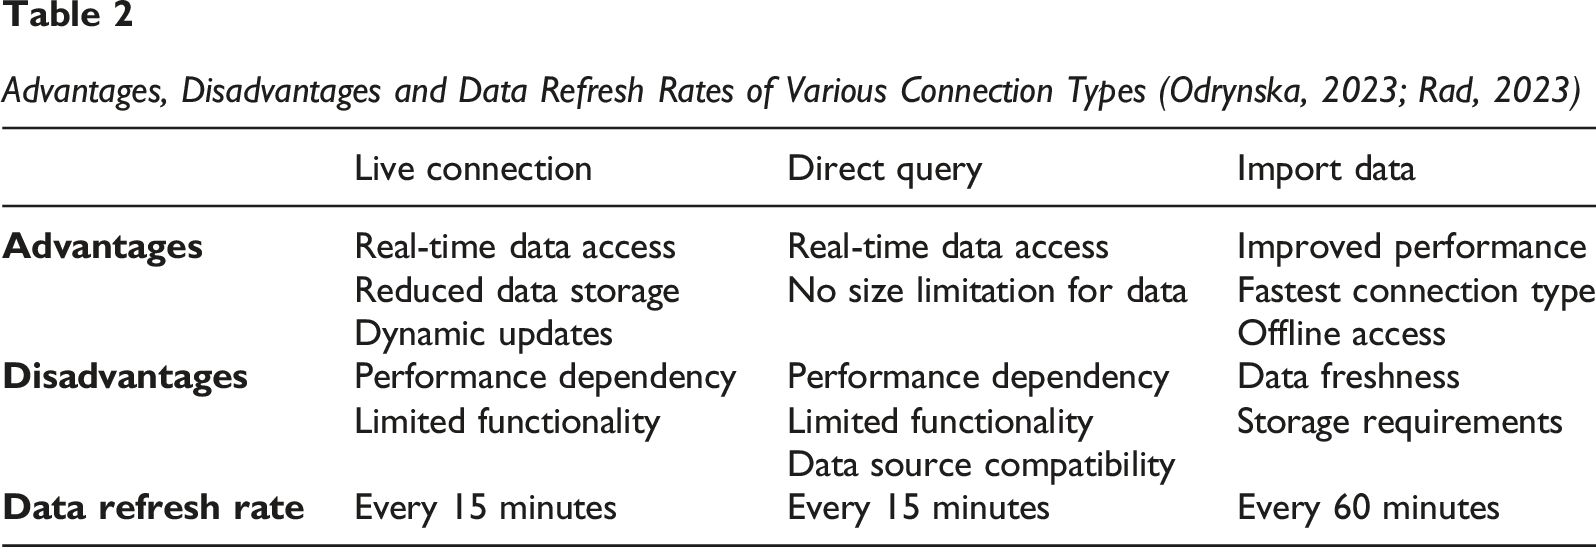
Live connection systems do not store data directly within the BI tool, rather they can accommodate large datasets via a direct link to an SQL Server Analysis Service (SSAS) (Aspin, 2022; Rad, 2023). The imported data approach offers numerous advantages, including the quickest connection time and full functionality within BI software (Aspin, 2022). This method allows for eight scheduled refreshes per 24-h period or one automatic refresh every hour during a standard working day. However, instant data refreshes can be triggered manually.
Summary
Inventory must be managed and assembled in a way to meet customer requirements such as quality, due dates and aesthetics. Literature has demonstrated the impact of I4.0 and the IoT on manufacturing, specifically inventory management. Logistics teams should be able to easily identify where and when stock has left a location and arrived at a different one, mitigating time lost due to late or lost inventory. Above all, management should have the ability to monitor the productivity and efficiency of the factory, identifying potential weaknesses before they become significant issues.
Different tracking technologies have been proposed including GPS, RFID and QR codes, depending on the amount of data involved and the type and location over which tracking is to be completed. While tracking technology offers valuable capabilities, the gathered data is best represented through visual management systems providing a visual representation to derive KPIs and enhance usability. It has also been acknowledged that each user or company may have unique requirements for their data analysis tool, thus necessitating independent evaluation of each system for each use case.
Aerospace manufacturing presents unique challenges to inventory management including interdependent supply chains, and strict compliance requirements. The work in this case study paper explores the incorporation of tracking technology and a corresponding visual management system to track and assess the behaviour of stock trolleys in a large-scale industry application, specifically the Collins Aerospace interiors site located in Kilkeel, Northern Ireland.
Within this work, the unique case study will be described in the next section. A separate, application specific investigation and comparison of VMSs will then be completed. The optimum VMS will then be coupled with a robust tracking technology and applied to the case herein. The paper will then discuss the implementation of this system and present the results and process improvements achieved.
Case Study in This Work
Inventory in manufacturing companies is typically delivered on trolleys to the production line in a way that achieves the correct build order sequence. This is done while balancing the workload evenly across the operators to align with the lines takt time, which is the rate at which products must be completed to meet customer demand.
Collins Aerospace, Kilkeel is composed of multiple buildings, with Building Three, shown Figure 1(a), acting as the primary facility for aircraft seat assembly. Within Building Three, production line seven, outlined in green, was chosen as the Proof of Concept (POC) production line before expanding to other production lines across the factory. Diagrams Showing (a) Building Three and Five Layout and Location of POC Production Line and (b) Inventory Process Flow Through Buildings (Other Information Unrelated to This Work has Been Redacted for Confidentiality Purposes)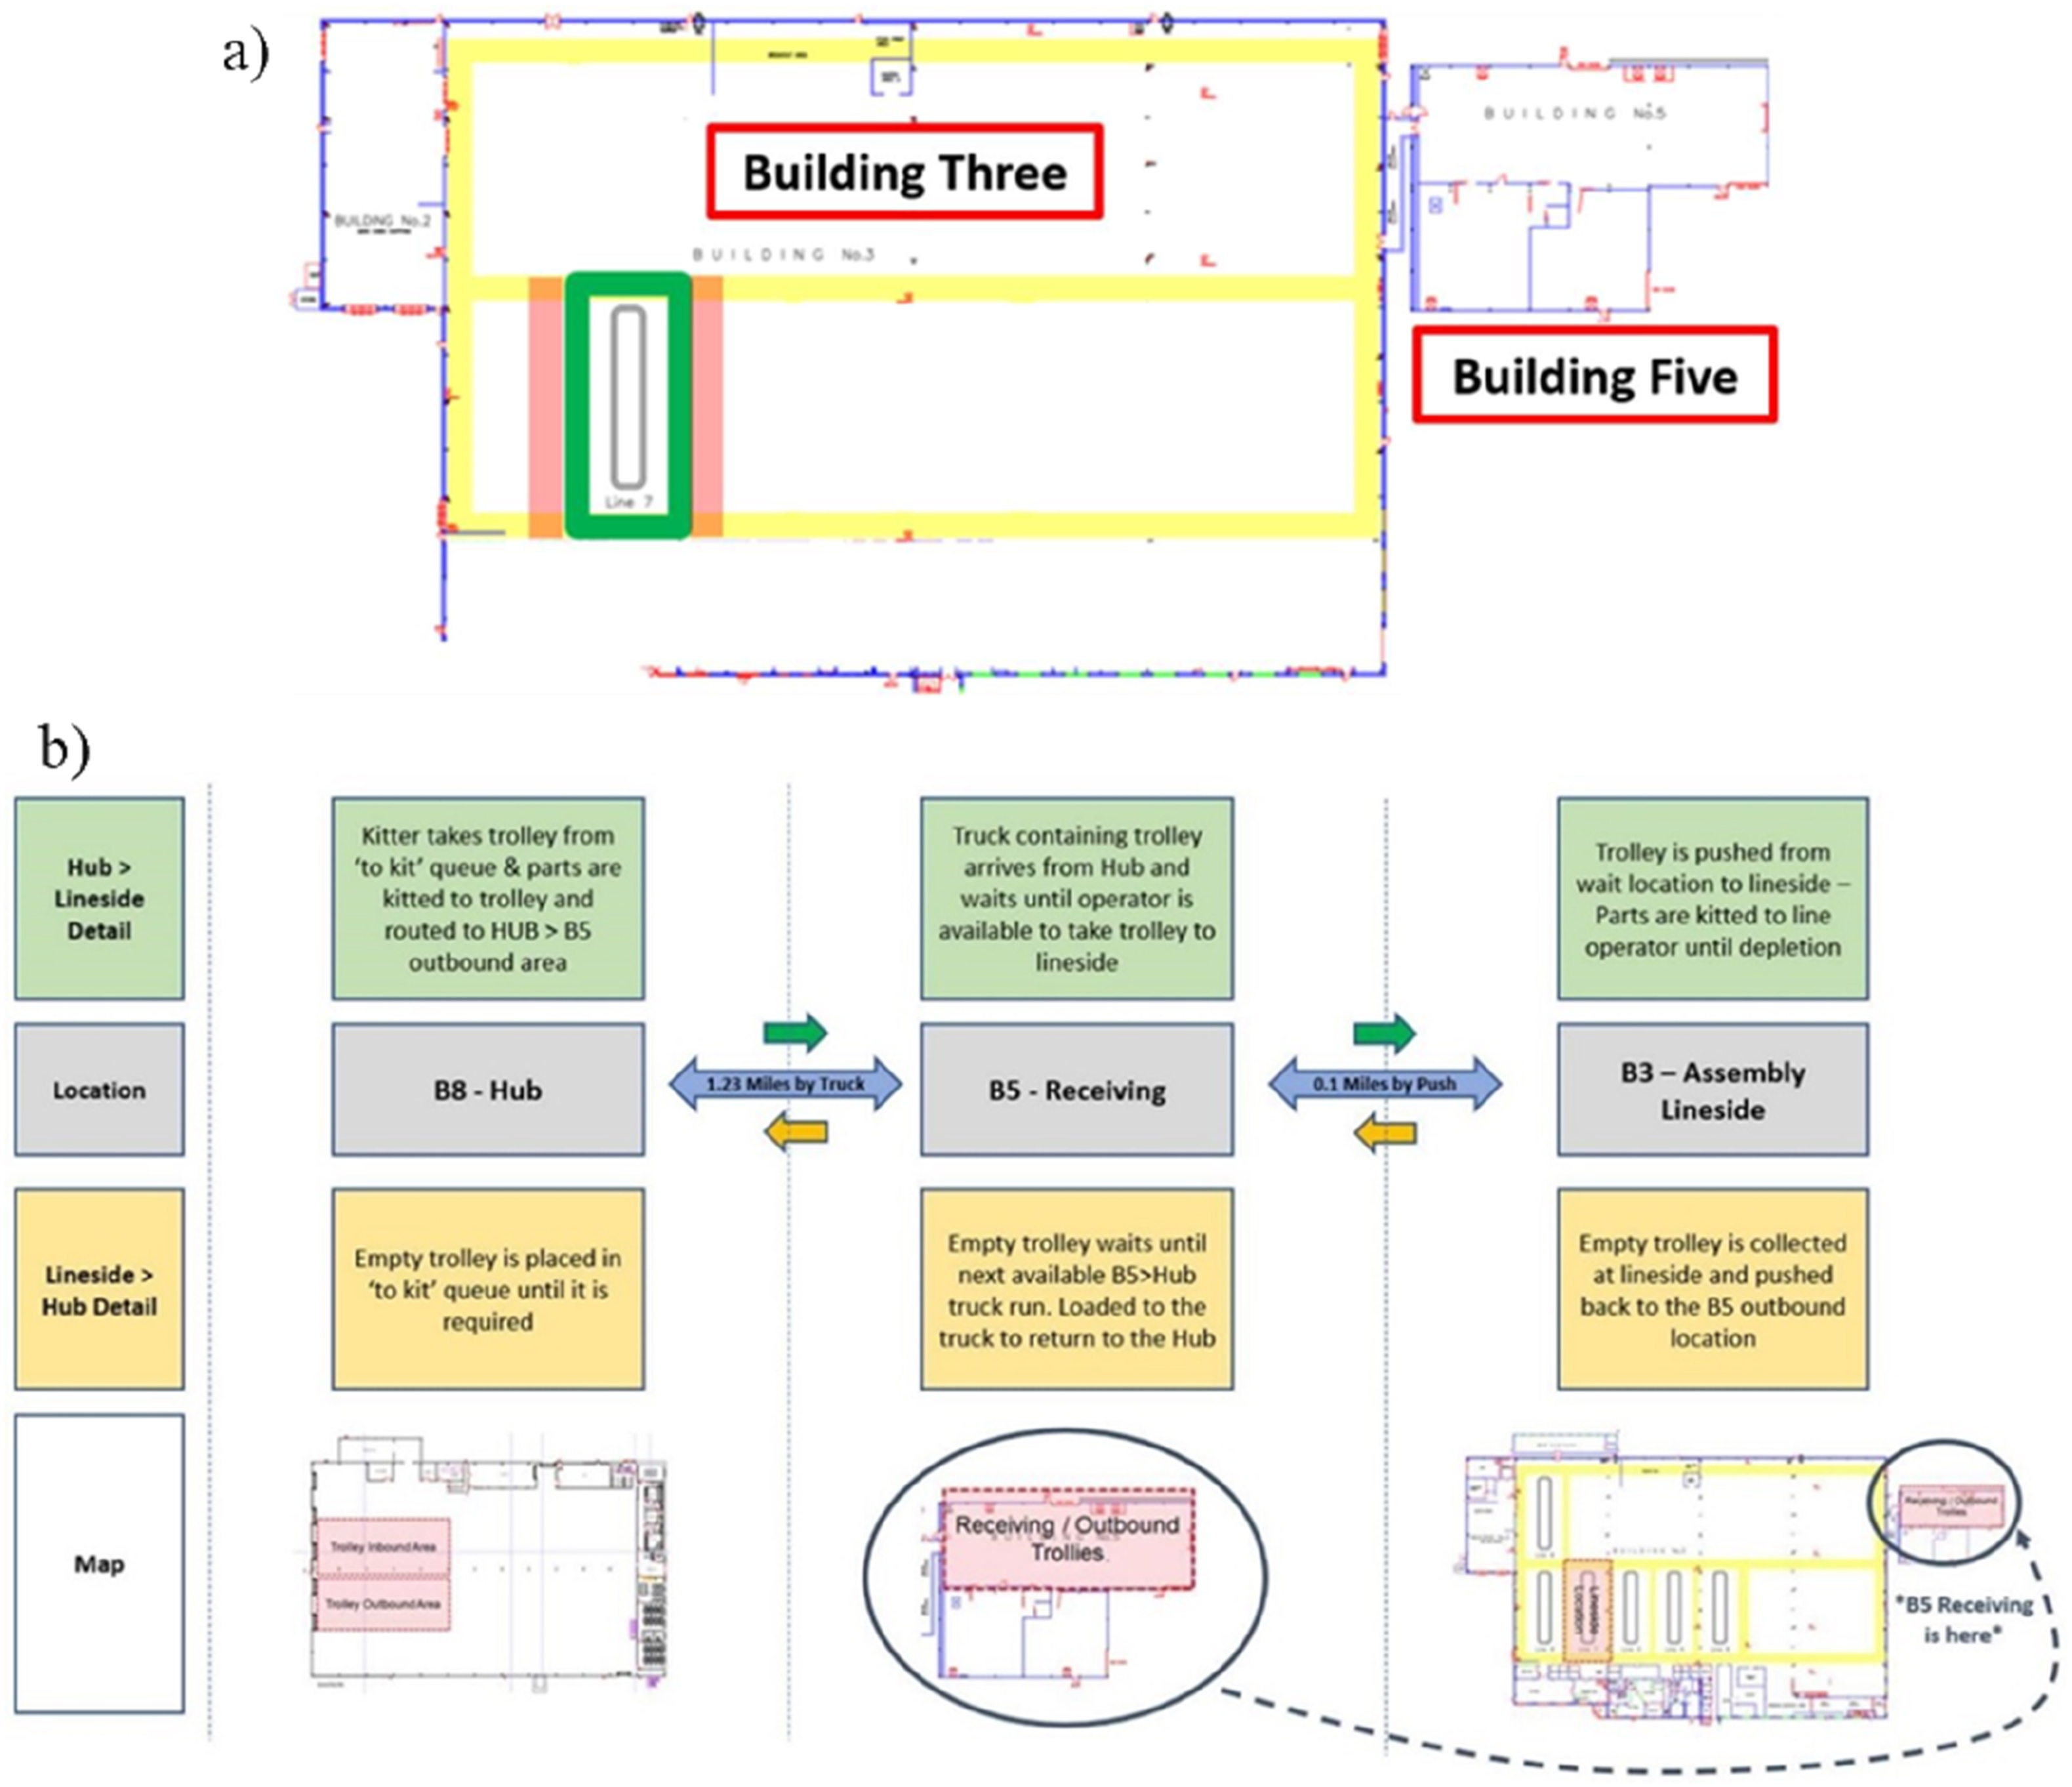
Figure 1(b) summarises the process flow for this project. Building Eight serves as the primary storage and kitting facility, routing inventory to Building Five. Trolleys should transition from the inbound area to the kitting area in Building Eight within 5 minutes before returning to the outbound area. The next trolley should take no more than 30 minutes to move from Building Eight to the lineside receiving area. Trolleys for kitting inventory should be stationed lineside in Building Three for a set duration or until depleted. Depleted trolleys must move from the lineside to the receiving/outbound areas in Building Five within 5 minutes for efficient inventory management.
Production line seven can be seen in more detail in Figure 2. The line comprises twenty-two operational stations and one inspection station. The light blue strip indicates the walkway within the production line, while the dark blue strip differentiates the space designated for trolley arrival and retrieval. Green rectangles represent the trolleys utilised for inventory replenishment. Trolleys are delivered and collected by members of the logistics team multiple times throughout the working day. Each workstation has a dedicated number of trolleys to support and ensure smooth production. POC Production Line Layout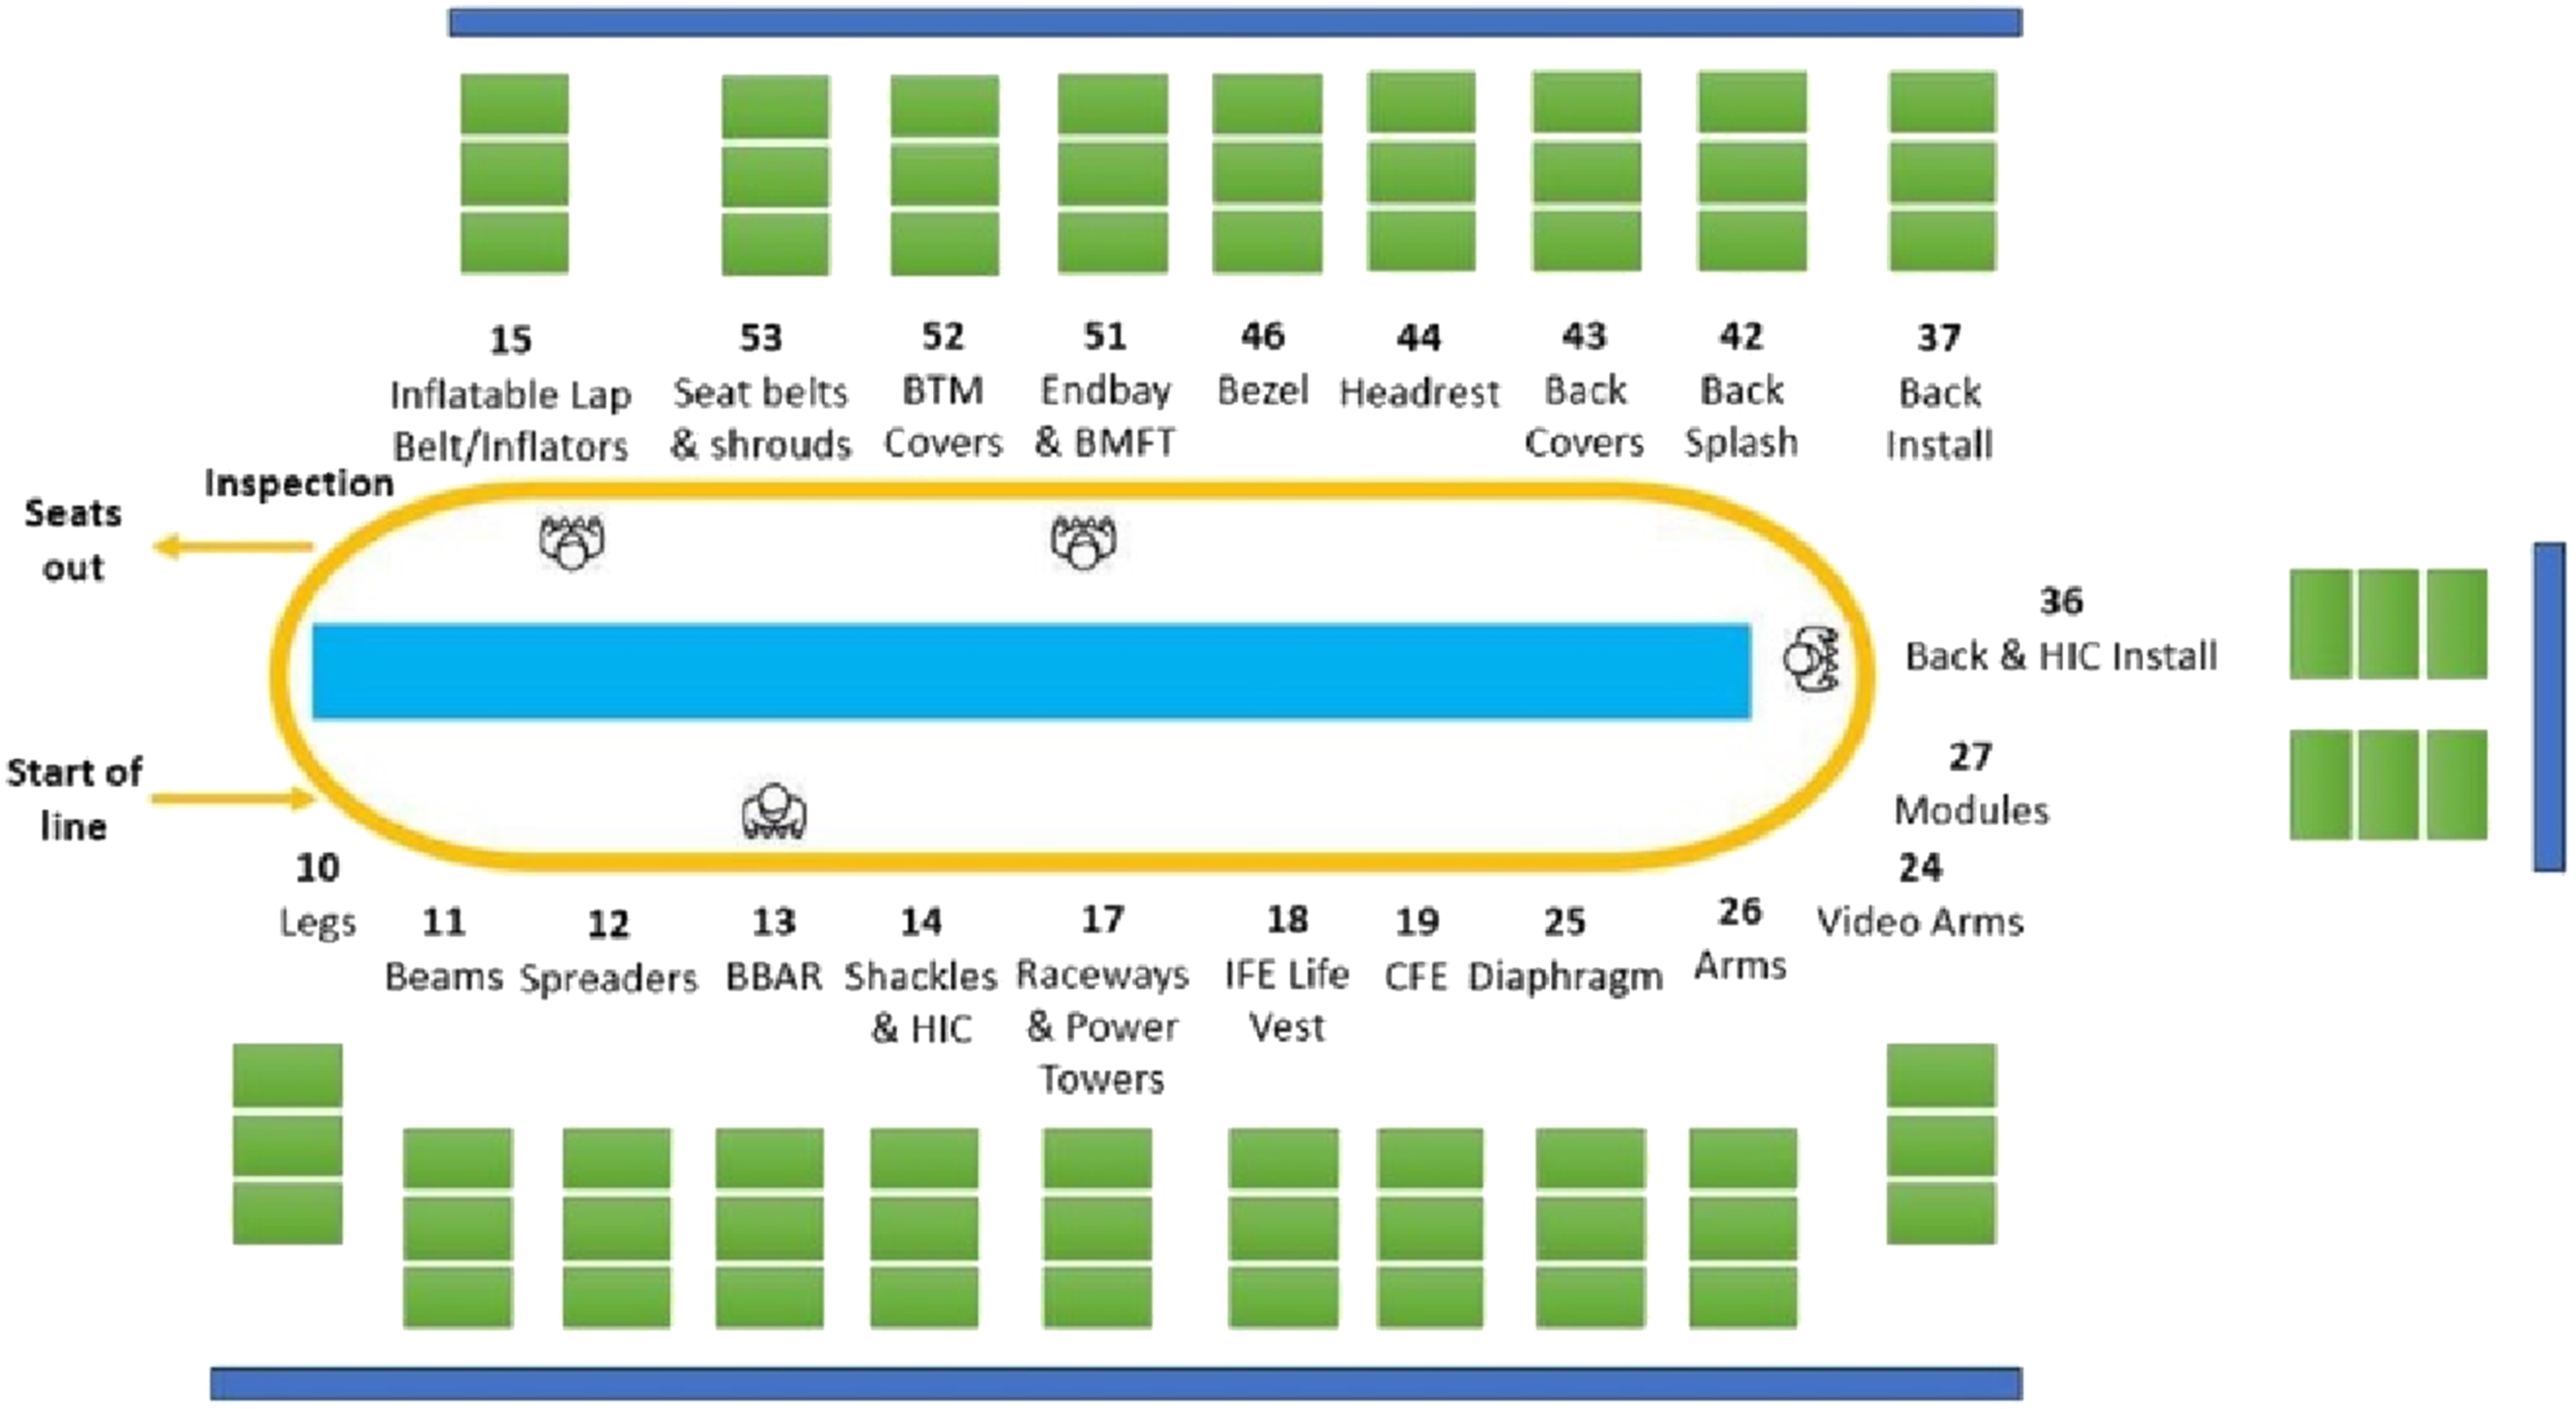
Collins Aerospace Kilkeel manages 1200 trolleys for inventory movement without any location tracking, relying on manual handling by the logistics team. Misalignment with the production line takt time can lead to missing kits and cost wastage. Additionally, the logistics team at the main stock location, a mile away, lack visibility on empty trolleys, causing a daily two-hour delay in stock picking. Manual, unrecorded transitions further result in long waiting times, backlogs and lost stock, highlighting a significant operational weakness.
Management teams noted the absence of data visualisation for overall production line performance, particularly regarding on-time trolley arrivals. Consequently, when developing the VMS, a dedicated ‘Production Line Overview’ tab was requested to showcase the total duration trolleys spent on each line and provide details into trolley movements and locations. In the context of this problem, concepts were generated for the proposed solution, comparing BI tools and various VMS.
Proposed System Solution
Comparison and Selection of BI Tool
Pugh Matrix Comparing BI Tools Qlik Sense, Tableau and Power BI
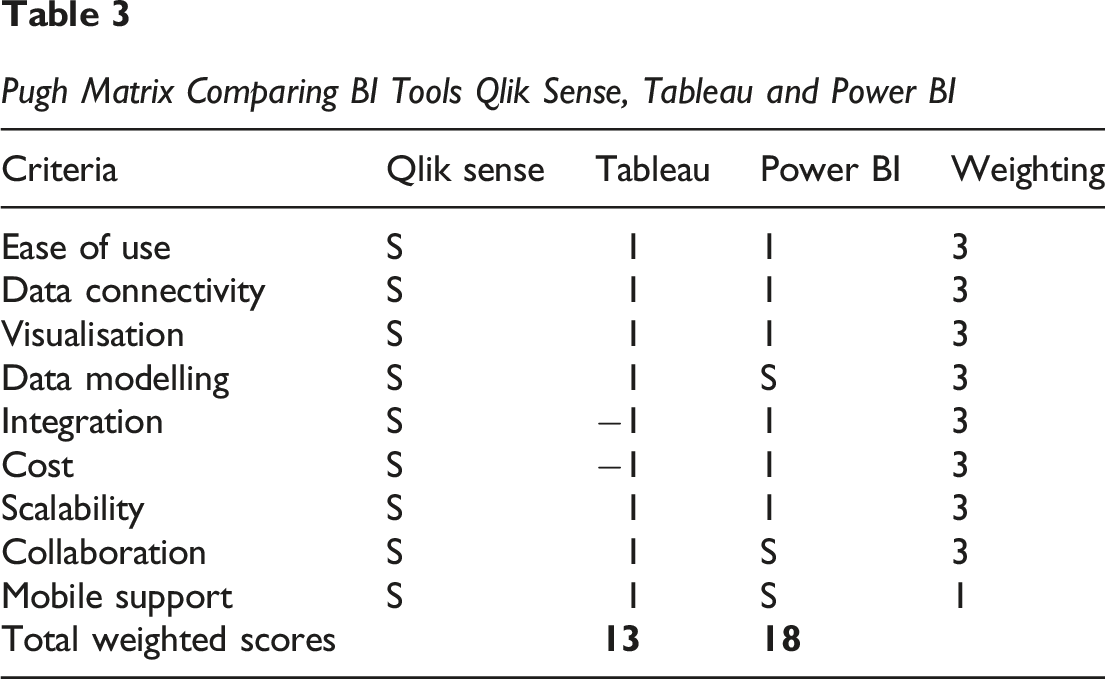
All criteria, except mobile support, were deemed of equal importance to the specific application within Collins Aerospace. Therefore, a weighting factor of three was applied to all criteria, with a value of one applied to mobile support to provide an objective comparison between BI tools for this application. A scale of zero, or a same (S) rating, was given to the reference tool, Qlik Sense. Tableau and Power BI were then compared based on the selection criteria. A scale of one was given if the BI tool performed better than the reference tool, zero (S) if it performed the same and negative one if it performed worse. These scores were then multiplied by the weighting to provide an overall score for each BI option.
Based solely on the Pugh matrix, Power BI was ranked as the best BI tool for this specific application. Expanding further on these results there are several key factors to consider. Firstly, Qlik Sense lacks visualisation, data connectivity, ease of use and scalability when compared to Tableau and Power BI for the trolley tracking case study herein. Tableau is strong across categories such as ease of use, data modelling, visualisation and mobile support, but its lack of integration, such as its suitability with Microsoft products, and higher costs make it less suitable. Despite its strengths, the costs of licensing and upkeep are prohibitive, therefore, Tableau receives an overall score of five. Power BI scored slightly higher at six and is preferred based on the Pugh matrix evaluation. Power BI is competitive in most areas, with notable strengths in data connectivity, visualisation, integration, cost and scalability. Scalability is a critical factor if this project is to progress beyond its POC stage. Based on these results, Power BI is recommended for the large-scale manufacturing test case herein.
Summary of Proposed Solution
Based on the findings of the literature review, case specific VMS analysis, and existing available technologies, the proposed system solution was an RFID based system with a Power BI dashboard. The RFID system was used to gather data from specified locations within Collins Aerospace, while Power BI software facilitated the presentation of this data for review and interrogation.
Methodology
The proof-of-concept RFID-VMS system was deployed within Collins Aerospace by members of the Operations Modernisation team over a seven-month period. Implementation of the physical readers and development of the outline VMS took approximately three months on a part-time basis.
Technology
RFID technology was already present in some areas of Collins Aerospace and its benefits were seen across both the Kilkeel site and elsewhere. Existing RFID equipment was used in this proof-of-concept test case. These devices are identified as RDR-80531BKU, also known as WAVE ID Plus Mini V3, as seen in Figure 3(A). An evaluation was conducted on these devices to confirm their suitability in meeting the papers objectives. Each device was assessed for usability, integration, cost and availability, and all criteria were successfully confirmed. Component Technology Used in Proposed Tracking System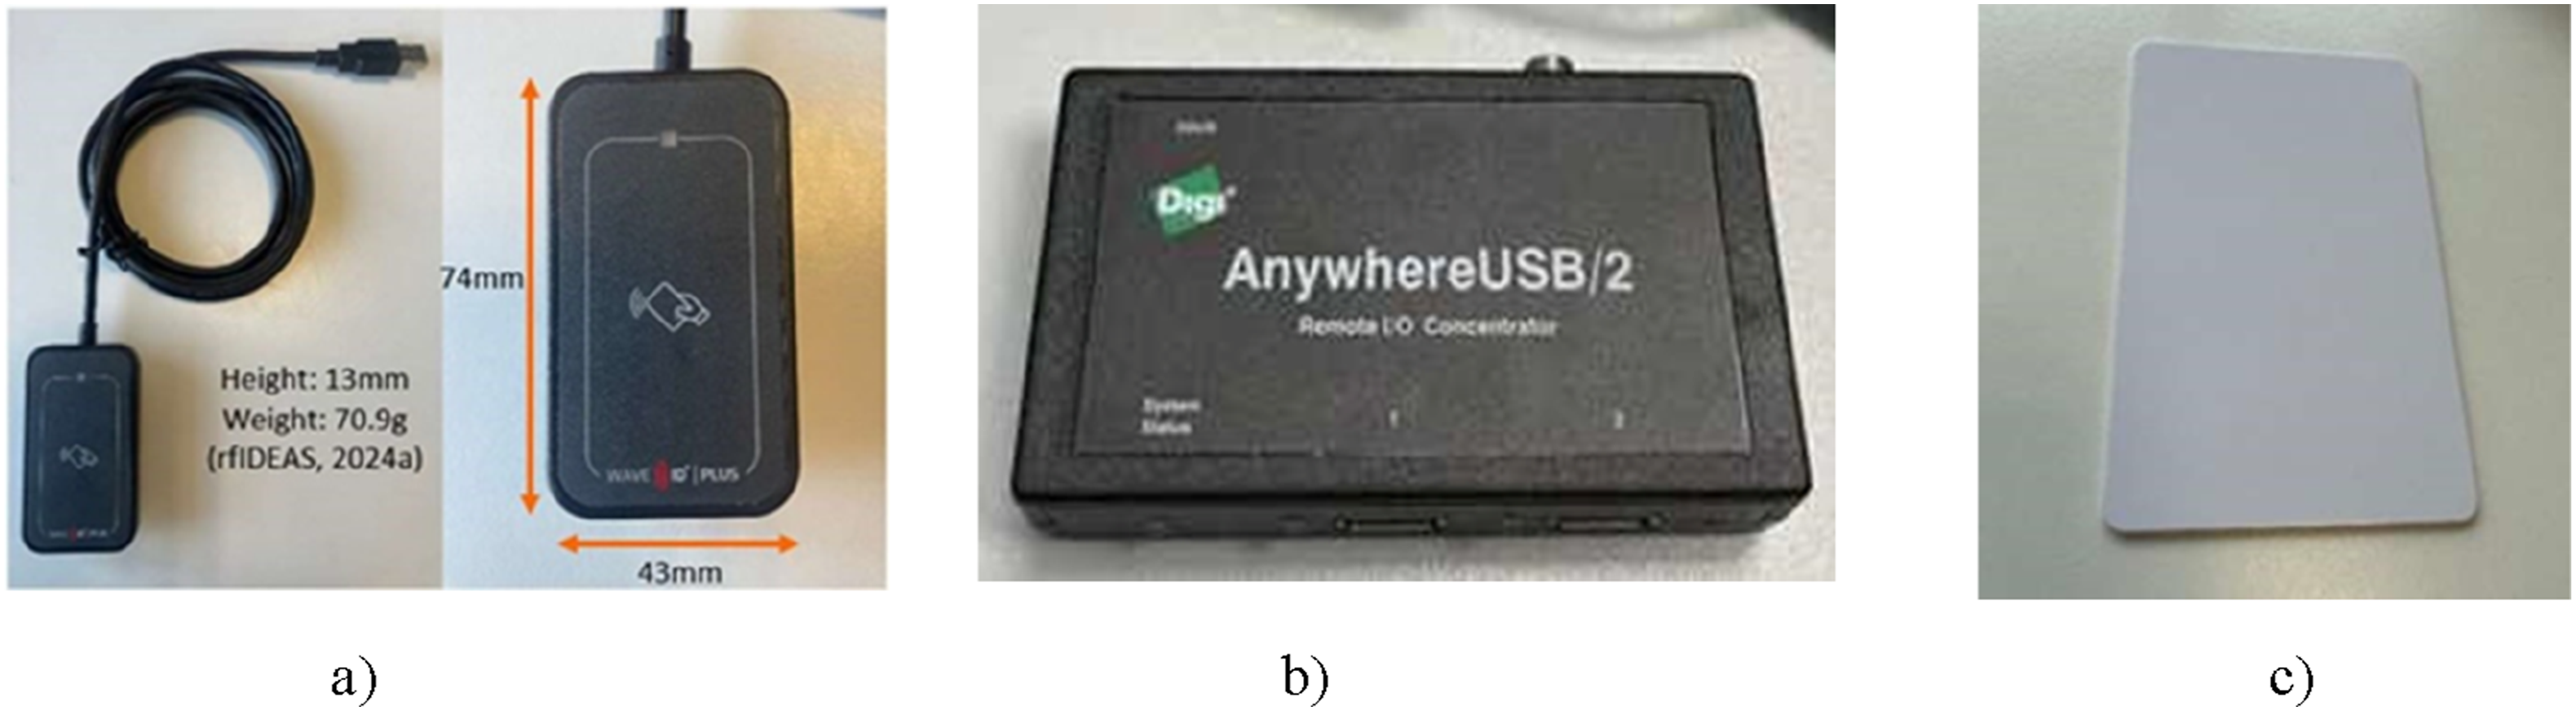
The WAVE ID Plus Mini reader connects directly to the universal serial bus (USB) port of a laptop computer and is compatible with all major operating systems. The WAVE ID Plus Mini V3 was a short-range reader with an operating frequency of 125/132 kHz and 13.56 MHz and a reading range of 1–3 inches. While this reading range was small, it was still appropriate for the proof-of-concept application herein. However, for other applications and wider roll-out, longer range UHF (860–960 MHz) readers should be considered, with RFID interrogation zone spans from 3 to 100 metres (Casella et al., 2022).
Due to the operational nature of inventory trolleys, a method was required to allow the remote integration of the WAVE ID Plus Mini with Collins IT infrastructure. As such, the Digi AnywhereUSB 2 Plus (Figure 3(B)) was used as it allowed for flexible and secure connections between USB devices and remote computers, without the typical physical proximity constraints linked with USB devices. The WAVE ID Plus Mini and Digi AnywhereUSB 2 Plus permits any laptop or digital device to become a portable reader as the data can be both read and received through this device.
For the POC, existing Ultra-High Frequency (UHF) cards were used due to an already embedded passive RFID tag; therefore, these could be scanned at each location. UHF cards (Figure 3(C)) were deemed appropriate for this project as they operate above usual frequencies within the manufacturing facility, eliminating interference. Their long-read range and high data transfer rate enable immediate and efficient inventory management, particularly in large-scale operations like warehouses. These cards can also be customised with branding or location names to mitigate errors.
The location of each UHF card reader on the trolley is shown in Figure 4. As employees move a trolley from one location to the next, they would scan the corresponding location card on the RFID scan points. While this approach still required some manual intervention/consideration from operators, scanning gates or other automated methods were beyond the scope of this POC study. However, RFID gate control systems have been investigated in literature and could be utilised in this application with UHF-RFID tags incorporated in the gate which scan each trolley and direct it to the right location/production line (Alvarez-Narciandi et al., 2019). Position of RFID and USB Hub System on Exemplar Trolley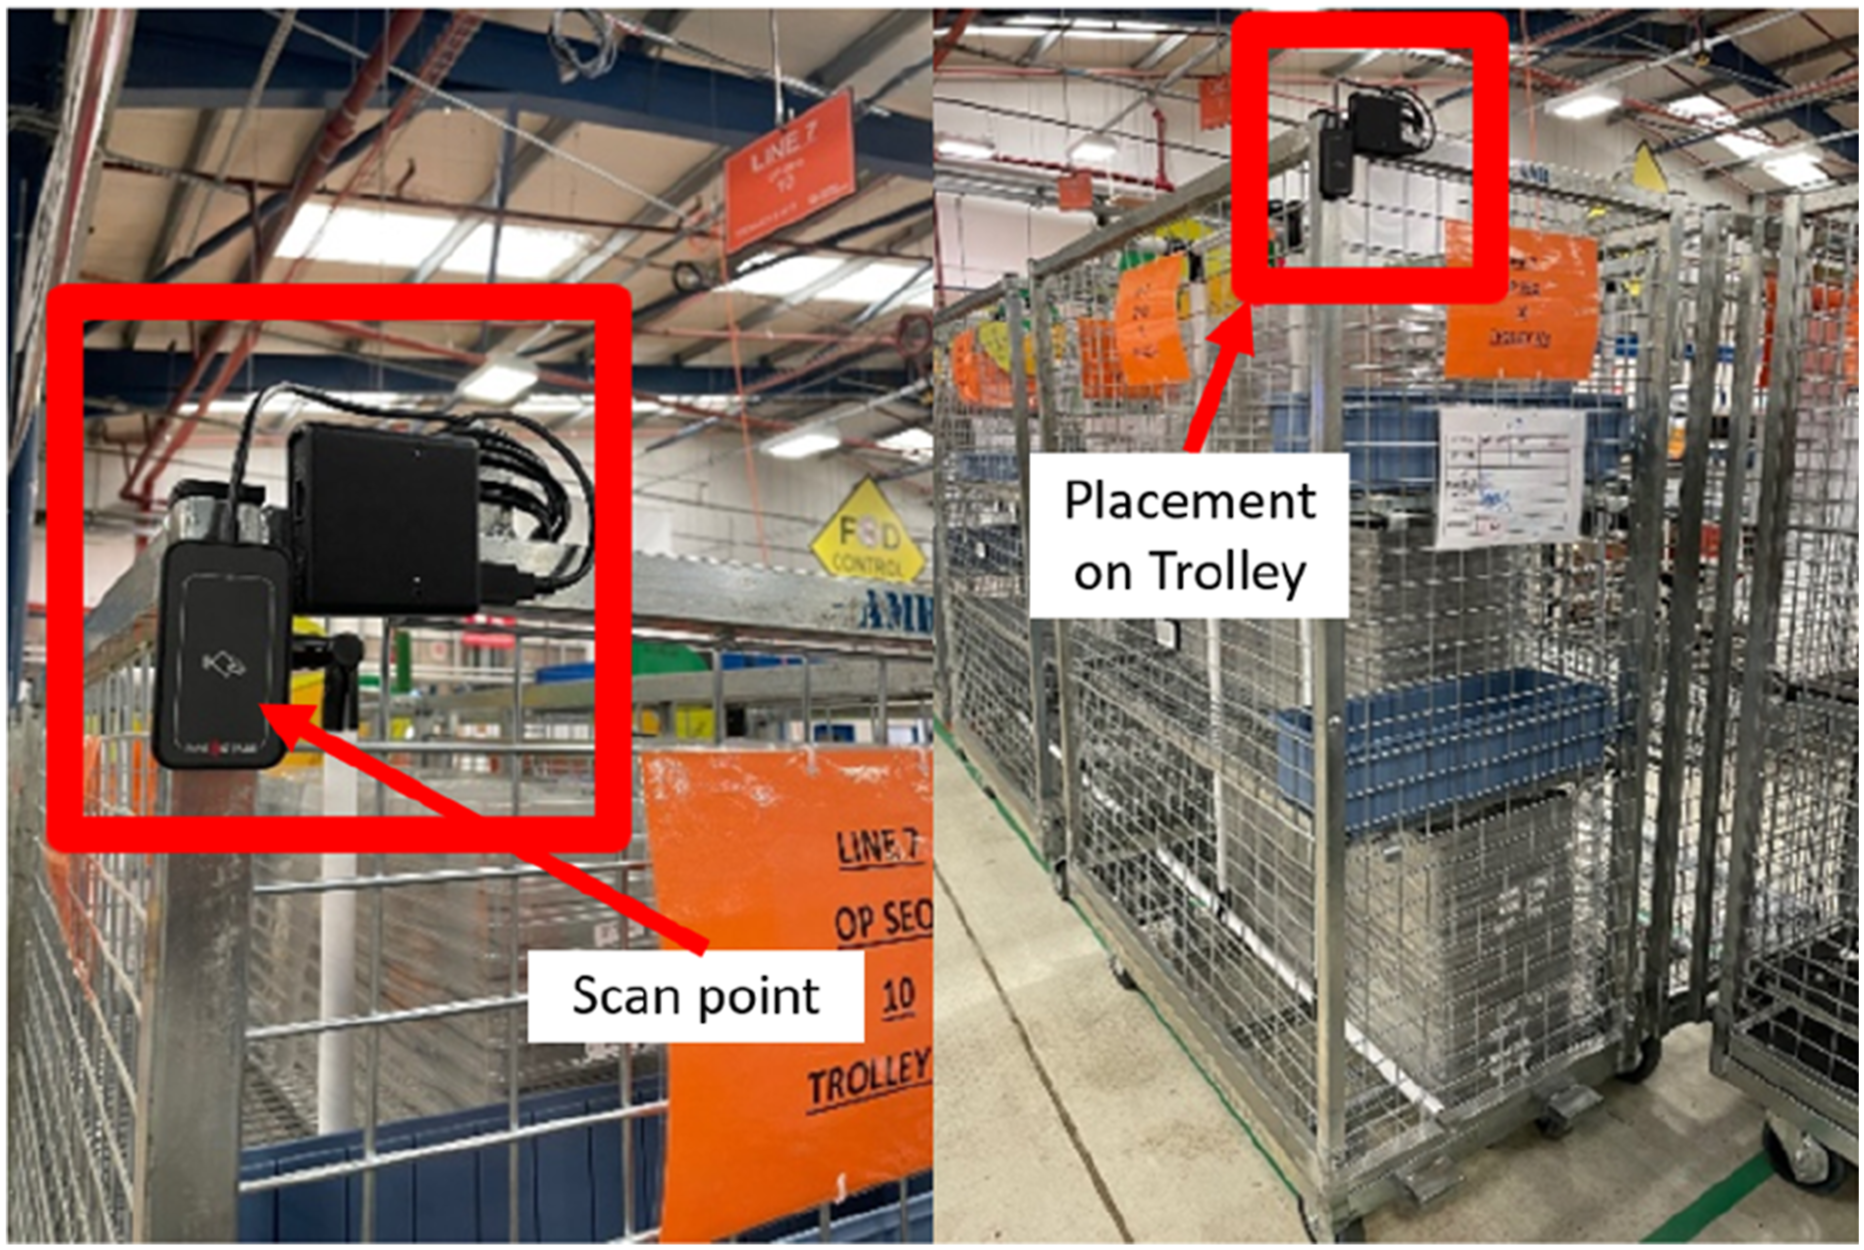
Implementation of the Proposed Solution
Implementation of RFID Technology
The configuration of WAVE ID Plus Mini V3 RFID readers to Collins Aerospace IT systems was completed using rfIDEAS software, Figure 5, and following the guidance within it. rfIDEAS Configuration Screen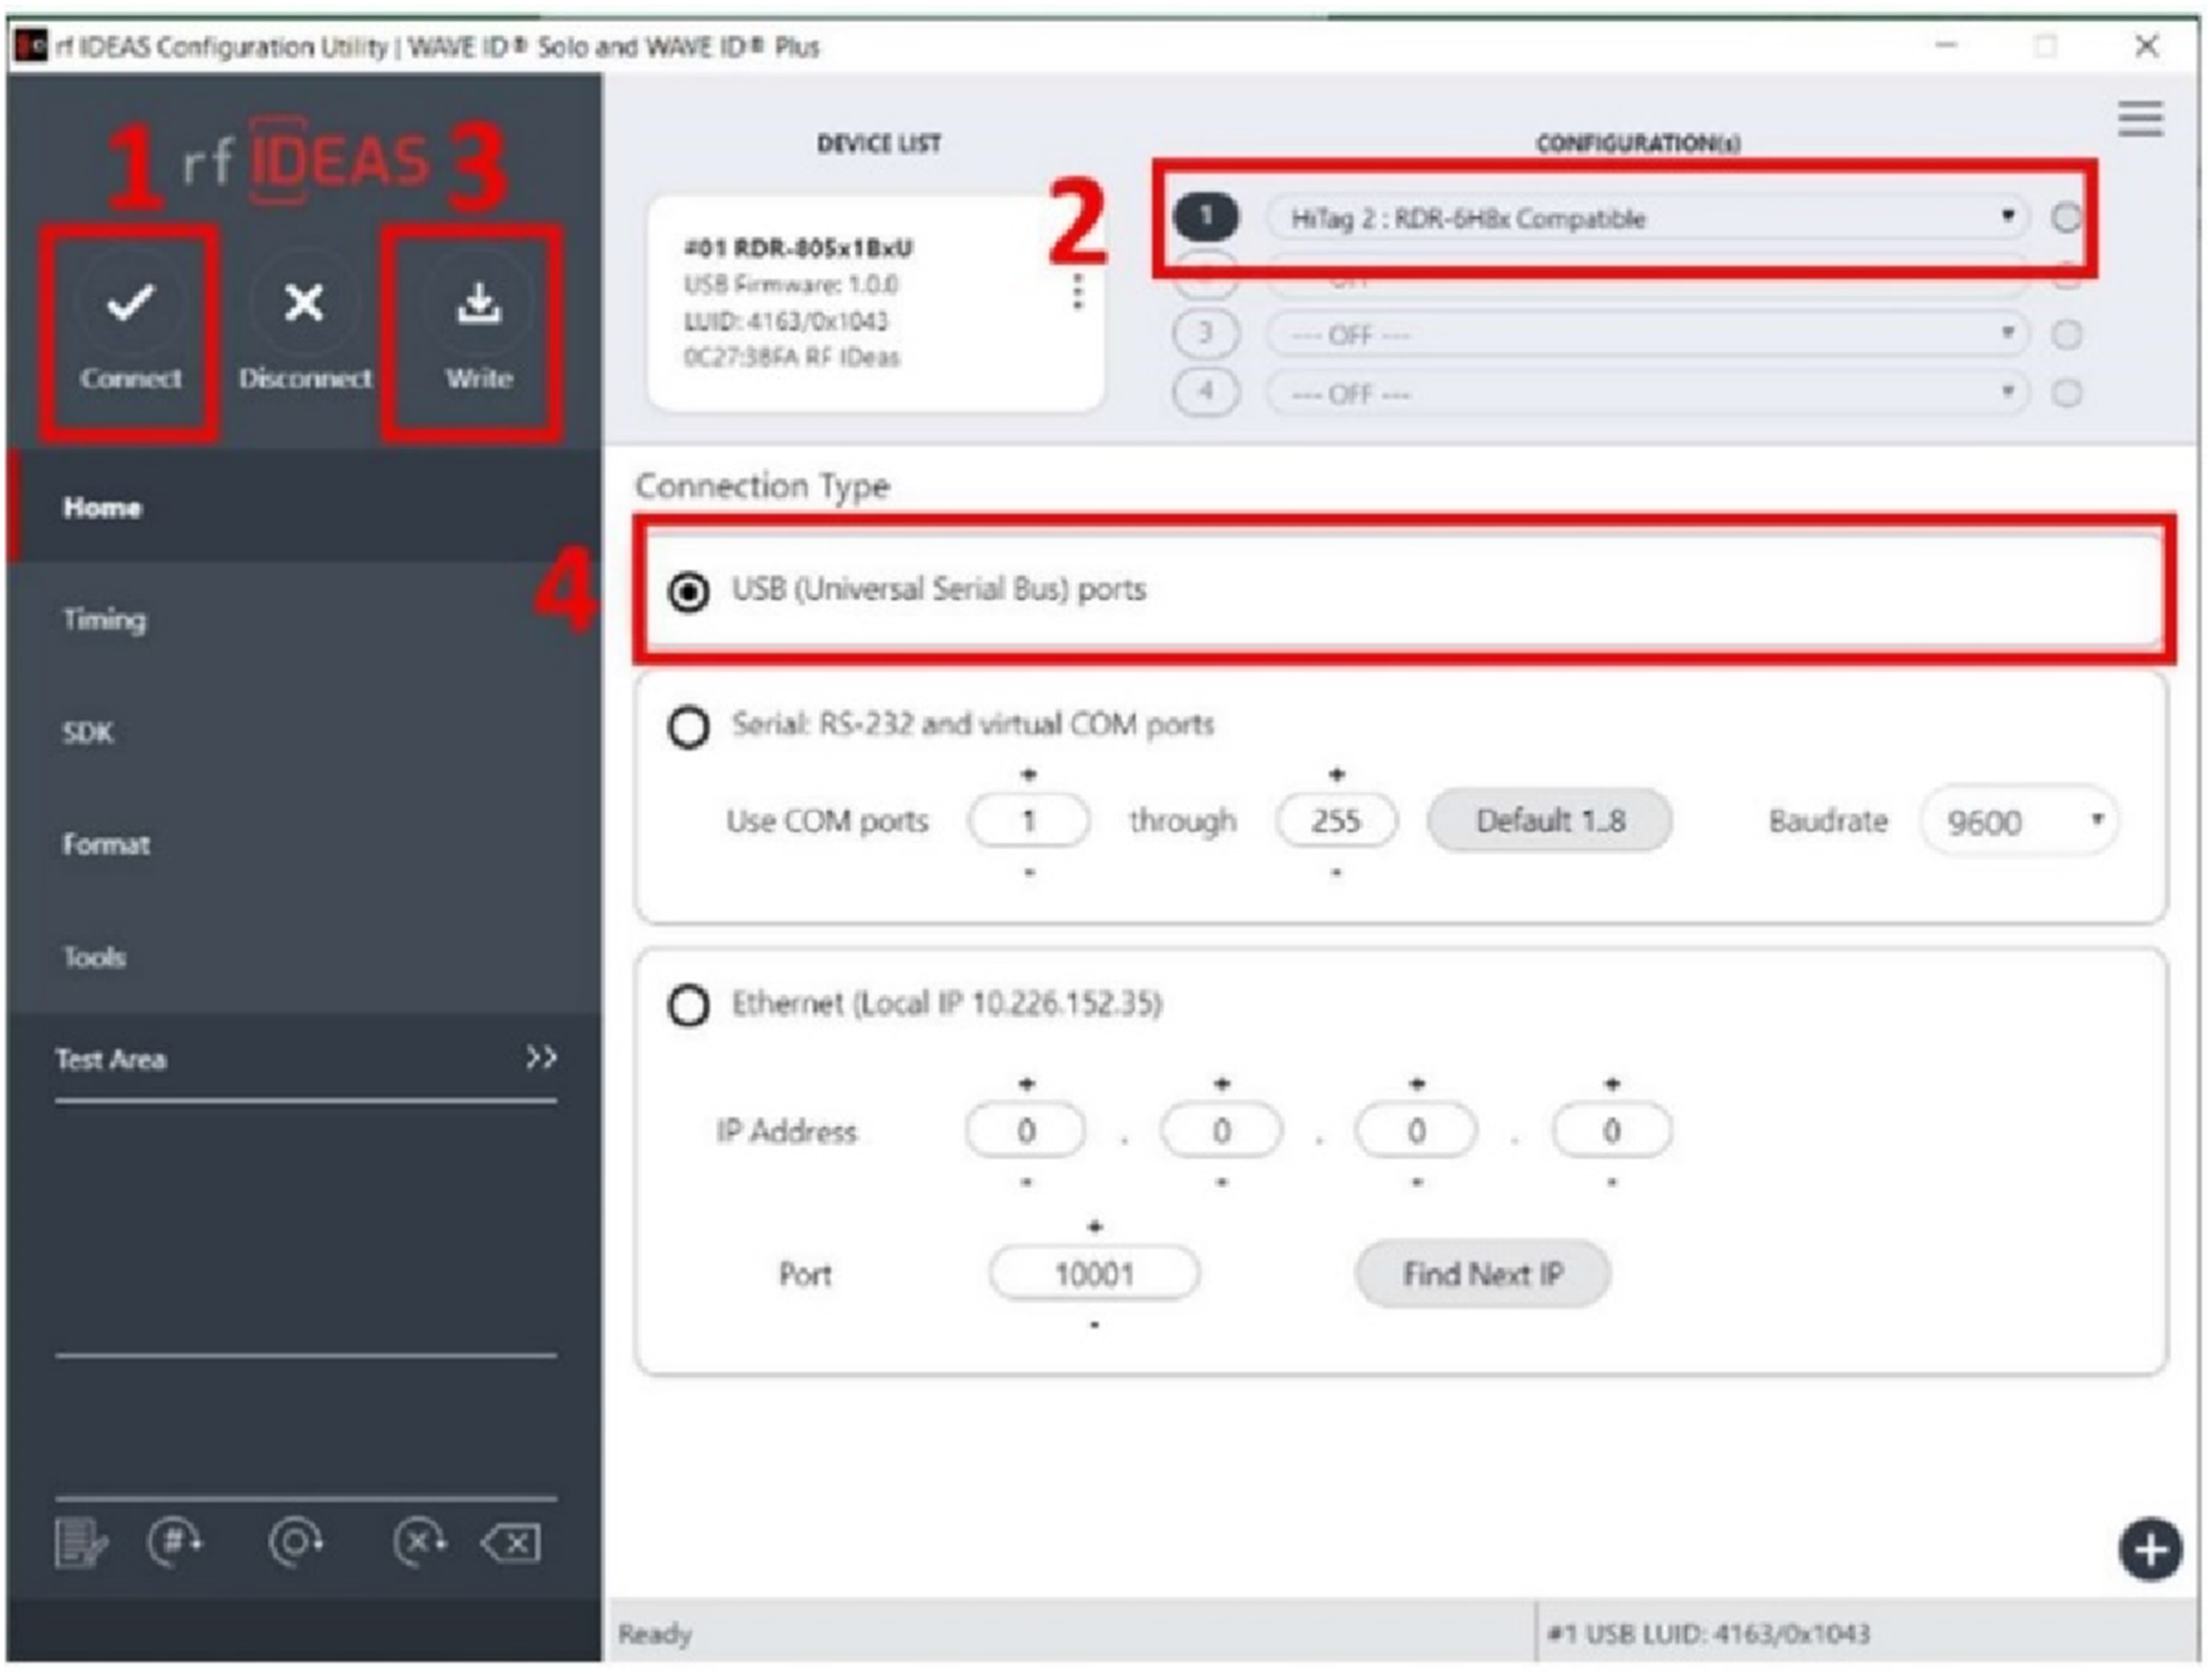
Each card contained a passive RFID tag and was given a unique number using an RFID encoder. This ID could also be erased to permit multiple uses of the card. Within the tracking system, each unique number was associated with a specific location. Upon scanning the unique card on the RFID reader, connected remotely to the personal computer (PC), location details were recorded digitally, automatically appending a date and timestamp. This data could then be transformed to an Excel table and displayed on the corresponding VMS.
System Modelling – Power BI Data Connection
The dataset containing the expected timing and location of each trolley was stored in a static Excel document, requiring infrequent updates. This dataset was best suited for the import data method, discussed previously. Conversely, the data gathered in real-time from RFID readers on the trolleys underwent constant updates, but not at a high frequency. This dataset would be most effectively managed using the direct query method. However, due to management requirements, an import data method was most suitable as a manual refresh required less computational power and storage. Therefore, the import data type was proposed for this project as it met the needs of the system and Collins Aerospace management.
System Modelling – Power BI Development
Figure 6 shows a flowchart of the steps used to construct the Power BI visual management dashboard, aligning with decisions derived from the visual management investigation and KPIs outlined by Collins Aerospace management. Flowchart of Construction of the Power BI VMS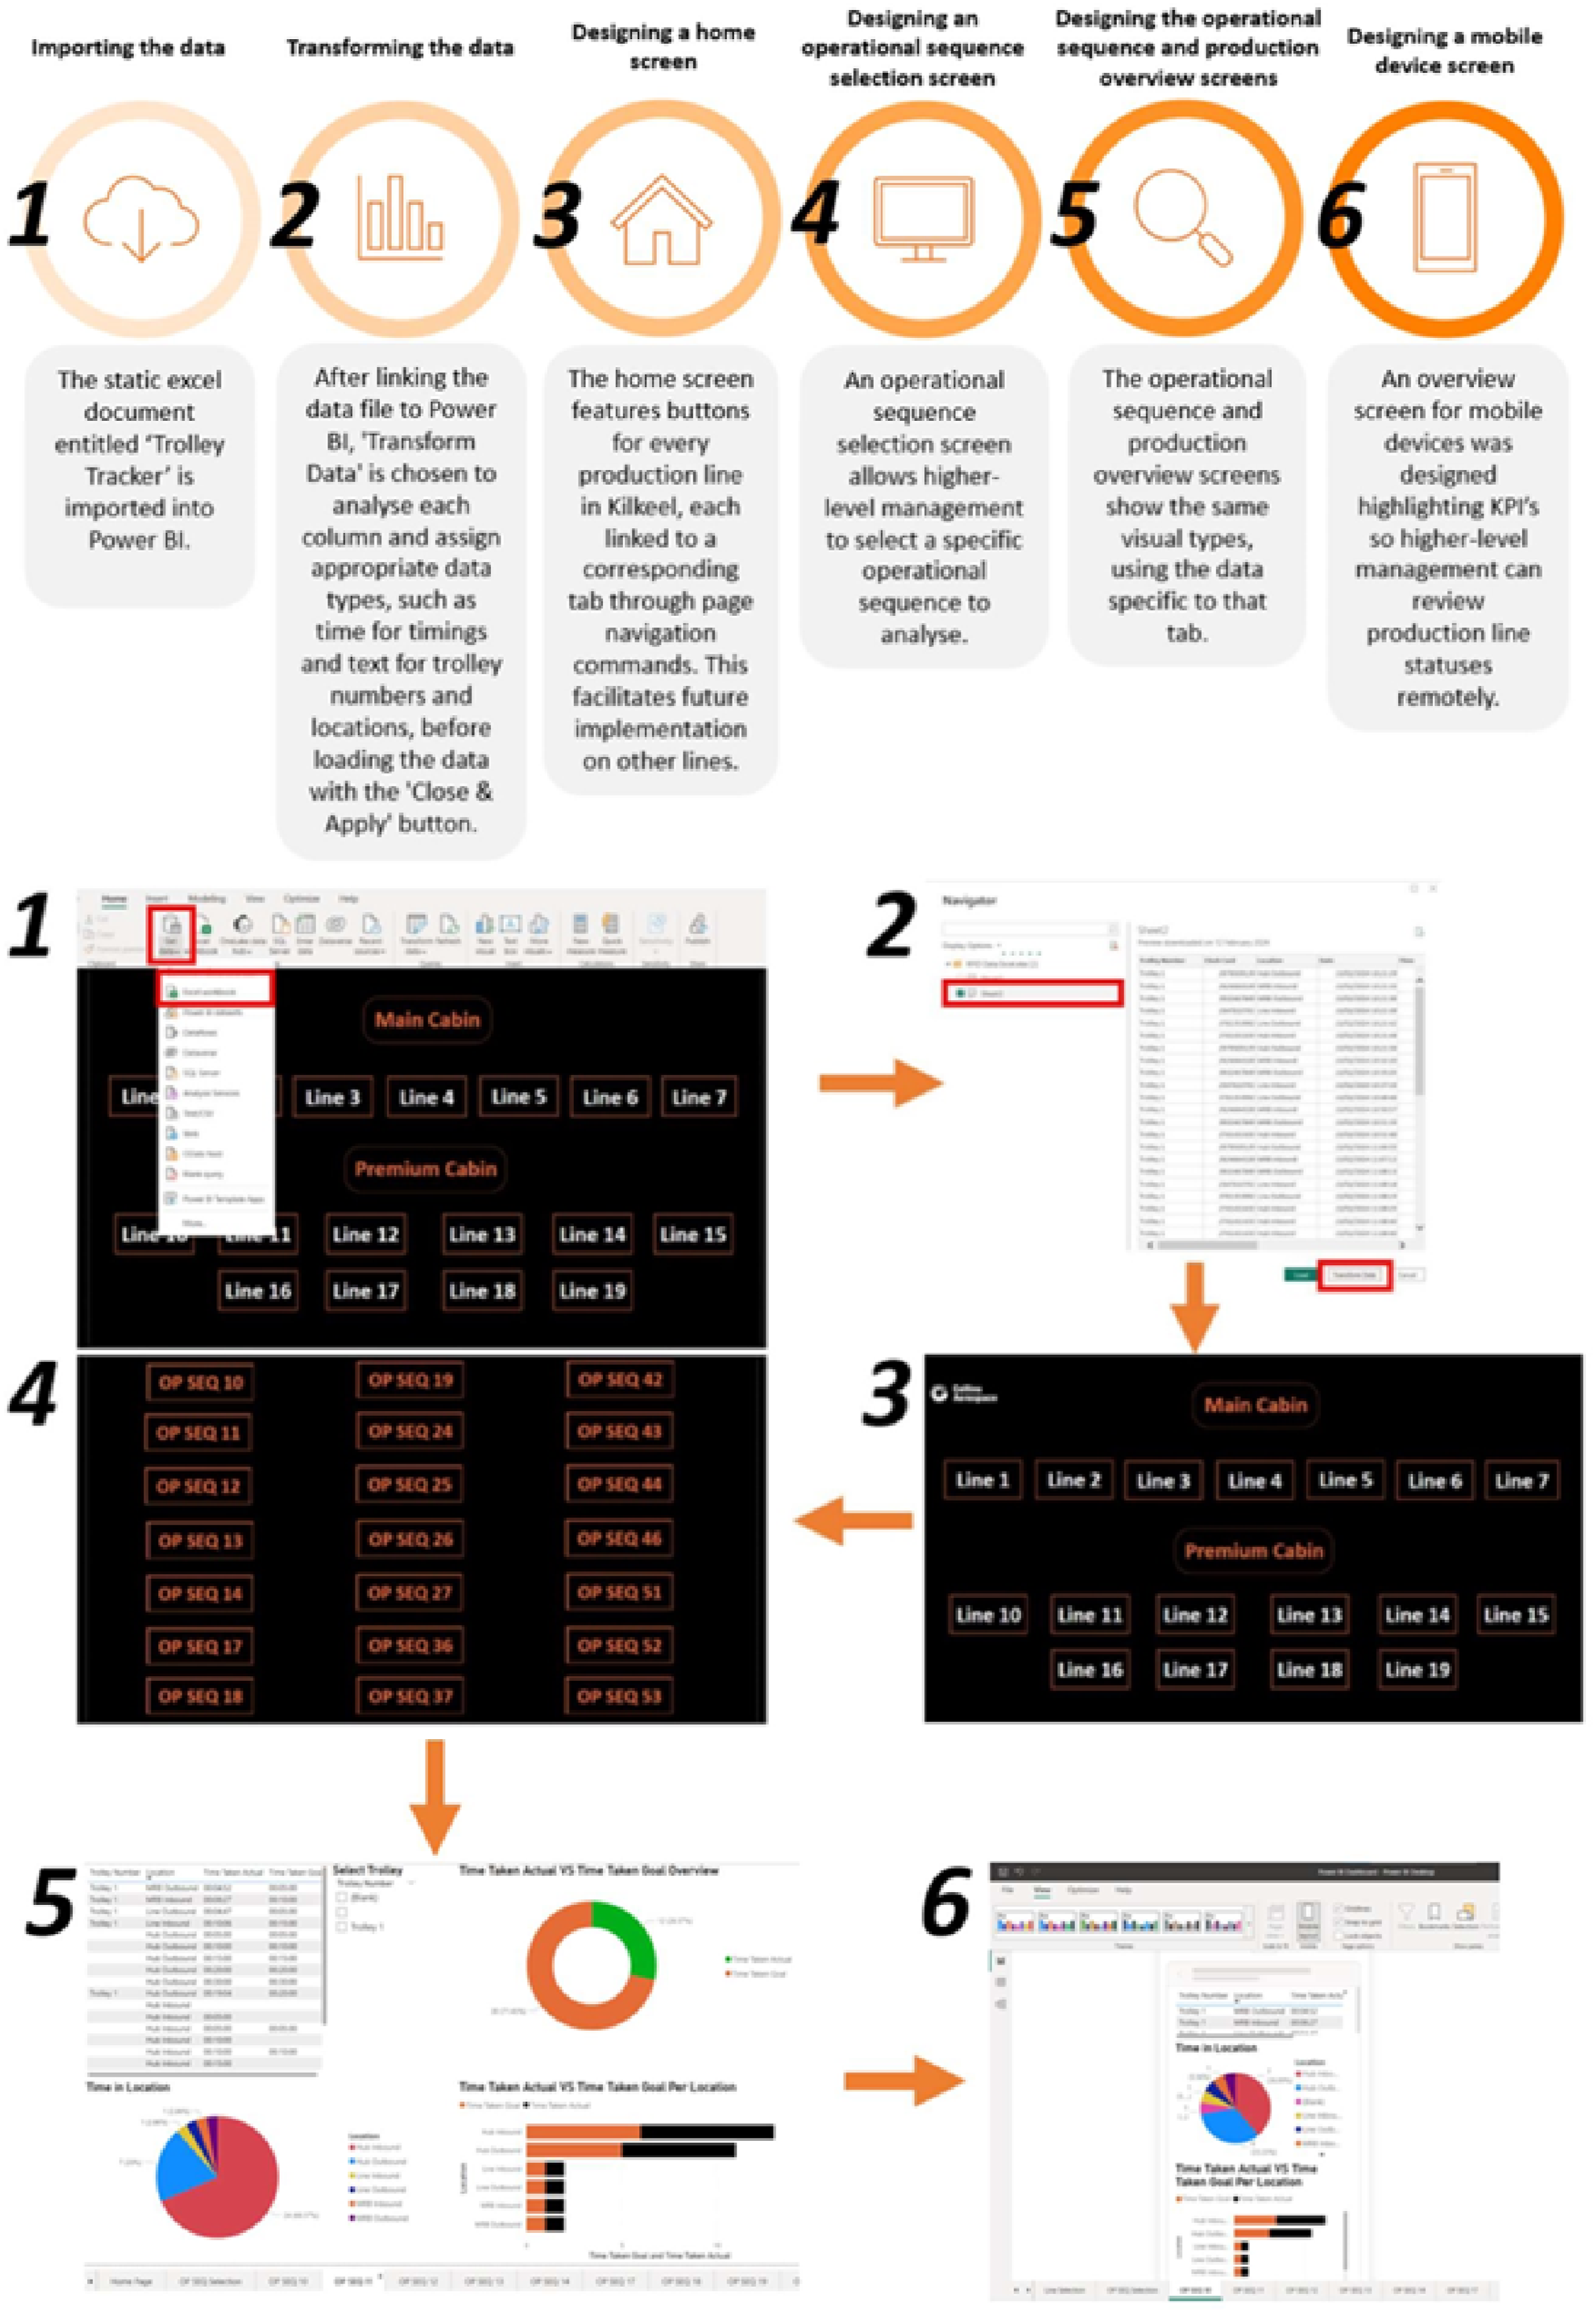
System Review
Data was collected by simulating the typical trolley process flow, through the relevant buildings, shown in Figure 7. This was done manually by following three trolleys through the production allowing them to encounter natural obstacles and obstructions to their process flow. The process commenced at Building Eight, the logistics and storage facility of Collins Aerospace, where the ‘Hub Outbound’ card was scanned against the trolley reader. Subsequently, the trolley was loaded onto the transport lorry for transit to Collins’ primary site. Upon arrival at Building Five, the ‘MRB Inbound’ card was scanned to confirm trolley receipt. Following assessment in the material review board (MRB), the trolley was processed through ‘MRB Outbound’ before proceeding to the production line, where it was scanned at ‘Line Inbound’. After unloading and a brief wait adjacent to the production line, the trolley was retrieved and scanned at ‘Line Outbound’, initiating its return to MRB. After completing the necessary processes in MRB, including scanning at relevant checkpoints, the trolley was reloaded onto the lorry bound for the Hub. When it arrived, it was scanned at the ‘Hub Inbound’ checkpoint and made ready for rekitting to enable subsequent iterations of the process. Building Maps With Allocated Scan Points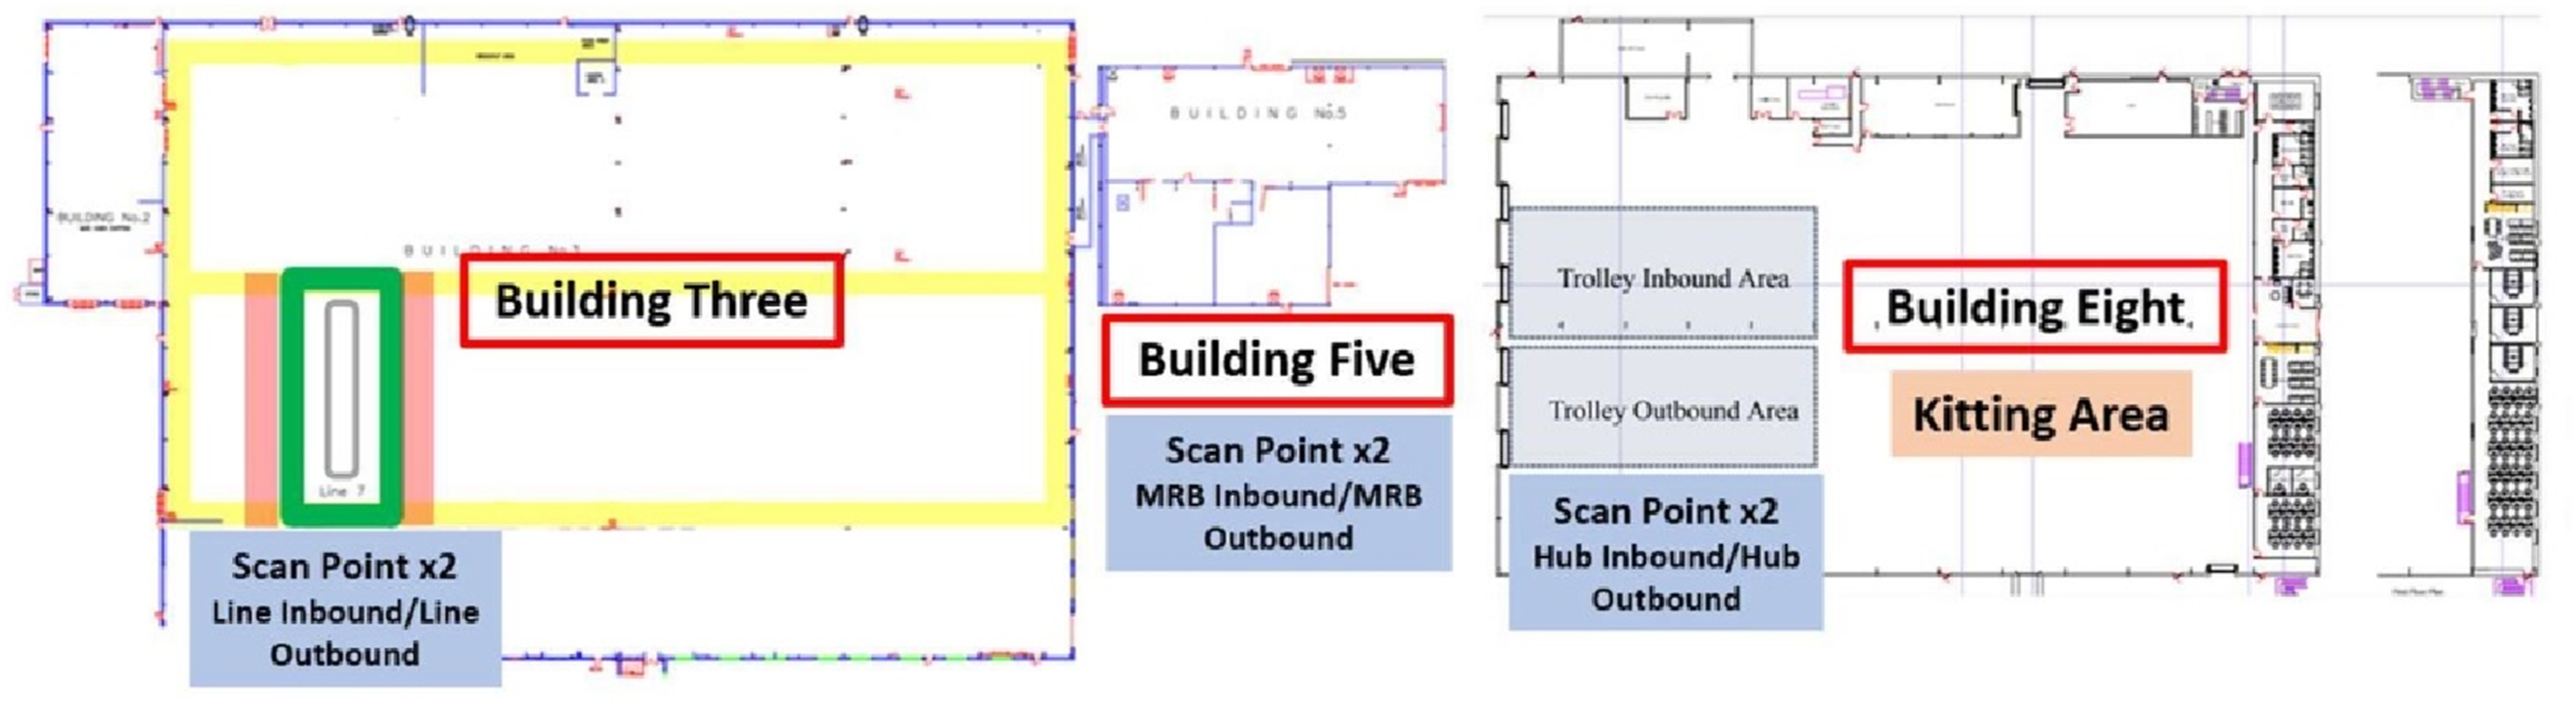
System Operation and Challenges
The deployment of the system faced some challenges, particularly in integrating the new technology with existing IT systems, which required careful configuration to ensure compatibility with legacy infrastructure. Human factors were another consideration, as training was required to ensure employees could use the system effectively and consistently. Additionally, ensuring the security of the data collected and transmitted by the RFID system to prevent unauthorised access or data breaches was a significant concern, as was addressing privacy concerns related to tracking individual movements and inventory items (Karygiannis et al., 2007; Wilkinson et al., 2016). However, since Collins Aerospace operates under a secure network, this issue was reduced, and there was protection against unauthorised network access ensuring compliance with company privacy regulations.
Once the system was operational, the RFID tags (Figure 3(C)) communicated with the Power BI-based VMS by transmitting unique time and location data via the RFID readers (Figure 3(A)). This data was then processed through an import data method on Power BI to update the system at scheduled intervals. Key considerations in this integration included ensuring seamless data transmission between RFID hardware and Power BI, optimising data refresh rates to maintain real-time accuracy without compromising system performance and standardising data formats to align with existing company analytical frameworks.
Assumptions and Limitations
Several key assumptions were made for the project. It was assumed that the current production lines and inventory management processes would integrate seamlessly with the chosen RFID technology, specifically the WAVE ID Plus Mini V3 reader. Data integration was expected to be smooth, with the data collected from RFID readers accurately reflecting real-time inventory status and integrating effectively into the Power BI dashboard without significant latency or data integrity issues. The solution was also assumed to be scalable from the POC to a factory-wide implementation without encountering unforeseen technical or logistical issues. However, careful consideration of data accuracy and operational complexity should be included in any scaling plans. Integrating the new technology with existing systems may produce unforeseen technical challenges, for example, initial implementation and integration could result in system downtime, affecting production schedules. Additionally, the metrics used to measure performance improvements might not capture all dimensions of the impact, such as long-term reliability and maintenance costs, and the results from the POC might not fully represent the outcomes when scaled to the entire factory due to varying conditions and complexities. However, it is hoped that this simple, yet effective system framework could be applied to a number of sectors where materials must be tracked and recorded into and out of different locations at different intervals with limited hardware requirements.
Results
Final Physical and Visual Management Systems
The final physical system consisted of an RFID reader integrated with a USB hub, securely mounted to an inventory trolley. RFID cards were positioned at specified locations to facilitate the scanning of trolleys, logging their entry and exit. The collected data was transferred to an associated database while the results of the physical implementation of the system were displayed through the finalised visual management system.
Upon scanning their designated RFID card at each location, employees trigger updates on the database via the RFID devices integrated onto the trolleys. This database is directly connected to the final visual dashboard. Each screen is designed to match the Collins Aerospace branding guidelines, ensuring a consistent visual identity. The final home screen was published to the Power BI service and facilitated seamless navigation and filtering across different production lines within Collins Aerospace.
Different screens offer the choice to display either an overview of the entire production line or a detailed view of individual workstations.
Two different workstations were compared to illustrate the outputs from the system. Workstation Ten, Figure 8(A), shows a trolley which is moving with no apparent issues. The Time Taken Actual vs Time Taken Goal overview displays a green indicator, showing the operation is running on time, specifically 28.57% below its goal time. This observation may signal the potential for further efficiency gains by reducing the goal time associated with this trolley. Furthermore, the Time Taken Actual vs Goal Per Location visual corroborates this, showing the trolley consistently operates within the goal time specified across the various locations. The Time in Location visual indicates the percentage of time each trolley spends in an area, with Figure 8(A) highlighting the ‘Hub Inbound’ and ‘Hub Outbound’ locations utilise the most amount of time in this process. Workstations Operating Under Perfect and Imperfect Conditions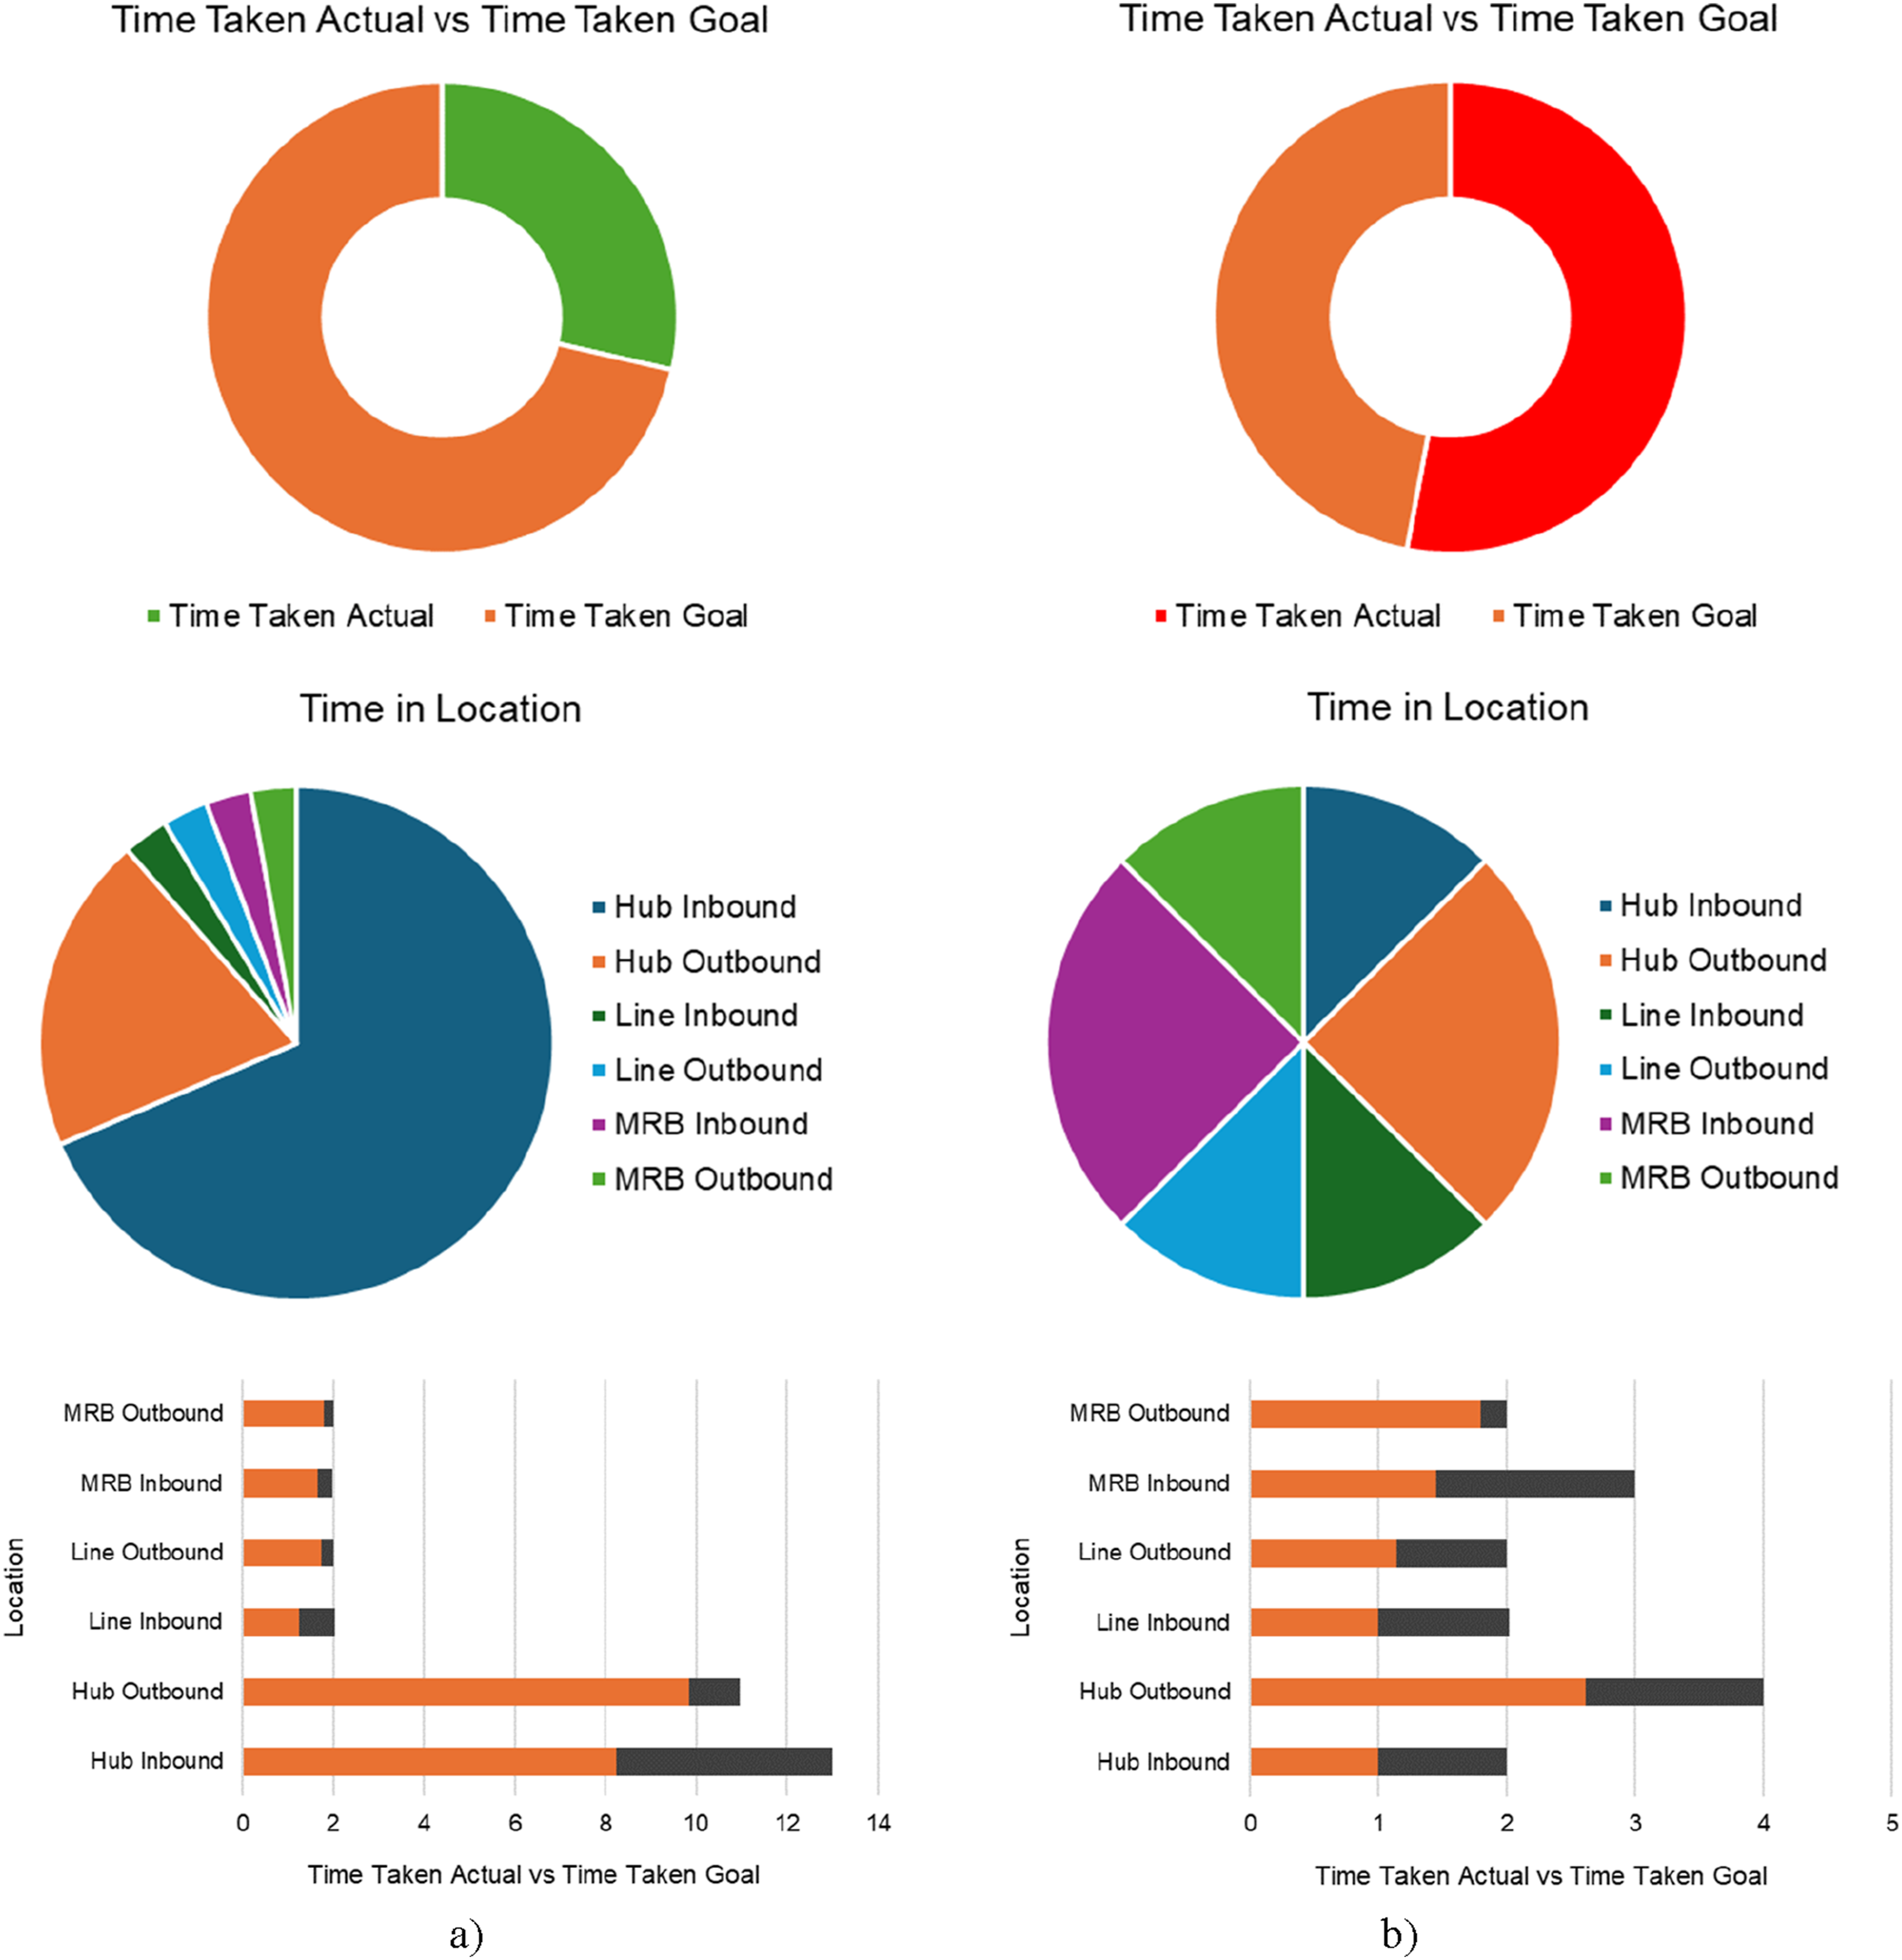
Workstation Eleven (Figure 8(B)) illustrates a station where an issue has been identified concerning the trolleys performance. The Time Taken Actual vs Time Taken Goal overview is marked red, indicating that trolley one is running behind schedule by 52.94%. It is also shown in the Time Taken Actual vs Time Taken Goal Per Location visual that the actual time taken for this trolley has significantly exceeded the specified goal time across the different locations. Additionally, it can be seen in the Time in Location visual that trolley one spent the majority of its time in ‘Hub Outbound’ and ‘MRB Inbound’ signalling potential issues within these areas. The ‘Select Trolley’ visual template can efficiently filter visuals based on a specific trolley number. A mobile-friendly layout of the Power BI dashboard was also developed, considering the necessity for users to access visuals remotely for streamlined problem-solving. No bespoke mobile app was developed.
Efficiency of Final System
Comparing production with and without the proposed solution saw distinct differences with regards to lower missed takt times, fewer line stops and increased blue cards. Blue cards, a direct and quantitative indicator of product quality, were awarded to seats that exited the production line without any missing parts. These metrics were compared over four working days within Collins Aerospace and can be seen in Figure 9. Missed takt times decreased by 52.2% and line stops decreased by 75% indicating substantial improvements in maintaining the production schedule and reducing interruptions. The number of blue cards increased by 7.9% reflecting an increase in throughput and production efficiency. Efficiency of Production With and Without Implemented Solution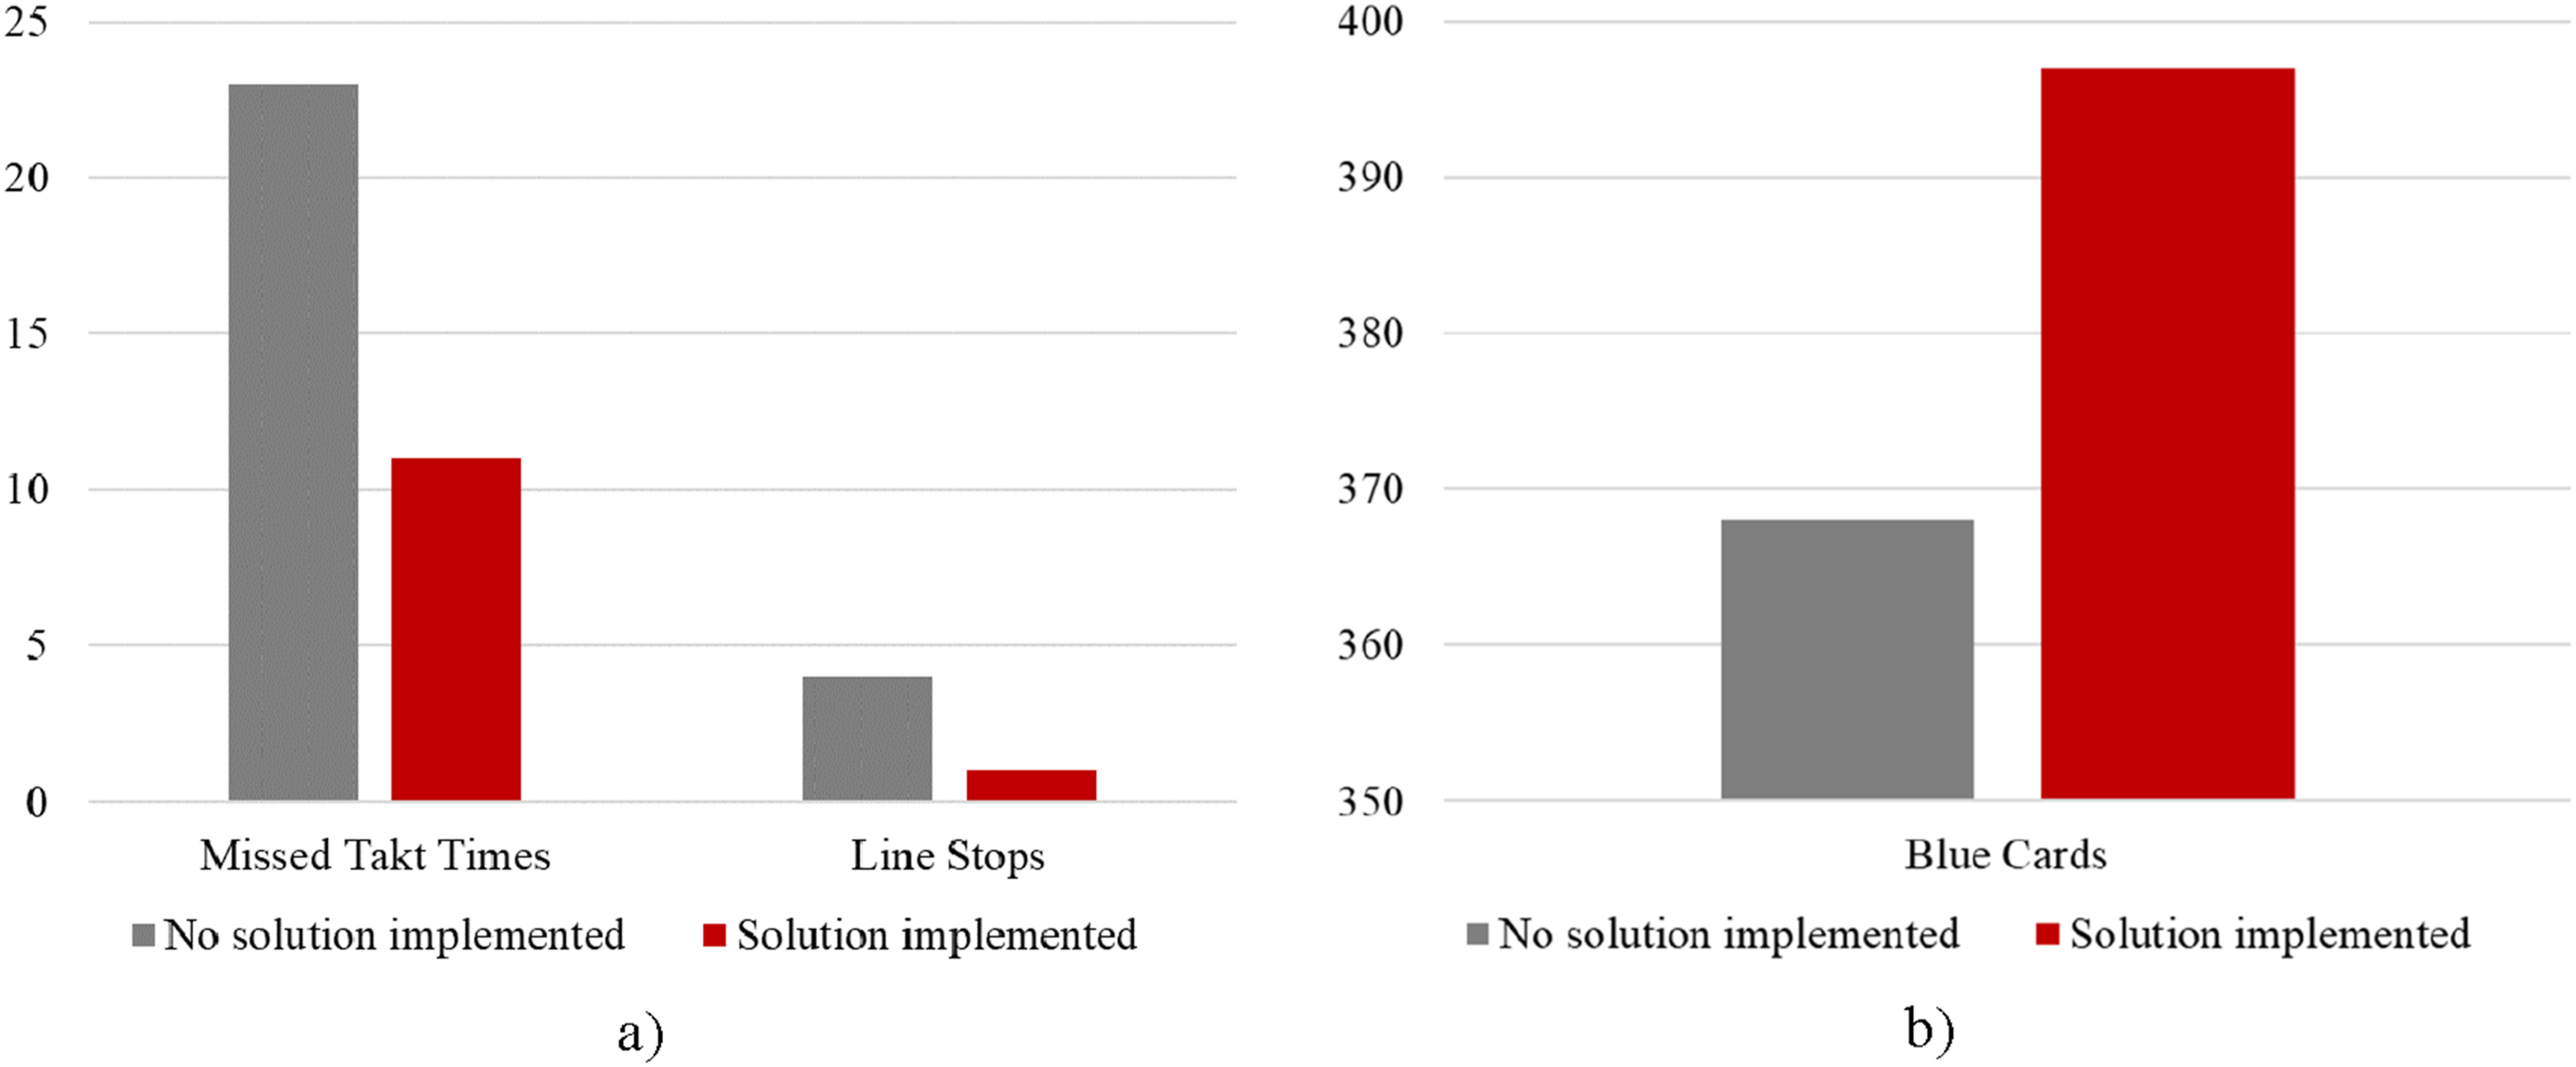
The efficiency concerning missed takt times and blue card awards was lower compared to line stops, primarily due to global supply chain challenges beyond the project’s control. The prototype implementation cost $600 covering RFID hardware, Power BI licenses and necessary infrastructure updates. Scaling to a full production line would require an estimated investment of $36,000. A financial review of the proposed system revealed that the pre-implementation trolley inefficiencies cost Collins Aerospace approximately $47,200 weekly, amounting to around $2.45 million annually, as per MRB records. Therefore, the system presents a significant return on investment, demonstrating both financial and operational benefits for large-scale adoption. Implementing the proposed system factory-wide could recover these costs annually due to improved traceability, allowing for reinvestment in further projects or enhancements within the factory.
Conclusions
This paper features the novel application of Radio Frequency Identification (RFID) technology for tracking inventory trolleys within a large-scale aerospace manufacturing environment in conjunction with a Business Intelligence (BI) Visual Management System (VMS). Through implementation of this approach, enhanced trolley movement efficiency has been achieved with increased traceability and Key Performance Indicators (KPIs) presented in a visual dashboard. This improvement has allowed for inventory optimisation, minimising excess stock and preventing shortages and inventory loss, enabling data-driven decision-making regarding resource allocation and workflow optimisation.
RFID tracking technology was implemented using RFID readers, passive Ultra-High Frequency (UHF) RFID cards and a USB hub for remote connection to Collins Aerospace’s IT systems via an import data protocol. The collected data focused on trolley location and timing, proving efficient for inventory process flow analysis and optimisation. BI visual management systems were compared in the context of the case study herein with Power BI selected for its integration and cost-effectiveness. The final Power BI system provided intuitive KPI visuals and increased production line efficiency by 45%. As a result, the system supports sustainability by aligning with UN Sustainable Development Goals and promoting economic growth. Specifically, the RFID-VMS system herein impacts; Goal 8, Decent Work and Economic Growth, by reducing errors and ensuring timely access to materials, Goal 12, Responsible Consumption and Production, through reduced paper usage and operational waste, and improved digitalisation, and Goal 13, Climate Action by lowering energy consumption and through increased automation compared to the existing manual system. While this system has been implemented in a large-scale aerospace manufacturing environment, it would be adaptable to smaller manufacturing environments or other sectors given the affordability of the off-the-shelf RFID readers and communication technologies used herein.
Following this successful implementation, the following conclusions can be drawn: • An RFID system to track inventory movement around one main cabin production line and a corresponding visual management system for KPI review has been developed, • The solutions outlined in this work align with the Operational Excellence team’s goals, supporting the evolution of Industry 4.0 within Collins Aerospace, • A system has been developed to manage and monitor trolley durations and locations on one main cabin production line, • RFID tracking was identified as the most effective technology for inventory management in warehousing, while Power BI was used to create a user-friendly visual management system for KPI display, • The finalised system is designed for seamless transition between production lines and can be implemented on one production line within one day, • Overall, the RFID technology improved efficiency by 45% and has the potential to reduce waste costs by approximately $2.45 million per annum with an estimated investment of $36,000.
To enhance the system’s capabilities, several recommendations are proposed. An investigation into the potential of a SQL Server Analysis Services (SASS) database should be carried out to allow the use of a live connection data type, facilitating the use of active RFID and eliminating any human error. To enable this, a trolley with an embedded active RFID tag is suggested. A systematic review of the KPI’s and goal trolley times should be conducted to ensure the visuals are consistent with the companies needs and goals and this may include the addition of extra screens. While Power BI presents a satisfactory VMS framework, provided sufficient software licensing agreements are available, exclusive company specific visual management software could be pursued. Future research could consider the application or integration of machine learning or artificial intelligence (AI) into the VMS to enable data-based decision-making and insight into individual trolley performance and production operations.
Footnotes
Funding
The authors received no financial support for the research, authorship, and/or publication of this article.
Declaration of Conflicting Interests
The authors declared no potential conflicts of interest with respect to the research, authorship, and/or publication of this article.
Data Availability Statement
Data will be made available on request.