
Abstract
Experimental design and optimization of artificial turf playing surfaces is costly and time-consuming. Although contemporary finite element (FE) models can offer insight into design choices, they have not been validated for a wide range of turf design parameters. In the present study, 14 physical turf designs with varying infill composition (different infill mixture ratios), fiber areal density (fibers per square inch), mixture composition (different infill particle diameters), turf height (varying both fiber length and infill depth), infill depth (using the same fiber length), and fiber type (monofilament vs slit film) were constructed. The turfs were tested using the Biocore Elite Athlete Shoe Turf (BEAST) test apparatus under translation and rotation loading, with the results typically showing low sensitivity to variations in turf design parameters (<10% absolute difference for most metrics), except for extreme case, such as 100% sand infill and very low areal fiber density (0.5 fibers/cm2). Corresponding FE models were developed using a recently validated methodology and captured the variation in response under both translational and rotational modes of loading with a CORA objective rating between 0.53 and 0.93 (mean 0.75). The models demonstrated the ability to reproduce the main effects from the experimental tests and to predict the rank order of the effects measured experimentally. Importantly, the model was able to quantify the effect of varying parameters and show potential for use in future turf design and optimization.
Introduction
Artificial turf has become a common playing surface for elite-level American football, with 15 out of 30 National Football League (NFL) stadia using artificial turf in the 2024-2025 season. Due to the popularity of artificial turf, it is important to understand the effects of the design parameters that are chosen for a given turf configuration. Artificial turf is typically composed of a polymeric carpet with stitched or woven fibers supporting a roughly 20 to 50 mm thick layer of infill, 1 and infill that is often composed of a mixture of styrene-butadiene rubber (SBR) crumb and sand, 2 with use of non-rubber infills becoming increasingly common. 3 A number of turf parameters, including infill depth and type, fiber height and type (slit-film vs monofilament), stitch rate and gauge (areal density of fibers), wear, and the presence of a shock pad, may influence the mechanical interaction between a cleated shoe and the artificial surface.4,5
Numerous testing devices have been used to characterize sports playing surfaces, including drop tests 6 and torsional shear tests. 7 While these devices are useful to provide a measure of field hardness for maintenance purposes, 6 these apparatuses were not designed to reproduce similar loading to a playing surface that would be imparted by athletes during high-level American football play. To address this shortcoming, the Biocore Elite Athlete Shoe Turf (BEAST) test apparatus was developed.8–12 The BEAST was intended to assess shoe-turf interactions at the high levels of vertical force (2.0–2.8 kN) that can be exerted by professional American football players on a playing surface. 13 The BEAST test apparatus (Figure 1(a)) comprises a vertical loading frame to provide a static vertical load, with a pneumatic system used to engage a horizontal loading frame to exert lateral forces or a rotational shaft to impart torsional moments, depending on the type of motion being investigated. 8 While both natural grass and artificial turf have been tested using the BEAST apparatus and reported in aggregate, 10 a systematic, parameter-by-parameter investigation into the effects of various infill and carpet parameters has only recently been conducted experimentally. 12
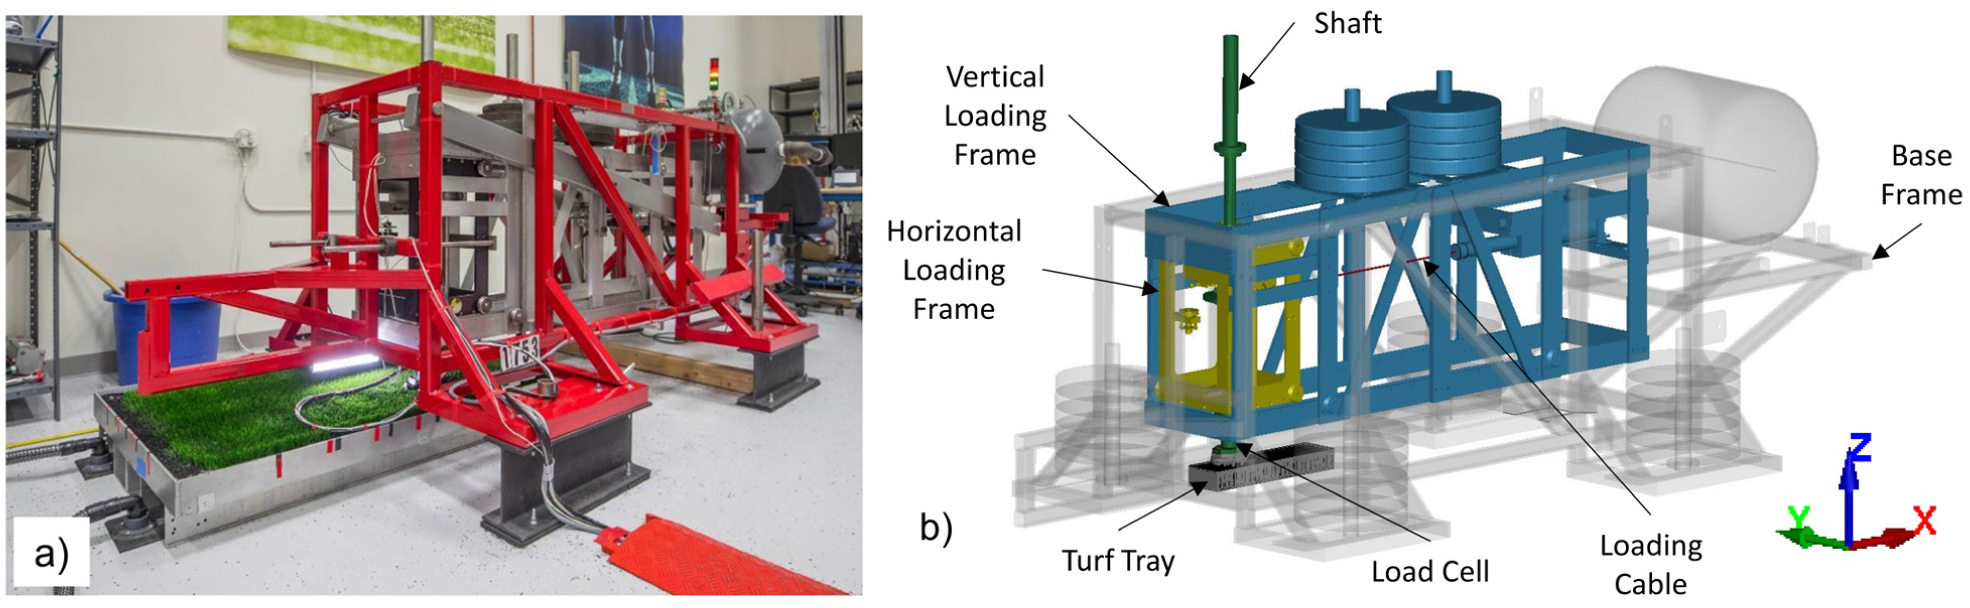
Biocore Elite Athlete Shoe Turf (BEAST): (a) test apparatus and (b) model.
The use of modeling to assess different aspects of artificial turf surfaces has been investigated by several researchers.14,15 Importantly for the current study, Bustamante et al. 16 presented a modeling approach using ground-up development, where material testing of the constituent infill 17 and carpet components was carried out with verification modeling undertaken to ensure that the model captured the material-level response. Friction testing was also performed to provide parameters for modeling the infill-carpet and turf-shoe interaction. Final system-level validation of the model was done using high and low-powered BEAST tests under translation and rotational loading (Figure 1(b)). 16 This model suggested that the tensioning of the fibers was important for infill pressure to build and provide resistance to the cleat moving through the turf.17,18 While the model was originally developed with the intention of improving the understanding of the loads provided by the BEAST test apparatus, the modeling approach was also used to investigate vertical impact response measured through a Clegg Impact Soil Tester (Lafayette Instruments, Lafayette, IN, USA) drop test apparatus on a series of 14 turf configurations with differing infill and carpet parameters. 19 In that study of impact response, peak accelerations were predicted by the model within 10% of the test averages, and the model was able to capture the experimental trends of the infill and carpet parameters. Importantly, the models used in this study were all developed using the same ground-up approach presented by Bustamante et al., 16 meaning that only material properties and model geometry were changed between these models, all based on physically measured values. This outcome gives confidence that the approach presented by Bustamante et al. 16 could be applied to turfs with configurations that differed from the baseline configuration that was reported.
In the current study, the 14 turf configurations described by Correia et al. 19 were assessed under translation and rotational modes of loading using the BEAST test apparatus. Models of these tests were then constructed and compared to their corresponding experiments 12 to assess the ability of the modeling approach to capture the wide variety of carpet and infill parameters under aggressive, athlete-informed loading.
Methodology
In the present study, a series of BEAST 12 tests were carried out on 14 different turf configurations (Table 1) in both rotation and translation loading. The layered baseline configuration discussed in this work was initially used to validate the finite element model described in Bustamante et al. 16 Most configurations were selected such that the baseline configuration served as an intermediate condition with the parameter of interest being varied above and below the baseline configuration. The layered baseline and monofilament turf configurations used a three-layer infill system with a 5-mm sand base layer (0.8-mm median particle size (D50)), a 34-mm mixture (67% by weight (wt%) 0.8-mm D50 sand; 33 wt% 0.8-mm D50 SBR) layer making up the main component of the infill, and a 5-mm layer SBR top (1.6-mm D50). For the current applications, the mixture layers were created by adding the correct mass of rubber and sand to large-capacity buckets and manually agitating them for roughly 1 min to generate a uniform sand/SBR mixture prior to spreading the mixture into the tray. Care was taken during spreading to ensure that the sand grains did not separate due to their greater mass compared to the SBR crumb. The remaining configurations, which all used a single layer of infill, were selected to assess the effect of infill composition (mass ratio of SBR to sand), mixture composition (D50 of sand and SBR for a fixed infill composition), fiber areal density, turf height (changing both infill height and fiber length), and infill depth (changing infill height while keeping fiber length constant).
Description of turf configurations.
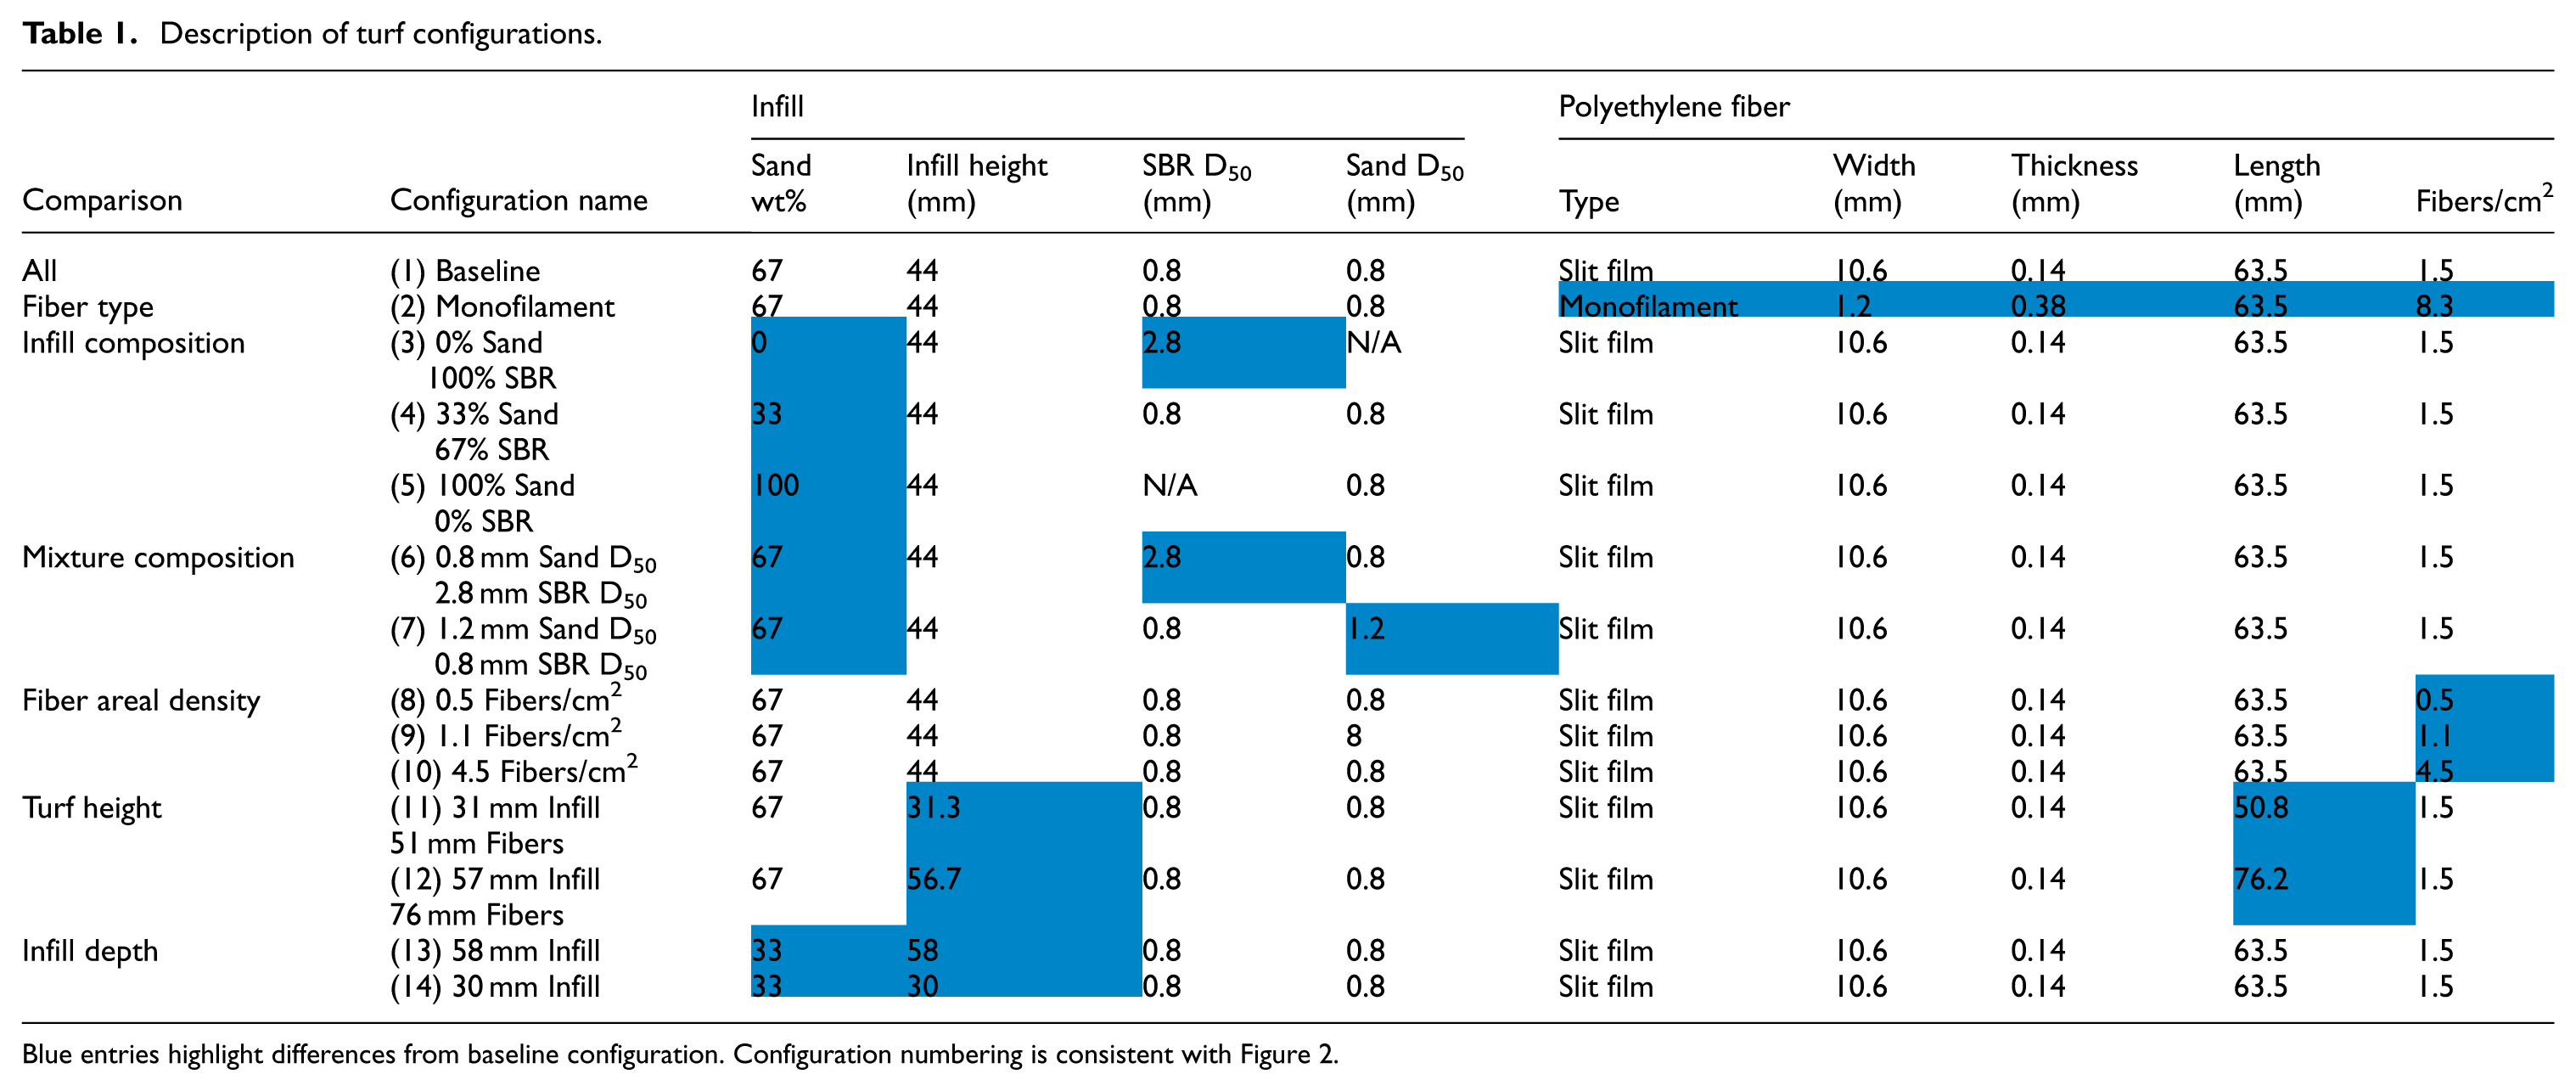
Blue entries highlight differences from baseline configuration. Configuration numbering is consistent with Figure 2.
Experimental methodology
For all turf configurations, 1449-mm by 863-mm trays were used to construct the turf. The carpets were laid in the trays, clamped along the edges, and brushed using a power broom to stand up the fibers. Infill was then added up to half the desired depth and rolled 20 times with a weighted cylinder (117 mm 298 mm Ø, 38.5 kg), similar to that described in FIFA, 20 to compact the base of the infill and eliminate any voids in the infill as the base was built up. A stiff broom was then used to straighten the fibers, and infill was added until the desired depth was achieved. The turf was then subjected to 300 passes of the weighted cylinder to ensure a uniform compaction. This procedure was developed after consultation with several NFL field managers and was further validated by measuring low coefficients of variation for 15 infill depth measurements (<2.5%) and five Clegg test peak accelerations (<5%) at random locations several trays prior to BEAST testing.
Translational or rotational loading was carried out on each surface using the BEAST apparatus. A metal cleat form of a typical American football cleat (Nike Vapor Jet, Beaverton, OR, US, USA) was lowered onto the surface of each turf, and a 2.8-kN static preload was applied. Once the cleat form was fully settled into the turf, a pneumatic piston connected to a metal cable was used to load the central shaft that had lockouts to apply the desired motion in either translation or rotation. A six-axis load cell between the cleat form and the end of the shaft was used to measure the force and moments sustained through the cleat-surface engagement. A magnetic, touchless linear position sensor was mounted between the vertical loading frame and the translation loading frame of the BEAST (Figure 1(b)) to measure the displacement of the cleat through the turf under translation loading. For rotation loading, a rotary potentiometer and pulley system was mounted between the horizontal loading frame (which was fixed to the vertical loading frame during rotation loading) and the rotating shaft. An additional load cell was mounted between the end of the piston and the cable used to load the system, to measure the cable force. For translation, the ‘X’ (fore/aft, Figure 1(a)) force-displacement response was the primary measure of interest, while for rotation, the ‘Z’ (vertical axis, Figure 1(a)) moment-rotation was the focus of the analysis, although the other channels were monitored for abnormalities, of which none were present.
Finite element modeling methodology
The finite element turf model as described in detail in Bustamante et al. 16 was used as the baseline model in this study and was extended to generate the 14 new turf models investigated (summary in Figure 2), using the same representative volume element (RVE) approach to generate each turf as that presented in Correia et al. 19 A single infill layer version of the baseline model was created to investigate numerically the isolated effect of a single layer of infill versus the three-layer infill used in the baseline configuration. The comparison of infill depth used a single layer of 33 wt% SBR / 67 wt% sand infill for all three infill depths, and the fiber comparison used the same three-layer infill system for both monofilament and slit film fibers. A brief summary of the modeling methodology presented by Bustamante et al. 16 is repeated here for completeness. Note that the same explicit finite element solver was used for both studies (LS-DYNA V12.0.0, Ansys, Canonsburg, PA, USA).
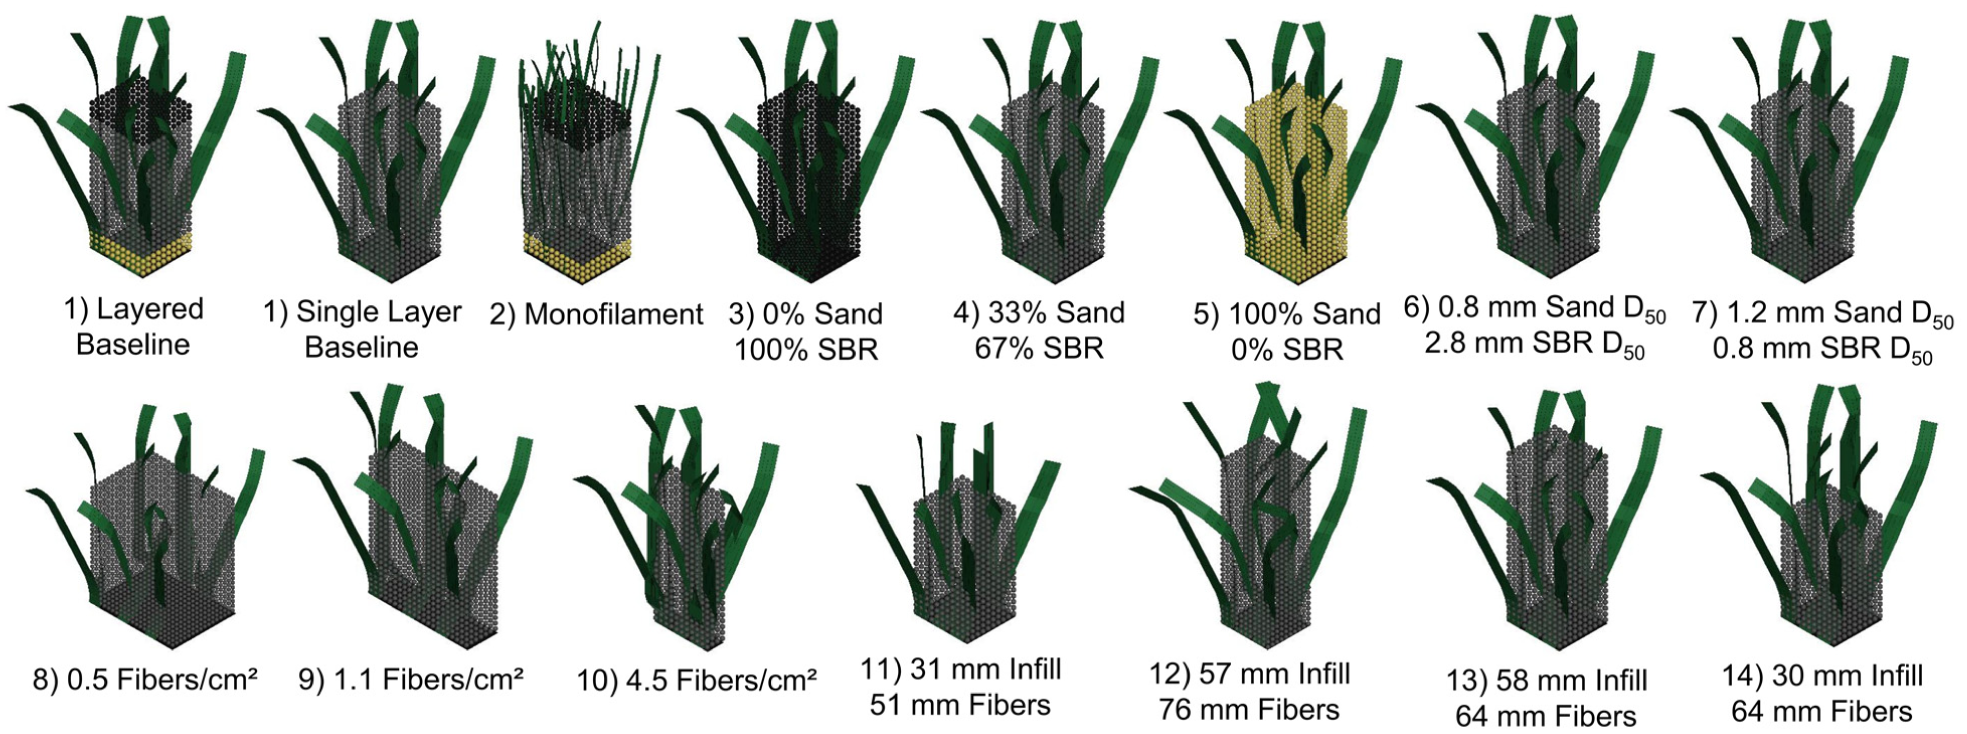
Examples of RVE for each turf configuration investigated. Configuration numbering refers to Table 1.
A series of carpet meshes was generated for each turf configuration, using thin shell elements for the fibers and backing layer. The RVE approach was used to generate the carpet mesh, incorporating the geometry of three fiber stitches and the backing layer. This geometry corresponds to the stitch rate (i.e., the space between stitches) of the three fibers and the distance between the rows (stitch gauge) being modeled. A linear pattern duplicating the RVE was then used to generate the full-sized turf geometry used for the study (approximately 229 mm by 228 mm for the rotation model and 514 mm by 125 mm for the translation model). For the fiber and backing layer constituent components, the appropriate thickness was applied to the shell for each part. The material properties for the viscoelastic slit-film material model (G1 = 61 MPa, β1 = 0, G2 = 66 MPa, β2 = 0.01, G3 = 250 MPa, β3 = 0.25), were from Bustamante et al. 16 To extract the material properties for the monofilament fibers, tension testing was carried out on the monofilament fibers using the same approach as the testing used to measure the slit film-film properties presented in Bustamante et al. 16 (G1 = 36 MPa, β1 = 0, G2 = 9 MPa, β2 = 0.001, G3 = 24 MPa, β3 = 0.1, G4 = 150 MPa, β4 = 1.0).
The infill was modeled using a field of smoothed particle hydrodynamic (SPH) elements with a pitch of 2 mm, a fixed smoothing length of 1.42 mm, and a volume of 11.9 mm3 with the appropriate dimensions to match the area of the carpet and the correct infill height for each turf configuration. Material testing for the infill and the procedure used to fit to the pressure-dependent Drucker-Prager material model used for the infill was described in Watson et al. 17 Interactions between the infill and carpet were modeled using a SPH node-to-shell surface penalty-based contact with the SPH elements being able to interact across the RVEs.
The BEAST apparatus model (Figure 1(b)) was constructed using a series of rigid shell bodies with the proper mass and inertial values prescribed, and translation and rotation joints defined between parts to re-create the physical apparatus. The simulation was split into three phases: (1) preconditioning, (2) settling, and (3) testing (Figure 3). Prior to loading the turf with the BEAST apparatus, a pre-conditioning phase of the model was carried out in which a rigid plate was used to compact the infill to mimic the rolling procedure conducted experimentally. After this load, which occurred over 110 ms, the turf was allowed to settle for 140 ms to allow the kinetic energy of the model to stabilize below 0.1 J for more than 50 ms. Note that for the all-sand infill, this pre-conditioning step was not included due to the incompressible nature of sand, which led to excessive expulsion of material as the load was removed. During the settling phase (between 0 and 140 ms), a prescribed vertical displacement was applied to the vertical load frame of the BEAST apparatus to position the cleat approximately 1–5 mm above the average measured cleat depth at the start of the tests. After 140 ms, a 1 g gravity load was applied to the frame to allow the final settling of the cleat based on the equilibrium between the vertical force due to gravity and the resistive force from the turf onto the cleat form. After the turf and cleat form had reached equilibrium, the cable was loaded using a force corresponding to the force measured by the cable load cell from tests where no translation or rotation was allowed (fixed tests) to account for the non-inertial frame of reference of the accelerating cable load cell.
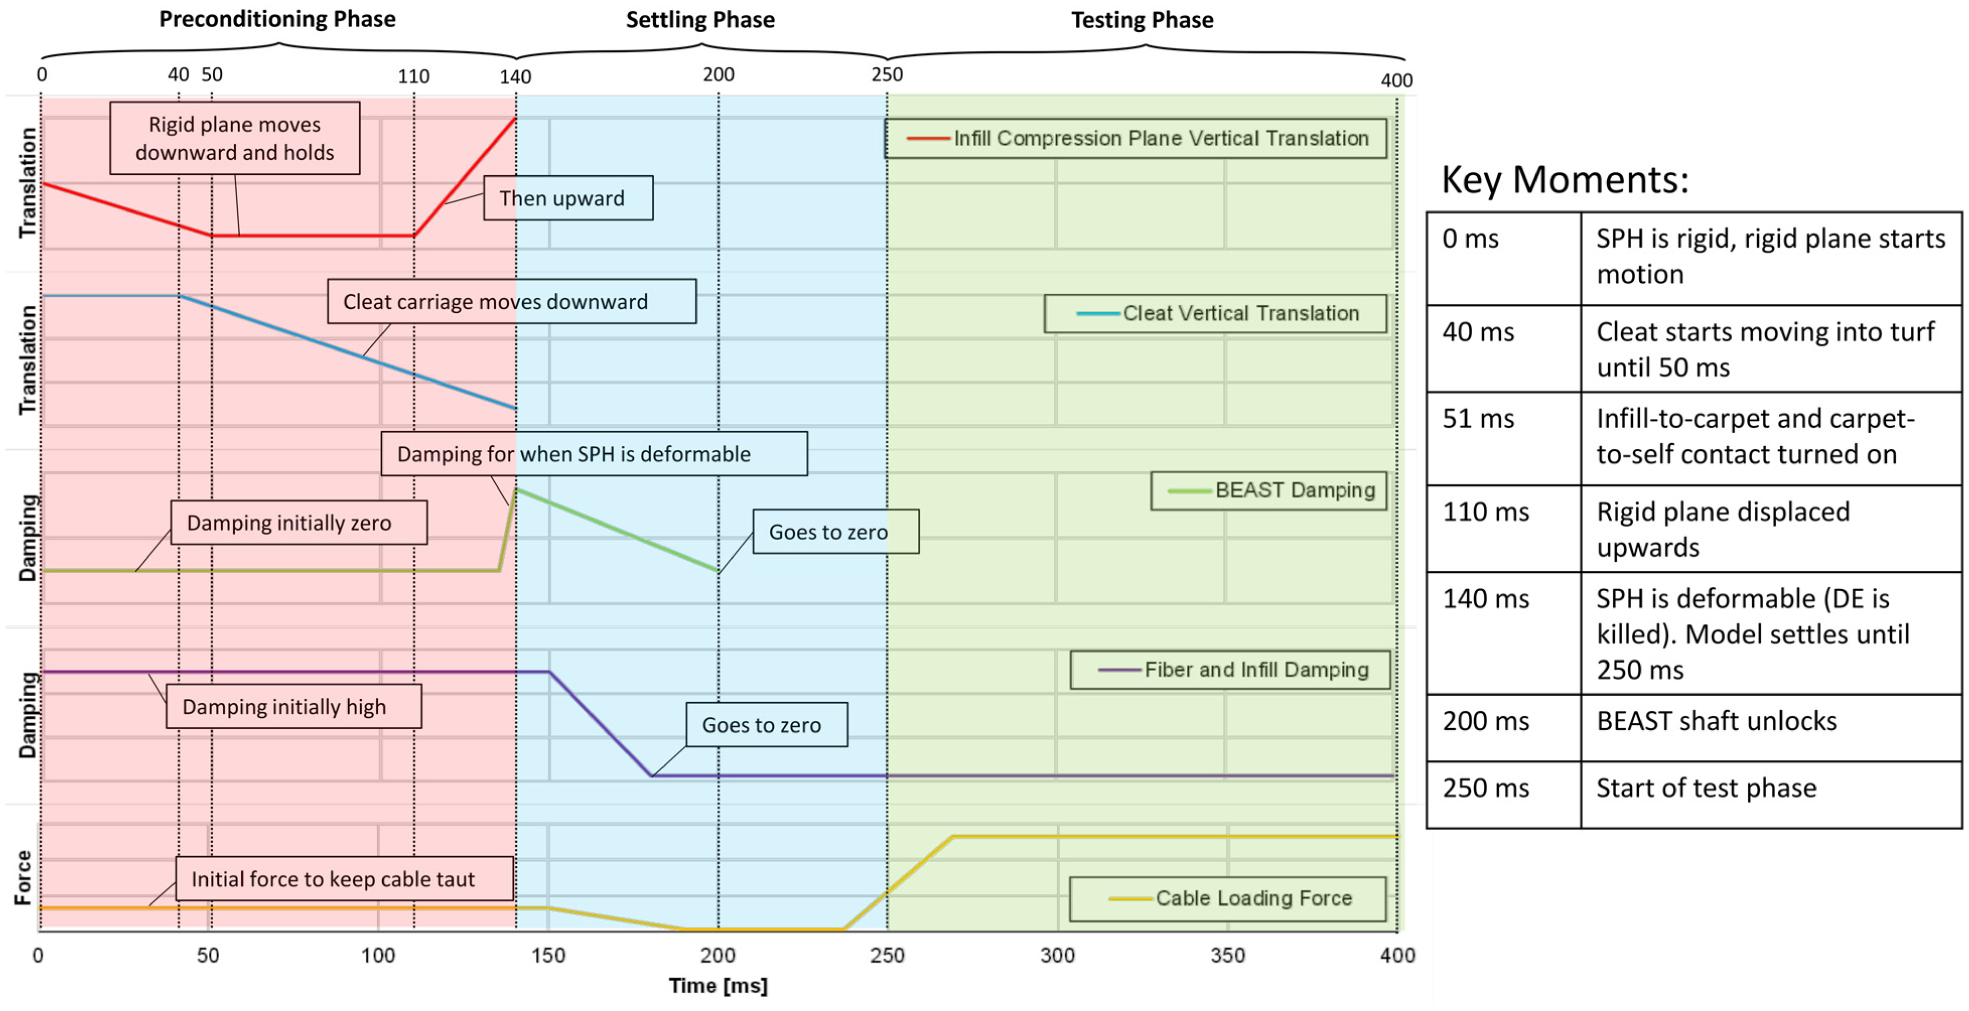
Summary of simulation timing for each of three phases: preconditioning (red), settling (blue) and testing (green).
Results and discussion
Experimental test results and discussion
Both the force-displacement response under translation loading (Figure 4) and moment-rotation response under rotational loading (Figure 5) tended to exhibit a bilinear response.
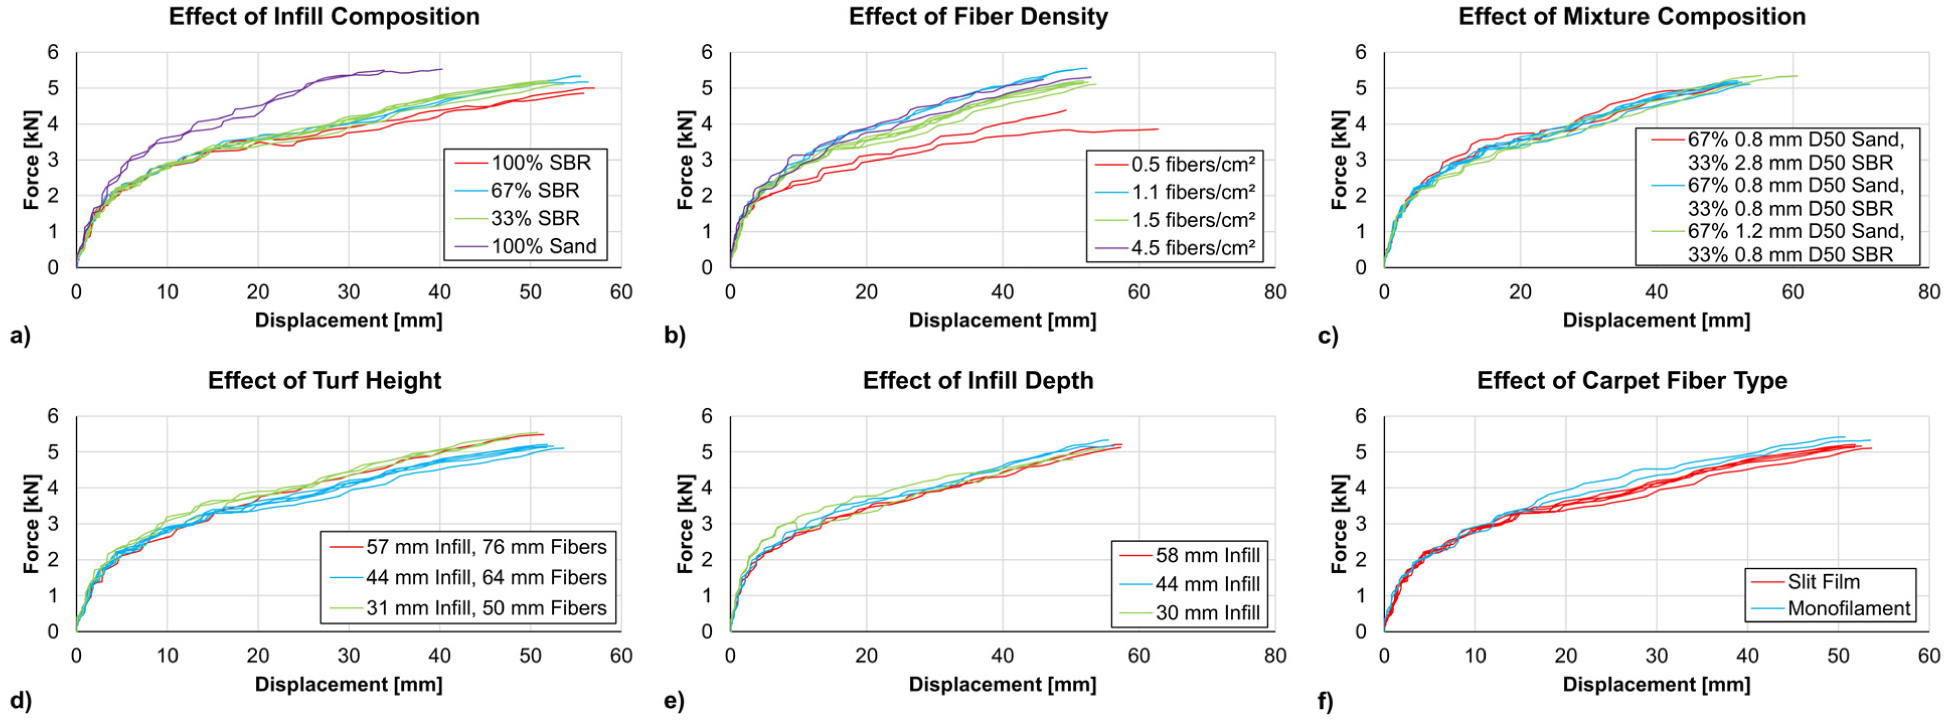
Force-displacement response from BEAST translation tests comparing: (a) the effect of infill composition, (b) fiber density, (c) mixture composition, (d) turf height, (e) infill depth and (f) fiber type.
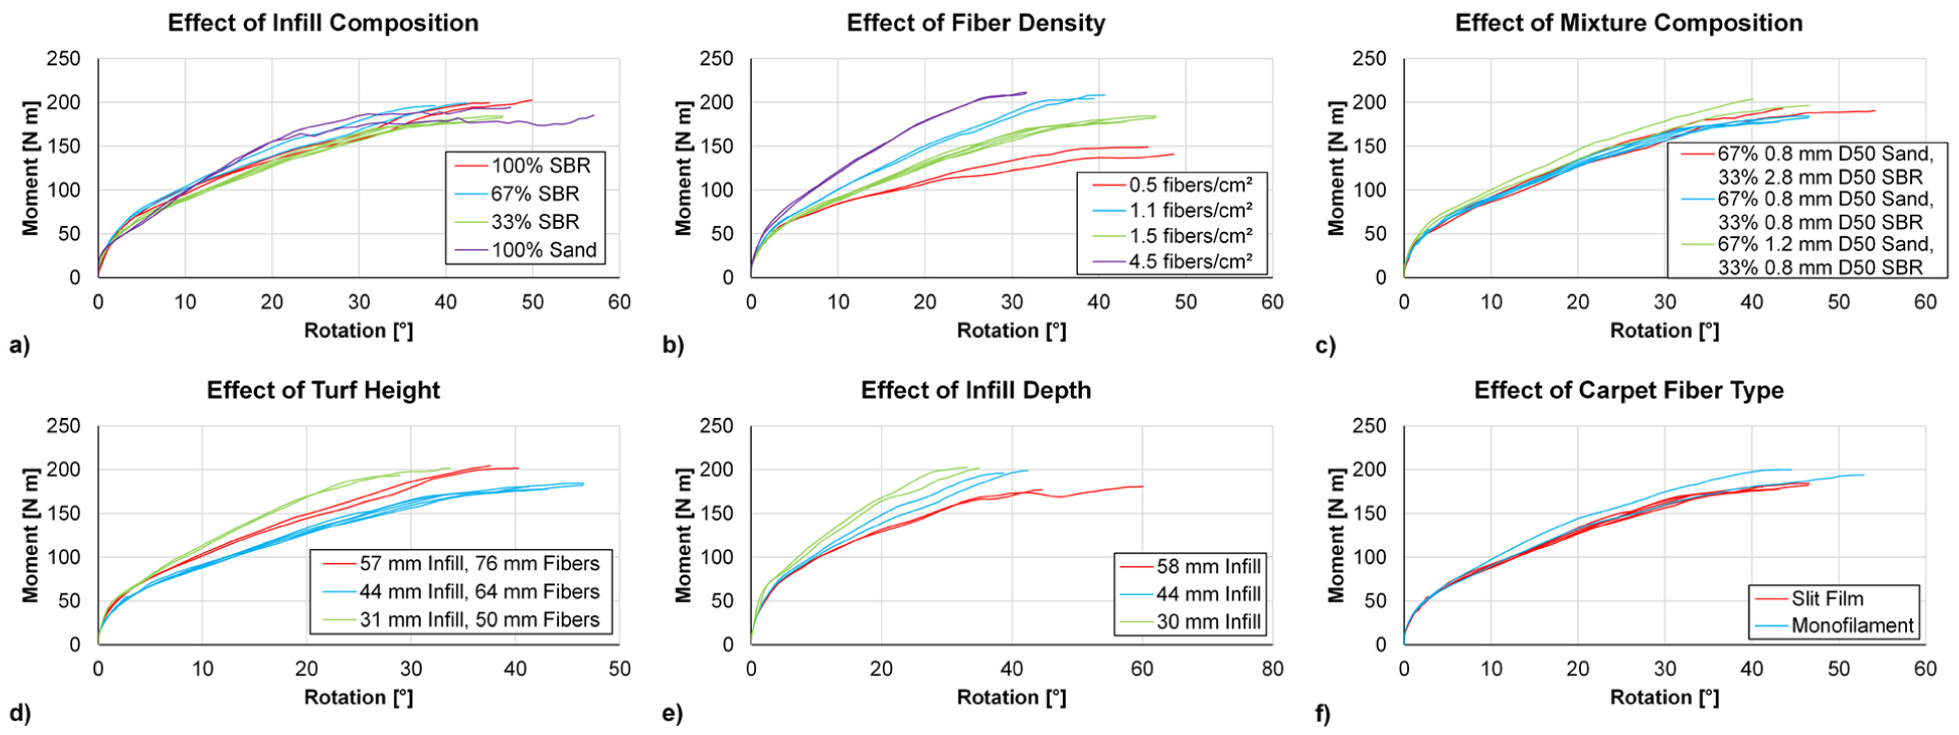
Moment-rotation response from BEAST rotation tests comparing the effect of: (a) infill composition, (b) fiber density, (c) mixture composition, (d) turf height, (e) infill depth, and (f) fiber type.
To quantify the BEAST test response, each test was fit to a bilinear response using the slope and peak force/moment value for each of the two component line segments (initial slope and yield force/moment for the first segment and tangent slope and peak force/moment for the second segment), and average values were calculated for each turf configuration. The all-sand infill exhibited higher forces than the other turfs (17% yield force and 20% peak force), and the very sparse carpet (0.5 fibers/cm2) exhibited substantially lower force values than the average of all configurations (25% yield force and 7% peak force). Otherwise, all the turfs exhibited peak and yield forces within 8% of the average forces for all configurations. Under translation loading, no apparent trends were observed for either the peak or yield forces (Figure 6(a)).
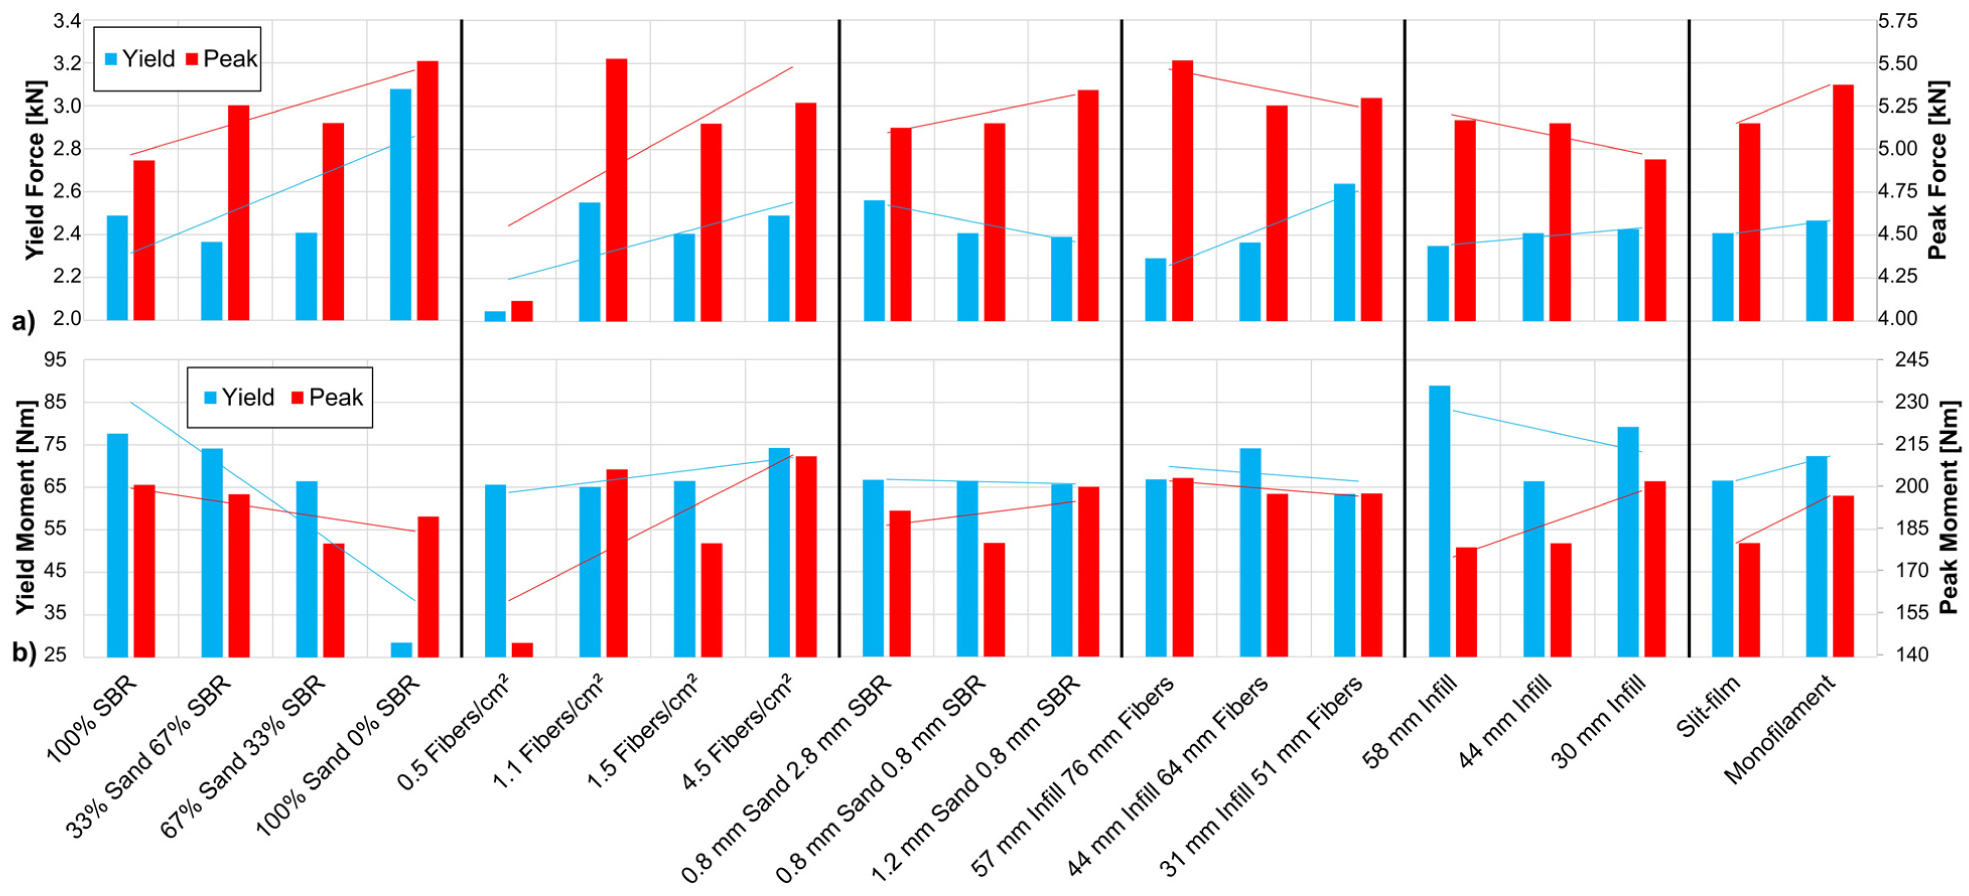
Average (a) yield and (b) peak forces for translation tests and average yield and peak moments for rotation tests with trend lines for each comparison, note that vertical scales do not start at zero.
Under rotational loading, larger differences were apparent than under translation loading. For the 100% SBR infill, the yield moment was 15% above the average of all configurations, while for the 100% sand infill, the yield moment was 58% below the average, highlighting a substantial difference at the point at which the secondary slope of the response began. This difference was somewhat masked in the moment-rotation response (Figure 5(a)) compared to the translation force-displacement response (Figure 4(a)). The moment-rotation response showed a consistent progression of response except in the two highly specialized configurations (all sand infill and very sparse carpet). Examples of this progression can be seen in the response to changes in fiber density (Figure 5(b)), turf height (Figure 5(d)) and infill depth (Figure 5(e)). For example, the 4.5 fibers/cm2 result exhibited higher initial and tangent slopes than the 0.5 fibers/cm2 configuration, with the two intermediate configurations (1.1 and 1.5 fibers/cm2) falling between the two extremes. The comparison of the 1.1 and 1.5 fibers/cm2 configurations was somewhat difficult due to the layer baseline case using a three-layered infill, with 5 mm of sand at the base, 34 mm of mixture making up the majority of the infill and 5 mm of SBR on top, while the three remaining configurations used a single 44-mm layer of mixture. For the same reason, the intermediate configuration of turf height comparison was outside the two boundary configurations (Figure 5(d)), which otherwise would suggest that a shorter turf should lead to a higher moment for a given rotation than a taller turf. The comparison of infill height (Figure 5(e)) showed a similar trend to the comparison of turf height (Figure 5(d)), suggesting that the effect of height was primarily related to infill, rather than the fiber length. Unlike the comparison of turf height, the comparison of infill depth used a 33 wt% mixture of sand, so the intermediate configuration (blue lines in Figure 5(d), green lines in Figure 5(a)) did fall between two extremes.
Finite element modeling results and discussion
Translation model to assess force-displacement response
Under translation loading, the layered baseline model (orange dashed line throughout Figure 7) predicted lower yield and peak forces compared to the single layer baseline model (33% SBR in Figure 7(a), 1.5 fibers/cm2 in Figure 7(b), 67% 0.8-mm D50 sand, 33% 0.8-mm D50 SBR in Figure 7(c), and 44-mm infill, 64-mm fibers in Figure 7(d)). This difference may help explain some of the experimental results in which the force-displacement response of the layered baseline configuration fell below the responses of turf configurations, which, ostensibly, bounded the baseline case (most apparent in the comparison of turf height, Figure 4(d)). Importantly, the model demonstrated the ability to predict this lower force compared to a single-layer system. The model was able to provide insight into the bilinear force-displacement response exhibited in the BEAST experiments. Upon initial loading, the cleat primarily loaded the infill and the fibers were not found to contribute substantially to the shear response. The initial portion of the force-displacement response corresponded to the initial linear portion of the infill stress strain response, prior to yield. Upon further loading, a substantial amount of the infill material under the cleat reached the yield point, enabling greater relative motion of the infill. Although the infill material response was defined as perfectly plastic (i.e., no hardening) under shear loading at a given pressure, the measured cleat force response was observed to increase during the second portion in the bilinear force-displacement response. The increase in force of the cleat force-displacement response was attributed to the complex interaction between fibers and infill. Specifically, yielding and flow of the infill allowed the fibers to orient in the direction of cleat motion, leading to tensioning of the fibers. This fiber tension allowed the fibers to confine the infill, leading to higher pressures and higher yield strength within the infill, as observed in experimental tests. 17
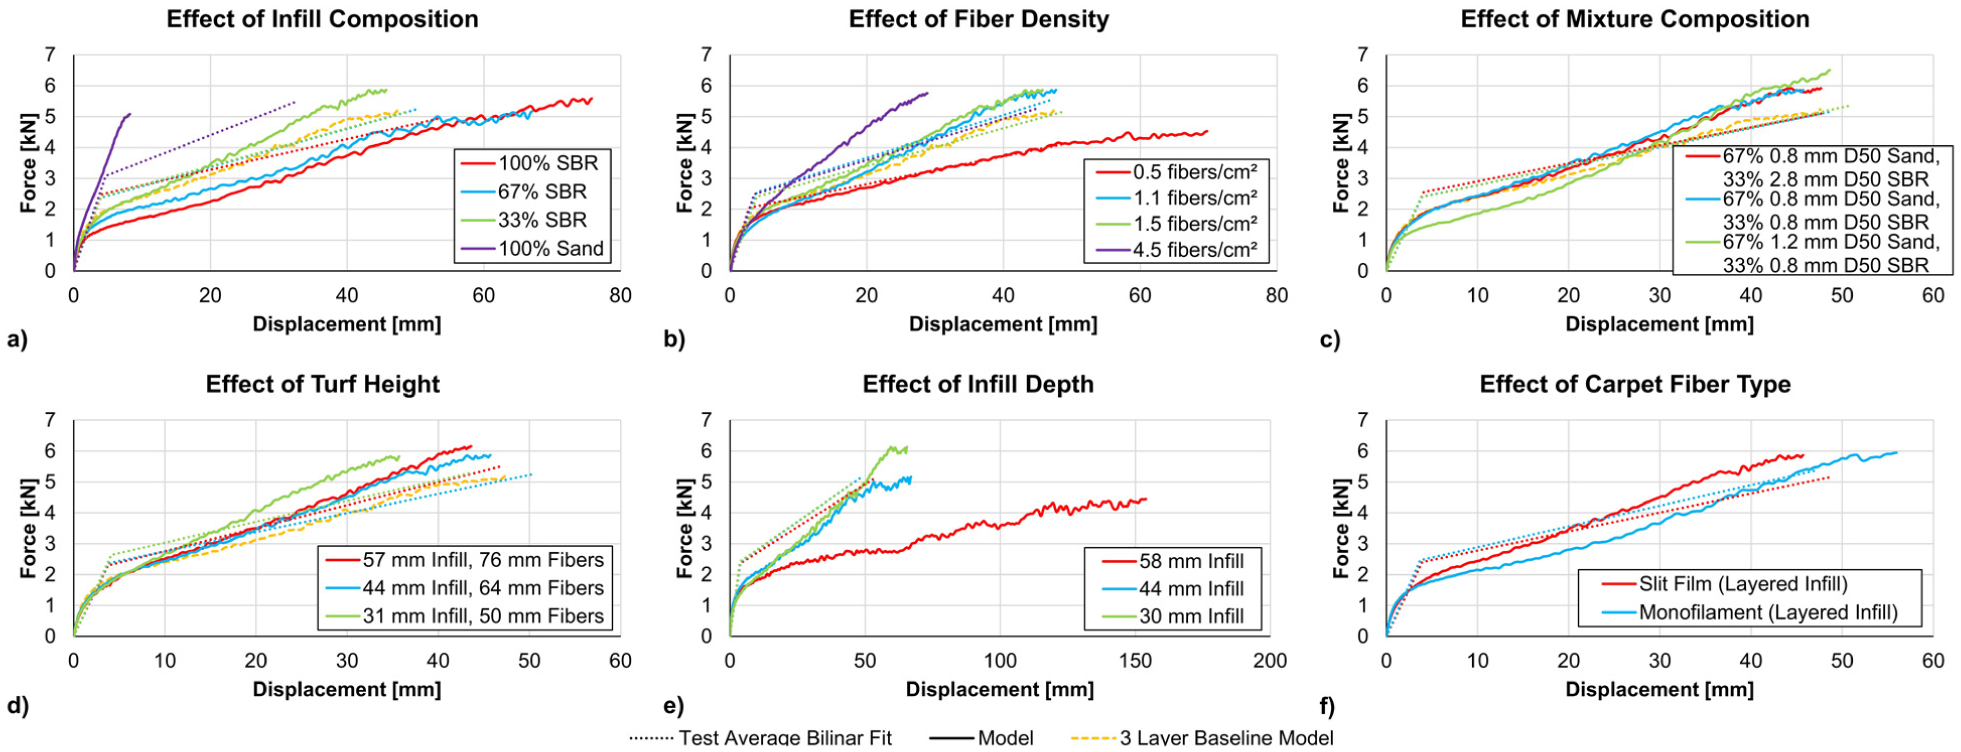
Average bilinear test fit (dotted lines) and model (solid lines) force-displacement response for models comparing the effect of: (a) infill composition, (b) fiber density, (c) mixture composition, (d) turf height, (e) infill depth, and (f) fiber type.
The effect of infill composition on the translation model response (solid lines in Figure 7(a)) clearly showed a progression of increasing yield force with increasing sand content, while the peak force was roughly the same across all infill compositions. The 100 % sand response was nominally linear through the entirety of the force displacement response, while the turf configurations with some SBR content exhibit the bilinear response seen in the physical tests. The effect of the carpet areal density was readily apparent with increasing fiber density, leading to an increase in the predicted yield force and peak force (Figure 7(b)). The 1.1 fibers/cm2 and 1.5 fibers/cm2 models predicted equivalent results.
The effect of mixture composition was somewhat challenging to interpret with the model (Figure 7(c)). The yield force of the 0.8-mm Sand/2.8-mm SBR and 0.8-mm Sand/0.8-mm SBR configurations were both higher than the model of the 1.2-mm Sand/0.8-mm SBR configuration, though all three configurations exhibited a similar peak force. Like the experimental comparison of turf height, the configuration representing the layered baseline configuration (44-mm infill, 64-mm fibers) exhibited a lower peak force than either the shorter (31-mm infill, 51-mm fibers) or longer (57-mm infill, 76-mm fibers) fiber configuration (Figure 7(d)). When the effect of layering was removed, the two taller-turf configurations (57-mm infill, 76-mm fibers, and 58-mm infill were similar to the short-turf configuration in predicting a stiffer response, suggesting that there is a limit in turf height after which the response is unlikely to change.
The 58-mm infill depth and 44-mm infill depth models predicted similar responses, but diverged near the peak force, with the 30-mm infill model increasing more than the 44-mm model after 45 mm of displacement (Figure 7(e)). The 58-mm infill model had a slightly different characteristic force response than was predicted by the other turf configurations, leading to an extended 150-mm rise, unlike the pronounced peak force exhibited between 30 and 80 mm for the other configurations and a lower peak force (4.5 kN).
Finally, the model of the monofilament carpet turf exhibited a lower yield force than the baseline slit-film model with an extended force-displacement response, leading to a slightly higher peak force prediction of 5.9 kN compared to 5.2 kN for the baseline configuration (Figure 7(f)). Compared to the monofilament and slit film experimental test results, which exhibited relatively small differences (Figure 5(d)), the difference in model responses was more pronounced. The difference may be attributed, in part, to the contact algorithm used in the model, which is only activated when an infill node is normal to a fiber. The smaller width of the monofilament fibers compared to the slit-film fibers may allow more motion of the infill relative to the fibers, meaning that less pressure is generated under the cleat during motion. This lower pressure then leads to the lower force prediction at a given displacement for the monofilament model compared to the slit-film model. Nevertheless, the monofilament model represented the test response well (CORA rating of 0.79). Further investigation is needed to better understand the differences between the two fiber types.
Rotation model to assess moment-rotation response
Much like the translation model for the 100% sand configuration, the rotation model (Figure 8(a)) predicted a mostly linear moment-rotation response, while the three configurations with SBR included in the mixture (33% SRB, 67% SBR, and 100% SBR) were bilinear. The rotation model for the different fiber density models (Figure 8(b)) predicted an increase in stiffness as the fiber areal density increased.
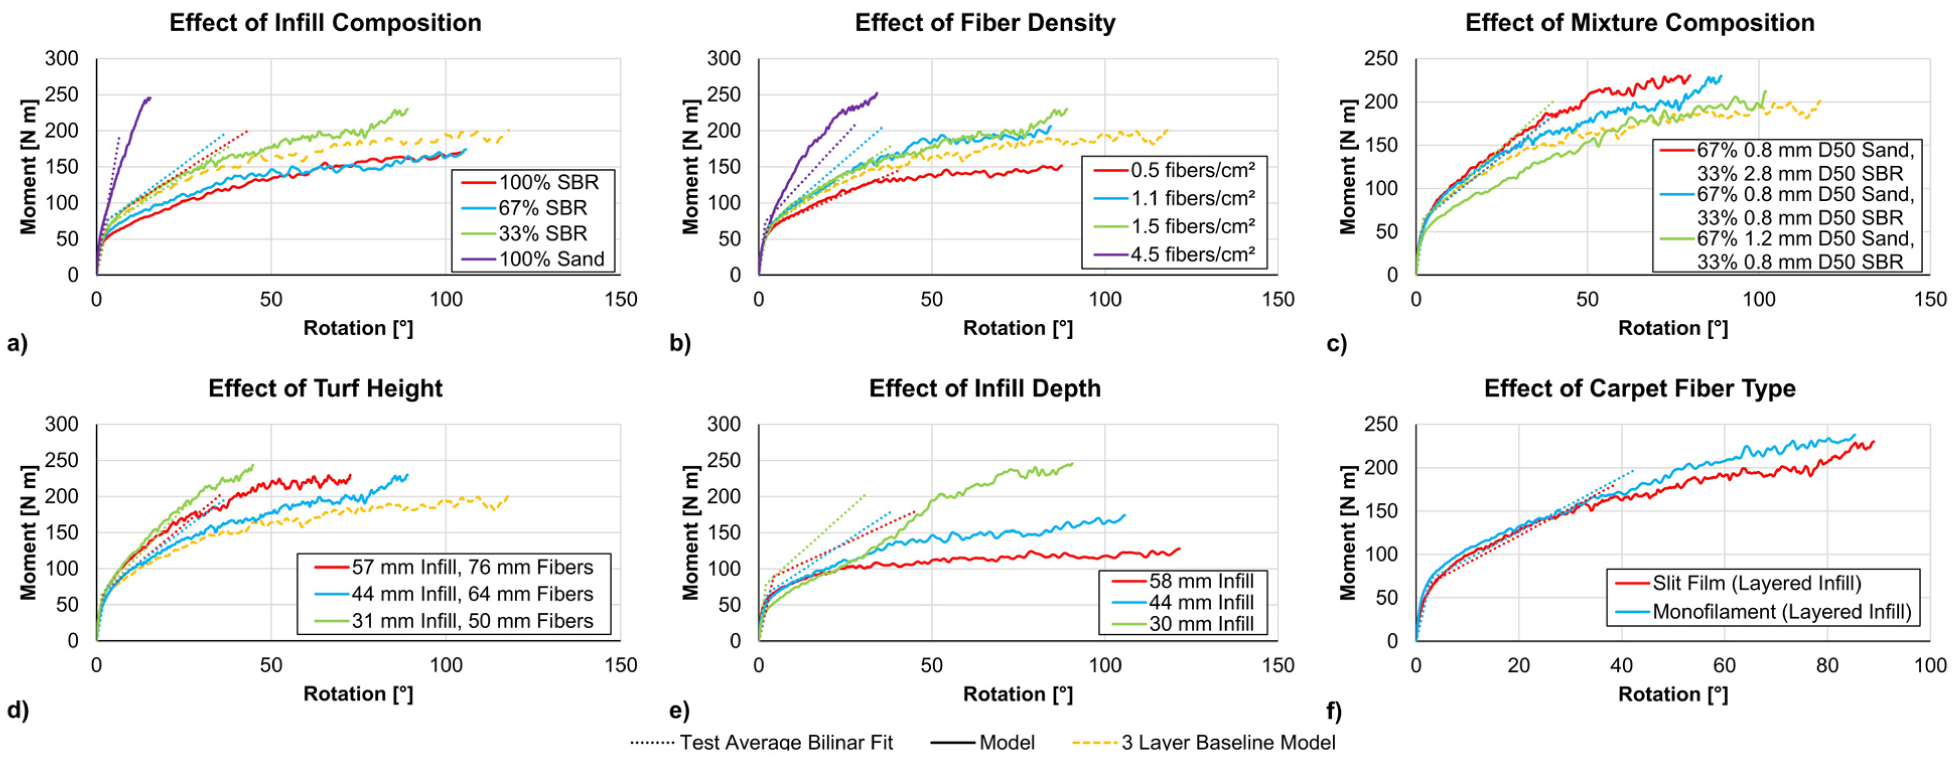
Average bilinear test fit (dotted lines) and model (solid lines) moment-rotation response for models comparing the effect of: (a) infill composition, (b) fiber density, (c) mixture composition, (d) turf height, (e) infill depth, and (f) fiber type.
The effect of mixture composition showed a stronger separation between the 0.8-mm sand/2.8-mm SBR model than the other two configurations (Figure 8(c)). The effect of turf height under rotation demonstrated somewhat unintuitive behavior, with the medium height turf (blue line in Figure 8(d)) exhibiting lower moment rotation-response than the short and tall models (green and red lines in Figure 8(d), respectively). Interestingly, the test response demonstrated the behavior predicted by the model, although this correlation between the test and the model may be related to the three-layer system used in the test, the model of which (dashed orange line in Figure 8(d)) exhibited a softer response than the single 44-mm mixture infill.
In contrast, the models used to assess the effect of infill depth exhibited a progression of lower to higher peak force as the infill depth decreased (Figure 8(e)). The monofilament model predicted a slightly higher yield and peak force compared to the slit-film model (Figure 8(f)).
Importantly, the rotations for all models were generally higher than the corresponding test response, which may have been due to the perfectly plastic nature of the material model used to model the infill. In short, unlike the translation case where the cleat was moving into unyielded material, all the material under the cleat during rotational loading was in the loaded (and potentially yielded) state, meaning that a constant force was applied to the cleat regardless of the strain state of the material. Further investigation is needed to investigate this aspect of the model response, in detail.
The models typically showed more differentiation than the experimental results, possibly due to the mechanical compliance in the test apparatus being eliminated in the model. Nevertheless, the models typically predicted the same rank order in terms of force as the test data, including cases where the layered baseline model fell outside the ‘upper’ and ‘lower’ boundaries of the parametric study (e.g., comparing the effect of fiber density under rotational loading). When a single layer was modeled, the results were generally as expected, with the single-layer baseline turf falling between the two extreme values.
Objective FE model rating using CORA
The force-displacement and rotation-moment time histories of the models were compared to the test data by carrying out a CORA analysis with the standard weighting parameters for corridor rating (50%), progression (25%), size (12.5%), and phase shifting (12.5%). 21 Considering all models, the average rating was 0.75 (Table 2) with a standard deviation of 0.084. A rating exceeding 0.7 is considered ‘good’ when assessing multiple signals. 22 The translation model ratings ranged from 0.93 to 0.58 with an average of 0.83 (0.089 standard deviation), while the rotation model ratings ranged from 0.90 to 0.53 with an average of 0.68 (0.101 standard deviation). The highest rating (0.93) was for Configuration 4 (33% sand–67% SBR mixture infill under translation loading) while the lowest rating (0.53) was for Configuration 14 (30 mm infill depth under rotational loading). The translational model ratings were all above 0.7, with the exception of Configuration 5 (100% sand infill). The rotation model ratings were generally lower than the translation model ratings for each turf configuration, attributed in part to the material model used for the infill, which incorporated yielding of the infill material 17 followed by perfectly plastic (no increase in stress with increasing strain) response. Under translational loading, the model cleat was moving into unyielded material as the test progressed, while under rotational loading, the cleat was traveling into yielded material as it rotated around a fixed axis. It is hypothesized that including hardening within the material model (increasing post-yield stress with increasing strain), which was observed in experimental tests on infill, 17 may improve the predictive capability of the model. However, such a response is not currently available in existing material models compatible with SPH in the specific FE solver used in this study.
Summary of model CORA ratings.
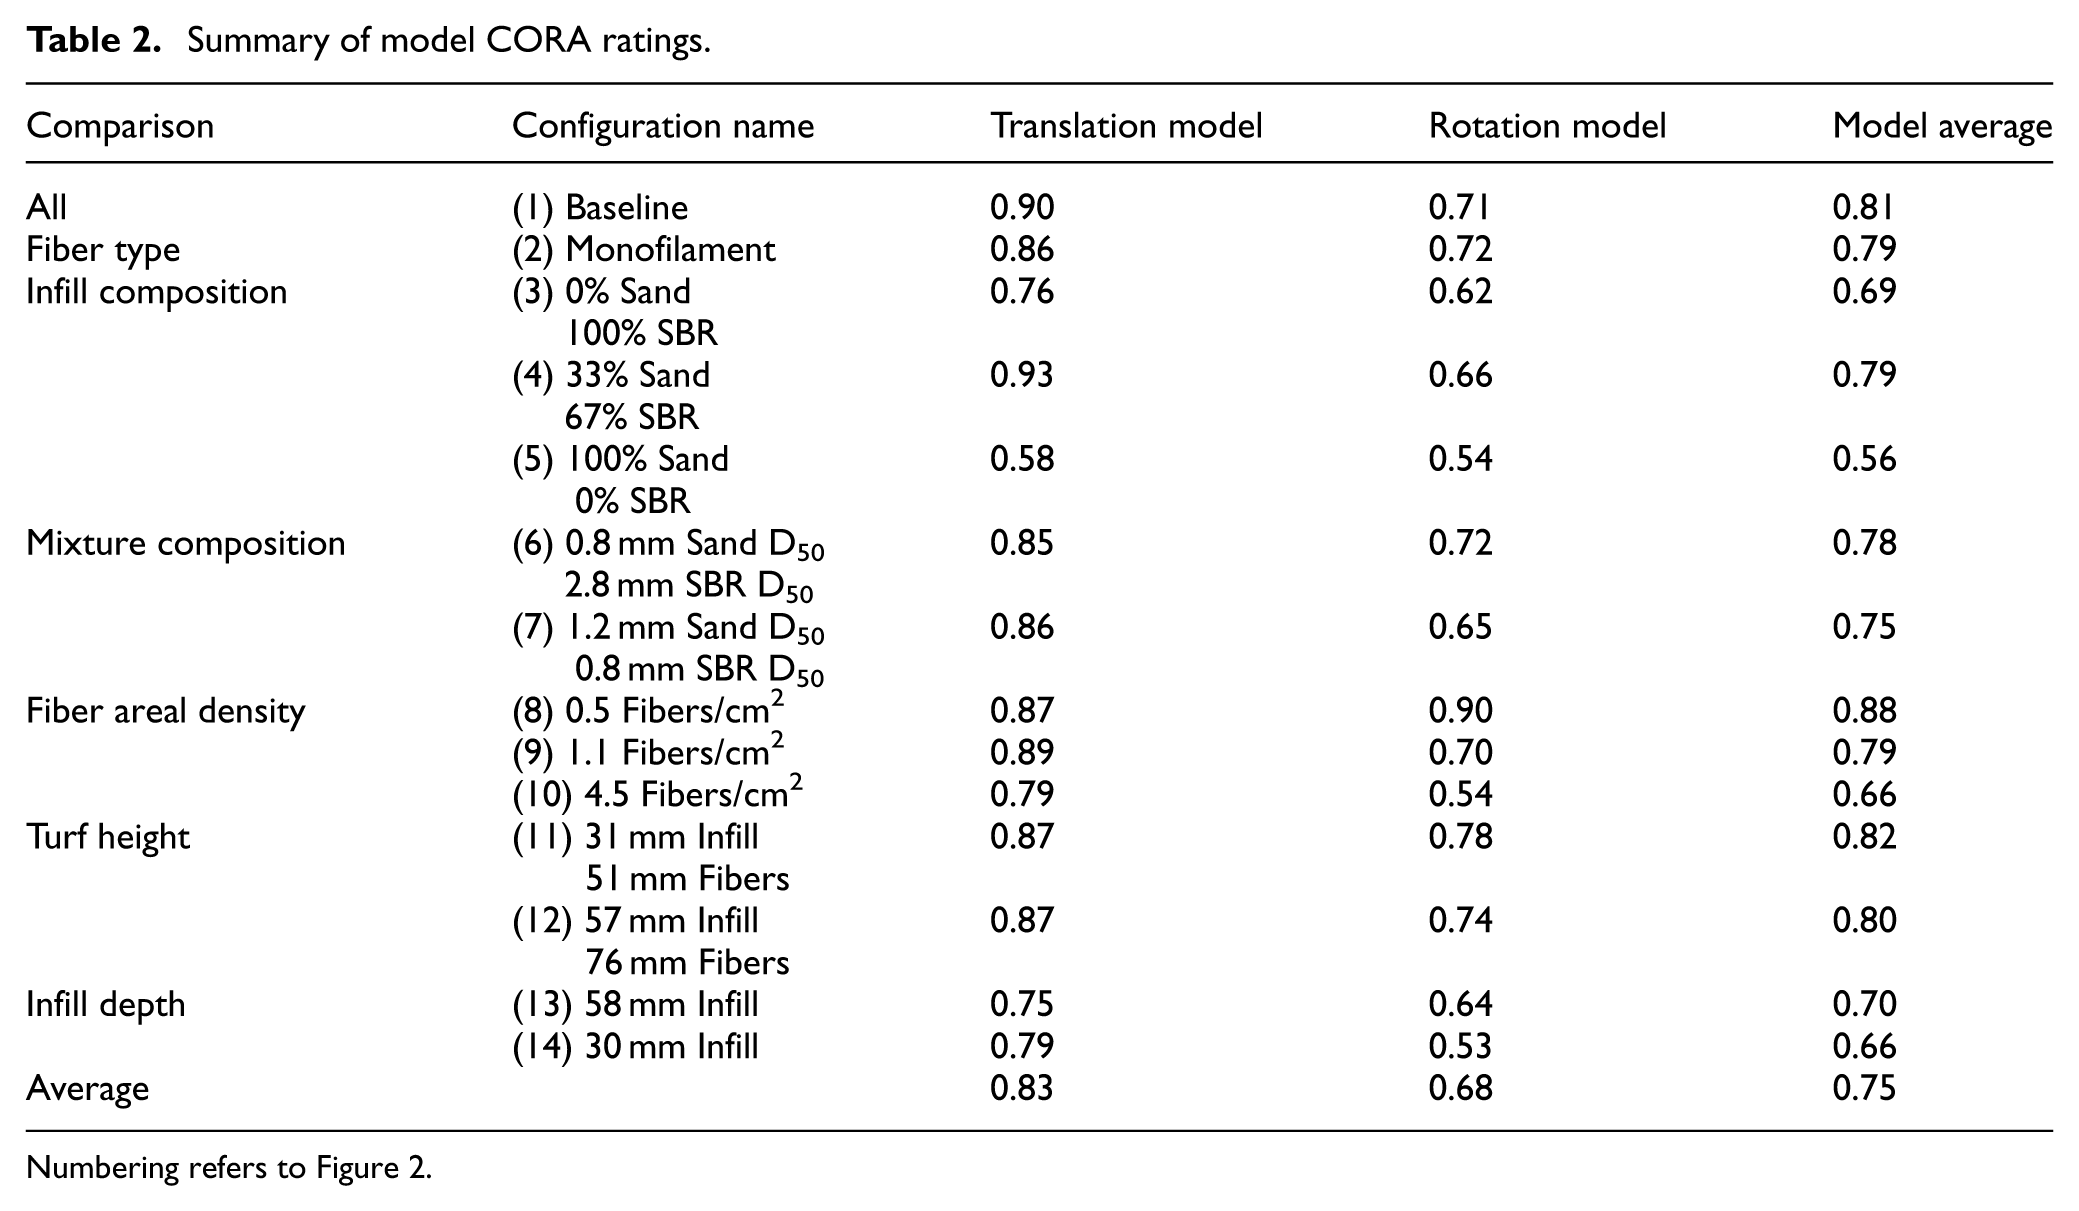
Numbering refers to Figure 2.
In general, the model was least effective (CORA rating <0.6) at predicting the test results for ‘high hardness’ conditions (100% sand infill translation and rotation, very high areal fiber density rotation, and very shallow infill depth rotation). Of note, the 100% sand case was outside the bounds of a playable surface (aPeak,Clegg > 100 g). 19 The turf model presented in the current study performed well at predicting the response of changes to turf parameters within the range of those used in contemporary turf builds. Future studies will apply the model to expand the design space of what is typically in current use and investigate improvements in the structural response of synthetic turf to support player safety while improving performance.
In future studies, a single layer of infill should be used for all experimental configurations to simplify the comparison of these effects, and to remove any variation in the surfaces that may result from inconsistent layering of the infills during construction. Additionally, the current set of tests and simulations were carried out at relatively high levels of loading. These high loads may have masked subtle differences that may be observed at lower loading levels and, as such, future studies should also investigate low-level loading.
Conclusions
The current study was able to quantify, in a systematic experimental manner, the effects of various infill and carpet parameters commonly used to design artificial turf systems used for American football using 14 turf builds with a wide range of carpet parameters (fiber height, fiber type, areal fiber density) and infill configurations (infill composition, mixture composition, infill depth), and model these same conditions. The experimental force-displacement responses from the BEAST loading carried out on the 14 turf configurations were generally insensitive to the changes to infill and carpets in this study with respect to the metrics measured (peak force, peak moment, yield force and yield moment), aside from configurations using 100% sand infill, which, for example, exhibited a 25% higher yield force than the average under translation load and 0.5 fibers/cm2 carpet, which exhibited a 20% reduced peak force compared to the average of the other configurations. Under rotational loading, infill composition, mixture composition, and fiber type showed little effect on moment-rotation response, while fiber density, turf height, and infill depth showed separation in response after the yield moment with tangent slopes ranging from 39% below to 51% above the average of all conditions. Otherwise, the metrics used to evaluate the turf were within 10% of the test average. The computational model predicted the rank order of the experiments and demonstrated the effect of using a three-layer sand/mixture/SBR system, which tended to reduce the yield force/moment and stiffness compared to the single layer system. When a model of a single-layer system was substituted for the three-layer system, the trends observed typically followed an expected progression. The present study demonstrates that the wide range of parameters evaluated experimentally were well captured by the modeling approach outlined and suggests that the modeling approach could be used for designs of future playing surfaces.
Footnotes
Disclaimer
The views expressed are solely those of the authors and do not represent those of the NFL, the NFLPA, or any of their affiliates.
Funding
The authors disclosed receipt of the following financial support for the research, authorship, and/or publication of this article: The authors would like to express thanks to Compute Canada for their support of this research. Additionally, the research presented in this paper was financially supported in part by the National Football League (NFL) and the National Football League Players Association (NFLPA).
Declaration of conflicting interests
The authors declared no potential conflicts of interest with respect to the research, authorship, and/or publication of this article.