
Abstract
Quantifying the response of infill used to construct contemporary artificial turf is critical to the development of computational models and providing insights to reduce sports injury associated with artificial turf. In the current study, confined compression and direct shear tests were performed on typical infill materials (sand, SBR and two mixtures (33%: 67%) by-weight). The experimental tests exhibited a progression from high strength and stiffness (sand) to low strength and stiffness (SBR) with the mixtures having intermediate values. Increasing particle size, particularly sand, tended to increase the resistance of the infill to deformation. The experimental results were implemented into a soil constitutive material model and the experimental tests were simulated using a smoothed particle hydrodynamics (SPH) method to verify the implementation in a commercial explicit finite element solver. The SPH method successfully captured the initial loading up to yield, material flow and post-yield behavior, enabling large-scale particle flow that will be necessary to simulate artificial turf. The simulation results predicted the test force-displacement response well for SBR and mixture infills. The proposed methodology demonstrated the ability to measure properties of contemporary artificial turf infills in both compression and shear for pure sand, pure SBR and mixtures of the two, and use these properties to accurately represent the infill in a computational environment. The resulting model can be extended to large-scale turf models, to investigate athlete performance and injury risk when interacting with artificial turf.
Keywords
Introduction
The use of artificial turf for athletic playing fields has seen continued growth in recent years owing to their high durability, ease of maintenance, and ability to withstand high usage levels from sporting and non-sporting events.1,2 Several epidemiological studies have shown that, relative to natural grass, artificial turf may contribute to more knee and ankle sprains 3 and lower extremity injuries for American football players. 4 Furthermore, testing using an artificial lower leg surrogate, the Biocore Elite Athlete Shoe-Surface Tester (BEAST, Biocore, Charlottesville, VA, USA), measured a higher maximum shear force and moment, delaying cleat release from artificial turf compared to natural grass.5,6 Experimental testing using the lower leg surrogate showed that artificial turf tended to exhibit higher measured force when loaded, while natural grass allowed gross motion to occur under less severe loads, suggesting a possible reason for the potential higher incidence of injury in artificial turf.
While substantial effort has been undertaken to characterize modern artificial turf from a top-down approach by testing at the full turf construction level,7–9 relatively little has been done using a bottom-up approach to characterize the constituent components of a turf and understand their interaction 10 for finite element model building. Understanding the mechanical behavior of the artificial turf constituent components is of particular importance to build finite element models of turf, which could enable designers to tailor turf construction and efficiently optimize the balance between player performance and safety.
Modern artificial turf generally comprises of a carpet of polymeric fibers stitched to a backing layer with granular infill stabilizing the fibers, 10 occasionally installed over an elastic or shock attenuating underlayment. One of the most important aspects in the mechanics of modern artificial turf is the compression and shear behavior of the granular infill, generally consisting of layers of sand, styrene-butadiene rubber (SBR) crumb, 1 or a mixture of the two. 11 Previous studies have investigated the compaction and strength characteristics of sand-rubber mixtures, with a focus on geostructural applications such as construction of large-scale embankments. 12 These geostructural applications generally use larger rubber particulates and lower rubber to sand ratios than are typically used in modern athletic turf. 13 Well-known confined compression and direct shear experimental methods that measure compressive and shear strength, respectively, are the basis of soil material characterization and have been used to characterize sand-rubber mixtures.14-16 Common soil numerical models build upon basic compression and shear measurements and can include more advanced features such as post failure response and strain rate effects. 17 Commonalities found in soil numerical models include a non-linear pressure-volumetric strain relationship (by way of increasing bulk modulus) and a pressure dependent yield strength criterion. Existing numerical modeling studies of sand-rubber mixtures range in scale from low volume discrete particle interaction and arrangement 18 to a large single finite element volume representing the bulk material. 19 In more traditional quasi-static soils modeling of civil engineering structures, implicit modeling methods have been used. 20 However, given the relatively short stance period when an athlete is running (on the order of 200 ms), 21 explicit finite element modeling methods may be more appropriate, given the transient nature related to foot-turf dynamics. While studies have been carried out using optimization to fit constitutive model parameters to test data, 22 a more optimal solution would be to generate all model parameters directly from material-level tests.
In recent years, the smoothed-particle hydrodynamic (SPH) method has been adopted to represent granular materials like soils, sands, and rocks. 23 The SPH method is a meshless finite element method, where discretized particles in space represent a domain. Each particle carries coordinates, material properties (e.g., mass), field variables (e.g., strain) and a smoothing function that controls interaction with neighboring particles. 24 The advantage of the SPH method over mesh-based methods is the ability to accurately simulate large shear deformations, complex-shaped free surfaces, and elastic-plastic flows of granular materials. 25 Within commercial finite element codes, a pressure-dependent yield surface material model can be used with SPH to capture the yield behavior of the infill.
In this study, 100% sand, 67% sand:33% SBR (by weight), 33% sand:67% SBR (by weight) and 100% SBR combinations were tested in confined compression and direct shear loading. Using this data, a methodology of fitting a constitutive model was developed and integrated with a SPH modeling approach for the infill. Verification models of each test and infill configuration were then simulated to assess the fidelity of the modeling approach in representing the test data.
Methodology
Experimental methodology
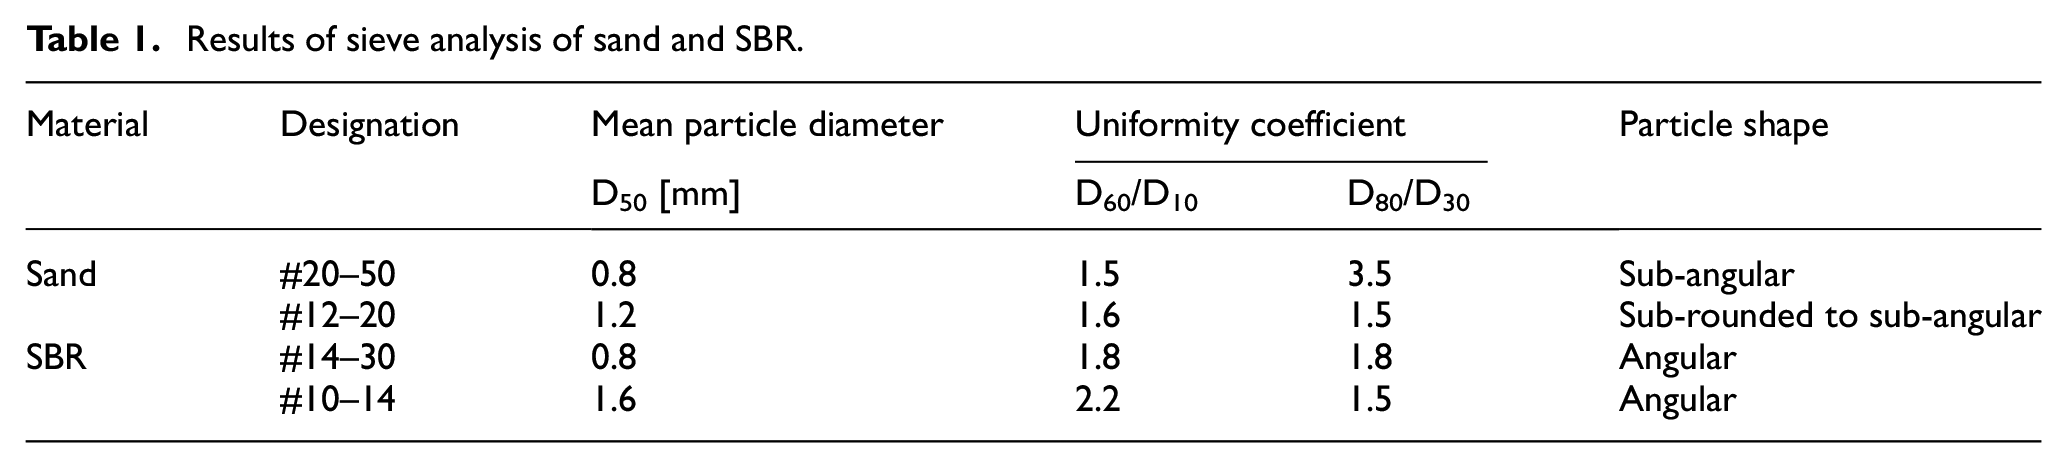
To assess the effect of the infill composition on the mechanical response under confined compression and direct shear testing, combinations of #20–#50 (0.8 mm mean particle diameter calculated using the method described by Pfost and Headley 26 ) sand, #12–#20 (1.2 mm) sand, #10–#14 (1.6 mm) ground cryogenic SBR and #14–#30 (0.8 mm) ground cryogenic SBR were tested (Table 1). The particle size was graded using the ASTM-F1632 standard (Figure 1). 27
Results of sieve analysis of sand and SBR.
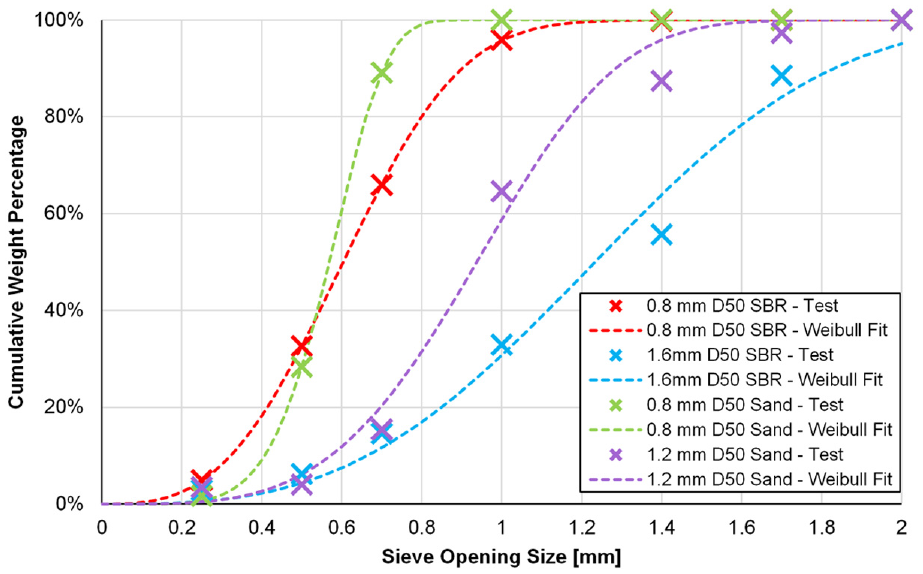
Cumulative weight distribution of sand and SBR particles by sieve opening size and Weibull distribution fit to the measured data.
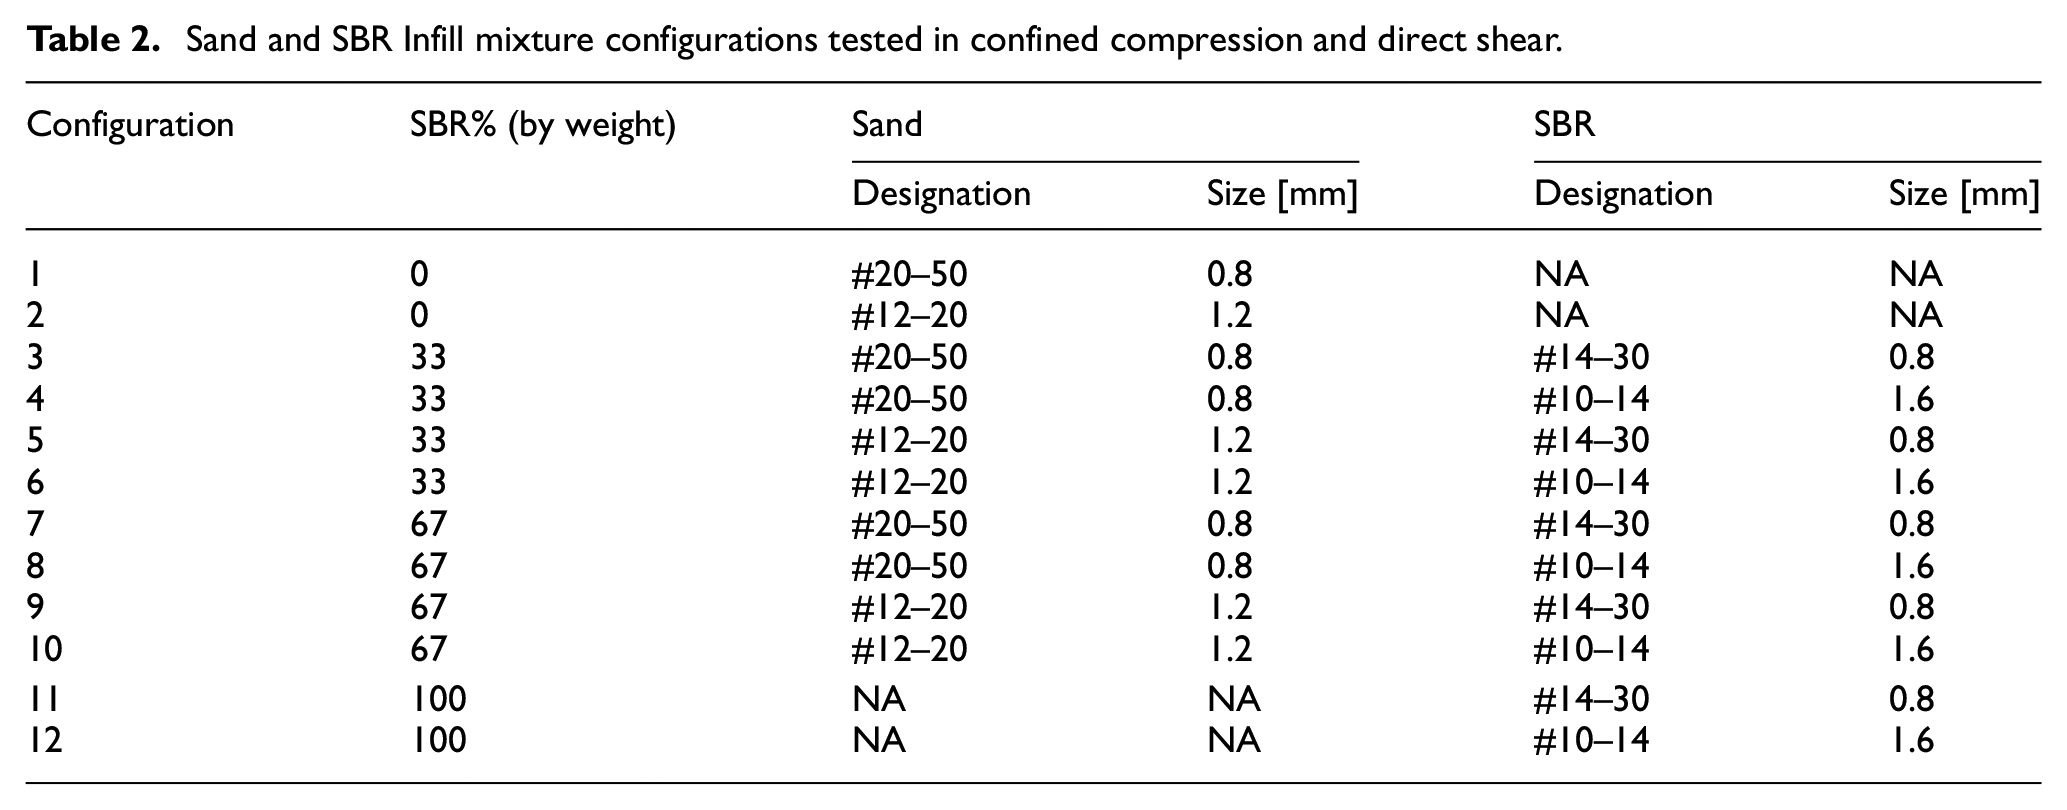
0% SBR (i.e., all sand), 33% SBR, 67% SBR and 100% SBR infill compositions, by weight, were tested to provide a full range of potential combinations of the two infill constituents (full test matrix in Table 2). The mixtures were created by first measuring the required portion by mass of each infill to create 1 kg of infill. The two constituents were then poured into a 4 L plastic container, which was sealed and manually agitated while being rotated, for one minute to ensure that the infill was well mixed. Prior to each test, the container was further agitated to ensure that the mixture was uniform and that the sand had not settled to the bottom of the container. While many turf systems are defined by distinctive layers of sand or SBR, the mixtures used in this study were investigated to assess the range of possible responses of the infill.
Sand and SBR Infill mixture configurations tested in confined compression and direct shear.
Due to the pressure dependent yield surface linking the compression and shear responses of infill, the first step in the current study was to assess the compression response of the infills. Confined compression testing was carried out using a custom-built servo-hydraulic load frame powered by a 101.6 mm (4") bore × 152.4 mm (6") stroke hydraulic cylinder (Parker Cylinder Division, Owen Sound, Ontario, Canada) with a cylinder-mounted linear variable differential transformer (LVDT) to measure displacement and a 90 kN loadcell to measure force (Transducer Techniques SWP 20k, Temecula, California, USA). The frame was controlled by an MTS 407 hydraulic controller (MTS, Eden Prairie, Minnesota, USA) and data was acquired using a National Instruments Daqpad-6015 data acquisition system and LabVIEW 7.1 software (National Instruments, Austin, TX, USA). An annular steel containment ring (38 mm × 53.5 mm ID × 60.5 mm OD), which was used to contain the infill, was placed on a platen in the load frame and infill was added to a nominal depth of 12.7 mm. The platen was then raised at 1 mm/s to compress the infill against a 53.3 mm diameter platen. The infill was compressed to a load of roughly 1500 N to precompress the infill, mimicking the construction procedure during the installation of a full-scale turf field. 28 After the precompression loading, four loading cycles were carried out on each volume of infill before being replaced by untested material. Three repeats of each set of cycles were conducted for each infill combination (12 total loading cycles per infill configuration). Because no visual method could be used to determine the start of loading, after smoothing the data with a running average equal to 10% of the number of points sampled (roughly 3000 points) by the data acquisition computer for a given test (1% for sand), a force threshold of 10 N was used to zero the displacement of each test. After zeroing the original (unfiltered) data, a running average filter with a window size equal to 1% of the total number of samples for a given test was then applied to the measured force and displacement to provide a final force-displacement response for each test.
The infill combinations were also tested in shear using a commercial direct shear testing machine (Karol Werner Model 2001-D, Powel, OH, USA) with pneumatic vertical loading to create a prescribed pressure level in the infill, and a 50 mm × 50 mm shear box. This test apparatus is intended to create a defined shear plane across the infill, in a manner that is analogous to the cleat translating through a turf specimen using the BEAST test apparatus, which itself is used to mimic the shear motion of a cleat on turf. The shear box was filled with infill to a nominal depth of 32 mm and leveled prior to adding the shear box cap. The bottom of the shear box was 12.5 mm below the shear plane (split-line of the box), and the box was filled with infill to a depth of 32 mm so that there was roughly 19.5 mm of infill above the shear plane. Importantly, the maximum compression for all tests (300 kPa preload on 100% SBR) was found to be roughly 10 mm, leaving 9.5 mm of infill above the shear plane, at a minimum.
To assess the range of preloads for the direct shear tests, the average peak ground force measured in a study of football related maneuvers by professional players 21 were converted into nominal stresses (Table 3). The area over which the force was assumed to act (13,000 mm2) was based on the area of a foot form used to assess the response of natural turf using the BEAST test apparatus. 6
Ground force and calculated nominal pressure and shear stress for a series of football maneuvers by professional players.
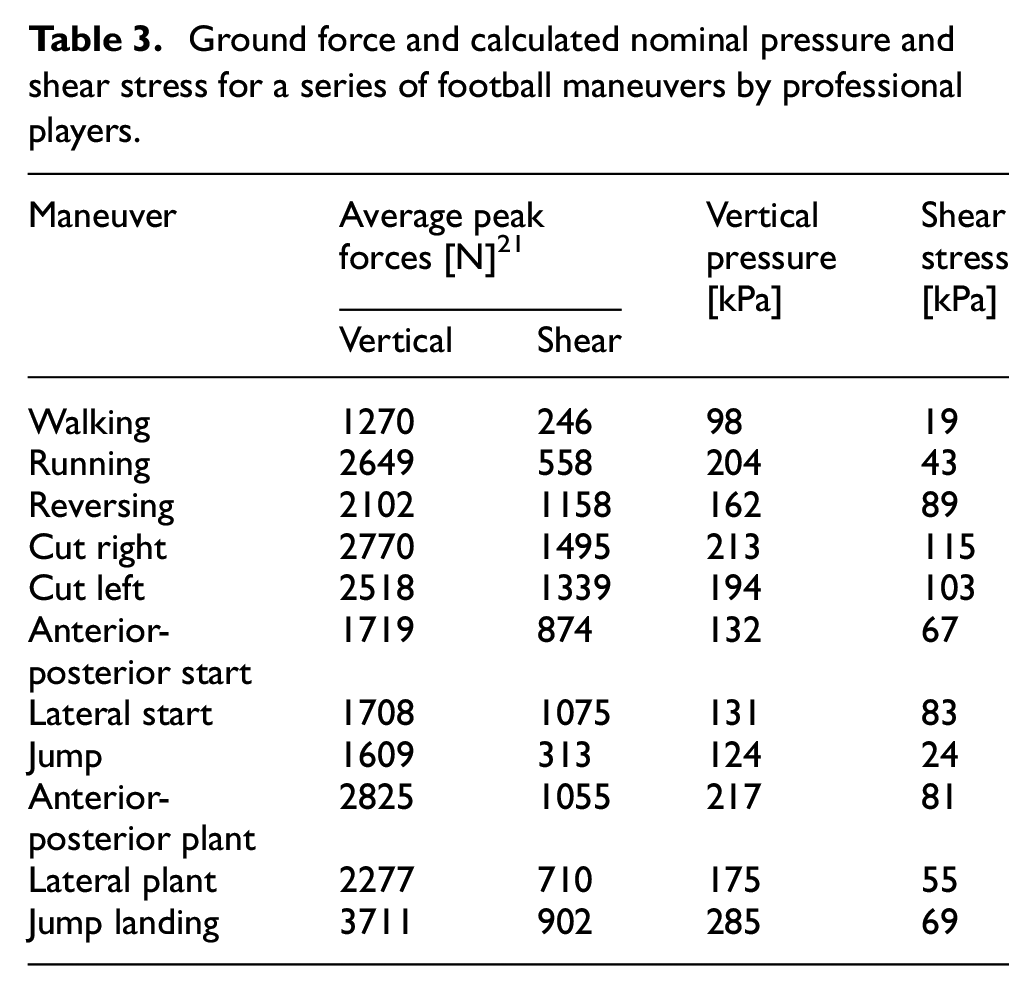
Peak preload pressures that were equivalent to the vertical forces exerted when walking (100 kPa, the lowest peak value measured), running (200 kPa) and landing from a jump (300 kPa, the highest peak value measured) were chosen as the preloads applied to each infill composition (five repeats per combination with the infill discarded after each test). Prior to each test the mass of the infill and depth were measured to provide a calculated bulk density necessary for modeling purposes. The lower portion of the shear box was then translated at 0.1 mm/s to generate the shear deformation through the sample. The force and lateral displacement were measured throughout the test. The tests were run up to 19.75 mm of horizontal displacement (the maximum displacement capable of the machine), however after the initial 6 mm of displacement, the geometry of the shear box was such that infill began to be exposed on the rear side of the shear box.
For each test condition, both the confined compression data and direct shear data at each level of loading was averaged using the ARCGen approach to curve averaging and the standard deviation corridors for each test condition were evaluated. 29 In short, the force and displacement responses were converted to force and displacement vs. arc length responses, which were in turn processed using a signal registration technique 30 to optimize the alignment of key features of the signals and produce a characteristic average force-displacement response for each set of curves for a given test condition. The standard deviation in both the force-arc length and displacement-arc length domains were also calculated for each position along the arc, giving corridors for ±1 standard deviation in addition to the mean response.
Numerical model methodology
Finite Element models of the confined compression and direct shear tests were developed to verify that the measured response was reproduced using the characterization and material property fitting methodology. Because the ultimate end-use case for the outcomes of this study will be to model the dynamic interaction between a foot and the turf, a commercial explicit finite element solver was used to simulate the tests (LS-DYNA SMP single precision R12.0.0, Ansys, Canonsburg, PA, USA).
The infill material properties were fit to a soil material constitutive model, which included the pressure-volume response of the material, and a pressure dependent, Drucker-Prager type yield surface with elastic behavior to yield (*MAT_SOIL_AND_FOAM in LS-DYNA). 31
The force-displacement response of the confined compression test for each infill configuration was converted into a pressure (pi)-volumetric strain (εvol,i) response using the following relationships for each increment of displacement (di) and measured force (fi), assuming that the area of the sample did not change due to the use of the steel confinement ring:
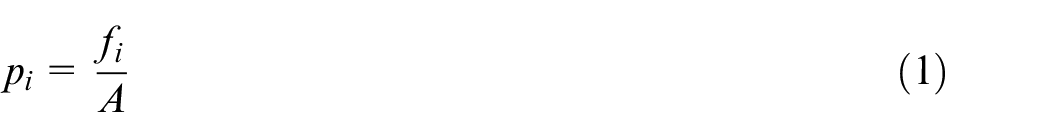
and
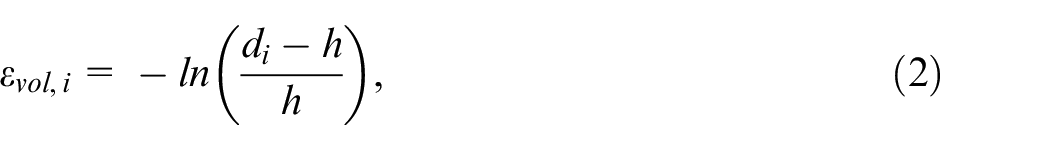
where A and h are the initial area and height of the specimen, respectively. The bulk modulus, required for time step calculation in the explicit finite element code, was defined using the average slope of the final five points of the pressure-volumetric strain curve.
The force-displacement response measured from the shear test was used to calculate the shear modulus for each infill configuration. The 100 kPa preload shear response was converted into an engineering shear stress-engineering shear strain response and the average slope was calculated from 0 mm to 1 mm of displacement (corresponding to a shear strain of 0.02).
The shear force at yield (vyield) was defined as the force at 12% nominal shear strain (6 mm of displacement) as suggested by Bareither et al. 32 who found this value provided high levels of intra-laboratory repeatability in a round-robin study to assess the variability of direct shear tests across several labs. Additionally, the top portion of the shear box used in the current study had a wall thickness of 6 mm, meaning 6 mm was the maximum displacement prior to infill being exposed on the back side of the shear box surface. The pressure dependent yield surface for the material model was of the form
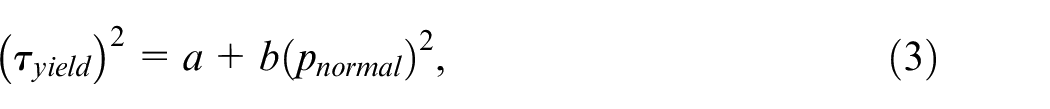
where pnormal was the applied normal pressure (100 kPa, 200 kPa or 500 kPa), τyield was the shear yield stress (vyield/A), a was a yield parameter related to the yield stress when no pressure was applied to the infill (cohesion) and b was a yield parameter related to the magnitude of the pressure dependence for a given infill configuration. Both yield parameters (a and b) were fit from the experimental data using a least squares fit for each infill configuration.
Numerical models (Figure 2) of the confined compression test, and the direct shear test were created using a commercial preprocessor (LS-PrePost V4.6.25, Ansys, Canonsburg, PA, USA). For each model, the infill SPH elements were defined using a pitch (the spacing between SPH elements) of 1.5 mm to balance computational efficiency with a reasonably small mass for each particle. Larger pitch sizes did not capture the confined compression response well due to a lack of elements through the 12.7 mm thickness of the infill. However, smaller pitch sizes provided a similar response to the 1.5 mm pitch used in this study, and no pitch dependence was found for the direct shear models. The smoothing length of the SPH elements was set to the recommended solver value (1.2 times the pitch of the elements) and was constant throughout the simulation.
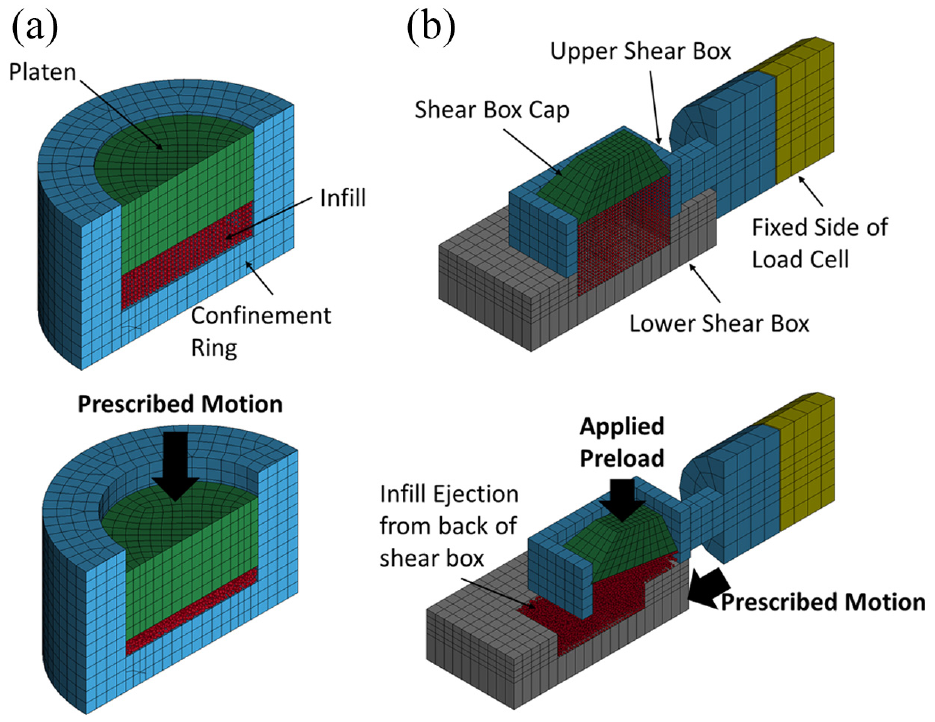
Isometric cross-sectional view of confined compression: (a) and direct shear, and (b) models before (top) and after (bottom) motion.
For the model of the confined compression test (cross section shown in Figure 2(a)), the confinement ring and platen were meshed using rigid, 4 mm hexahedral elements. The confinement ring was fixed in all directions and a 7.25 mm downward displacement (0.725 mm for sand models) was applied to the platen to compress the infill, with motion fixed in other directions. Contacts were defined between the infill nodes and surfaces of the confinement ring and platens, with the contact thickness of the SPH elements being calculated based on the volume of each SPH element.
The coefficient of friction between the infill and steel containers (µ) was assigned based on measured values from tests where infill particles were placed on a steel plate, which was raised until the particles began to roll or slide down the incline. By measuring the angle at which the particles began to move (θ crit ), using the relation µ = tan(θ crit ), the average coefficients of friction were measured (0.45 for sand and 0.68 for SBR) with five repeats for the sand and SBR. For all models with SBR, a single coefficient of friction equal to that of pure SBR was used. Model force was output by monitoring the boundary force required to maintain the prescribed motion of the platen.
In the direct shear models (cross section shown in Figure 2(b)), the shear box was meshed using 5 mm nominal hexahedral elements. The preload force was applied to the cap in 15 ms and allowed to settle for 35 ms. The cap was allowed to rotate about the lateral axis at the center of mass as was the case in the experimental apparatus, and rotation was observed in later stages of the tests. After 50 ms, a 20 mm prescribed displacement was applied to the lower portion of the shear box over 50 ms, while the preload remained on the cap to compress the infill. A load cell was defined in the model to output the force required to maintain the upper shear box in the correct position.
Results and discussion
Experimental confined compression and direct shear tests
The confined compression test force-displacement responses (Figure 3) demonstrated a progression from the high-stiffness 100% sand response to the more compliant 100% SBR configuration. The mixtures typically fell between the two single material configurations, although the mean responses tended to be closer to the 100% SBR configurations. The overlap of some ±1 standard deviation corridors suggests that the differences between force-displacement response of the mixtures and 100% SBR may not be statistically significant in all cases. The tendency of the mixture responses to better match the 100% SBR response may be due to the density of the sand being roughly three times larger than the SBR, meaning even the 33% by weight mixture of SBR had a relatively high volume of SBR compared to the sand (1:1 ratio by volume). Most studies of the mechanical response of SBR-Sand mixtures in the literature have been focused on their use in geotechnical areas, with somewhat larger SBR particles and relatively low SBR content, 33 compared to the current study, making quantitative comparison to the current results difficult. The progression of strength and stiffness with changes in SBR proportion in the current study was similarly shown by Asadia et al., 14 who measured the confined compression response of mixtures of sand and rubber with mean particle diameters of roughly 4 mm and found that as the proportion of sand in the mixture increased, the force-displacement response stiffened.
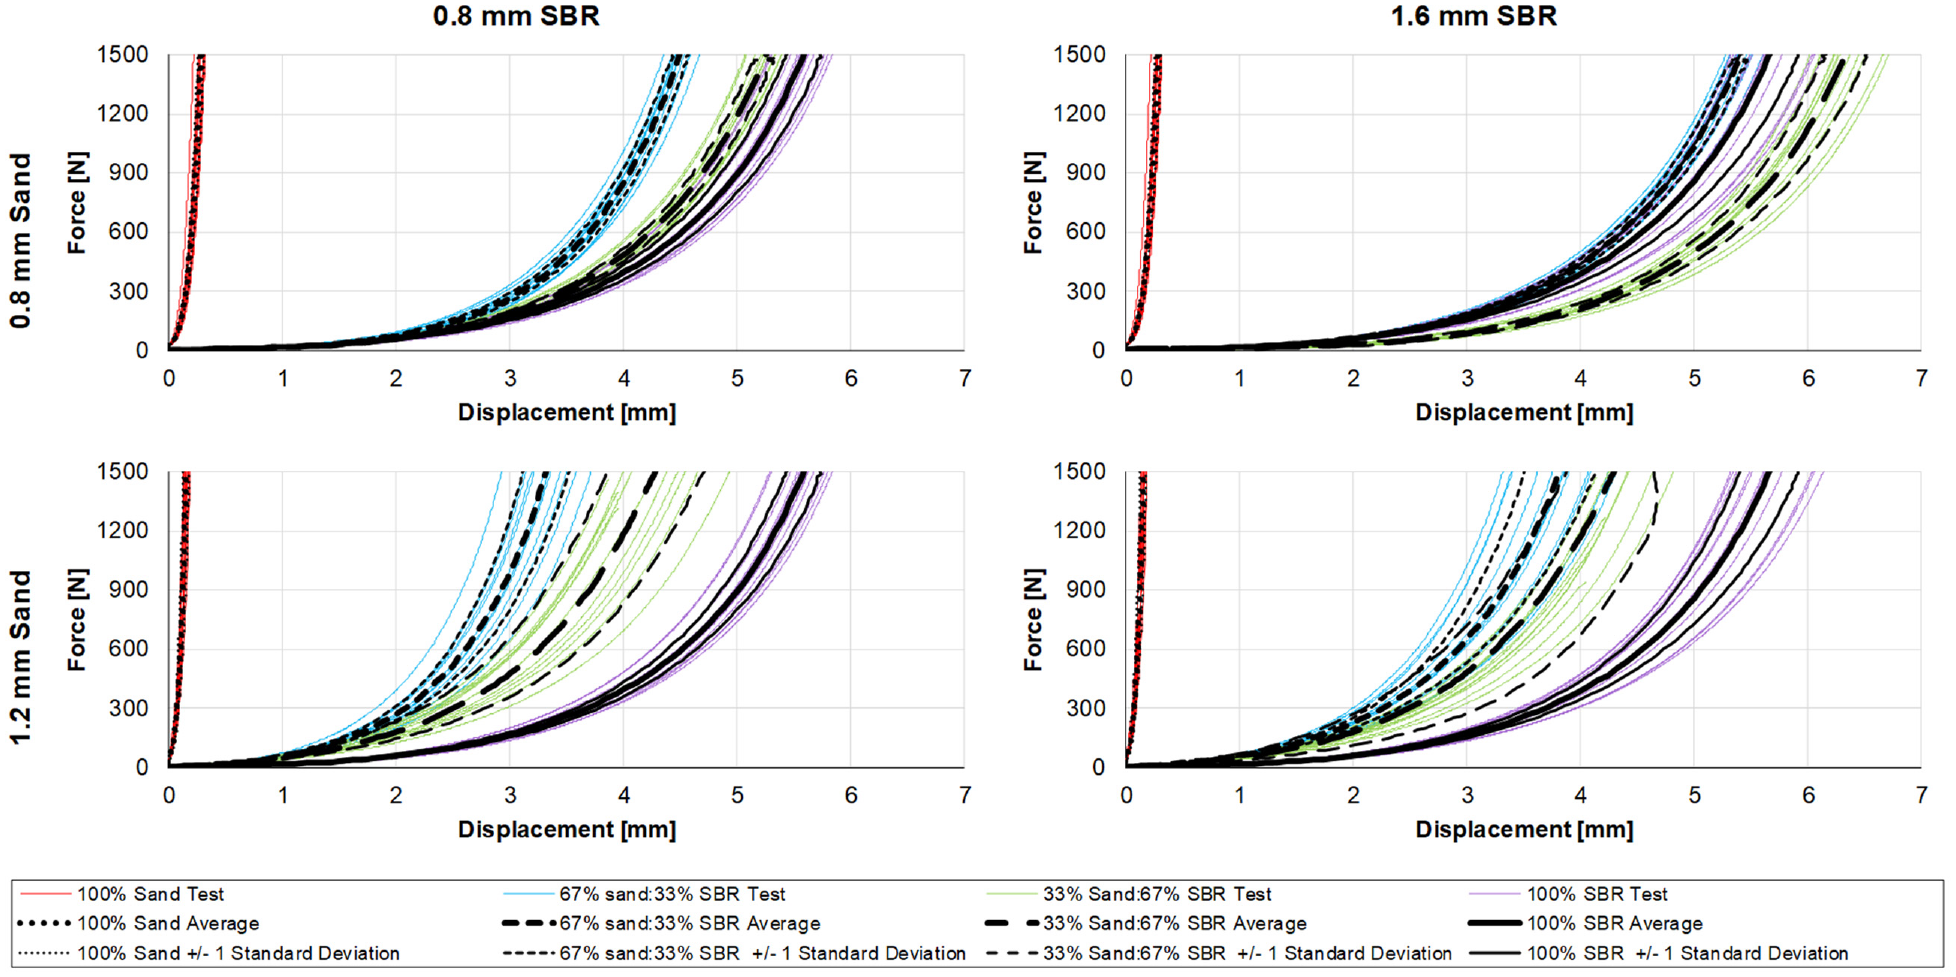
Confined compression test results, average response curves (heavy black lines), and ±1 standard deviation corridors (light black lines).
The mixtures incorporating 0.8 mm sand tended to show less differentiation from the 100% SBR cases than the mixtures using 1.2 mm sand. The lack of differentiation was especially apparent in the 0.8 mm sand – 1.6 mm SBR mixture, which exhibited no real differentiation between the 100% SBR and mixtures. In fact, due to the scatter in the test data, the average response of the 67% SBR configuration exhibited a more compliant response than the 100% SBR configuration. These results suggest that in configurations with small sand particles, the deformation of the SBR particles was the primary cause of deformation with the sand possibly moving into gaps between the SBR. In configurations with larger sand particles, the larger sand particles ‘locked-up’ the SBR particles and increased the overall force required for compression.
The force-displacement responses of the direct shear tests (Figure 4) also demonstrated a progression from low stiffness and strength in the 100% SBR configurations to higher strength and stiffness as the proportion of sand increased. The shear responses of the SBR and mixtures had similar shapes, with a gradual increase in stiffness throughout the entire loading history, due to the compliance of the SBR particles. The 100% sand response, however, exhibited a substantially different characteristic shape with a large initial stiffness, followed by a relatively flat plateau, with a distinct peak between the transition in some cases, as has been reported in the literature. 32 One interpretation of the direct shear force-displacement responses would be to consider these responses as the maximum force available to an athlete as they walk, run or land from a jump (corresponding to the first, second and third rows of Figure 4) before large scale motion of the infill begins. Of course, in actual turf the response of the infill is complicated by the presence of fibers which further confine the infill.
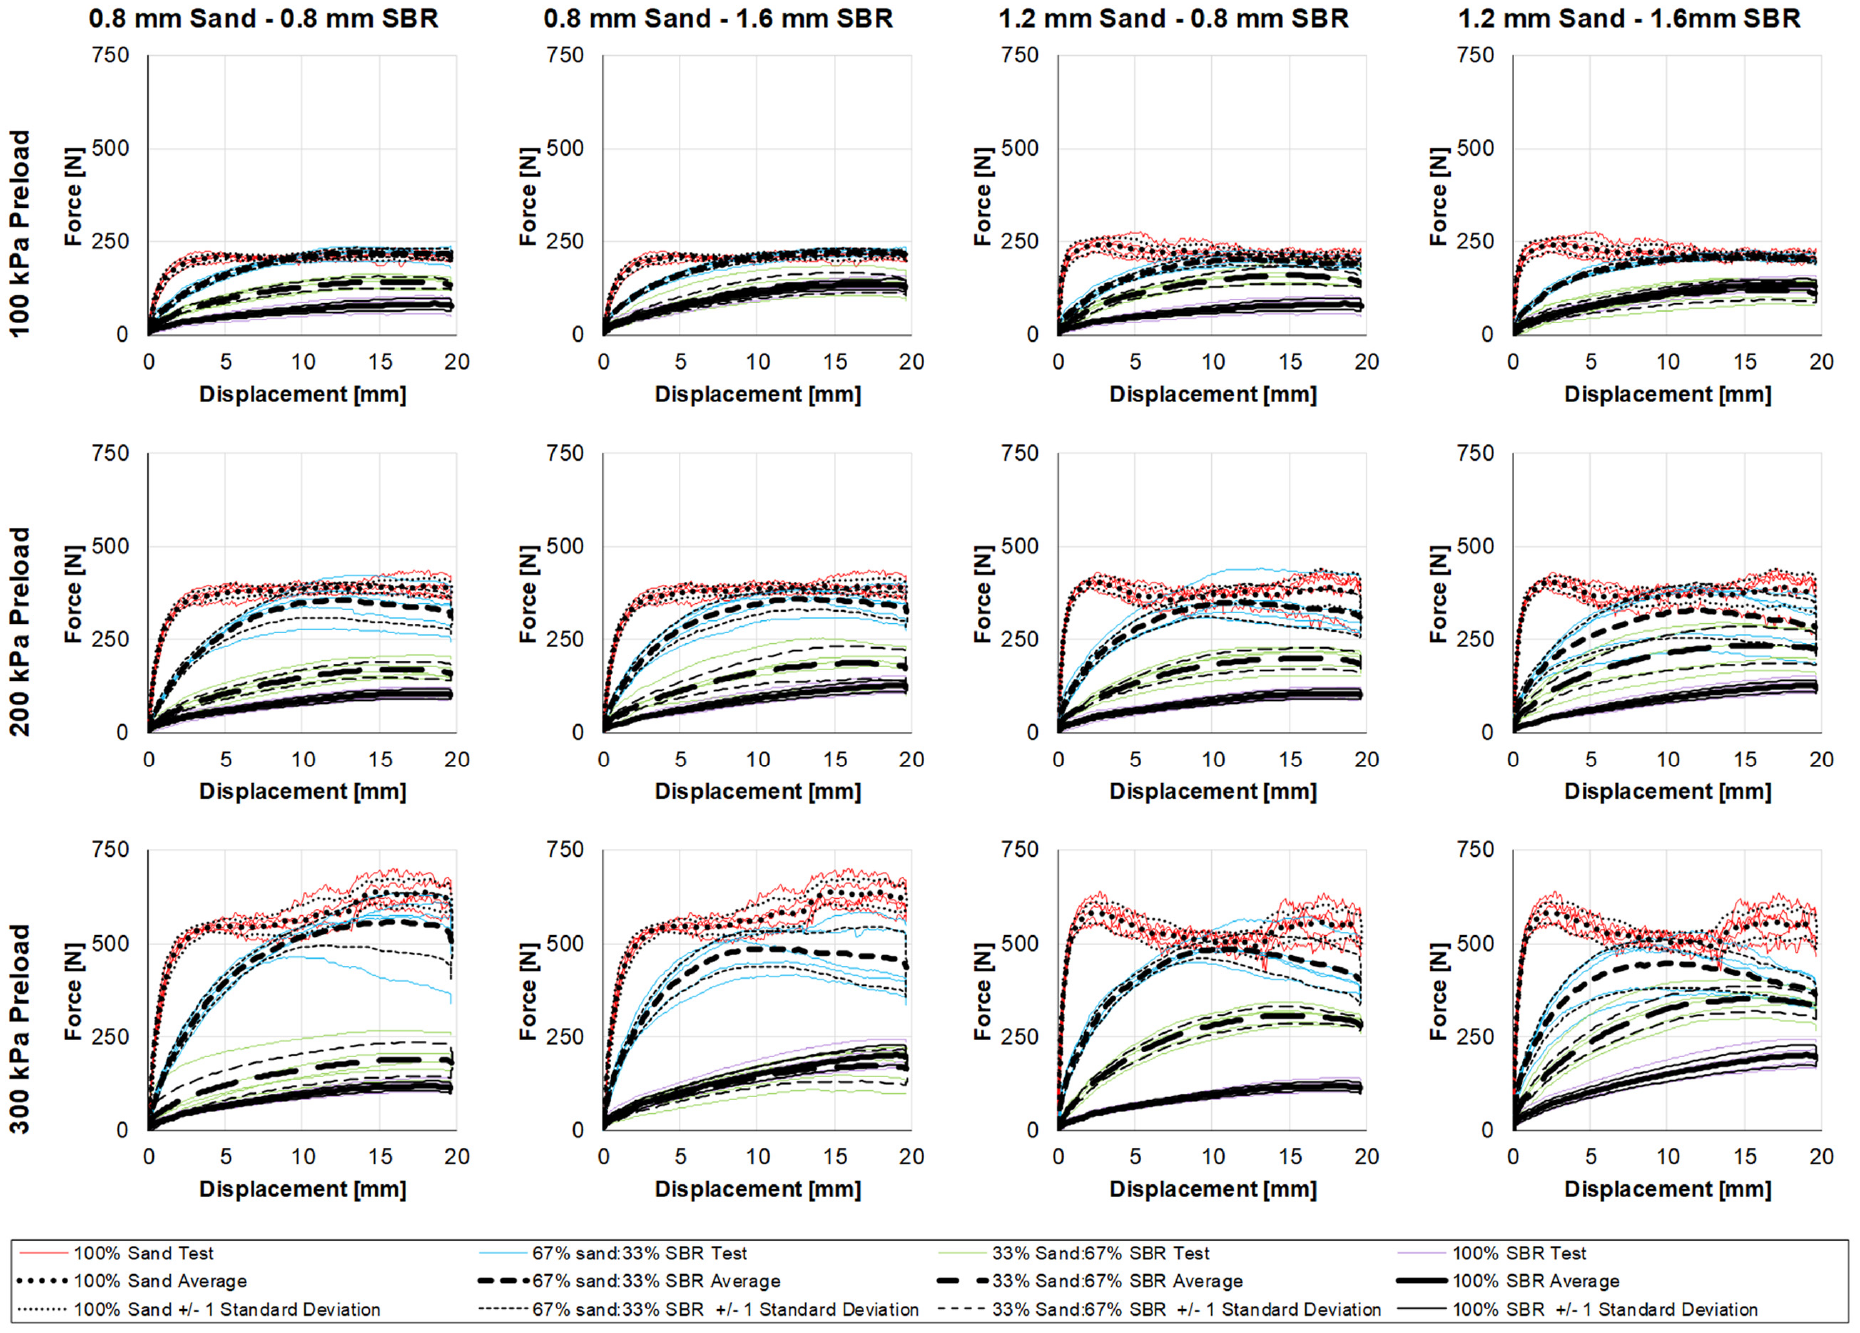
Direct shear test results, average response curves (heavy black lines), and ±1 standard deviation corridors (light black lines).
No clear yield point was apparent in the infills containing SBR, which could be attributed to SBR particle deformation. In contrast, the two 100% sand configurations exhibited typical yield-like behavior with a large initial stiffness followed by a long, relatively flat plateau as has been reported in many studies of sand materials. 32 In the present study, the force at 6 mm shear displacement was used to define the yield stress of the infill and resulted in a steady progression between 100% SBR and 100% sand materials (Figure 5). Comparing the shear stress exerted during walking, running and landing from a jump (19 kPa, 43 kPa and 69 kPa; Table 3) to the yield stresses measured from the corresponding preloads (100 kPa, 200 kPa and 300 kPa, respectively), it was apparent that not all maneuvers could be properly performed on all infills. For example, attempting to run on either 100% SBR infill (a vertical pressure of 200 kPa) without fiber reinforcement would result in a situation where the required shear resistance to perform the maneuver (43 kPa) would exceed that available from the footing (26 kPa to 27 kPa). A similar situation exists for landing a jump for Configurations 7, 8, 11 and 12. The interaction with fibers in a full turf construct is critical to stiffen the infill and allow a full range of maneuvers for the players. In the unconfined state, one would expect large scale flow of the granular material. The fibers prevent this bulk motion, causing the infill to build pressure, allowing the full turf construct to support players during high-load maneuvers. Thus, due to the fibers, the infill is in a confined state, similar to the confined compression and direct shear tests.
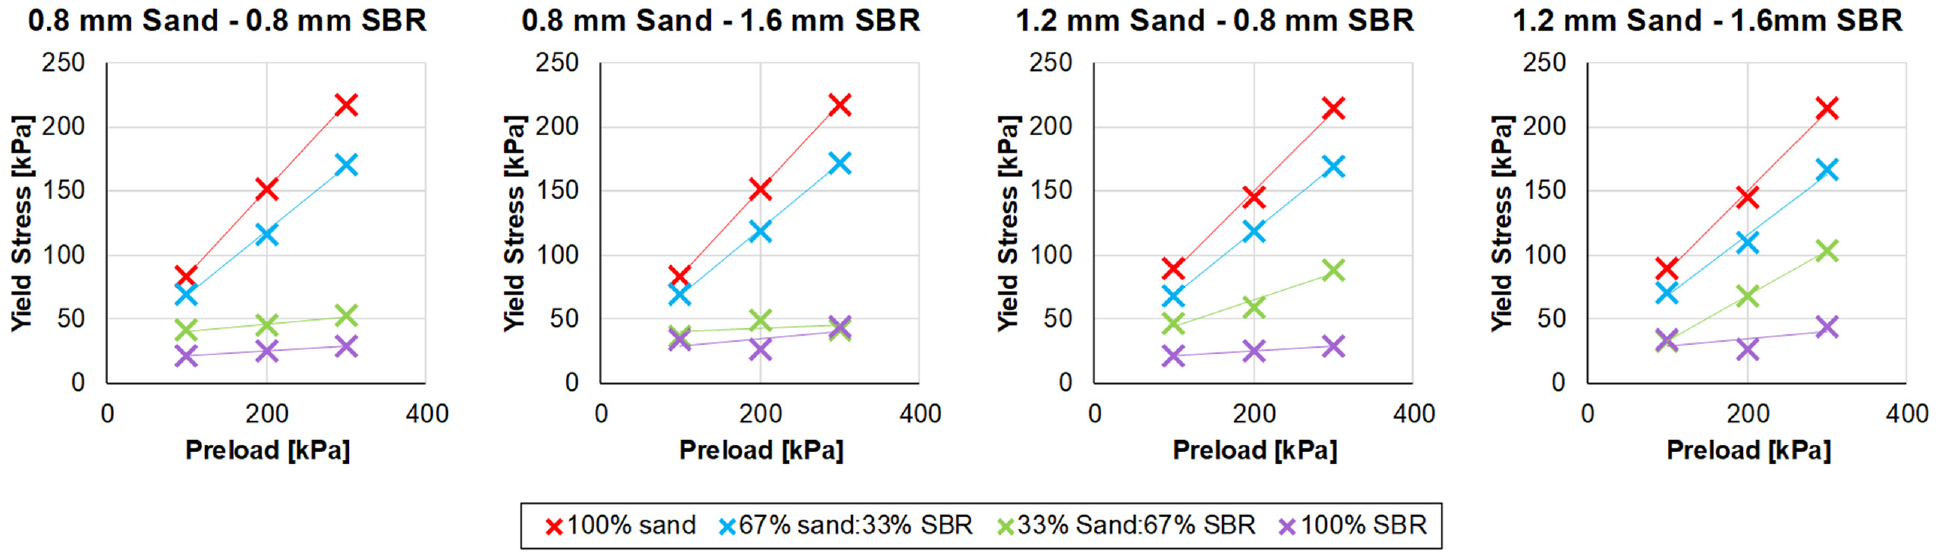
Yield stress vs. preload for different weight ratios of four different SBR and sand mean particle diameter mixtures.
Both the shear and bulk moduli (Figure 6) exhibited a similar response characteristic, with rapidly decaying values as the proportion of SBR increased, particularly for bulk modulus, which dropped from between 200 × 103 kPa and 80 × 103 kPa for 100% sand to less than 8 × 10³ kPa for all configurations with SBR. The reduction in shear modulus was more gradual, but still exhibited a non-linear response.
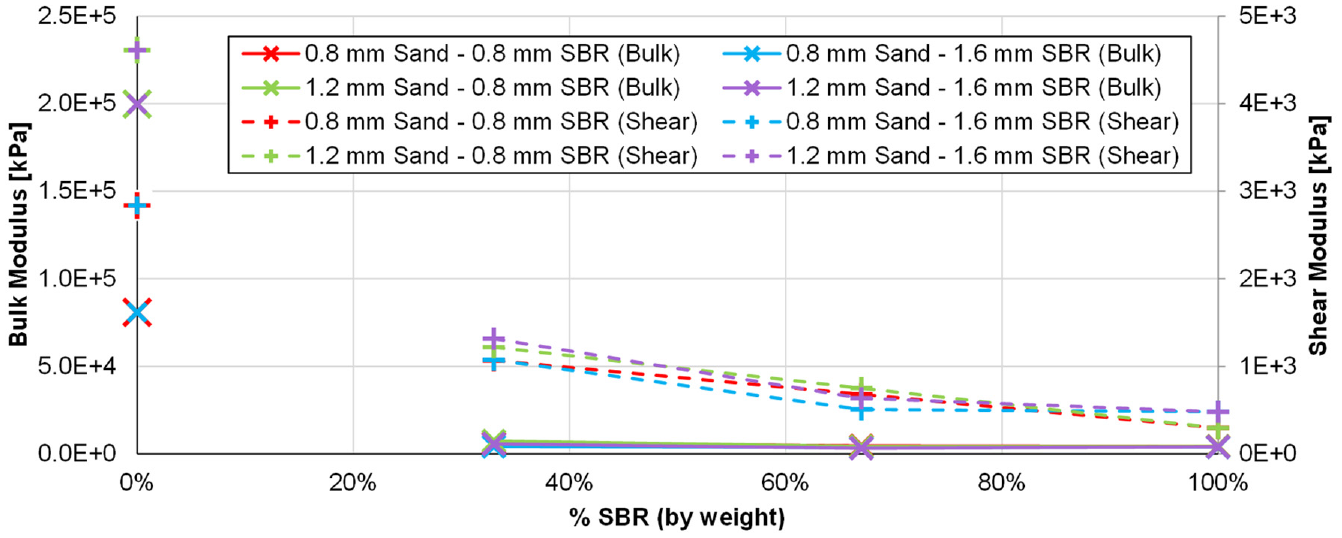
Shear and bulk moduli calculated from the experimental tests and used in the computational models.
Using the results of the confined compression test to define the pressure-volume response and bulk modulus and the direct shear test to define the shear modulus and yield parameters, all the parameters necessary to model the infill (Table 4) were measured.
Model parameters for each configuration tested.
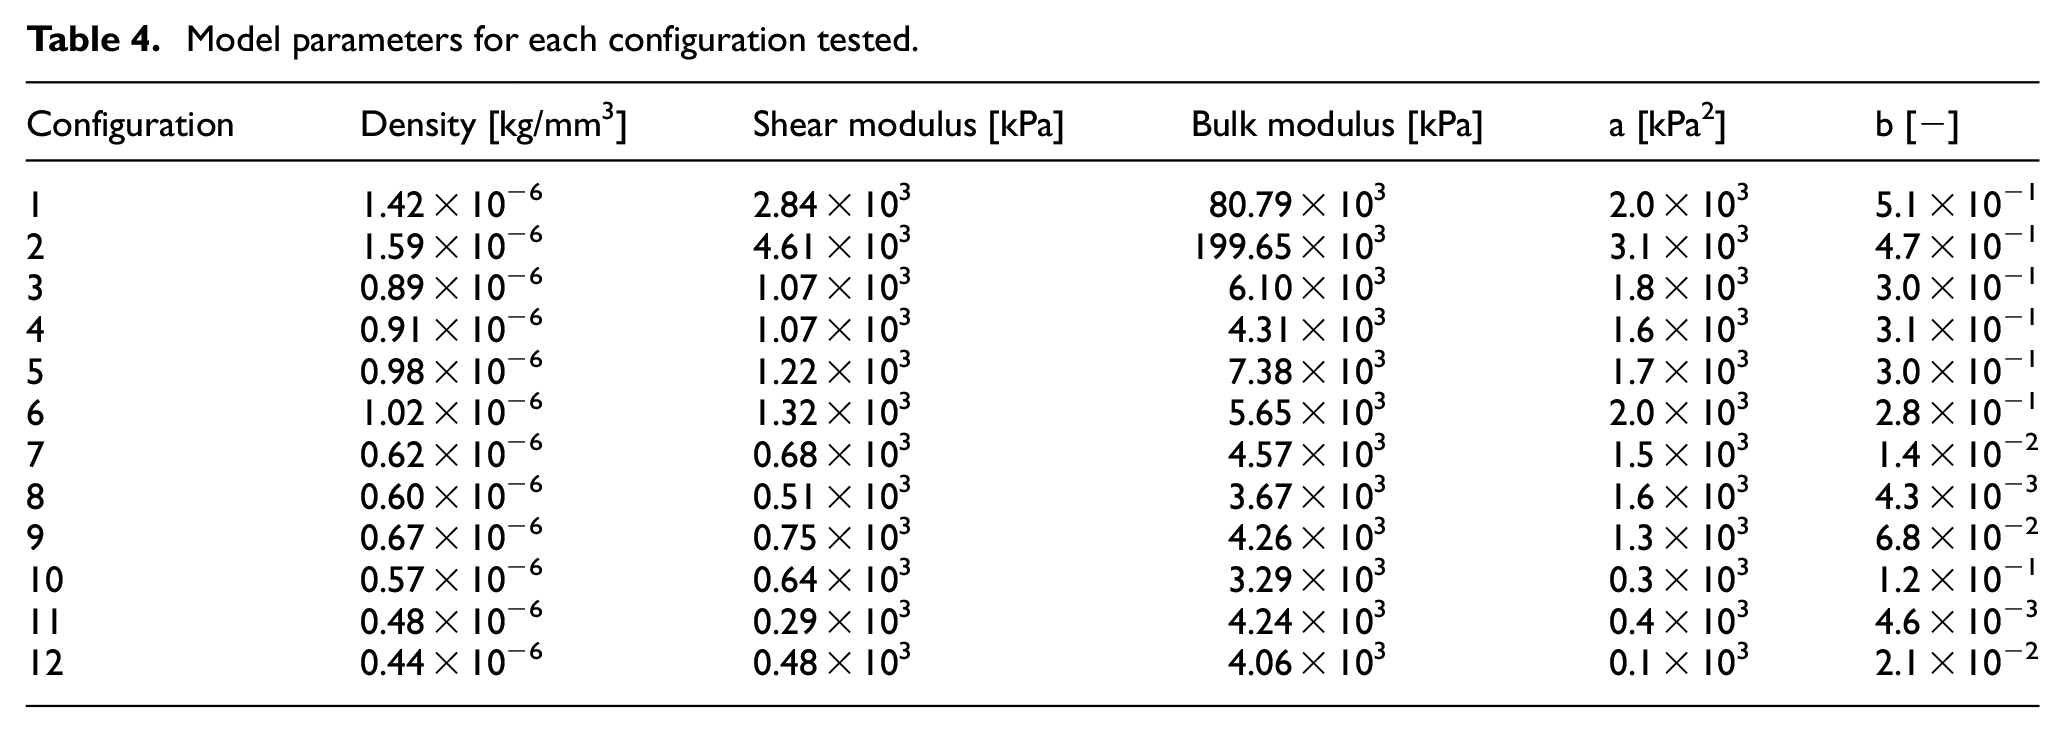
According to the model of cleat-infill interaction proposed by Forrester and Fleming, 10 one of the critical components to the overall traction generated by a cleat is the shear modulus of the infill layer. The average shear modulus of the four mixtures using the smaller (0.8 mm) sand (Configurations 3, 4, 7 and 8) was 0.83 × 10³ kPa compared to 0.98 × 10³ kPa for mixtures using the larger (1.2 mm) infill. Conversely, configurations with smaller (0.8 mm) SBR (Configurations 3, 4, 7 and 9) exhibited a higher average shear modulus (0.93 × 10³ kPa) than the larger diameter (1.6 mm) SBR (0.89 × 10³ kPa). A clear trend showing increasing shear modulus with increasing sand proportion would suggest that the overall traction a player could utilize would increase with a larger proportion of sand. Furthermore, materials exhibiting higher yield strength would also allow higher traction to be generated.
Numerical model verification with experimental test data
The force-displacement response of the confined compression test model (Figure 7) fell within the scatter of the test data for most configurations, particularly for larger (i.e., above 500 N) forces. The current modeling approach exhibited small differences between the average test data and model at the direct shear preload values (average absolute differences of 0.2 mm, 0.2 mm, and 0.3 mm for 250 N, 500 N and 750 N, which represent 100 kPa, 200 kPa and 300 kPa in the direct shear tests, respectively) and at the maximum force investigated in this study (0.5 mm at 1500 N).
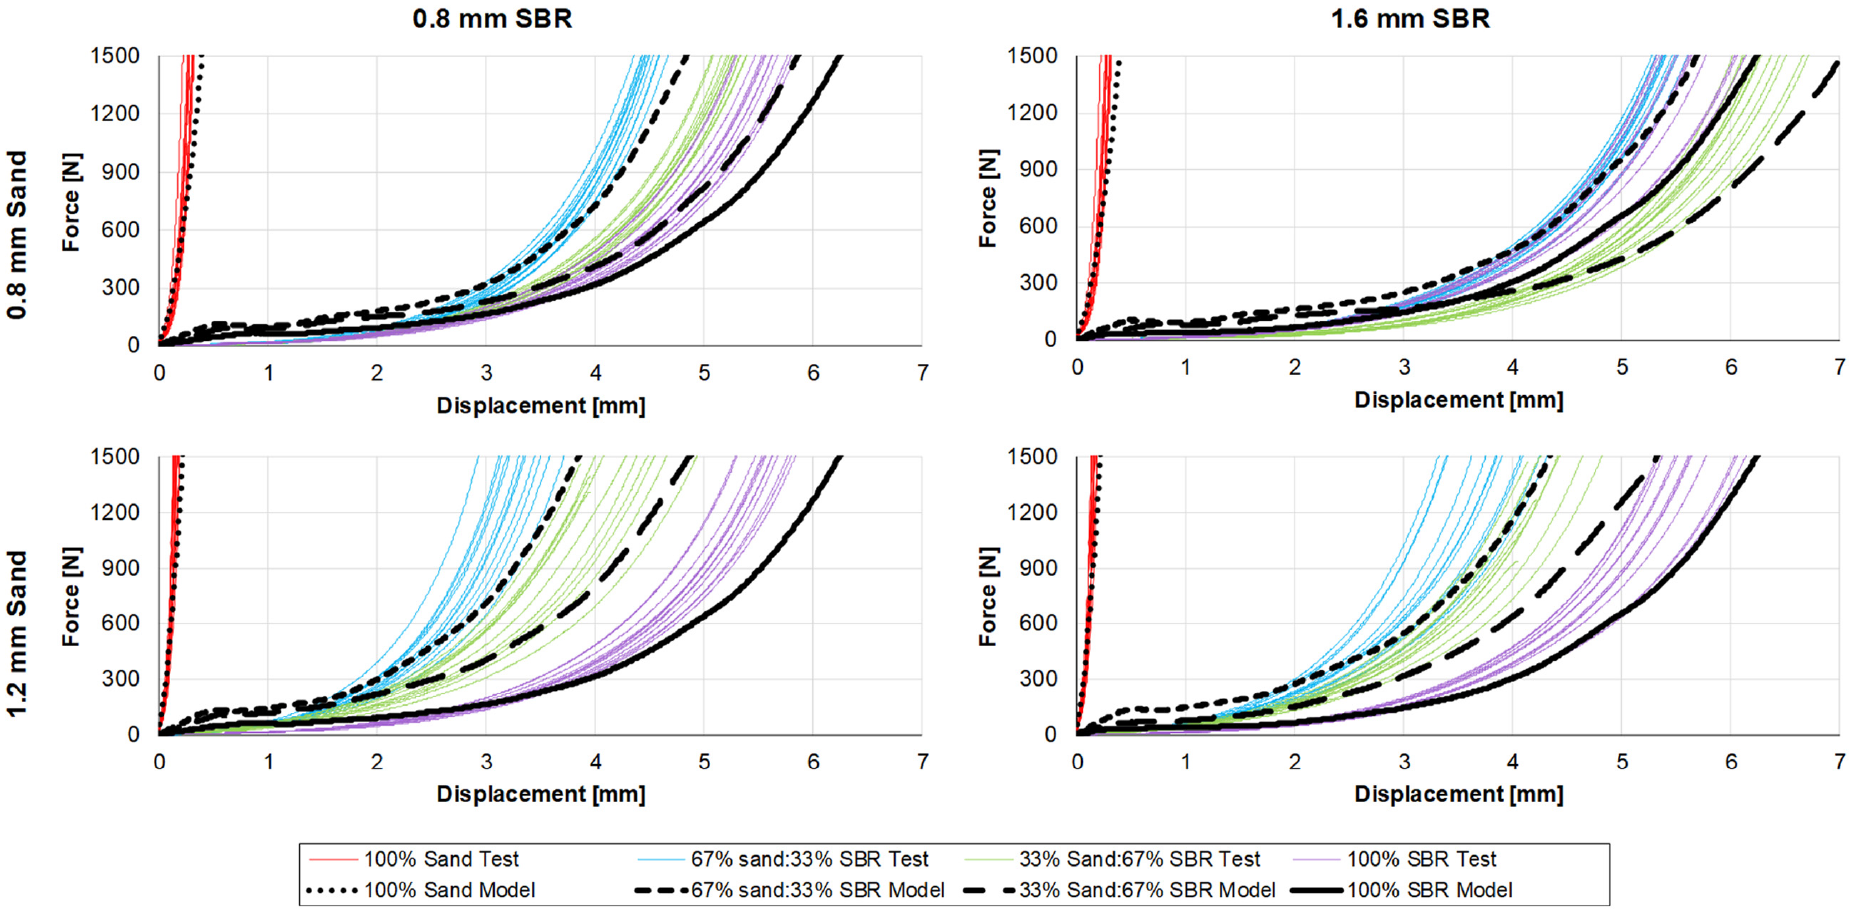
Comparison of the confined compression model results (dashed lines) to the experimental data (solid lines).
The elastic-perfectly plastic soil material model caused a small offset in force in the early portion of the response, which was most apparent in the 67% Sand: 33% SBR mixtures, due to the relatively high shear modulus (which is used to calculate the Young’s modulus) compared to the other SBR configurations. Ideally, a hyperplastic material model with user defined pressure-volume and pressure dependent yielding responses could be used to capture the compression response of the SBR infill and yield response of all infills across the three direct shear preload levels used in this study. Unfortunately, no such material was readily available in the standard material library of the solver.
The results of the direct shear test models (Figure 8) showed good agreement with the test data for 100% SBR and mixture cases but with a lesser correspondence to the test data for the 100% sand configurations. The 100% SBR and mixture configurations exhibited average absolute differences of 16% at 6 mm displacement (the displacement used to define yield) and 24% at 19.5 mm (maximum) displacement. In all cases involving SBR, the model provided a gradual change in slope up to the point where substantial portions of material in the shear plane experienced yield, after which the model exhibited essentially a linear response, unlike the non-linear hardening response measured experimentally. Nevertheless, the model up to the point where the infill was no longer contained in shear box (6 mm) generally fell within the scatter of the test data. Larger displacements in full scale turf simulations should not be affected by any deviation beyond this displacement due to the unconstrained nature of the infill in full turf applications and the nature of the SPH modeling approach, which only considers material within a relatively small radius of influence.
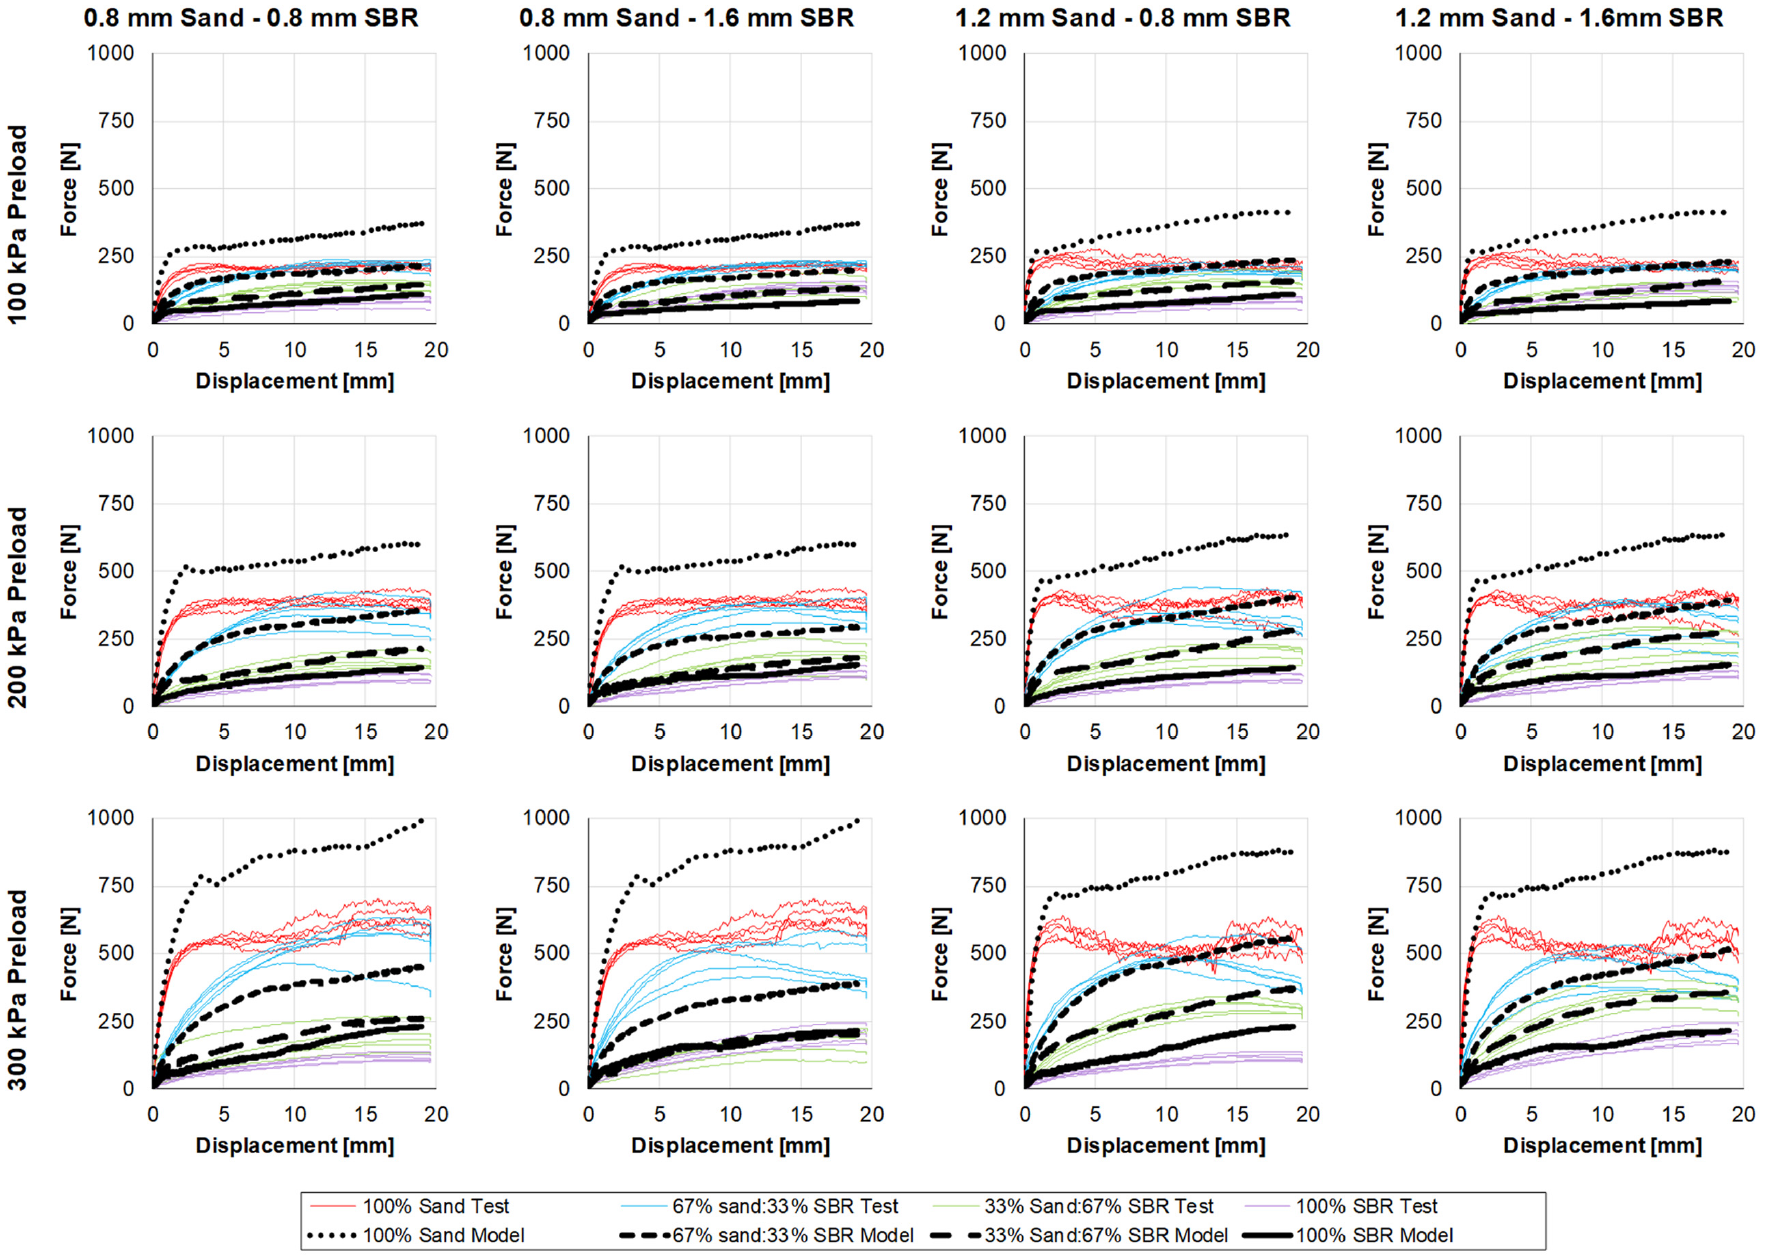
Comparison of the direct shear test model results (dashed lines) to the experimental data (solid lines).
The 100% sand models predicted an average difference to the test data of 42% at 6 mm of displacement and 69% at maximum displacement. Furthermore, the complex shape of the 1.2 mm sand with a 300 kPa preload was not captured well by the current implementation. To explain the difference in force response, it was useful to compare models with coefficients of friction between the infill and shear box of 0.45 (used in the current study) and 0.05. In the sand-only case, the force-displacement response exhibited notable differences, with the higher infill-to-wall friction model requiring higher forces to achieve a given displacement than the low friction model. Unlike the 100% sand condition, for the cases with SBR (exemplified by the 200 kPa preload direct shear test of 67% 0.8 mm sand:33% 0.8 mm SBR, Figure 9(a) the results of the models provided similar results irrespective of the infill-to-wall friction coefficient.
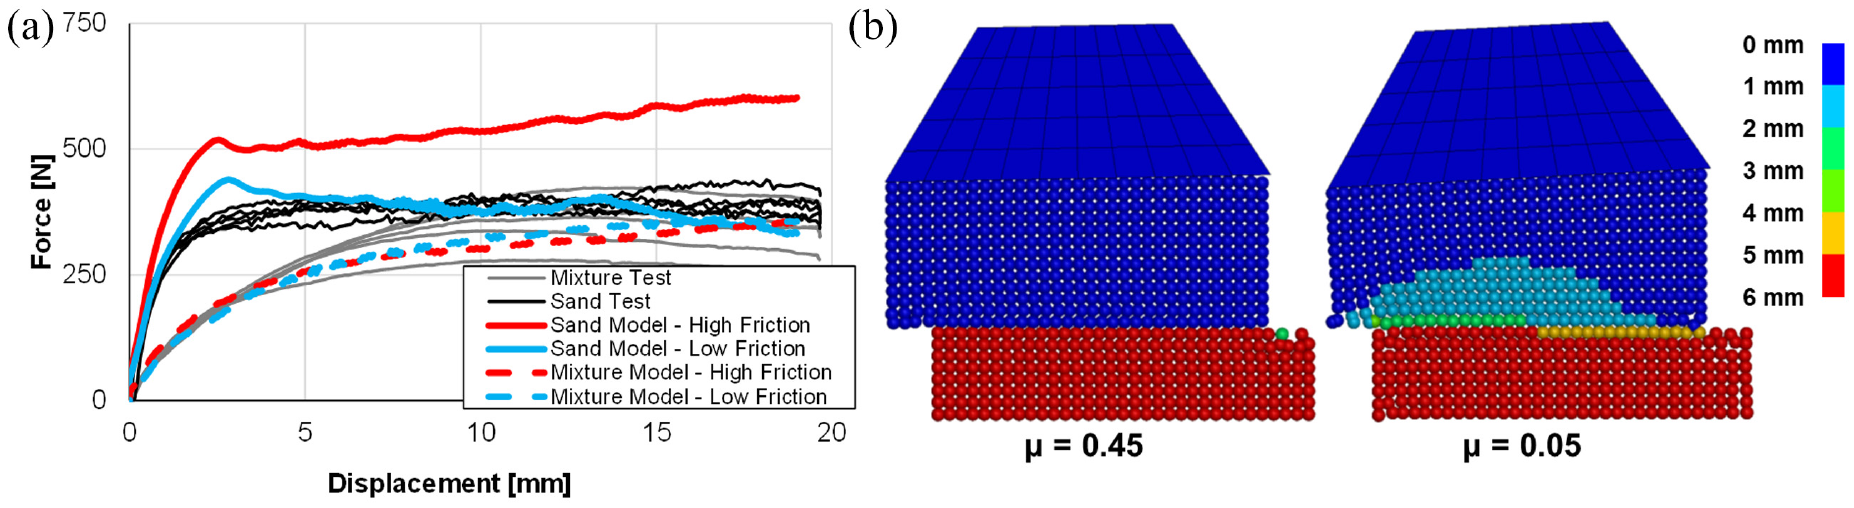
200 kPa preload direct shear force-displacement response of 33% 0.8 mm SBR / 67% 0.8 mm sand mixture and 100% 0.8 mm sand (a) and shear displacement fringe plots of infill and cap at interface of shear box side wall of 100% 0.8 mm sand model at 6 mm displacement (b).
The models of the exemplar mixture exhibited little difference up to the defined yield displacement (4 N at 6 mm) and less than 1 N difference at full displacement. In contrast, the effect of friction was significantly larger in the 100% sand case, with the model responses diverging substantially during elastic loading. After 6 mm, the sand model with low infill-to-wall friction generally trended along with the test data, while the model using the measured friction coefficient steadily increased. At the end of the loading, a 275 N difference was predicted by the high and low friction models of the sand infill. The divergence of the two sand-only models could be explained, in part, by examining the displacement of the SPH nodes at the side wall interface (fringe plots at 6 mm shown in Figure 9(b)). In the case with higher friction, there was essentially no movement between the infill and the top or bottom of the shear box containing the infill, leading to a distinct shear plane. On the other hand, there was some slippage of infill when friction was low, lowering the overall force resisted by the infill. The distinct shear plane was present in all mixture and 100% SBR models, however, the relative importance of this effect was minimized due to the lower shear modulus and yield strength of these materials. A more refined model input could be developed for the 100% sand infill by considering the effects of infill-to-wall friction in the test, but for configurations involving 33% SBR (by weight) and above, only modest improvement in the model would be achieved.
When considering all cases, the models fell within 25% of the average test displacement at 250 N, 500 N, 750 N and 1500 N in confined compression 96% of the time and within the average test force at 6 mm and 19.5 mm in direct shear 57% of the time (Figure 10). The reduced performance of the direct shear models was somewhat skewed by the poor fit of the 100% sand configurations due to the analysis not accounting for frictional effects in the test analysis and the small forces generated in the 100% SBR tests. Considering only the mixtures, the model was within 25% of the direct shear data 80% of the time meaning that for infills that would be of interest for full turf applications, the current modeling approach was able to represent the response well.
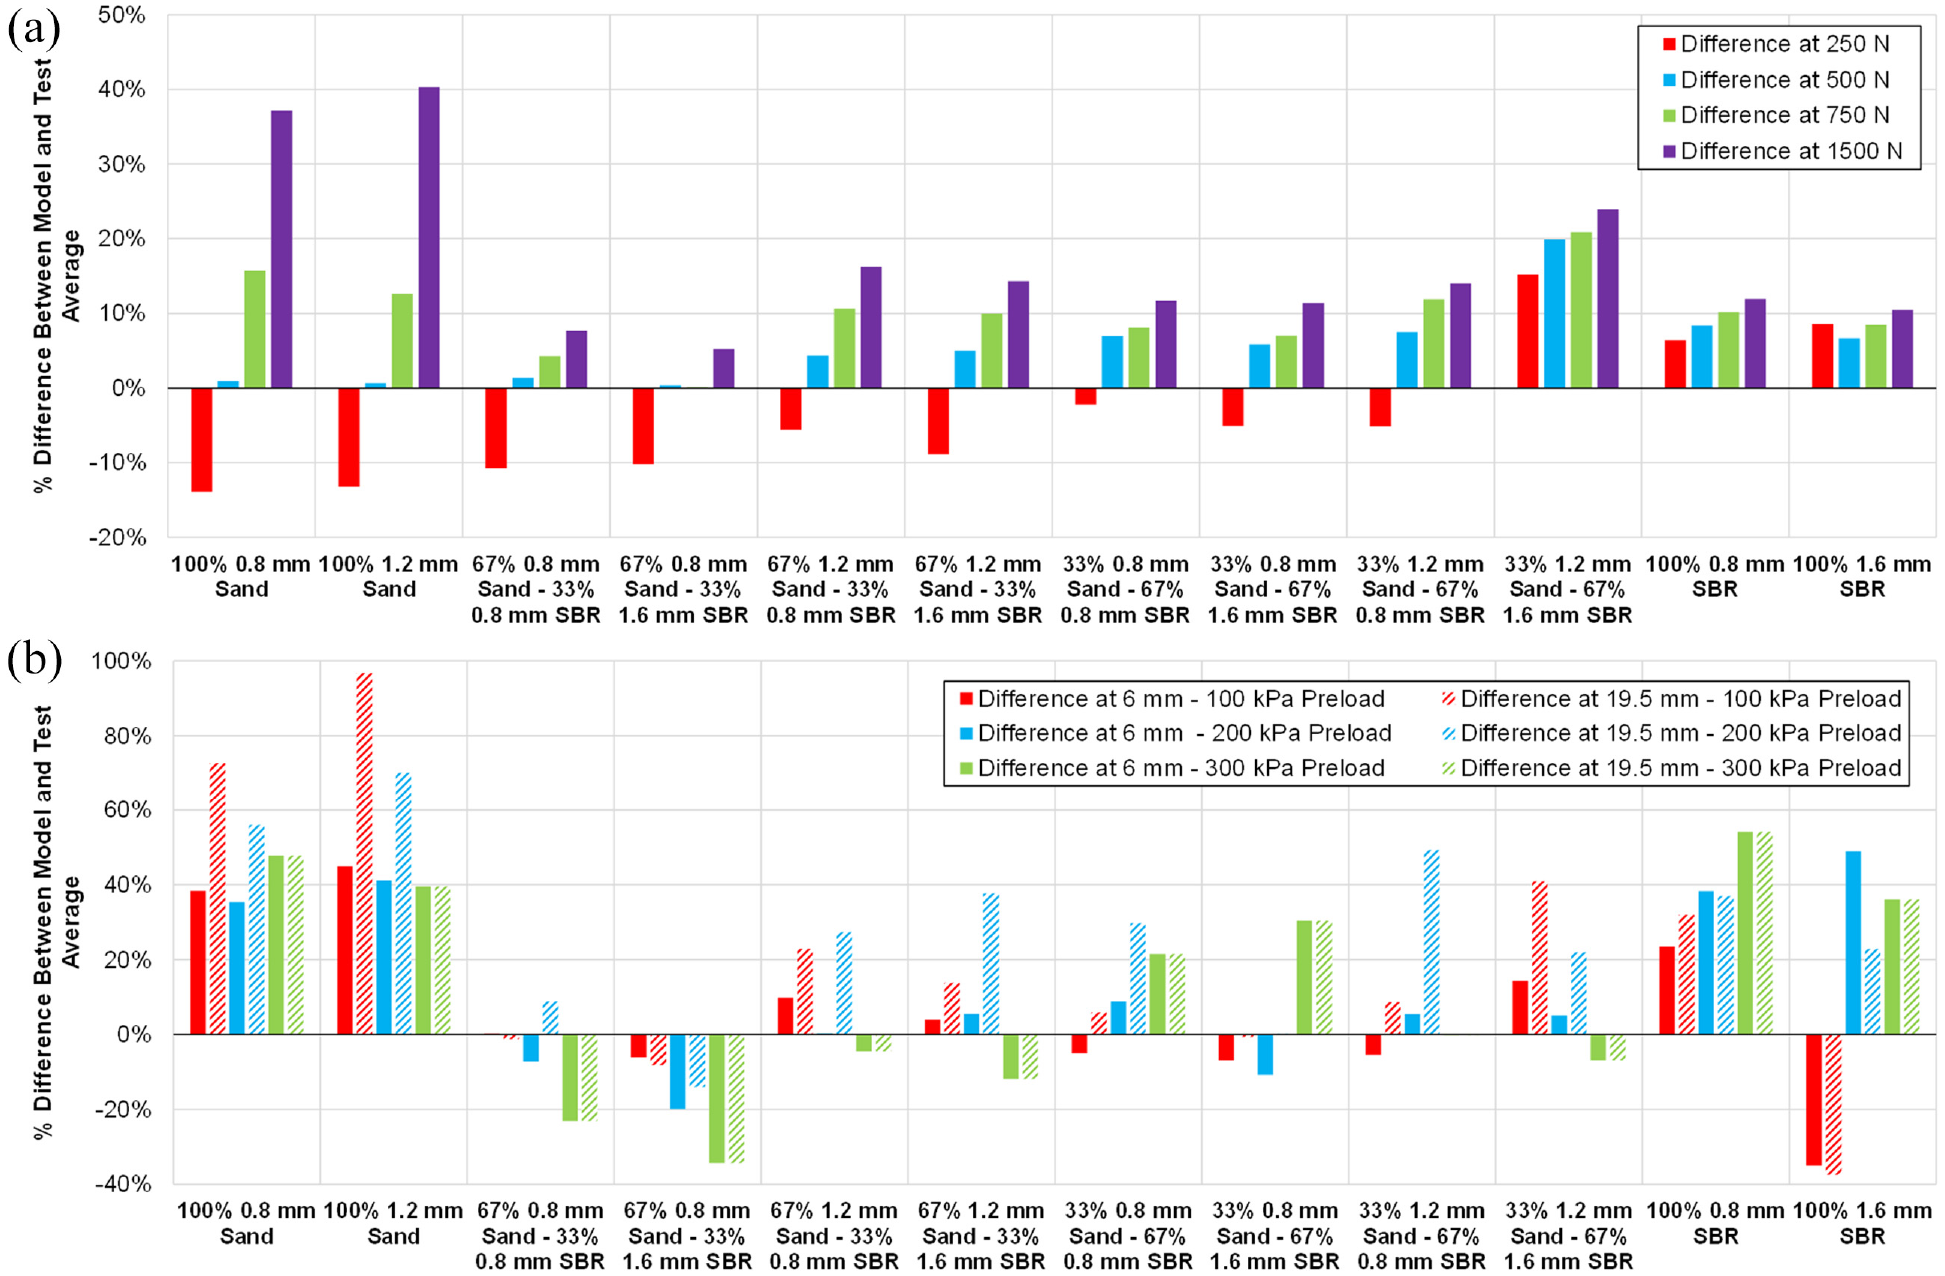
Percent difference between the model and test average at points of interest for all configurations of confined compression: (a) and direct shear, (b) models.
Conclusions
Both the confined compression and direct shear testing in this study revealed a progression from low strength/stiffness SBR material force-displacement response to a higher strength/stiffness sand response as the proportion of sand was increased. This progression tended to be more linear for direct shear at large deformations (i.e., above 6 mm) and clustered towards the SBR response for confined compression and early displacement of the direct shear test. Larger sand particles tended to increase the differentiation in responses, possibly due to larger sand particles locking the SBR particles and reducing the ability of the SBR to move freely within the test volume.
Using the test data measured from the confined compression and direct shear tests, a methodology was developed to populate the parameters for an elastic-perfectly plastic soil material constitutive model. Numerical modeling of each test was performed using the SPH approach to model the infill. The soil constitutive models were able to capture the response of both confined compression and direct shear at three different load levels for each configuration of infill investigated.
The methodology outlined in the present study demonstrated the ability to predict the response of a variety of turf infills and can be implemented in large-scale turf models, using a bottom-up modeling approach, helping to understand and improve turf-related player performance and reduce injuries.
Footnotes
Appendix
Acknowledgements
The authors would like to express thanks to Biocore, LLC and Compute Canada for their support of this research. Additionally, research presented in this paper was supported in part by the National Football League and the National Football League Players Association. The views expressed are solely those of the authors and do not represent those of the NFLPA, the NFL, or any of its affiliates.
Declaration of conflicting interests
The author(s) declared no potential conflicts of interest with respect to the research, authorship, and/or publication of this article.
Funding
The author(s) disclosed receipt of the following financial support for the research, authorship, and/or publication of this article: This research was supported by Biocore, LLC, the National Football League and the National Football League Players Association.