
Abstract
The normal coefficient of restitution was considered for normal
Introduction
Sports balls are often made of viscoelastic materials, which are time-dependent and lose energy during impact. A common metric used to describe energy loss in a collision is the coefficient of restitution
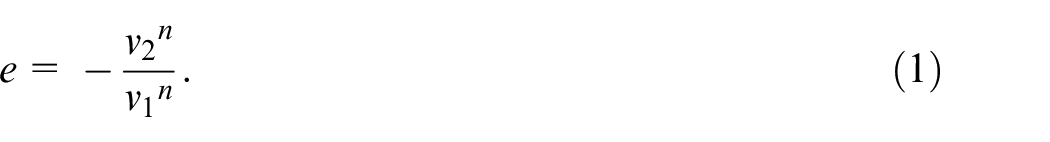
In a perfectly elastic collision, e = 1, while in a perfectly inelastic collision, e = 0. Governing sports bodies often regulate e to maintain consistency across different competitions, and e has been standardized for many sports. For example, baseball, softball, field hockey, and lacrosse all use the same standard to approve balls for play. 1 This standard test involves a normal impact, where the inbound and outbound velocities lie along the same path, against a rigid wall at a speed of 26.8 m/s (60 mph).
The behavior of e is well understood for normal impacts, and it is known to decrease with increasing incident velocity 2 and humidity, 3 while it increases with increasing temperature. 3 However, e is less understood when considering a ball that gains spin during impact. When the ball bounces off the playing surface at an angle, its spin changes due to the torque created by the frictional force between the ball and the surface. Additionally, when a sport involves a striking implement – such as a bat, stick, or club – the ball may acquire spin upon contact. When the inbound and outbound velocities of the ball lie along different paths, the bounce is described as oblique. The difference between laboratory normal impact tests and in-game ball response from oblique impact can be significant, as previous research has shown. 4 The dependence of e on the oblique angle has been observed for tennis balls5,6 at both low and high speeds. Furthermore, low-speed experiments of hollow and solid rubber balls have shown that e increases during oblique impacts compared to equivalent normal impacts. 7 At the onset of an oblique impact, when frictional forces are small and the ball is not yet spinning, the ball tends to slide. As the impact progresses, the frictional force increases, inducing spin. If the sliding stops before the ball leaves the impact surface, the ball is said to grip the surface. If the ball is sliding when it leaves the impact surface, the ball is said to slip.
While empirical evidence of the dependence of e on spin is limited, the plausible mechanisms behind this behavior are even fewer, and none have been validated. One explanation suggests that oblique impact induces more deformation than occurs in a normal impact, increasing the stored elastic energy, which enhances the exit velocity.4,5,7 A similar deformation argument suggests that the ball’s nonspherical shape during impact leads to an enhanced e, as the ball’s center of mass rises faster during recovery than the contact point at a speed proportional to its deformation. 8 Another hypothesis argues that the centrifugal force generated by a spinning ball increases its effective stiffness, reducing deformation, and energy dissipation. 9 A final explanation focuses on the hollow and pressurized structure of tennis balls. As they bounce obliquely, they experience more deformation, which reduces the internal volume of the rubber core and leads to higher forces during the restitution phase. 6 Research on how oblique impacts affect e is mostly limited to hollow balls and a few solid sports balls often studied at low speeds. The authors have found no work that considers the effects of oblique impacts as a function of e. This work explores oblique impact at high speeds, representative of play, to determine if e depends on the oblique angle for solid balls, and to identify the mechanisms that might explain this dependence.
Methods
Solid balls were considered in this work because previous research has focused on hollow tennis balls.5,6 As summarized in Table 1, the balls were chosen with different e, mass, construction, and size to explore factors contributing to the change in e. In Table 1, e is from a normal rigid wall impact at a 20 m/s test speed. The first two balls listed in Table 1 are often used in physics classes to demonstrate inelastic and elastic collisions. Although they are not sports balls, they provided good examples of low and high e solid balls, respectively.
List of the different balls used in the study.
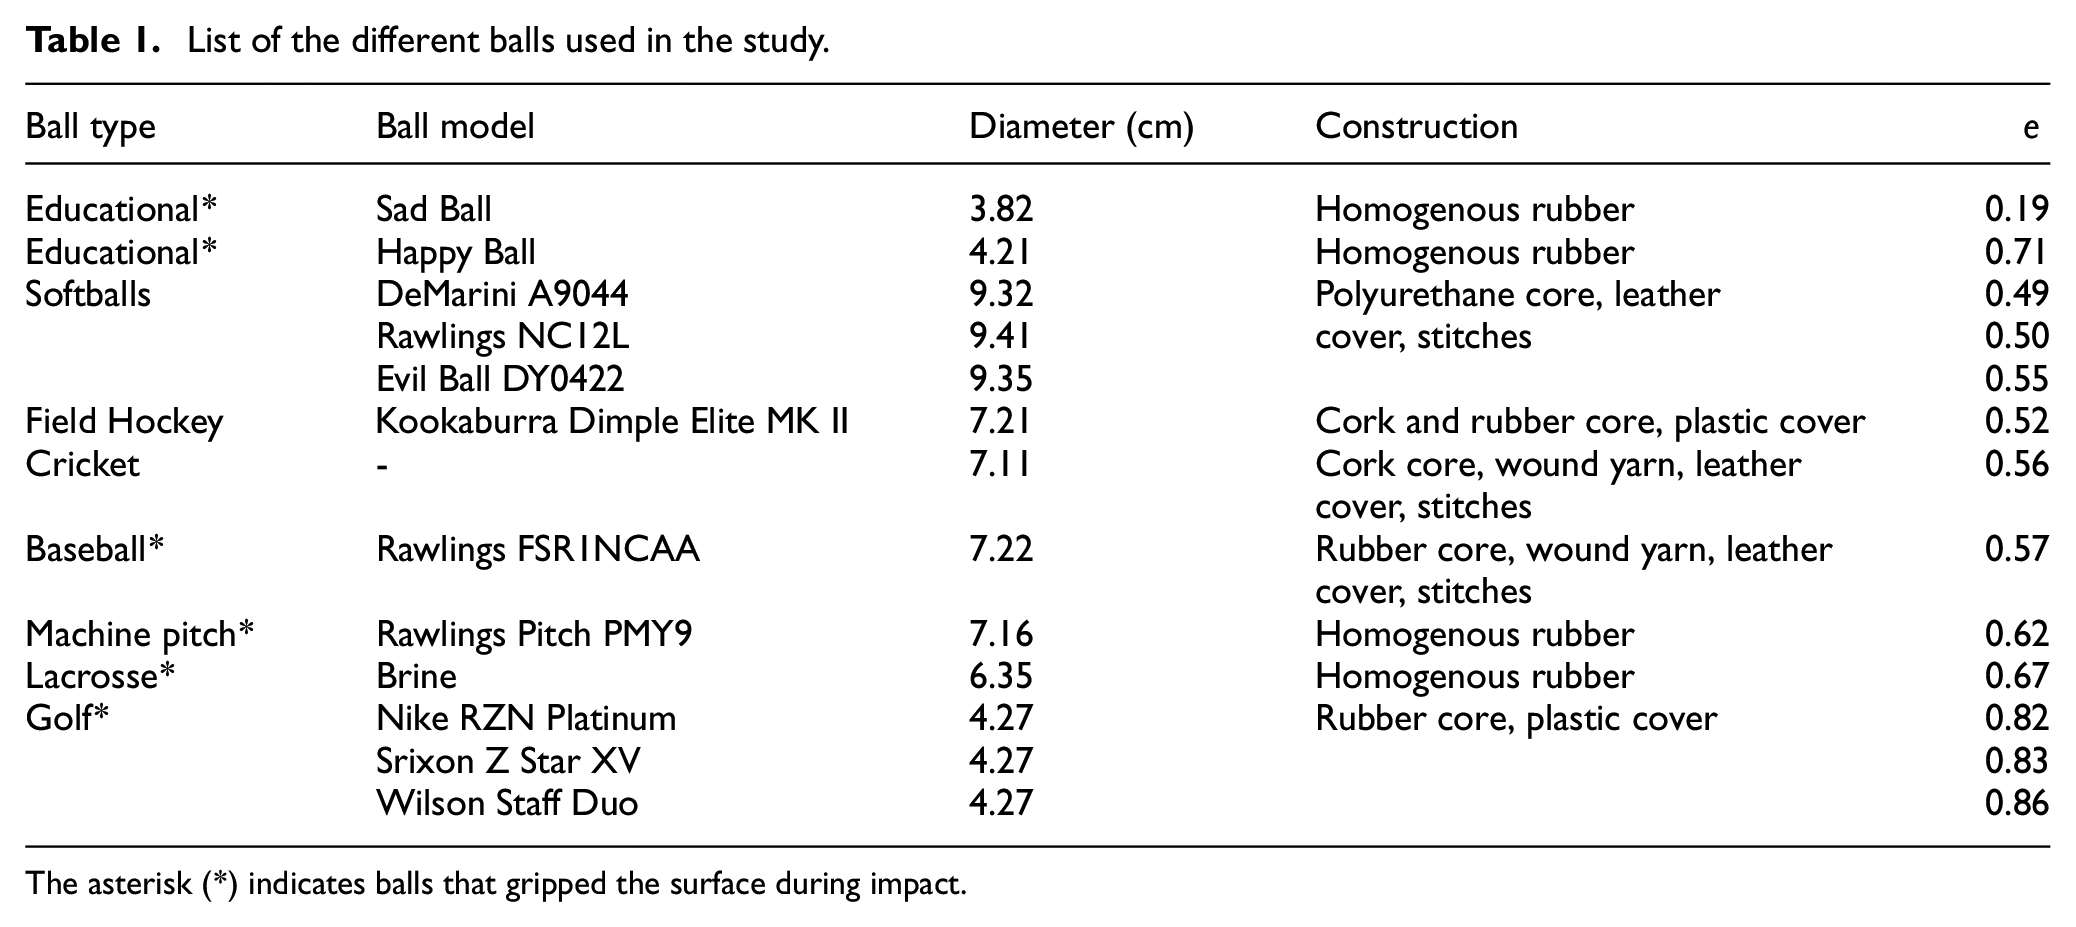
The asterisk (*) indicates balls that gripped the surface during impact.
Figure 1 shows the experimental setup for data collection. A pneumatic cannon was used to fire the balls horizontally, with no initial spin, at a 10.8-cm diameter steel circular impact plate. Steel was chosen to approximate a rigid impact surface. The impact plate was attached to a base that was angled at 90° for normal impacts and 50° for oblique impacts. Because e depends on the normal incident velocity, the inbound velocity was chosen to maintain a constant component normal to the impact surface of 20 ± 0.28 m/s in both the oblique and normal conditions. Impacts were filmed from above at 1535 fps and 1024 × 1024 pixels (MIRO M120, Phantom High Speed) with two LED lights illuminating the impact. Videos of each impact were analyzed using a MATLAB script that utilized the Image Processing and Computer Vision Toolbox. The script tracked the ball’s motion through each frame by searching for a bright circle of a specified diameter on a dark background. Temporal coordinates of the circle’s center were differentiated to calculate incident and exit velocities. Points along the edge of the impact plate were fitted to a line to create a plate vector. The incident and exit angles were found from the dot product of the velocity and plate vectors. The video measurements were checked with velocity obtained from high-speed light gates (ADC-2325-15, Automated Design Corporation). Video-tracked velocities were within 3% of the light gate speeds, while e agreed within 1% for normal impacts. Over the 20 tracked frames after impact (∼13 ms), the ball dropped 0.8 mm due to gravity. This displacement is on the order of the video tracking accuracy (0.4 mm) and was, therefore, neglected.
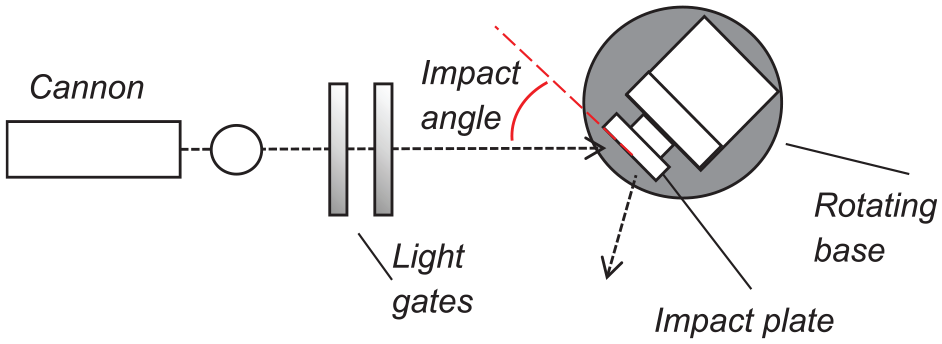
Schematic of apparatus used to perform normal and oblique impacts of solid sports balls (viewed from above).
Results and discussion
Each of the 13 ball types listed in Table 1 was impacted 16 times (8 normal and 8 oblique impacts). The coefficient of restitution was calculated using the velocity components normal to the surface (e for normal impacts and
The difference in e between an oblique and normal impact, or
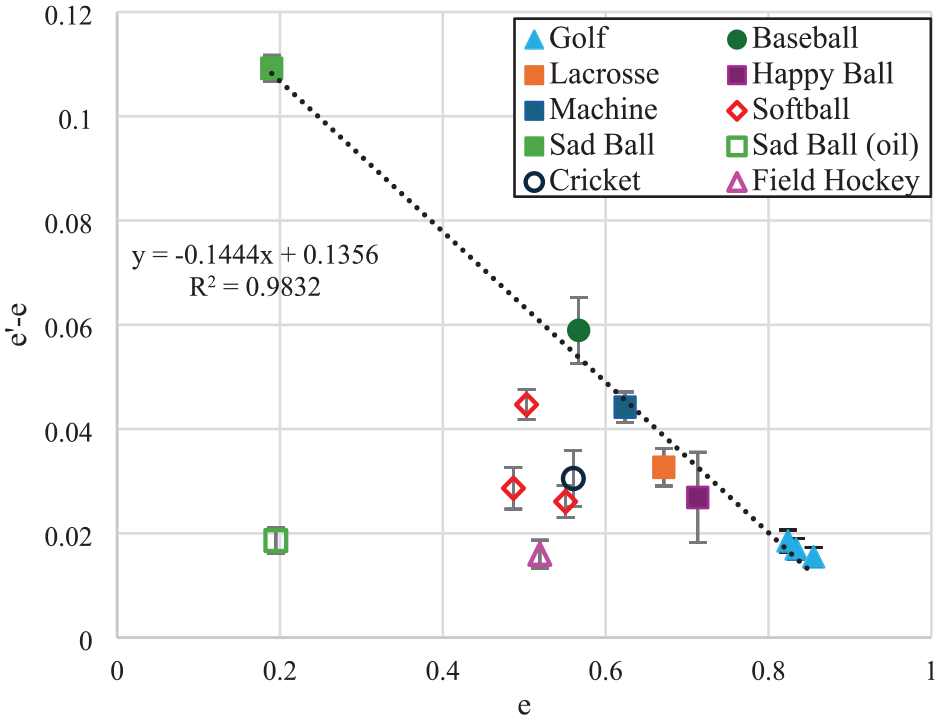
Figure 2 shows that solid balls at high speeds exhibit
The modulus of time-dependent materials decreases with time.
10
During an oblique impact, the ball deforms and grips the surface, rotating onto new, undeformed regions of the ball. As a result, oblique impacts involving balls made from time-dependent materials experience a restoring force from material that has a higher average stiffness than that involved in normal impacts of the same ball. This higher average stiffness leads to a higher restoring force and
Figure 3 shows
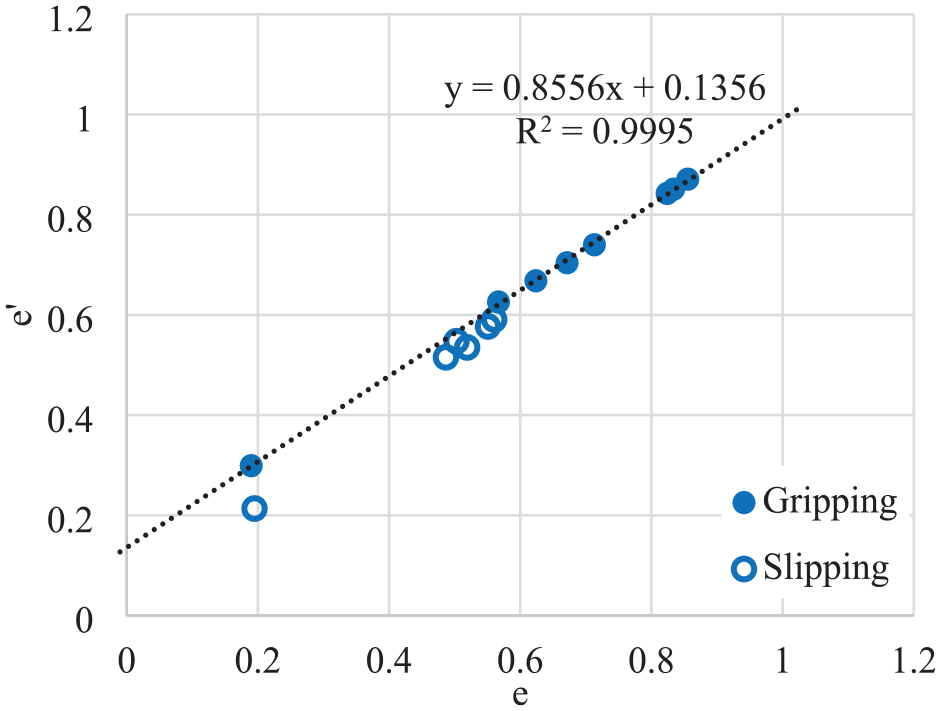
Measurements of e for different solid sports balls. Solid markers represent the balls that gripped the surface and empty markers indicate balls that slipped during contact. Each dot represents an average of 16 impacts. The standard error bars were too small to be included in the graph.
To examine the role of the ball’s rotation during impact (i.e. gripping) on
Figure 4 shows the Sad Ball gripping the surface and rotating upon impact with a clean plate (top row) and sliding, without rotation, on the low-friction surface (bottom row). The results for both Sad Ball cases are included in Figure 2, where, for the low-friction case,
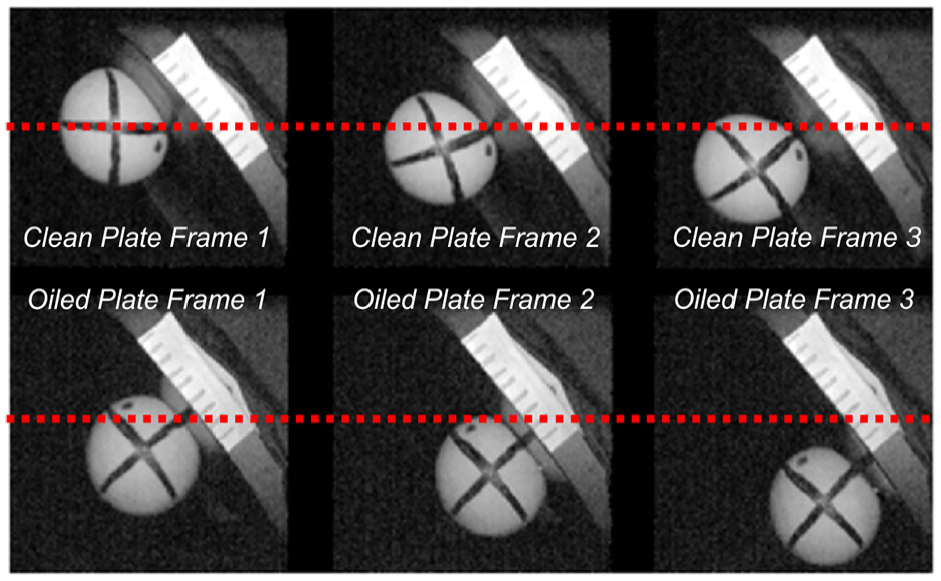
Top row: sequential frames showing the Sad Ball incident on a clean impact plate. Bottom row: sequential frames showing the Sad Ball impacting the same plate lubricated with pneumatic tool oil. The balls are incident from the left. The dotted red line indicates the initial contact point and is extended horizontally through the other two frames to help clarify the gripping behavior (top row) or sliding behavior (bottom row).
Whether a ball grips the surface or slides during contact can be determined from high-speed video. Sequential images near the end of contact were compared with the impact surface to identify which balls were sliding and which were gripping the impact surface. The solid data points in Figure 2 gripped the surface and formed a nearly straight line. Sliding balls are identified as open circles and fall below the linear fit. The distance of each point from the line was proportional to their degree of sliding or rotation during impact. The extreme sliding cases were the field hockey ball and the low-friction condition of the Sad Ball, both of which had almost no rotation.
Figure 5 compares two homogenous balls of similar size (4-cm diameter), one being nearly inelastic (Sad Ball,
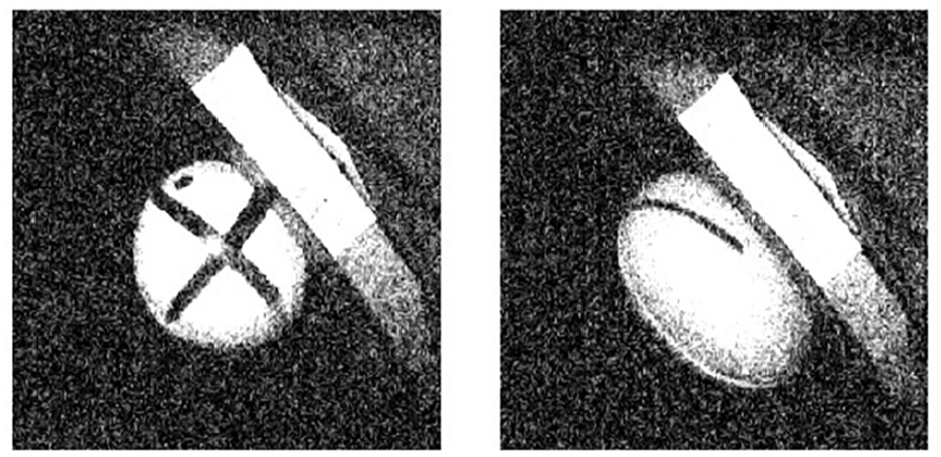
Oblique impact of the Sad Ball (left) and the Happy Ball (right) at maximum deformation.
Another explanation suggests that ball deformation into a nonspherical shape can enhance e, noting that the center of gravity rises faster than the contact point when the ball grips the surface. 8 Based on this reasoning, a ball that deforms into a nonspherical shape should exhibit a greater increase of e compared to a ball that maintains its spherical shape, regardless of its material properties. The Baseball and the Lacrosse ball exhibited approximately the same magnitude of rotation during impact, so they were chosen for this comparison.
The Lacrosse ball is more compliant than the Baseball, as shown in Figure 6, where the entire Lacrosse ball deformed into an ellipsoid. The Baseball primarily deformed in the region near the impact surface while largely maintaining its spherical shape. However,
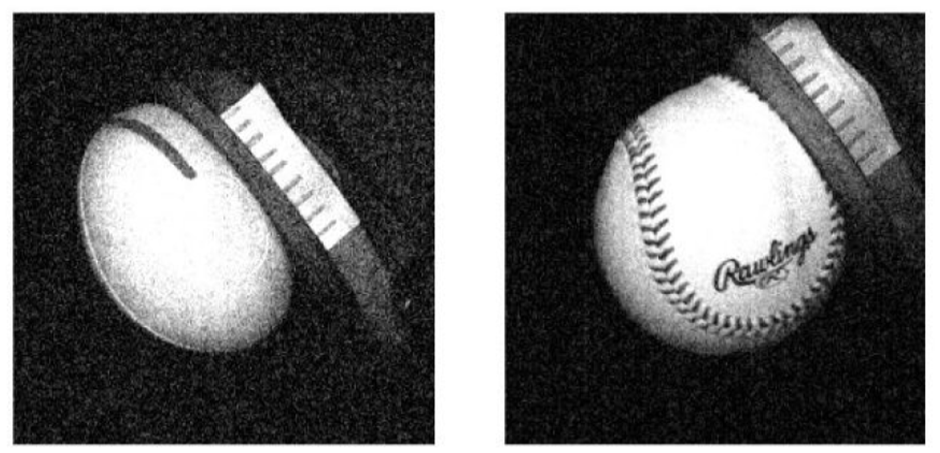
Maximum deformation of the Lacrosse ball (left) and the Baseball (right) during an oblique impact.
Applying the enhanced e to play conditions can describe its significance. Softball, which is played with balls of varying e, provides an instructive comparison. The hit speed,

where
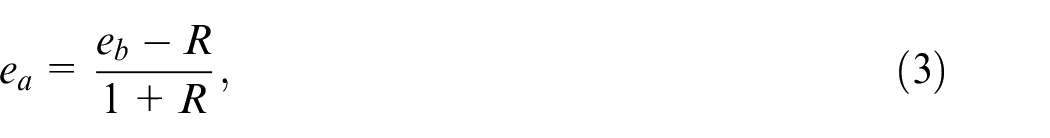
where R is calculated from,
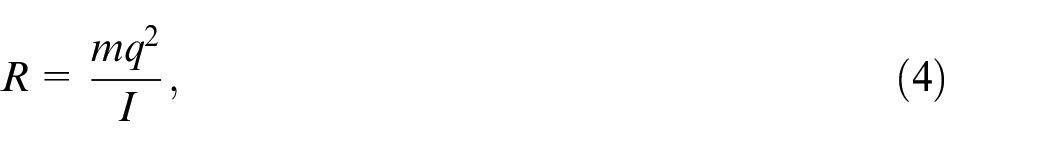
and m is the mass of the ball, q is the impact location measured from the instantaneous center of rotation, and I is the mass moment of inertia of a softball bat about the instant center. To calculate the hit speed of the ball, it is necessary to know
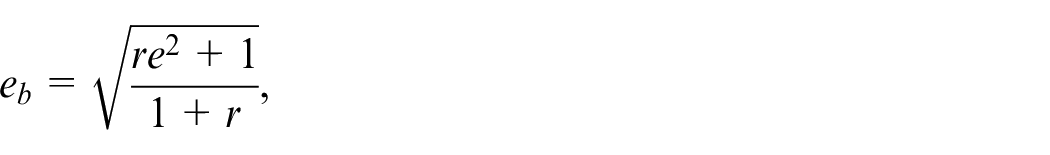
where r is calculated from the bat and ball dynamic stiffness,
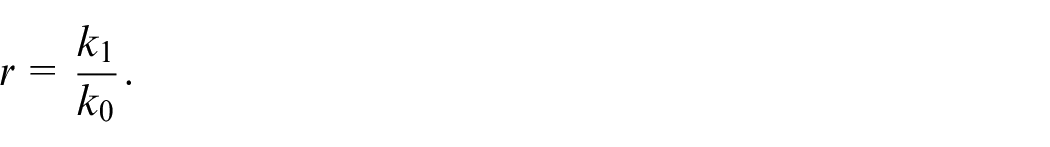
For this analysis, typical values for ball mass, impact location, and mass moment of inertia were chosen (
To compare ball trajectory, drag, and lift coefficients of
Conclusion
This work has considered e of solid sports balls at speeds representative of play for both normal and oblique impacts. It was found that, in general,
Footnotes
Declaration of conflicting interests
The author(s) declared no potential conflicts of interest with respect to the research, authorship, and/or publication of this article.
Funding
The author(s) received no financial support for the research, authorship, and/or publication of this article.