
Abstract
We construct a mathematical model to describe the application of lane conditioner (oil) onto an initially dry bowling lane via lane machines that use Kegel Sanction® Technology. The model consists of two coupled first order ordinary differential equations which describe the volume of oil on each of the brushes present in the oiling mechanism. Unknown parameters are fitted to best give certain features of the Highway to Hell oil pattern. The model, with the fitted parameters, is validated by using it to plot the Boardwalk oil pattern where certain key features are described well according to physical measurements of the actual oil pattern. The model is also shown to capture the need for the lane machine to dress two lanes before the output of oil becomes consistent.
Introduction
The sport of Tenpin Bowling is played both recreationally and competitively by millions of people around the world each year and remains the number one participation sport in the United States of America. 1 The premise of the game is simple, whereby players have two attempts to try and knock down ten pins arranged in a triangle located at the end of a long and narrow lane by rolling a bowling ball at them. However, this apparent simplicity is merely a façade and there are many fascinating intricacies that every bowler must appreciate to advance their skills and improve their score.2,3
For any bowler that plays regularly, a sound physical technique is necessary to prevent injury. Numerous studies on the physiological aspects of bowler’s physical game have been conducted4–6 and also how certain injuries can lead to hospitalisations. 7
Another aspect that plays an important role in league and tournament play is the distribution of the lane conditioner that is applied to the lane. The lane is 1.067 m (42″) wide, and is divided into 39 individual boards each of width ∼0.027 m (1.05″). The length of the lane from the foul line to the centre of the closest pin, known as the headpin, is 18.29 m (60 ft). Historically, lane conditioner, which is more commonly referred to as oil, was applied to the lane to protect the wooden lane surface from the bowling balls that roll on them. Placement of the oil on the lane was first done manually with use of a spray gun but is done today by sophisticated lane machines with great precision. This conditioning process is similar to part of the procedure of resurfacing the playing surface for sports such as curling or ice hockey, where a thin layer of water is applied to the ice after it has been cleaned. 8
Typically, most of the oil is placed towards the front and centre areas of the lane and gradually decreases until some set distance further down the lane is reached. The total volume of oil applied to a lane commonly ranges from 15 to 35 mL, resulting in a thickness of 10 µm in the axis directed perpendicularly outwards from the lane. The exact initial distribution of oil on the lane, known as the oil pattern, will influence the balls which bowlers use, how they decide to deliver them, 9 and where they decide to target on the lane to achieve the best chance of getting a strike. When rotation is imparted to the ball by the bowler on release, the ball will typically travel in a straight line whilst it is in the area of highest concentration of oil towards the front part of the lane as the low level of friction causes the ball to skid. 10 When the volume of oil between the ball and the lane decreases sufficiently, the ball will begin to move in the direction of the rotation due to the increase in friction between the ball and the lane surface, 11 resulting in an overall parabolic shape.
Equations for a sphere rolling on a surface are well known and have been rigorously studied in various sporting contexts.12–17 The case of a ball that is travelling along a horizontal plane, but rotating about an axis that is not perpendicular to the direction of travel, as is often the case in tenpin bowling, has also been studied18,19 and applied to a bowling specific setting to produce the parabolic path of the ball.15,20 Experimental work on extracting the properties of a rotating bowling ball is possible through an inertial measurement unit being placed into the bowling ball itself. 21
Typically, bowlers will look to find less oil towards the edge of the lane and more oil towards the middle of the lane in relation to their intended target line which will result in the ball hitting the headpin slightly off centreIn this situation, a ball that is rotating about an axis that is not perpendicular to the initial path of the ball on the lane will be guided to the desired part of the headpin. Indeed, if the bowler misses their target towards the gutter, the ball will begin to deviate from its initial trajectory in the direction of the rotation at an earlier distance, thus still ending up in the intended place. Likewise, a shot missed towards the centre of the lane will skid for longer due to the decrease in friction thanks to the presence of more oil, again resulting in the ball ending up in the same place at the headpin and having a good chance of getting a strike. Generally, the larger the ratio of the volume of oil between the middle part of the lane to the outside part of the lane (towards the gutters), the less accurate a bowler needs to be to get their ball to finish at the desired place at the pins. This situation is illustrated in Figure 1(a). By reducing this ratio from greater than 8:1 (i.e eight times as much oil in the middle of the lane than the outside of the lane) to say less than 4:1, one makes it harder for a bowler to strike consistently as a greater level of accuracy is required as the size of the target area that will result in the ball hitting the headpin as intended is reduced as the friction becomes more uniform across the lane as depicted in Figure 1(b).
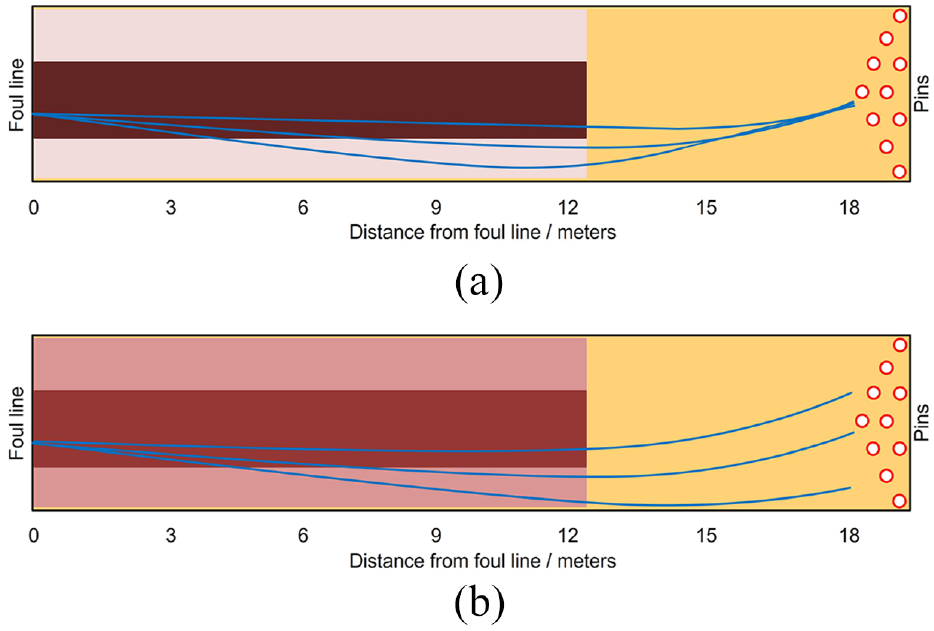
Two illustrations of different oil patterns both: 12 m (40 ft.) long, each with the same three identical initial sketched trajectories. Darker shades represent a greater volume of oil. (a) Oil pattern with a middle to outer oil volume ratio in excess of 8:1. All three trajectories finish at the same position at the pins despite their initial difference. (b) Oil pattern with a middle to outer oil volume ratio of less than 4:1. All three trajectories finish in different positions at the pins.
However, a visualisation of the oil pattern on the lane is typically only given in two-dimensional (2D) form by the means of an overhead graph (similar to those shown in Figure 1) constructed from the input data of the lane machine. A three-dimensional (3D) representation of the oil pattern which shows the height (thickness) of the oil on the lane can be formed by using a Computer Lane Monitor System. 22 With this equipment, a piece of tape 0.025 m (1″) wide is pressed into the lane parallel to the foul line across the entire width (1.067 m, 42″), adhesive side down. A second piece of tape then lifts the first piece of tape from the lane surface, trapping a print of the oil between them. The tapes are then fed into the Optical Reader which measures the ultra-violet additive that is present in lane conditioners, from which the volume of oil across that part of the lane can be calculated. This procedure was performed at the 2012 European Bowling Tour Masters in Munich and the results were reported in an article that showed how the male and female groups of bowlers played the pattern differently. 23 As tape readings were taken across the lane only at four distances from the foul line, constructing a 3D image of the 11.9 m (39 ft.) long oil pattern that was used was not possible due to the lack of measurements. However, tapes were taken at 0.305 m (1 ft.) intervals from the foul line to the end of the pattern of the original Kegel Navigation series of oil patterns and a more accurate 3D construction of the oil on the lane was produced.24,25
To the best of our knowledge, no mathematical model has been developed that is capable of simulating the application of oil to a bowling lane via the oiling mechanisms present in any of the most widely used lane machines to produce a 3D graph of the oil distribution on the lane. Such an image is important as it can be used to by coaches to help teach bowlers about oil patterns and optimum strategy to play on them. It could also be used by lane technicians when designing an oil pattern, as they would benefit from seeing how the oil is distributed on the lane to determine if the pattern is as they intended without the need for dressing a lane, using a lane monitor and taking several tape readings.
In this paper we construct a mathematical model to describe the application of oil to a lane by Kegel’s Sanction® Technology. 26 The working principals of the oiling mechanism are discussed first, before we derive the model equation and use the load data of a particular oil pattern to demonstrate how to find the distances at which each board receives a load of oil. The distances are required so that the unknown parameters in the model can be fitted in accordance with real world data. The results of the model are shown for a variety of oil patterns. Both 3D and 2D representations of the solution are given, before we give concluding remarks.
Oiling mechanism
There are three key components in the oiling mechanism studied here that result in a lane being dressed (i.e. to have an oil pattern applied to it). They are the oil head (OH), transfer brush (TB) and buffer brush (BB). The OH is mounted to a fixed rail that runs parallel to the foul line once the lane machine is placed onto a lane and ready to commence oiling as shown in Figure 2(a). It travels along the rail at a constant speed between the second board in from the gutter on the right (board 2R) and the second board in from the gutter on the left (board 2L). Oil is pumped out of the OH in a continuous stream between selected boards whilst it transits between the boards 2R and 2L. The machine can be programmed to travel down the lane at six set speeds ranging from 0.254 m/s (10″/s) to 0.762 m/s (30″/s).
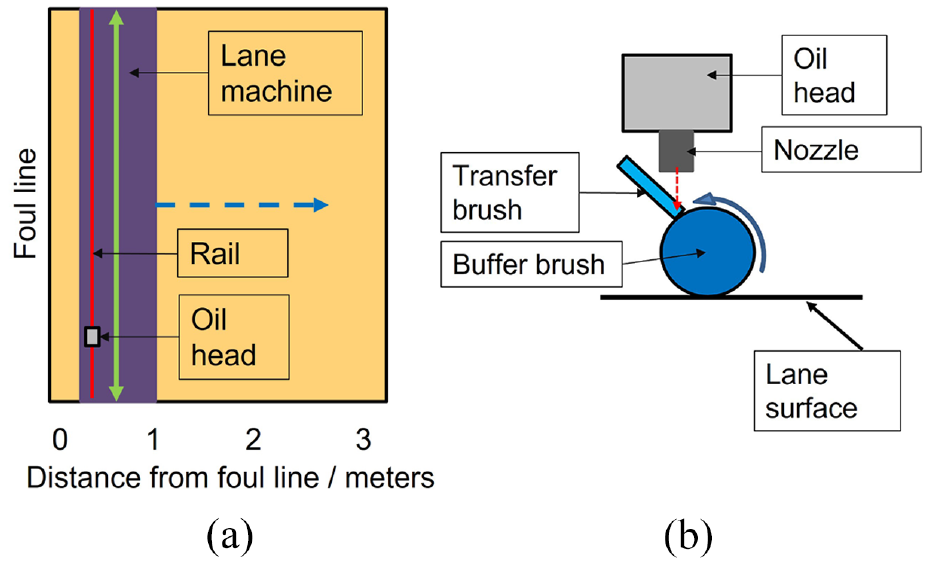
A schematic of (a) the lane machine on a bowling lane and (b) of the oiling mechanism present in the lane machine. (a) A top down view of the lane machine with the oil head which moves along the entirety of the rail as indicated by the green double headed arrow. The blue dashed arrow shows the direction of travel of the lane machine on the forward pass as it moves towards the pins. (b) A side view of the oiling mechanism that is contained inside of the lane machine. The oil is pumped out of the nozzle onto the Transfer Brush where some of it is transferred the Buffer Brush which rotates in the direction of the arrow. Oil is then applied to the lane directly from the Buffer Brush.
Oil that leaves the OH is applied directly to the TB. This brush is in contact with the BB which is cylindrical in shape and rotates at a constant angular velocity. In the current generation of Kegel lane machines, the BB can be set to rotate at various angular velocities, but this feature is omitted from the model given here. Oil is applied to the lane from the BB when it is in contact with the lane. A schematic of this operation is shown in Figure 2(b). The BB is raised from the lane when it reaches the pre-programmed distance of the pattern length on the forward pass as the machine travels from the foul line toward the pins, beyond which no oil is applied to the lane. These lane machines can also place oil onto the lane when the machine travels back to the foul line from the pins on the reverse pass. The BB is set to make contact with the lane again at a distance known as the reverse brush drop distance. Loads can then be added if the pattern designer desires. Further information regarding the theory of operation can be found in Chapter 2 of the lane machine manual. 27
Importantly, Kegel specifies in their lane machine manuals that two warm-up lanes must be dressed before the TB and BB become replenished with conditioner and return to a constant refreshed state, 27 after which the application of oil to the lane becomes consistent. These two lanes are sometimes referred to as a burn pair. In particular, it is of upmost importance to run a burn pair when oiling lanes for a league or tournament to prevent the first pair of lanes that are dressed being drier than the remaining lanes.
Model
To model the oiling mechanism described in the previous section, we treat each of the 37 boards from 2L to 2R individually and give the volumes of oil on them as functions of
Forward pass
The rate of change of the volume of oil on any part of the TB as the machine travels down-lane is equal to the volume of oil being applied to the TB minus the volume of oil leaving the TB. This rate of change of the volume of oil as a function of distance can be expressed by a simple first order differential equation
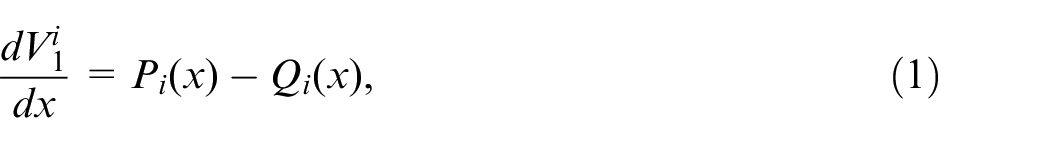
where
The small part of the TB considered by each
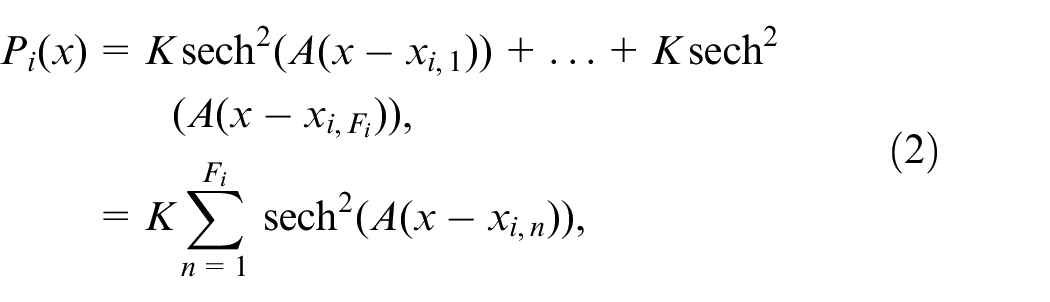
where
Oil can be removed from the TB only by the BB. Therefore, the function

where
Putting equations (2) and (3) into equation (1) gives the ODE
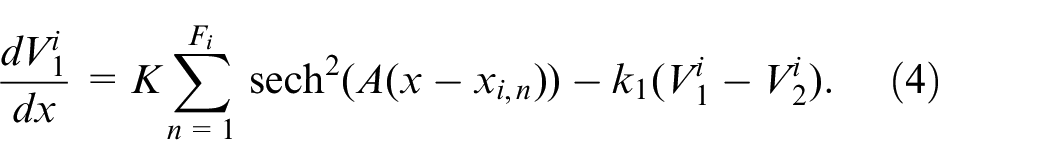
The initial condition that is necessary to solve equation (4) is constructed in two parts. First is the volume of oil on the TB at the start of oiling which we denote as

We now take the differential equation for the BB to be of the same form as for the TB in equation (1). The volume of oil that the BB receives is exactly equal to the volume of oil that the TB loses which from Eq. (4) is
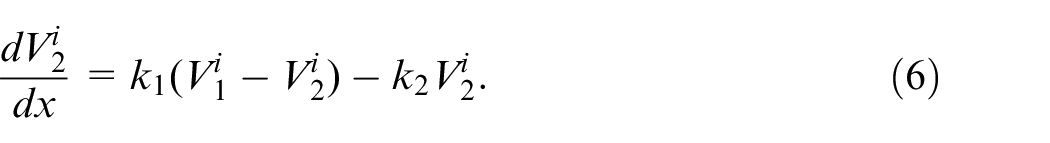
At

where

for some constant
Reverse pass
The governing equations for the volume of oil on the TB and BB whilst the machine is applying oil on the reverse pass take the same form as they do for the forward pass. The initial conditions for the brushes are simply the volumes of oil on them at the end of the forward pass. For convenience, we change the reference frame so that
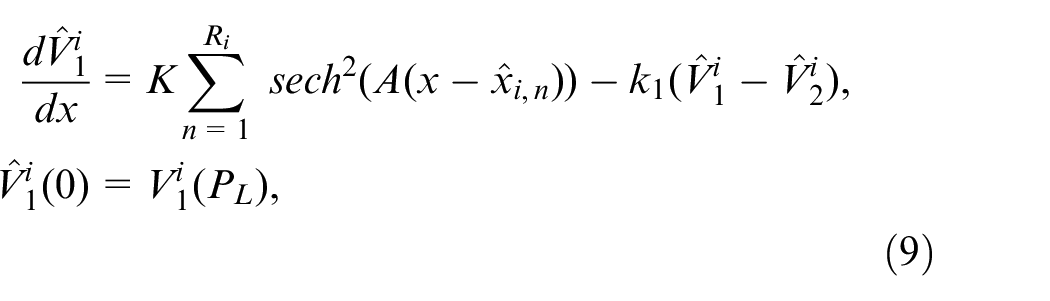
where
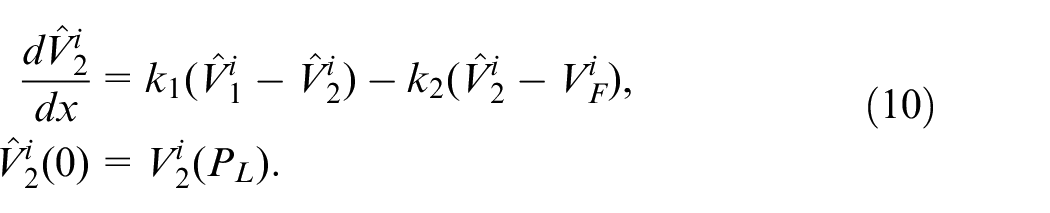
Once again, some fraction of the oil on the BB during this reverse pass will be applied to the lane on top of the oil that was placed on the lane during the forward pass, which we give as

To find the total oil applied to the lane after the forward and reverse passes we assume a simple addition of oil here giving the volume of oil on board

Load distances
To be able to use the model equations, the distances at which each board receives a load of oil from the OH must be calculated. This calculation can be done by analysing the load data.
One particular parameter that must be calculated to determine the load distances is the time that the OH takes to complete a transit from the 2R position to the 2L position (or equivalently from 2L to 2R). As previously mentioned, the OH moves at a constant speed between boards 2R and 2L on each pass. The pump switches between ON and OFF to apply oil to the relevant boards. So even if oil is being applied between boards 15R and 15L, the OH will still move from 2R to 2L (or 2L to 2R depending on where the OH is at the end of the previous load) but will only apply oil between the boards of 15R and 15L. The time taken for the OH to do a complete pass of the brush can be calculated from inspection of the load data for a given pattern. For example, consider the data in Table 1 for the Highway to Hell oil pattern. From row 2, the machine will apply one load between 7L and 7R (but recall that the OH will still move between 2R and 2L) and travel down-lane at a speed of 0.356 m/s (14″/s) between 1.798 and 2.377 m, covering a distance of 0.579 m. Using this information, the time taken for one transit of the OH can be calculated as
The load data for the forward pass of the Kegel Highway to Hell oil pattern.
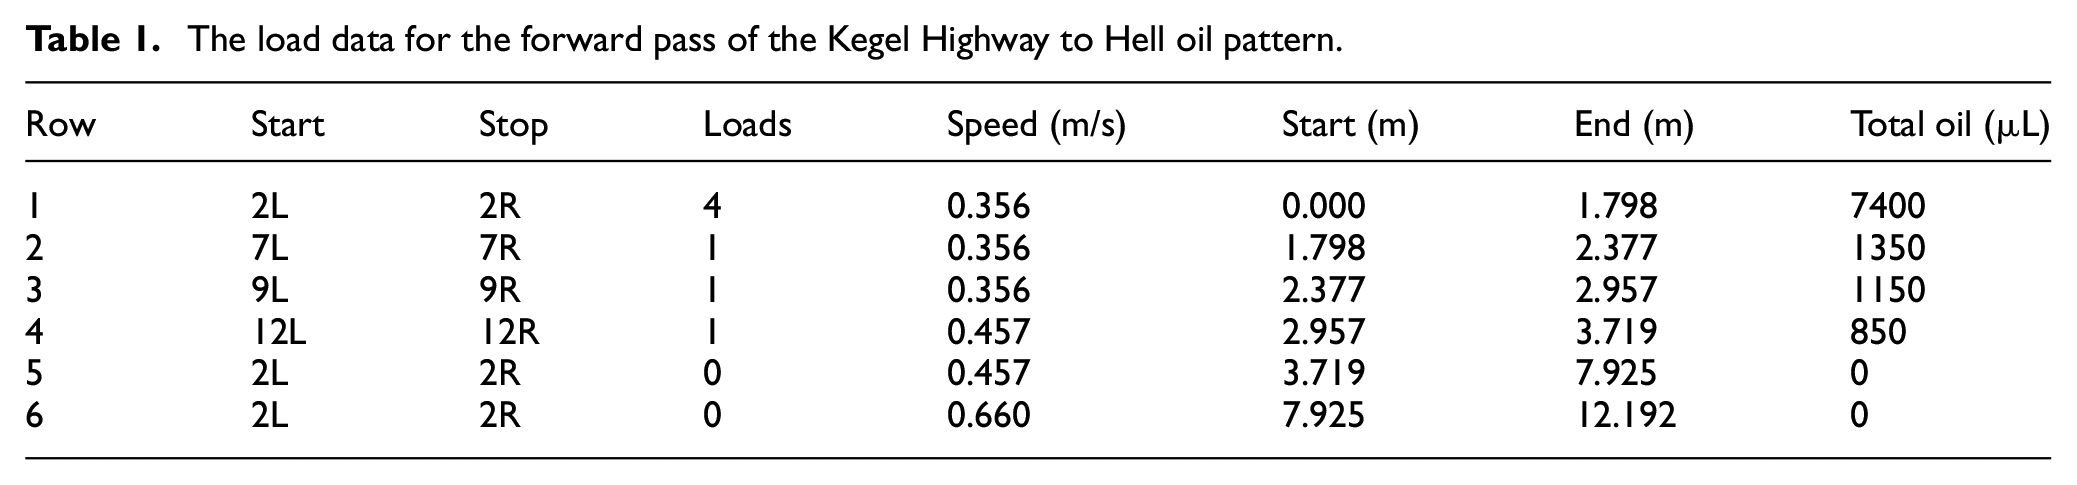
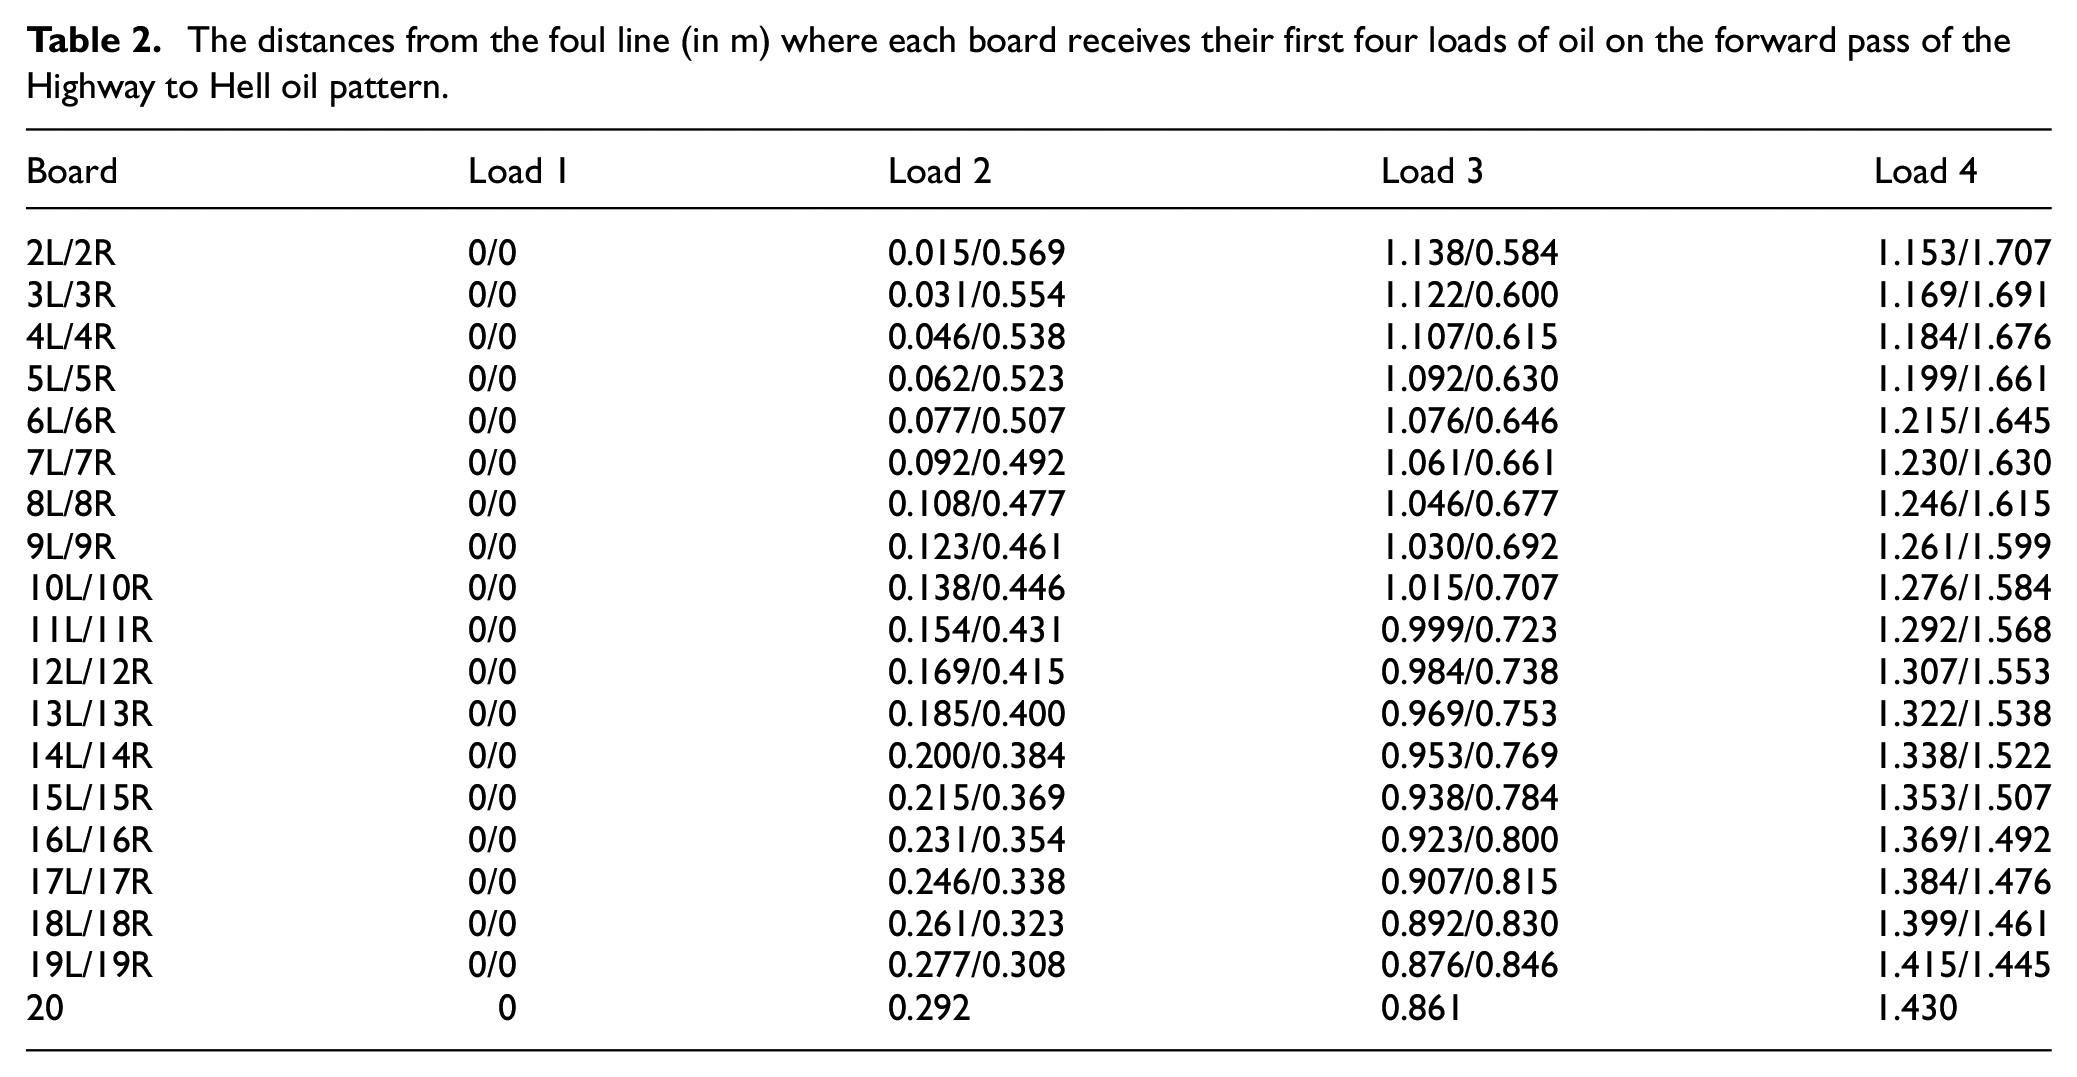
The first row of the forward load data always indicates the number of 2L to 2R loads, the first of which is completed at the foul line as the OH moves from the 2R position to the 2L position. On completion of this first load, the machine starts to move down the lane towards the pins at 0.356 m/s (14″/s) and all boards between 2L and 2R receive another load of oil as the OH moves from the 2L position to the 2R position. The distance at which the boards receive the 2nd load of oil can then be given as
The distances from the foul line (in m) where each board receives their first four loads of oil on the forward pass of the Highway to Hell oil pattern.
Parameter fitting
Before the results of the model can be viewed, there are several parameters that need to be fitted. The parameters

The area beneath this function must be equal to
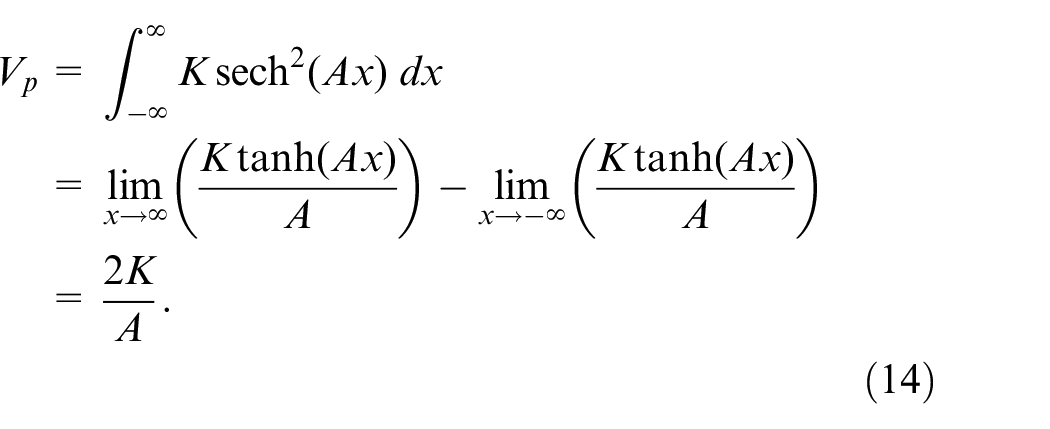
To define the width of the pulse, we take the measurement of full width at tenth maximum (FWTM) and find the points
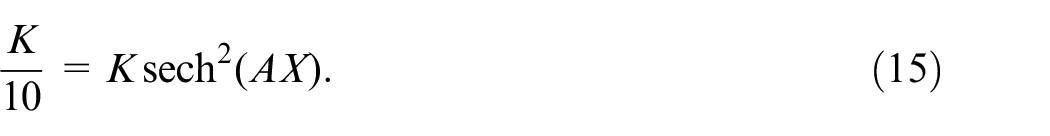
Solving equation (15) for X, there are two solutions
Without loss of generality, setting
The width of a pulse is dependent on the speed of the machine. Hence, for a given speed
which has the solution
The speeds
All speed settings of Kegel lane machines with their corresponding speeds, pulse widths and the parameters
Remaining parameters
To find the three parameters
the total volume of oil on board 2R is equal to 400 µL.
the total volume of oil on board 20 is equal to 900 µL.
the latitude ratio of the oil pattern at 6.71 m (22 ft.) is 2.3:1.
the inside taper ratio is 3.5:1.
The optimal values are


to two significant figures.
To test if these parameters are conducive to giving physically justifiable results on a different pattern, we test them on the Boardwalk Oil pattern. 25 On this pattern, the area of the TB above the boards 2R and 2L only have 50 µL of oil applied to them. Therefore, the corresponding boards on the lane must have at most 50 µL of oil applied to lane 1 of this pattern when all brushes are considered dry at the start of oiling. Hence, if the parameters found above give a model solution with the Boardwalk load data such that the volume of oil on boards 2R or 2L are greater than 50 µL, the parameters values are not applicable here. However, it turns out that there is 49 µL on these boards, which is physically appropriate and validates the model parameters equation (20).
Results
We now solve equations (4), (6), (9) and (10) with the load data corresponding to the Highway to Hell oil pattern which was the pattern used to fit the unknown parameters. The solution
The model solution of the volume of oil applied to lanes 1, 2, 3 and 10 of the Highway to Hell oil pattern. The pink and black bars in the figures in the right column correspond to the oil transferred to the lane on the forward and reverse passes, respectively. (a) Model solution – lane 1, (b) individual boards – lane 1, (c) model solution – lane 2, (d) individual boards – lane 2, (e) model solution – lane 3, (f) individual boards – lane 3, (g) model solution – lane 10 and (h) individual boards – lane 10.
In these figures, one can first see the progression of the oil pattern on the lane as it is applied to the first three lanes. The only difference between the governing equations of the lanes is in the initial conditions of the brushes given by equations (5) and (7). Indeed, for the solution of lane 2, there is the residual oil left on the brushes from the machine having dressed lane 1. In general, the solution for lane
The difference that this residual oil makes can be seen clearly by comparing Figure 3(a) to (d). Each board on lane 2 has more oil on it than it does on lane 1. Also, from the 3D representation, it can be seen that the extra oil has been added more towards the front of the pattern closer to the foul line than at the end of the pattern. The same progression happens from lane 2 to lane 3, although to a much lesser extent. Recall that the parameters were fitted by requiring that certain features of the third lane are best achieved. One can therefore see the solution of lane 3 as the optimal lane condition in accordance with the details of the oil pattern.
Remarkably, the difference between the solutions of lane 3 and lane 10 is barely noticeable, as too are all lanes between as can be seen from the details given in Table 4. This lack of any noticeable difference shows that, despite it not being a requirement in any way, the model has captured the need for a burn pair to be dressed before the output of oil onto the lane becomes consistent.
Details of the model solution of the Highway to Hell oil pattern for selected lanes with the corresponding ratios calculated from tapes of the oil pattern. 24

We now run the model with the Boardwalk load data 25 with the model parameters given in eqation (20) from the Highway to Hell fitting and see how well the model solution captures the features of the Boardwalk oil pattern. For the first lane, we again assume that all brushes are completely dry prior to commencing the oiling process. The solutions are shown in Figure 4. A similar progression can be seen in these solutions as to those in Figure 3. The most significant difference between adjacent solutions is lane 1 to lane 2, and then lane 2 to lane 3. All lanes after lane 3 are virtually identical as the data in Table 5 indicates.
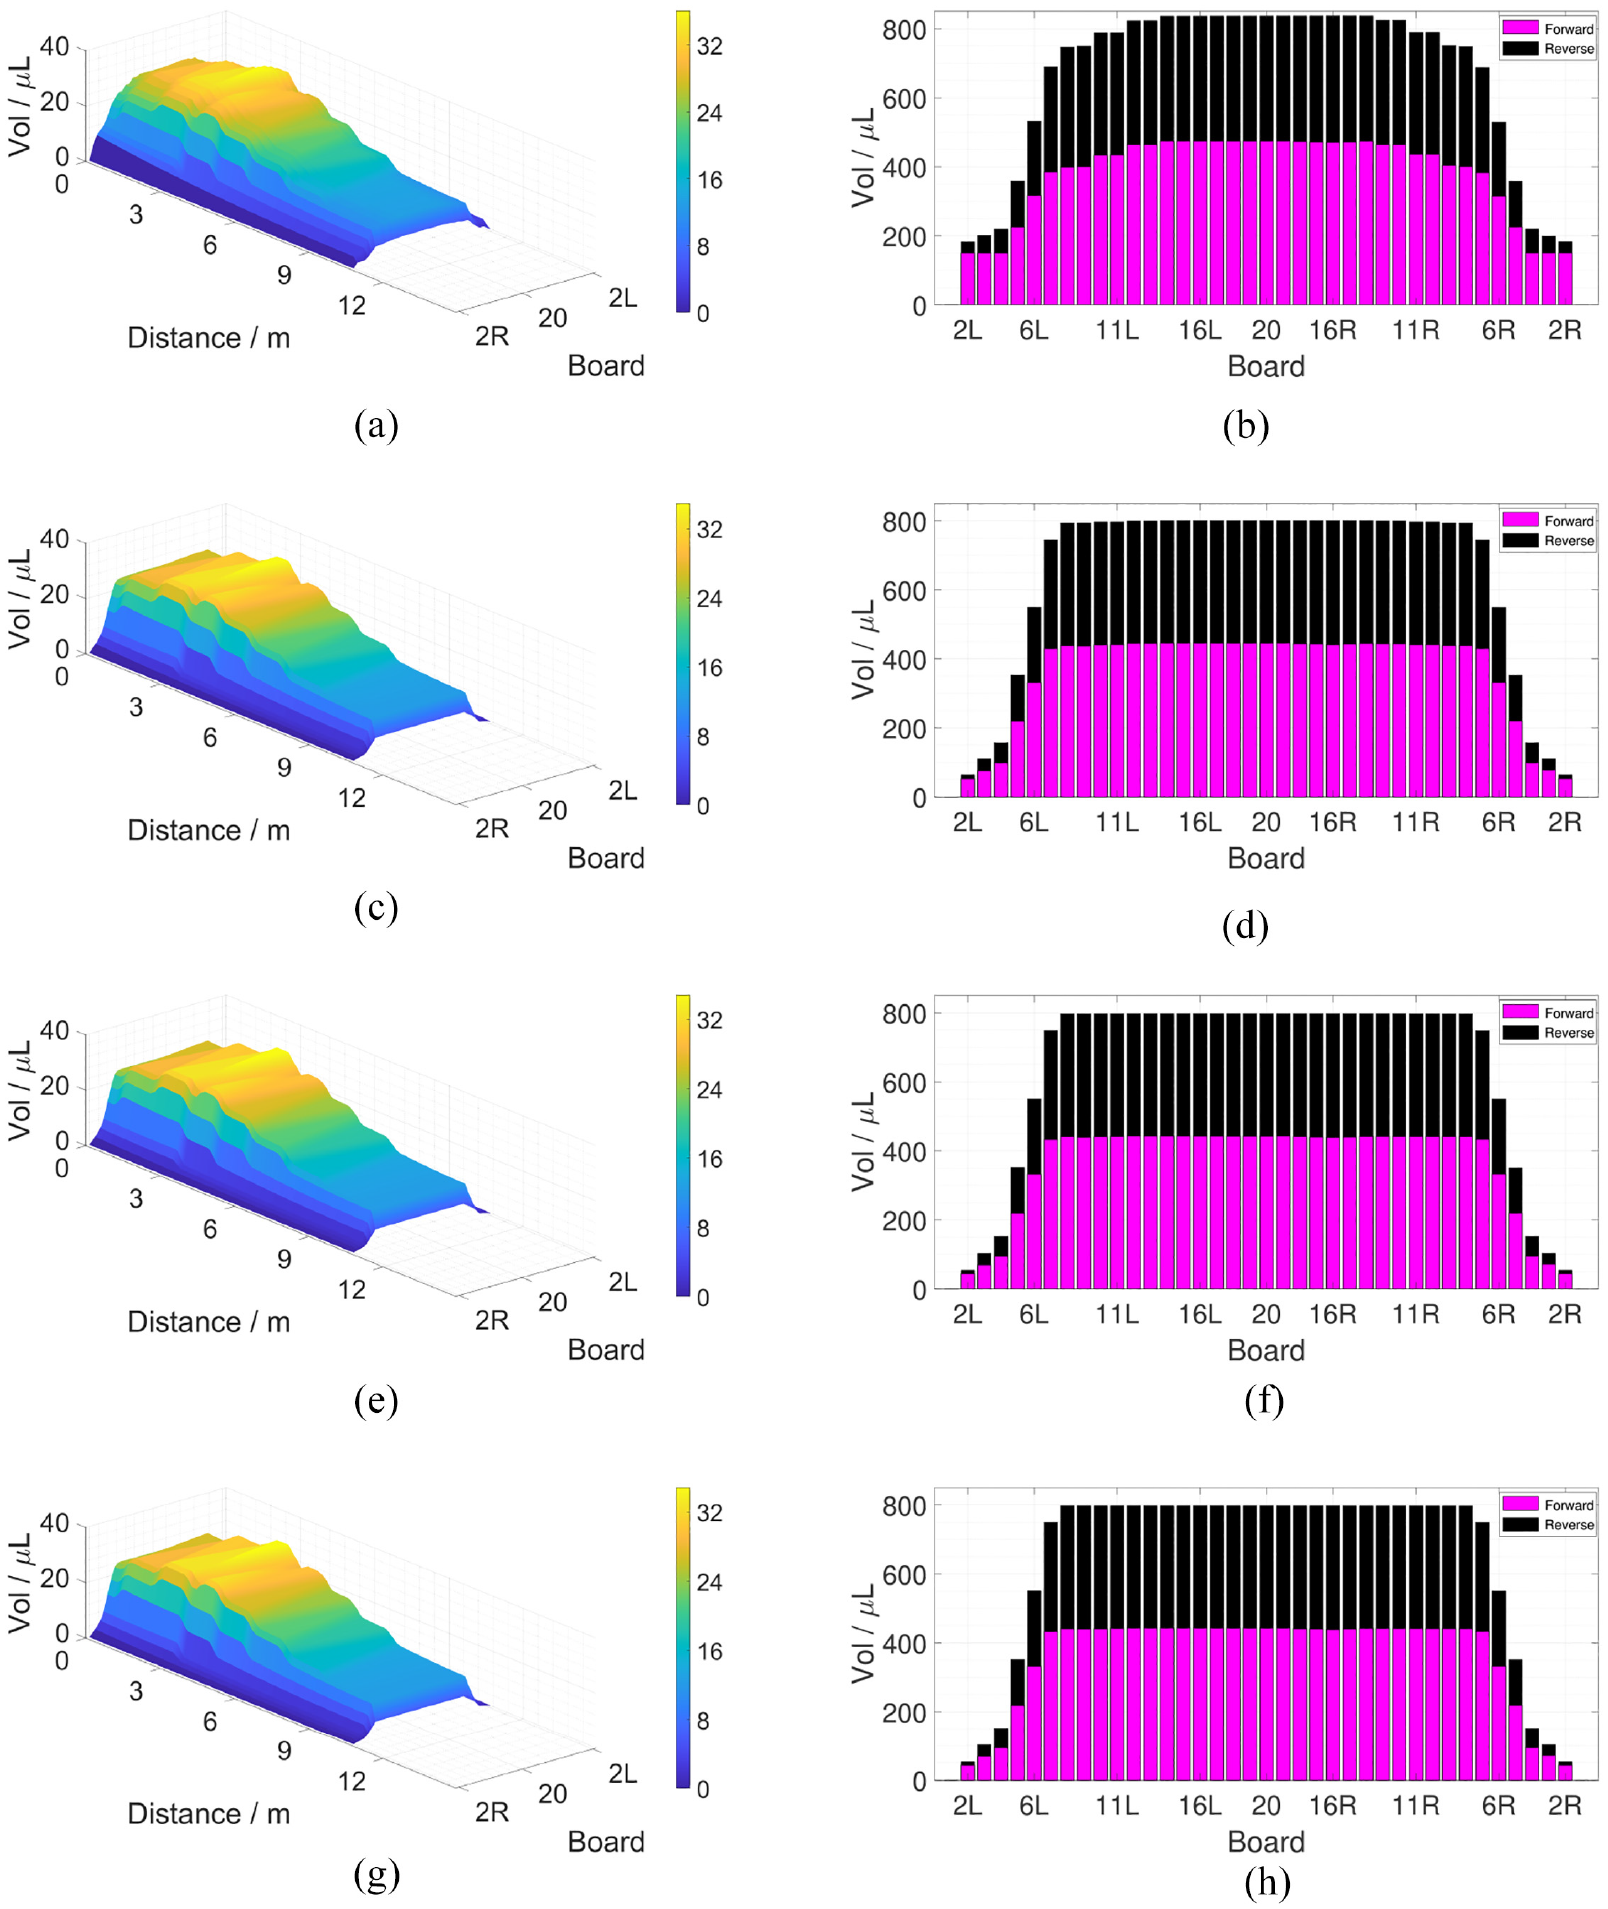
The model solution of the volume of oil applied to lanes 1, 2, 3 and 10 of the Boardwalk oil pattern. The pink and black bars in the figures in the right column correspond to the oil transferred to the lane on the forward and reverse passes, respectively. (a) Model solution – lane 1, (b) individual boards – lane 1, (c) model solution – lane 2, (d) individual boards – lane 2, (e) model solution – lane 3, (f) individual boards – lane 3, (g) model solution – lane 10 and (h) individual boards – lane 10.
Details of the model solution of the Boardwalk oil pattern for selected lanes with the corresponding ratios calculated from tapes of the oil pattern.Kegel. 25
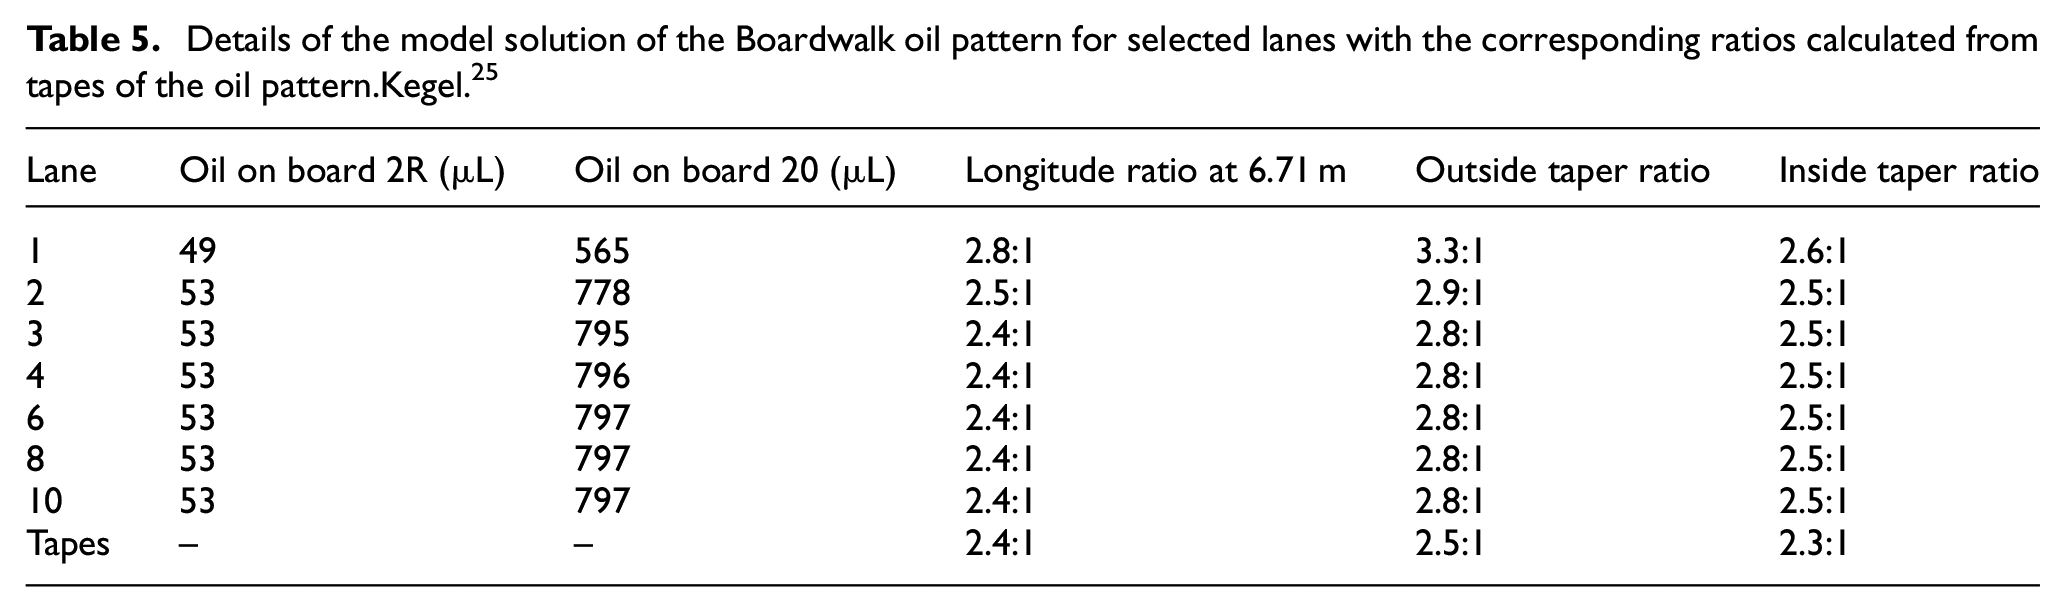
The solutions for lanes 3 and onwards also capture the true ratios of the oil pattern reasonably well and serve to provide a 3D visualisation of the distribution of oil on the lane. On comparison of, for instance, Figure 4(g) with a 3D image of Boardwalk formed of tapes taken across the lane at every foot of the pattern on a physical lane, 25 the main features are captured very well. In particular, it can be seen that the region of maximum oil occurs between approximately 7–13 ft. in both figures. The model solution also captures the subtle slope of oil around 27 ft. before the relatively flat region that ensues up to the end of the pattern.
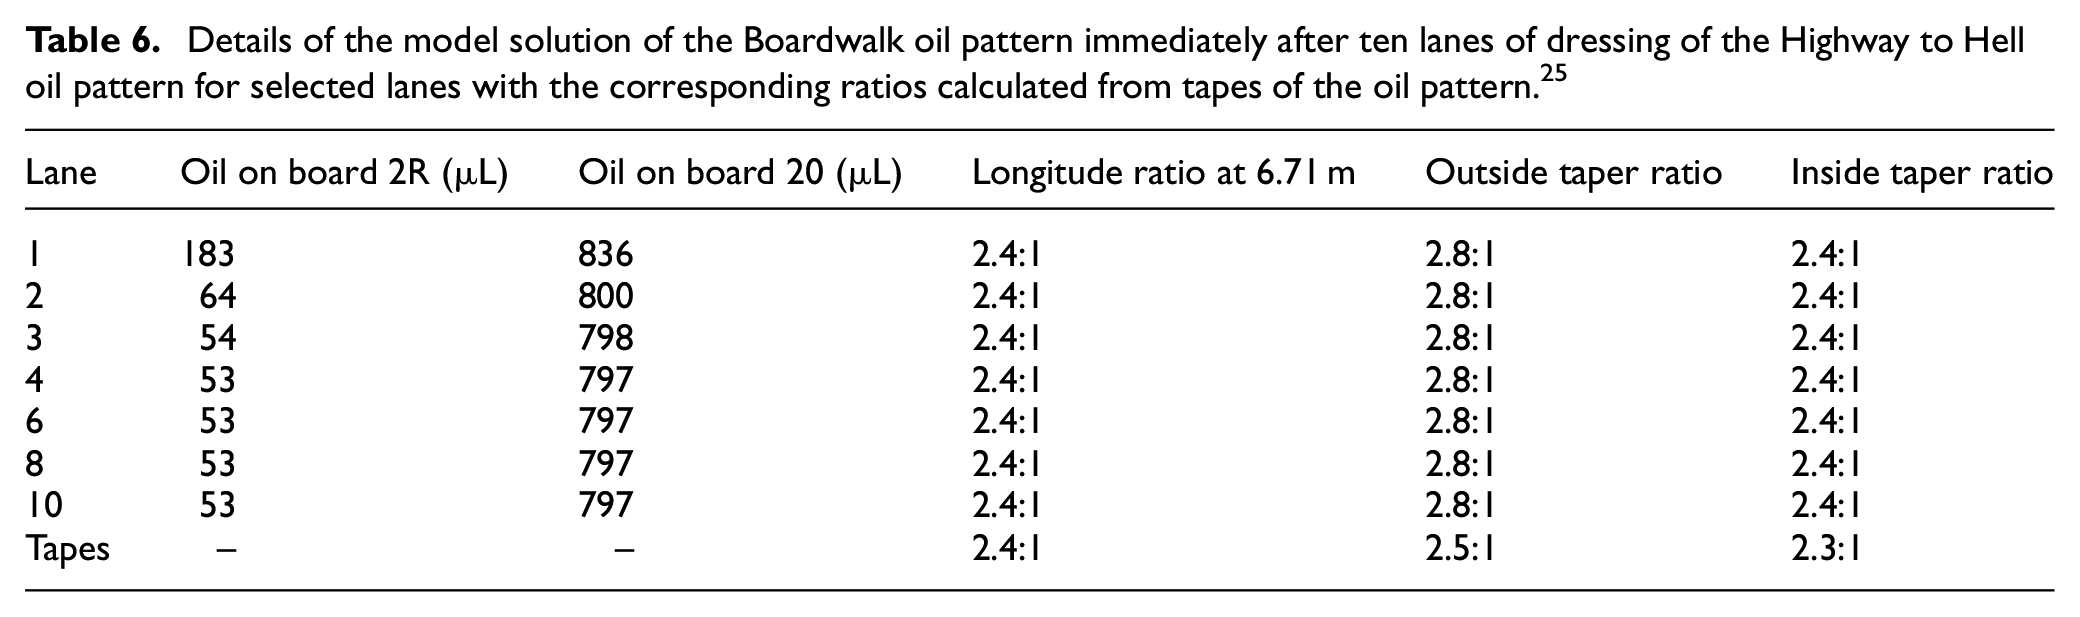
As a final test, we simulate a pattern change from Highway to Hell to Boardwalk. To do this simulation, we run the model for 10 lanes of Highway to Hell to get the true imprint of the pattern on the brushes to yield a consistent solution, and then take the oil on the brushes after the 10th lane and use them in the initial condition for the 11th lane but input the load data for Boardwalk instead. Here, the 11th lane is referred to as lane 1 to correspond to the first lane where the model has given a solution with the Boardwalk load data.
From the solutions shown in Figure 5 and further details in Table 6, one can see that the pattern once again becomes consistent after three lanes have been dressed. As each board has more oil applied in the Highway to Hell pattern, the brushes have more oil than required for the Boardwalk pattern. The effect of this can be seen in Figure 5(a) and (b) as there is far too much oil on lane 1 than intended for the Boardwalk oil pattern. Lane 2 is drier and lane 3 drier still, but the lanes dressed after lane 3 are all virtually identical to lane 3 and onwards. Recall that this progression was the case previously, where the model used to simulate the Boardwalk pattern being dressed on consecutive lanes with dry brushes prior to lane 1 being dressed. There is a transition period of two lanes before the true Boardwalk pattern is applied onto every subsequent lane. This result highlights the need for a burn pair not only for when the brushes are dry at the start of oiling, but when an oil pattern change occurs.
The model solution of the volume of oil applied to lanes 1, 2, 3 and 10 of the Boardwalk oil pattern immediately after 10 lanes of Highway to Hell have been dressed. The pink and black bars in the figures in the right column correspond to the oil transferred to the lane on the forward and reverse passes respectively. (a) Model solution – lane 1, (b) individual boards – lane 1, (c) model solution – lane 2, (d) individual boards – lane 2, (e) model solution – lane 3, (f) individual boards – lane 3, (g) model solution – lane 10 and (h) individual boards – lane 10.
Details of the model solution of the Boardwalk oil pattern immediately after ten lanes of dressing of the Highway to Hell oil pattern for selected lanes with the corresponding ratios calculated from tapes of the oil pattern. 25
Conclusion
We have constructed a mathematical model consisting of two coupled first-order ordinary differential equations to describe the application of oil to a bowling lane by the Kegel Sanction® Technology oiling system. The two differential equations are for the volume of oil on the transfer brush and buffer brush, respectively, and are coupled due to the transfer of oil between them. The initial conditions take into account the oil present on the brushes before a lane is dressed which is present from the dressing of previous lanes. Unknown parameters in the model were fitted in accordance with data from the Highway to Hell oil pattern. With those parameters, we found that the model was able to describe the oil distribution of a different pattern accurately, as the ratios of the Boardwalk oil pattern were captured reasonably well when the model was solved with the relevant load data. The 3D representation of the solution was found to be very similar to the 3D graph constructed from taking tapes of the actual oil pattern when it was applied to a real lane.
It turns out that, despite not having any requirements to dress two warm-up lanes, the model is able to capture this important physical feature. When starting from completely dry brushes on lane 1, the model gives a stable and consistent solution for lane 3 and onward for both the Highway to Hell and Boardwalk oil patterns. This stable and consistent solution is also the case when the pattern is changed from Highway to Hell to Boardwalk which has a lower overall volume of oil.
The presented model assumes that the lane is completely dry before oil is applied to it. Physically, this corresponds to the cleaning mechanism of the lane machine working perfectly. This model does not take into account some features that are present in the latest generation of Kegel lane machines, such as variable angular velocity of the buffer brush as well as a changing oil head volume output. With that said, for a suitable set of parameters, the model can be used as a tool to visualise the distribution of oil on a lane which could help bowlers, coaches and lane technicians alike. The ability to view an accurate graph of an oil pattern on a lane without having to take any physical measurements will allow for patterns to be designed in a cost effective and efficient manner, which can save the industry time and money. A deep understanding of the parameters that influence a ball rolling on a surface with inhomogeneous friction levels can also be achieved from this model with complimentary experimental data. There are also possible applications in the maintenance of ice rinks, which could influence sports such as ice hockey and curling.
Footnotes
Acknowledgements
The author would like to thank Kegel for their support of this work. Also to Mr Raymond Teece of Stringing Strikes Services and RST Coaching for sharing his expert technical knowledge during many useful discussions, as well as his continued encouragement. Finally, to Mr Rob Thurlby for explaining the working principals of the lane monitor to me.
Declaration of conflicting interests
The author declared no potential conflicts of interest with respect to the research, authorship, and/or publication of this article.
Funding
The author received no financial support for the research, authorship, and/or publication of this article.