
Abstract
The purpose of this study was to examine the reliability of load-velocity profiles (LVPs) and validity of 1-repetition maximum (1-RM) prediction methods in the back-squat using the novel Vitruve linear position transducer (LPT). Twenty-five men completed a back-squat 1-RM assessment followed by 2 LVP trials using five incremental loads (20%–40%–60%–80%–90% 1-RM). Mean propulsive velocity (MPV), mean velocity (MV) and peak velocity (PV) were measured via a (LPT). Linear and polynomial regression models were applied to the data. The reliability and validity criteria were defined a priori as intraclass correlation coefficient (ICC) or Pearson correlation coefficient (r) > 0.70, coefficient of variation (CV) ≤10%, and effect size (ES) <0.60. Bland-Altman analysis and heteroscedasticity of errors (r2) were also assessed. The main findings indicated MPV, MV and PV were reliable across 20%–90% 1-RM (CV < 8.8%). The secondary findings inferred all prediction models had acceptable reliability (CV < 8.0%). While the MPV linear and MV linear models demonstrated the best estimation of 1-RM (CV < 5.9%), all prediction models displayed unacceptable validity and a tendency to overestimate or underestimate 1-RM. Mean systematic bias (−7.29 to 2.83 kg) was detected for all prediction models, along with little to no heteroscedasticity of errors for linear (r2 < 0.04) and polynomial models (r2 < 0.08). Furthermore, all 1-RM estimations were significantly different from each other (p < 0.03). Concludingly, MPV, MV and PV can provide reliable LVPs and repeatable 1-RM predictions. However, prediction methods may not be sensitive enough to replace direct assessment of 1-RM. Polynomial regression is not suitable for 1-RM prediction.
Keywords
Introduction
Ongoing collaboration between coaches, engineers and scientists has brought about a multitude of technology that aids athletes in training and preparation for the demands of competition. 1 The ability to objectively quantify, monitor and analyse resistance training variables is an essential component for practitioners aiming to maximise adaptations. 2 One of the most important variables for programme design is training volume as it influences neural and morphological adaptations.3,4 Velocity-based training (VBT) uses velocity to inform or enhance training practice, 5 and has received considerable interest in recent years for the regulation of training volume.6,7 VBT utilises the well-established inverse linear relationship between relative load and movement velocity to produce a load-velocity profile (LVP) which provides insights into an individual’s current physiological status.8–10 Applications of VBT include the provision of feedback during resistance training,11–14 autoregulatory prescriptive methods,15,16 fatigue monitoring 17 and prediction of 1-repetition maximum (1-RM) from submaximal loads.18,19 The successful implementation of VBT relies on instruments which are reliable and valid. 20 While it is widely accepted that linear position transducers (LPTs) outperform other technologies including accelerometers and optic laser devices,21–29 the price of an LPT presents a barrier of entry for practitioners. 30
Cost concerns may be alleviated by the Vitruve (previously Speed4Lifts), which is the cheapest commercially available LPT. Real-time feedback is provided via a digital display on the device and a smartphone application, the latter of which also generates a wider range of features including load summary reports. When compared to six other devices, the Vitruve displayed the highest validity (r2 = 0.95–0.96) and the lowest levels of variability (coefficient of variation [CV] = 2.61%) during the Smith machine bench press exercise. 31 Very high intra-device reliability for the Vitruve was also found during Smith machine back-squat exercise. 32 However, previous studies’ reliance on untrained participants and Smith machine modalities limit the transferability of findings to strength-trained populations.31,32 This is because stronger participants exhibit different LVPs due to an increased capacity to overcome the sticking region associated with heavy loads at a lower concentric velocity. 33
The Vitruve can also be distinguished from other LPTs for its ability to calculate all three commonly used variables: mean propulsive velocity (MPV), mean velocity (MV) and peak velocity (PV). MPV is the average velocity from the start of the concentric phase until acceleration is less than gravity (−9.81 m·s−2),10,34 whereas MV is the average velocity across the entire concentric phase. 35 PV is the highest recorded velocity attained from the concentric phase. 36 MPV accounts for the breaking phase of the movement, whereas MV does not. Historically, MV has been the most commonly reported variable on a number of devices, 5 and has featured in considerably more research as a result. 37 Nonetheless, while both MPV and MV have been used to generate LVPs of nonaerial movements, inconsistent findings have made it unclear which measure is best for training prescription.38,39 This inconsistency may be associated with variations in research methodologies in relation to sample size and strength ability, exercise type and statistical approaches. Hence, a comprehensive comparison of these velocity measures would help coaches to understand and monitor the performance potential of their athletes.
Research has not examined the test-retest reliability of velocity measures from the Vitruve during free-weight exercise. The back-squat is a closed kinetic chain exercise often used by practitioners to enable the transfer of strength adaptations into athletic performance. 40 Unlike Smith machine modalities, the back-squat can involve greater horizontal movement of the barbell which is known to affect velocity measures calculated by LPTs. 41 Therefore, the findings from Smith machine investigations of the Vitruve should not be used to infer the LPTs reliability during free-weight exercise. While a plethora of studies have investigated the reliability of LPTs during lower body free-weight exercises,42–44 the reliability of the Vitruve during back-squat exercise is not known. Given the Vitruve’s substantially lower retail value, this is worthy of further investigation.
Movement velocity has received increasing attention as an alternative approach for assessing an individual’s 1-RM strength ability. 10 This is because the 1-RM assessment presents numerous challenges. Primarily, maximal strength is known to change within short time frames, 45 but frequent testing can take valuable time away from training and induce unwanted fatigue which heightens the risk of injury. The explanatory mechanisms of injury stem from a breakdown of technique at the sticking point of the movement. 46 Considering that biomechanical principles, injury mechanisms and human tolerance are central to the design of sports technology, 47 any potential improvements to the precision of 1-RM predictions should be of importance to engineers.
To date, lower body Smith machine protocols have generated accurate predictions of 1-RM (R2 = 0.94–0.96) using submaximal loads during full-depth squat exercise.8,48 However, Banyard et al. 38 found back-squat 1-RM predictions were not only different to measured 1-RM (effect size [ES] = 0.71–1.04), but all 1-RM prediction equations were different from each other. This result was attributed to high between-session variability of the velocity used to predict 1-RM. Subsequently, the authors suggested the validity of back-squat 1-RM predictions could be improved using MPV or second order polynomial regression. Interestingly, recent research reported no differences between back-squat LVPs derived from linear or nonlinear regression using MPV, MV and PV.49,50 Furthermore, Thompson et al. 50 found individualised back-squat LVPs for MV (r = 0.98–0.99) and PV (r = 0.98–0.99) were stable and displayed improved goodness of fit when using nonlinear regression. However, neither Banyard et al. 49 nor Thompson et al. 50 published any data relating to 1-RM prediction. This may be attributed to the added complexity of applying nonlinear regression fits outside of dedicated software platforms. 49 Collectively, while the usefulness of different regression models and velocity measures have previously been examined, their precision in estimating back-squat 1-RM has not been compared within the same study. Further examination would also be useful for engineers. For instance, in the event polynomial models are shown to be more accurate than their linear counterparts, this could guide future innovations to software development which may enhance the efficiency of training programmes.
The primary objective of this study was to investigate the reliability of MPV, MV and PV to develop LVPs using the Vitruve LPT during back-squat exercise. The secondary aim of this study was to determine the reliability and validity of 1-RM back-squat predictions derived from MPV, MV and PV using linear and polynomial regression. It was hypothesised that (1) all velocity measures would display acceptable reliability, (2) all estimations of 1-RM would be reliable and (3) all estimations of 1-RM would be different to 1-RM.
Materials and methods
Subjects
Twenty-five strength-trained males (mean ± SD; age = 25.2 ± 2.8 years; body mass = 91.2 ± 14.0 kg; stature = 180.0 ± 9.7 cm; back-squat = 1-RM 178.0 ± 28.0 kg; relative 1-RM = 2.0 ± 0.4 x/body mass) were recruited for this study. All subjects had at least 4 years’ experience of resistance training and trained approximately 8.6 ± 2.5 h per week. A-priori sample size estimation was calculated using G*Power software (Version 3.1.9.3). 51 Twenty-four subjects were needed to identify differences between two dependant means using a Cohen dz of 0.59,38,49 a two-sided α level of 0.05, and 1–β of 0.80. Informed consent was provided prior to data collection with ethical approval granted by the St Mary’s University, Twickenham’s ethics committee in accordance with the seventh revision of the Declaration of Helsinki (2013). All sessions were performed at a similar time of day (±1 h) and were separated by 48-72 h. Subjects were instructed to refrain from strenuous exercise, and to avoid alcohol and caffeine consumption within 24 and 12 h of testing respectively.
Design
A repeated-measures within-subject design was used. Each participant’s back-squat 1-RM was assessed, followed by 2 LVP trials utilising incremental loads. The 1-RM assessment provided accurate relative loads in the subsequent sessions.
Maximum strength assessment
All sessions were initiated with a standardised warm-up protocol. The warm-up consisted of 5 min cycling at 60 RPM and 60 W using an air-braked cycle ergometer (Wattbike Pro, Wattbike Ltd, Nottingham, UK) followed by 5 mobility exercises and 10 repetitions with an unloaded barbell. All repetitions were performed using a squat stand, calibrated 20 kg barbell, and bumper plates (Eleiko®, Halmstad, Sweden). Back-squat 1-RM was assessed via an established protocol, as used previously.42,43 Participants completed five repetitions at 50% 1-RM, three repetitions at 70% and 80% 1-RM, and one repetition at 90% 1-RM. A maximum of five 1-RM attempts were allowed, with loads increasing by 1–10 kg between attempts. Rest periods were 3 min between warm-up sets and up to 5 min between 1-RM attempts. Adequate squat depth was confirmed by video capture and a strength and conditioning coach with more than 5 years’ experience. Participants were also familiarised with the performance of light loads with maximal intent. 50
Load-velocity profile assessment
Sessions 2 and 3 assessed each participant’s individual LVP. Participants performed 3 repetitions at 20%, 40%, 60% and 80% 1-RM and two repetitions at 90% 1-RM. These intensity zones were chosen based on their high reliability to predict 1-RM using MPV. 49 Up to 3 min rest was provided between sets. All relative loads were rounded up to the nearest 1 kg. Participants were instructed to control the eccentric portion of the back-squat at a self-selected pace until full knee flexion was achieved, followed by execution of the concentric portion with maximal intent until full hip and knee extension was achieved. 38 Participants were told to keep their feet in contact with the ground and to apply constant downward pressure on the barbell onto the superior aspect of the trapezius muscle.30,49 Visual feedback of velocity scores and verbal encouragement were provided throughout. Adequate squat depth was retrospectively confirmed using validated motion-capture software (Coach’s Eye, TechSmith Corporation, USA, version 6.5.3.0)52,53 via a smartphone camera system (iPhone 11, version iOS 14.4.2; Apple, Cupertino, CA) which captured video footage at 60 fps and 1080p. The smartphone was rigged onto a tripod set at a height of 62 cm (floor to camera) and distance of 250 cm (camera to centre of lifting area) in the sagittal plane. The setup was identical for all trials. Only repetitions with the highest mean concentric velocity outputs were analysed.
Individualised LVPs were constructed for each participant using least squares regression. Relative load was plotted as the independent variable, and velocity measures as the dependent variable. Both linear and polynomial lines were fitted to the data. Post hoc analysis was undertaken to predict 1-RM from these LVPs using the minimum velocity threshold (MVT) method. The MVT for each individual was established using the velocity from the final successful 1-RM attempt (1RMMVT). This method was employed due to its greater reliability of indicating general performance potential when compared to alternate 1-RM prediction methods. 54
Data acquisition
The Vitruve (Vitruve encoder; Madrid, Spain) was used to measure MPV, MV and PV. The unit was placed on the floor with a Velcro attachment strapped around the inside of the barbell’s right-hand collar. All data was captured at a sampling rate of 100 Hz through Bluetooth connection to a third-generation iPad tablet (iPad; Apple Inc, Cupertino, CA) using the Vitruve teams (version 1.11.2) application. The Vitruve recorded displacement-time-curve data by determining changes in the barbell position. Barbell acceleration was then obtained from double-differentiation of the displacement-time curve. MPV was calculated using average velocity data during the concentric phase until acceleration was less than gravity (−9.82 m·s−2). Whereas MV was calculated using average velocity data from the entire concentric phase. Finally, PV was determined as the maximum value in the same concentric period.
Statistical analyses
All measures were tested for normality using the Shapiro–Wilk test at an α level of 0.05. All data are presented as mean and SD unless stated otherwise. The confidence intervals (CI) for all analyses were set at 95%. Test re-test reliability of outcome measures from the LPT and 1-RM predictions were assessed at each relative intensity against the magnitude of the intraclass correlation coefficient (ICC3,1), CV and ES. The strength of the correlations were determined using the following criteria: trivial (0.00–0.09), small (0.10–0.29), moderate (0.30–0.49), large (0.50–0.69), very large (0.70–0.89) or nearly perfect (0.90–1.0). 55 The magnitude of the CV were categorised as poor (>10%), moderate (5%–10%), or good (<5%). 55 The magnitude of the ES were considered trivial (<0.19), small (0.2–0.59), moderate (0.60–1.19), large (1.20–1.99), or very large (>2.0). 55 This study considered the variables highly reliable if they met the following 3 criteria: very large correlation (>0.70), moderate CV (≤10%), and a small ES (<0.60).38,49 The smallest detectable difference (SDD) was determined using the formula 56 :

Where SEM is the standard error of the measurement, which was also calculated.
The relationship between relative load and velocity were examined in GraphPad Prism (GraphPad Software, San Diego, CA, USA, version 9.1.0). A one-tailed runs test was performed on all regression models to detect the presence of autocorrelation. The goodness of fit of the load-velocity relationships were assessed using the coefficient of determination (r2) and the standard error of the estimate (SEE). The validity of the 1-RM prediction methods in relation to measured 1-RM were assessed using Bland-Altman analysis (systematic bias and 95% limits of agreement [LOA]), heteroscedasticity of errors (r2), the Pearson correlation coefficient (r), CV, ES and SEE. The threshold for acceptable validity required low heteroscedasticity of errors (r2 < 0.10), 57 a very large correlation (>0.70), moderate CV (≤10%) and a small ES (<0.60).30,38 Correlations between 1-RM predictions and measured 1-RM were compared using the Fisher r to z-transformation and a 1-tailed Meng’s z-test. 58 Finally, comparisons for reliability and validity were assessed for all measures using a two-tailed paired samples t test with Bonferroni corrections and type 1 error rate set at α < 0.05. The test re-test reliability and validity analysis were performed via a custom spreadsheet. 59 All other analyses were performed on SPSS (version 27.0: SPSS Inc, Chicago, IL).
Results
Results from the Shapiro–Wilk test confirmed all measures were normally distributed (p > 0.05). Group mean peak knee flexion (20% = 131.0 ± 7.3°; 40% = 131.2° ± 8.4°; 60% = 131.3° ± 8.6°; 80% = 131.3° ± 9.4°; 90% = 131.4° ± 9.9°;) are as reported. The group mean 1-RMMVT were as follows: MPV = 0.28 ± 0.05 m·s−1; MV = 0.26 ± 0.05 m·s−1; PV = 0.74 ± 0.13 m·s−1.
Reliability of outcome measures
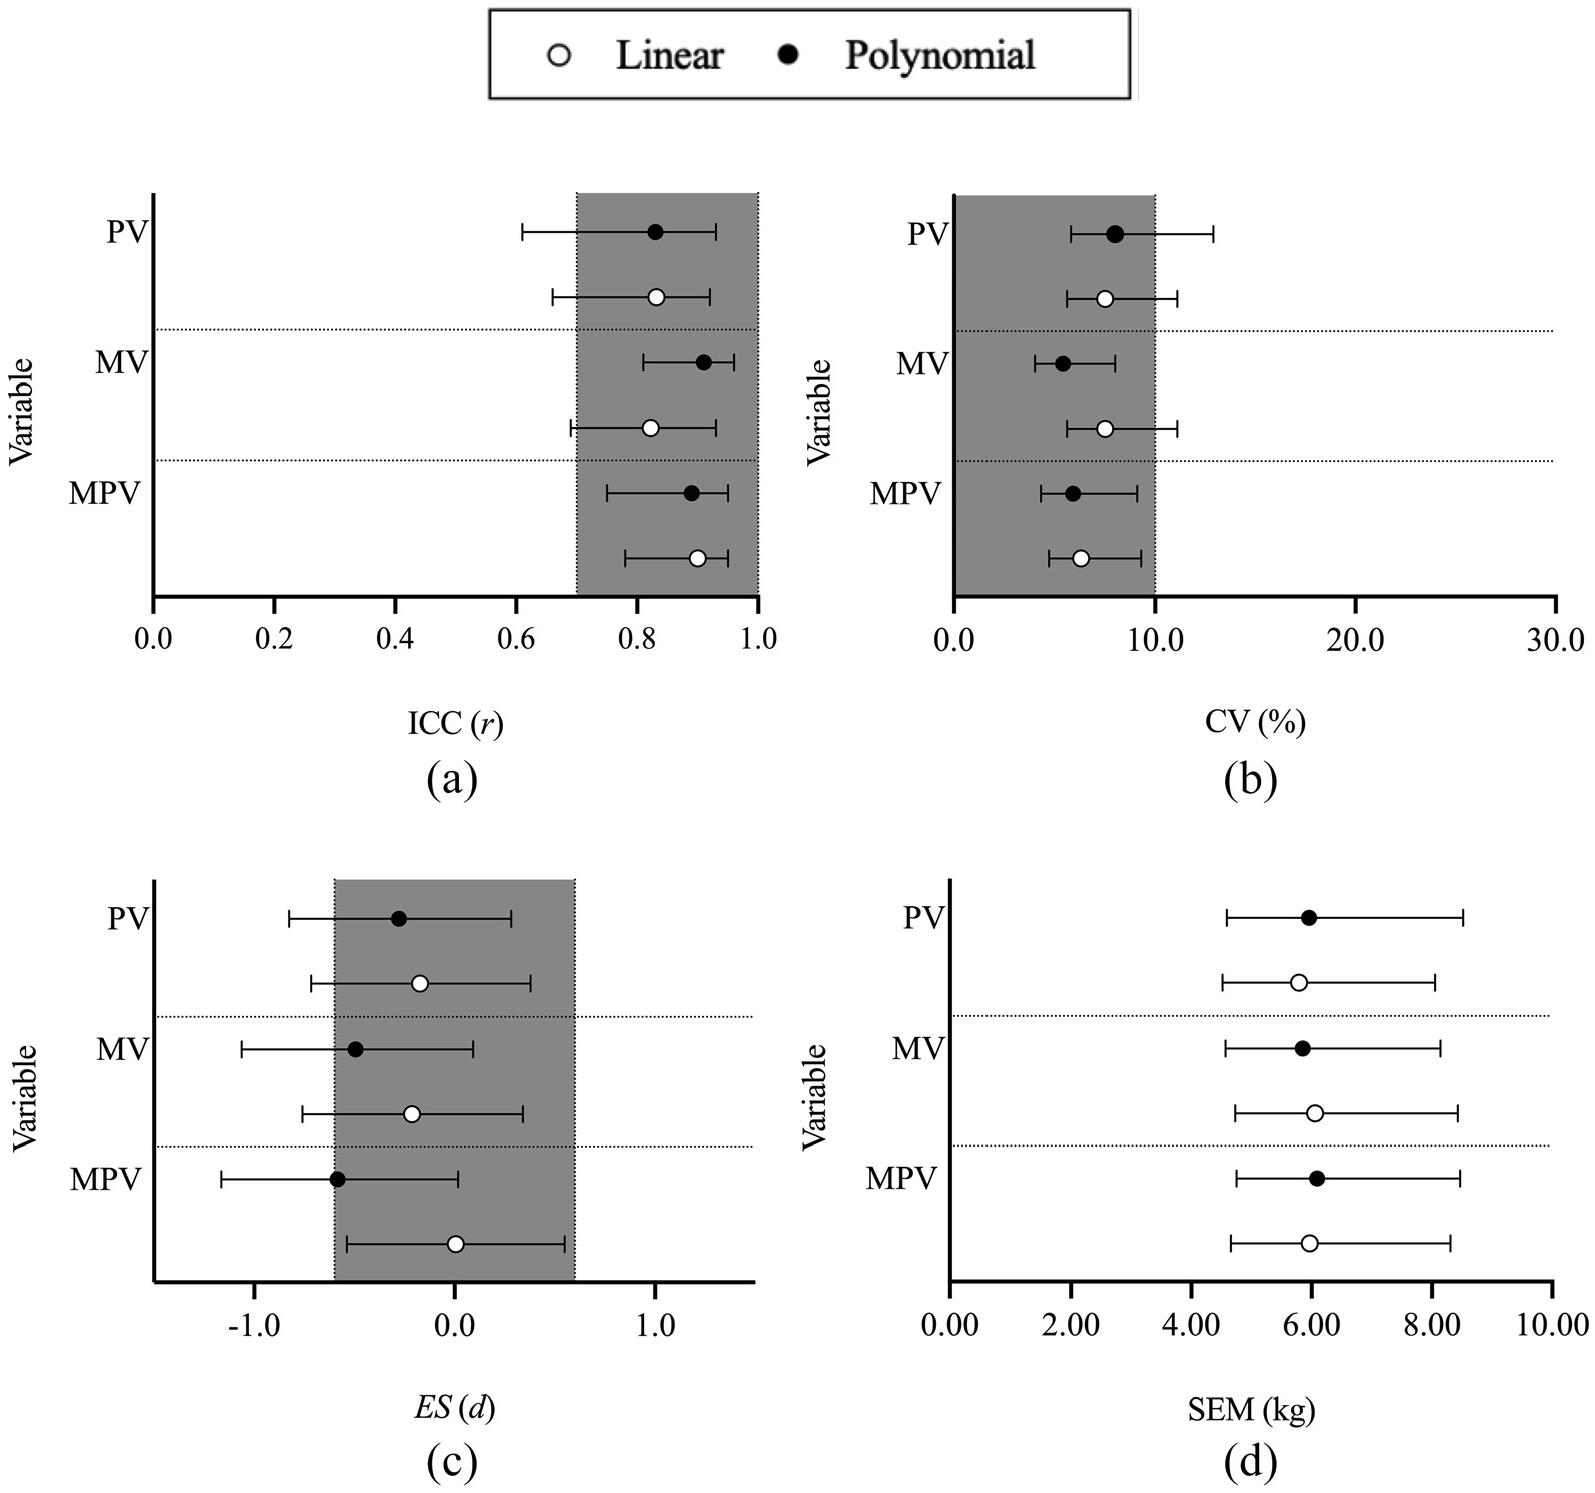
Group means between trials of velocity measures are presented in Table 1. Significant differences were found for PV and MV at 60% 1-RM. The test re-test reliability results of velocity measures are shown in Figure 1. MPV and MV were highly reliable at all relative intensities, while PV displayed poor reliability at 60% 1-RM. The low reliability observed at 60% 1-RM was informed by moderate ES and significant differences between trials (Table 1). The SDD of the outcome measures are shown in Table 2.
Paired Samples t test Results for Velocity Measures and 1-RM Predictions.
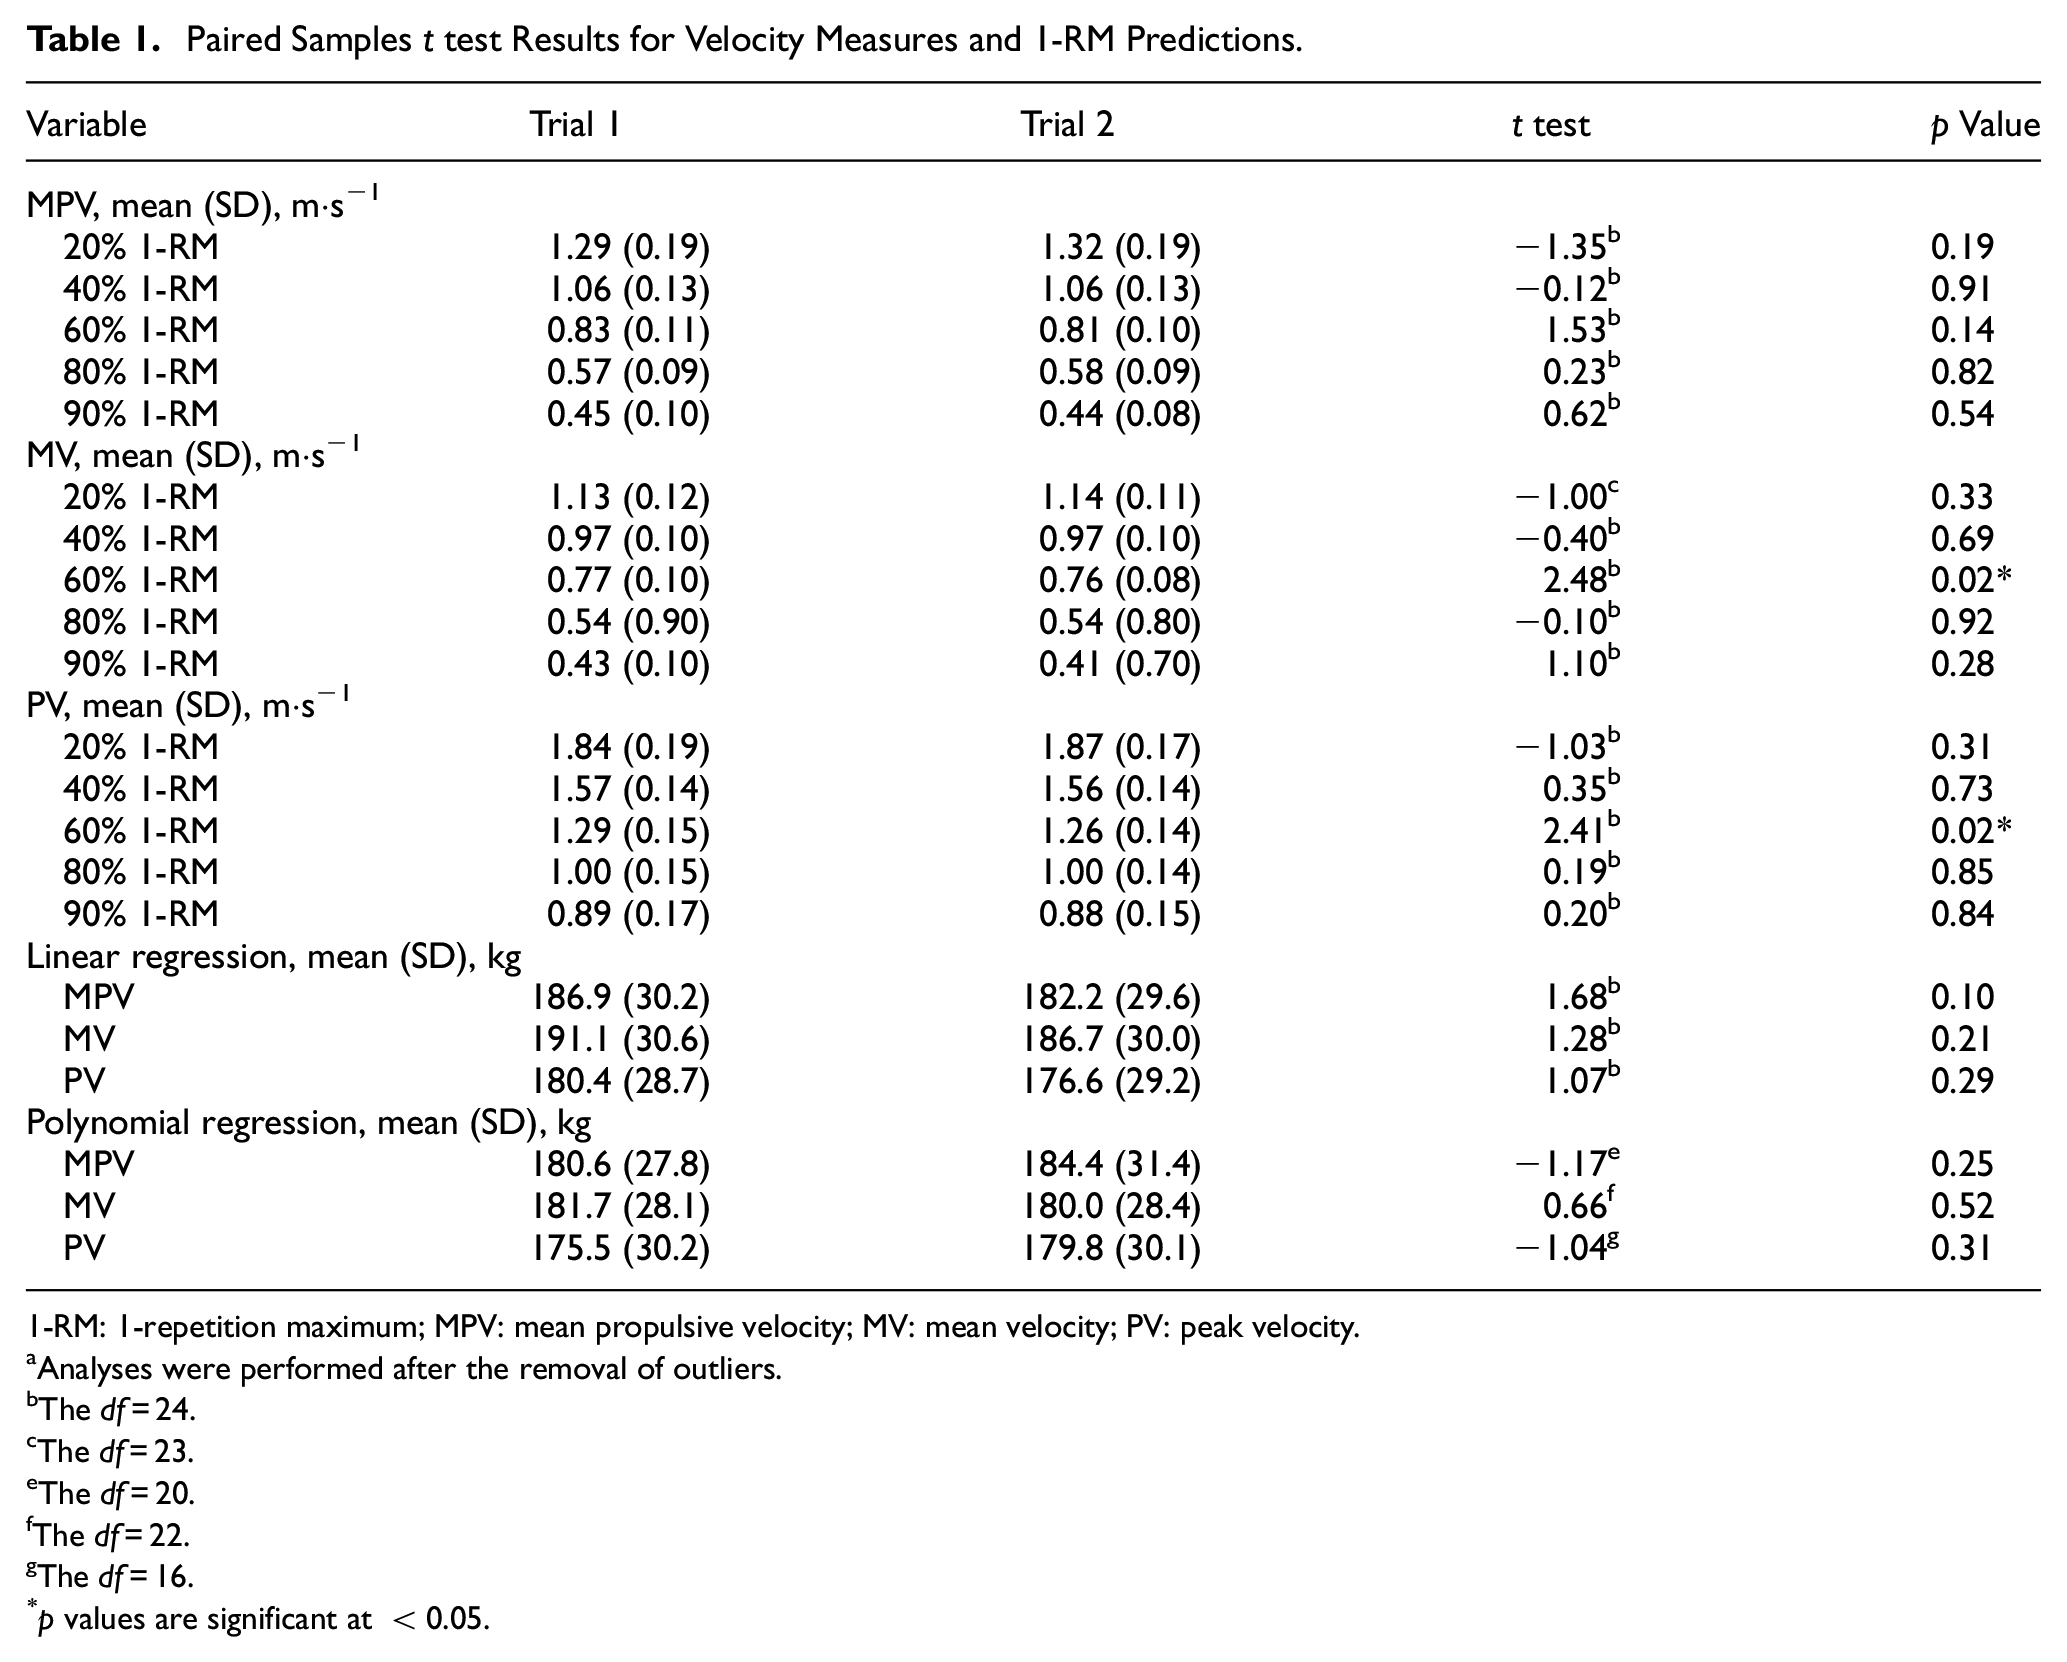
1-RM: 1-repetition maximum; MPV: mean propulsive velocity; MV: mean velocity; PV: peak velocity.
Analyses were performed after the removal of outliers.
The df = 24.
The df = 23.
The df = 20.
The df = 22.
The df = 16.
p values are significant at <0.05.
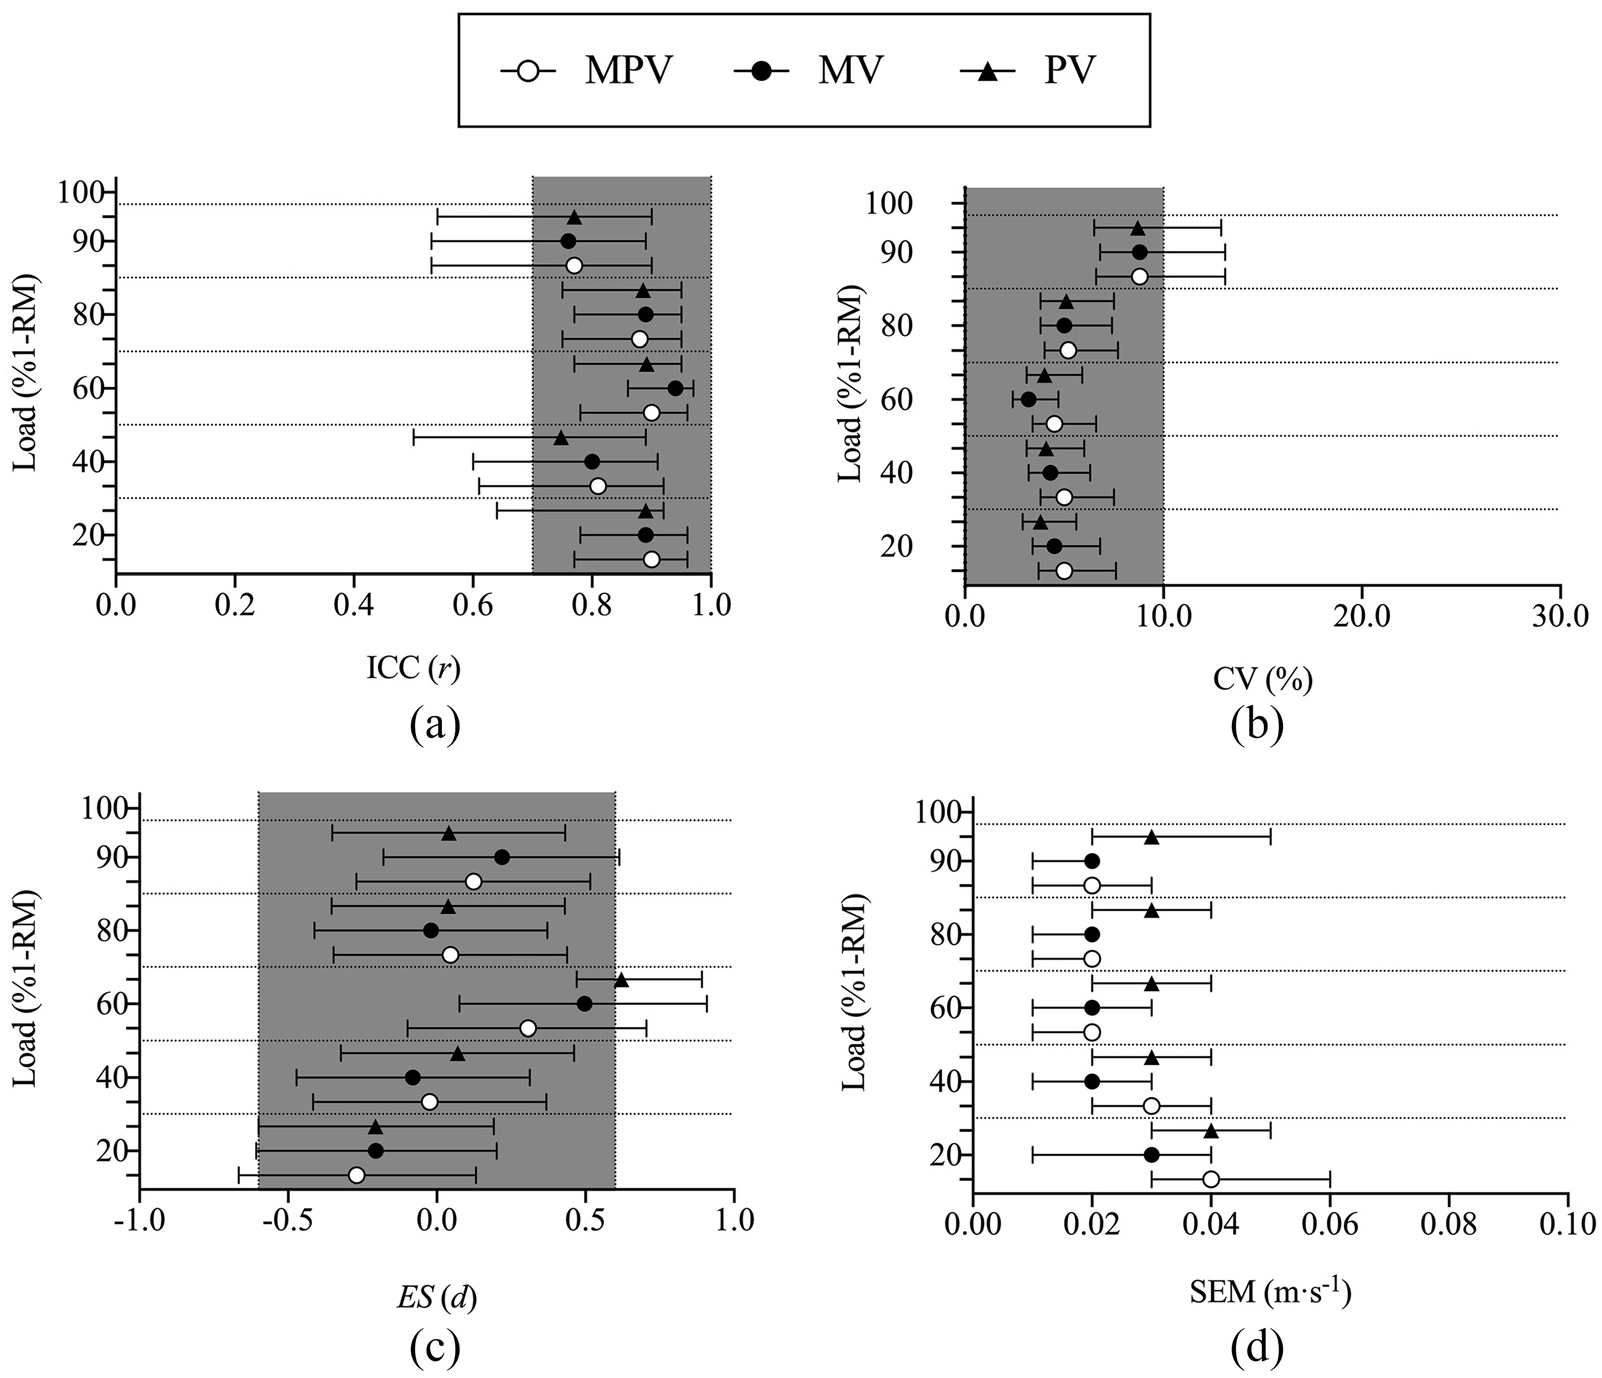
Forest plot displaying the test re-test reliability of MPV, MV and PV in the back squat at 20%, 40%, 60%, 80% and 90%1-RM load: (a) ICC, (b) CV, (c) ES, and (d) SEM. Grey-shaded area indicates the zone of acceptable reliability. Error bars indicate 95% confidence limits. MPV indicates mean propulsive velocity; MV: mean velocity; PV: peak velocity; 1-RM: 1-repetition maximum;ICC: intraclass correlation coefficient; CV: coefficient of variation; ES: effect size; SEM: standard error of the measurement.
Smallest detectable difference of velocity measures at 20%, 40%, 60%, 80% and 90% 1-RM.
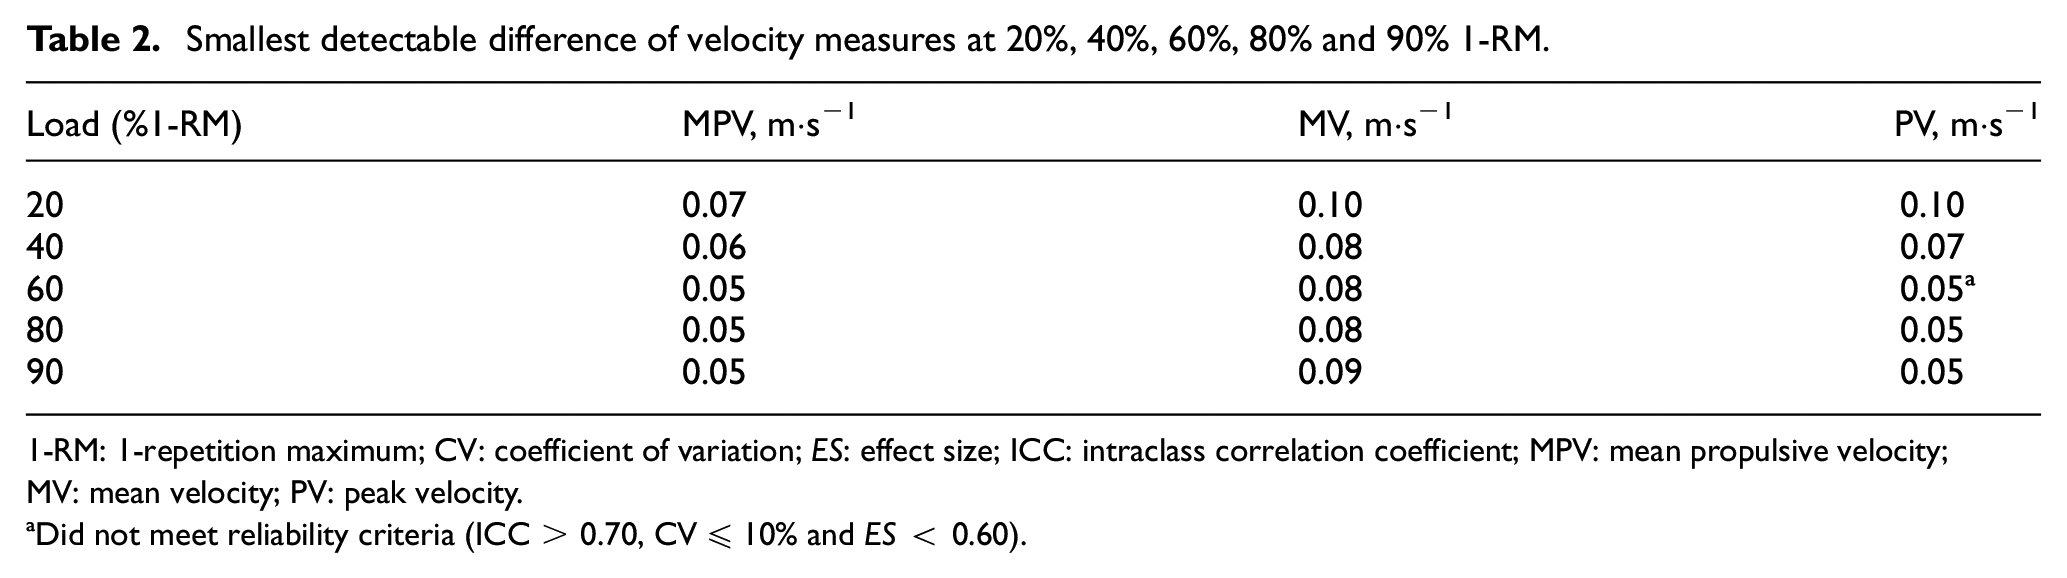
1-RM: 1-repetition maximum; CV: coefficient of variation; ES: effect size; ICC: intraclass correlation coefficient; MPV: mean propulsive velocity;MV: mean velocity; PV: peak velocity.
Did not meet reliability criteria (ICC > 0.70, CV ≤ 10% and ES < 0.60).
Maximum strength prediction
All LVPs and their corresponding prediction equations can be seen in Figure 2. The runs test produced non-significant results for all linear (MPV: p = 0.90; MV: p = 0.50; PV: p = 0.50) and polynomial (MPV: p = 0.90; MV: p = 0.90; PV: p = 0.90) regression models. All models presented nearly perfect r2. Both linear and polynomial regression models for MPV and MV displayed nearly perfect Pearson’s correlations with relative load. Whilst PV models showed a very large correlation with relative load (Figure 2). Group mean 1-RM predictions are shown in Table 1. No significant differences were found between mean 1-RM predictions between trial 1 and trial 2 from either prediction model. The test re-test reliability of the 1-RM prediction models are displayed in Figure 3. All models exhibited acceptable reliability.
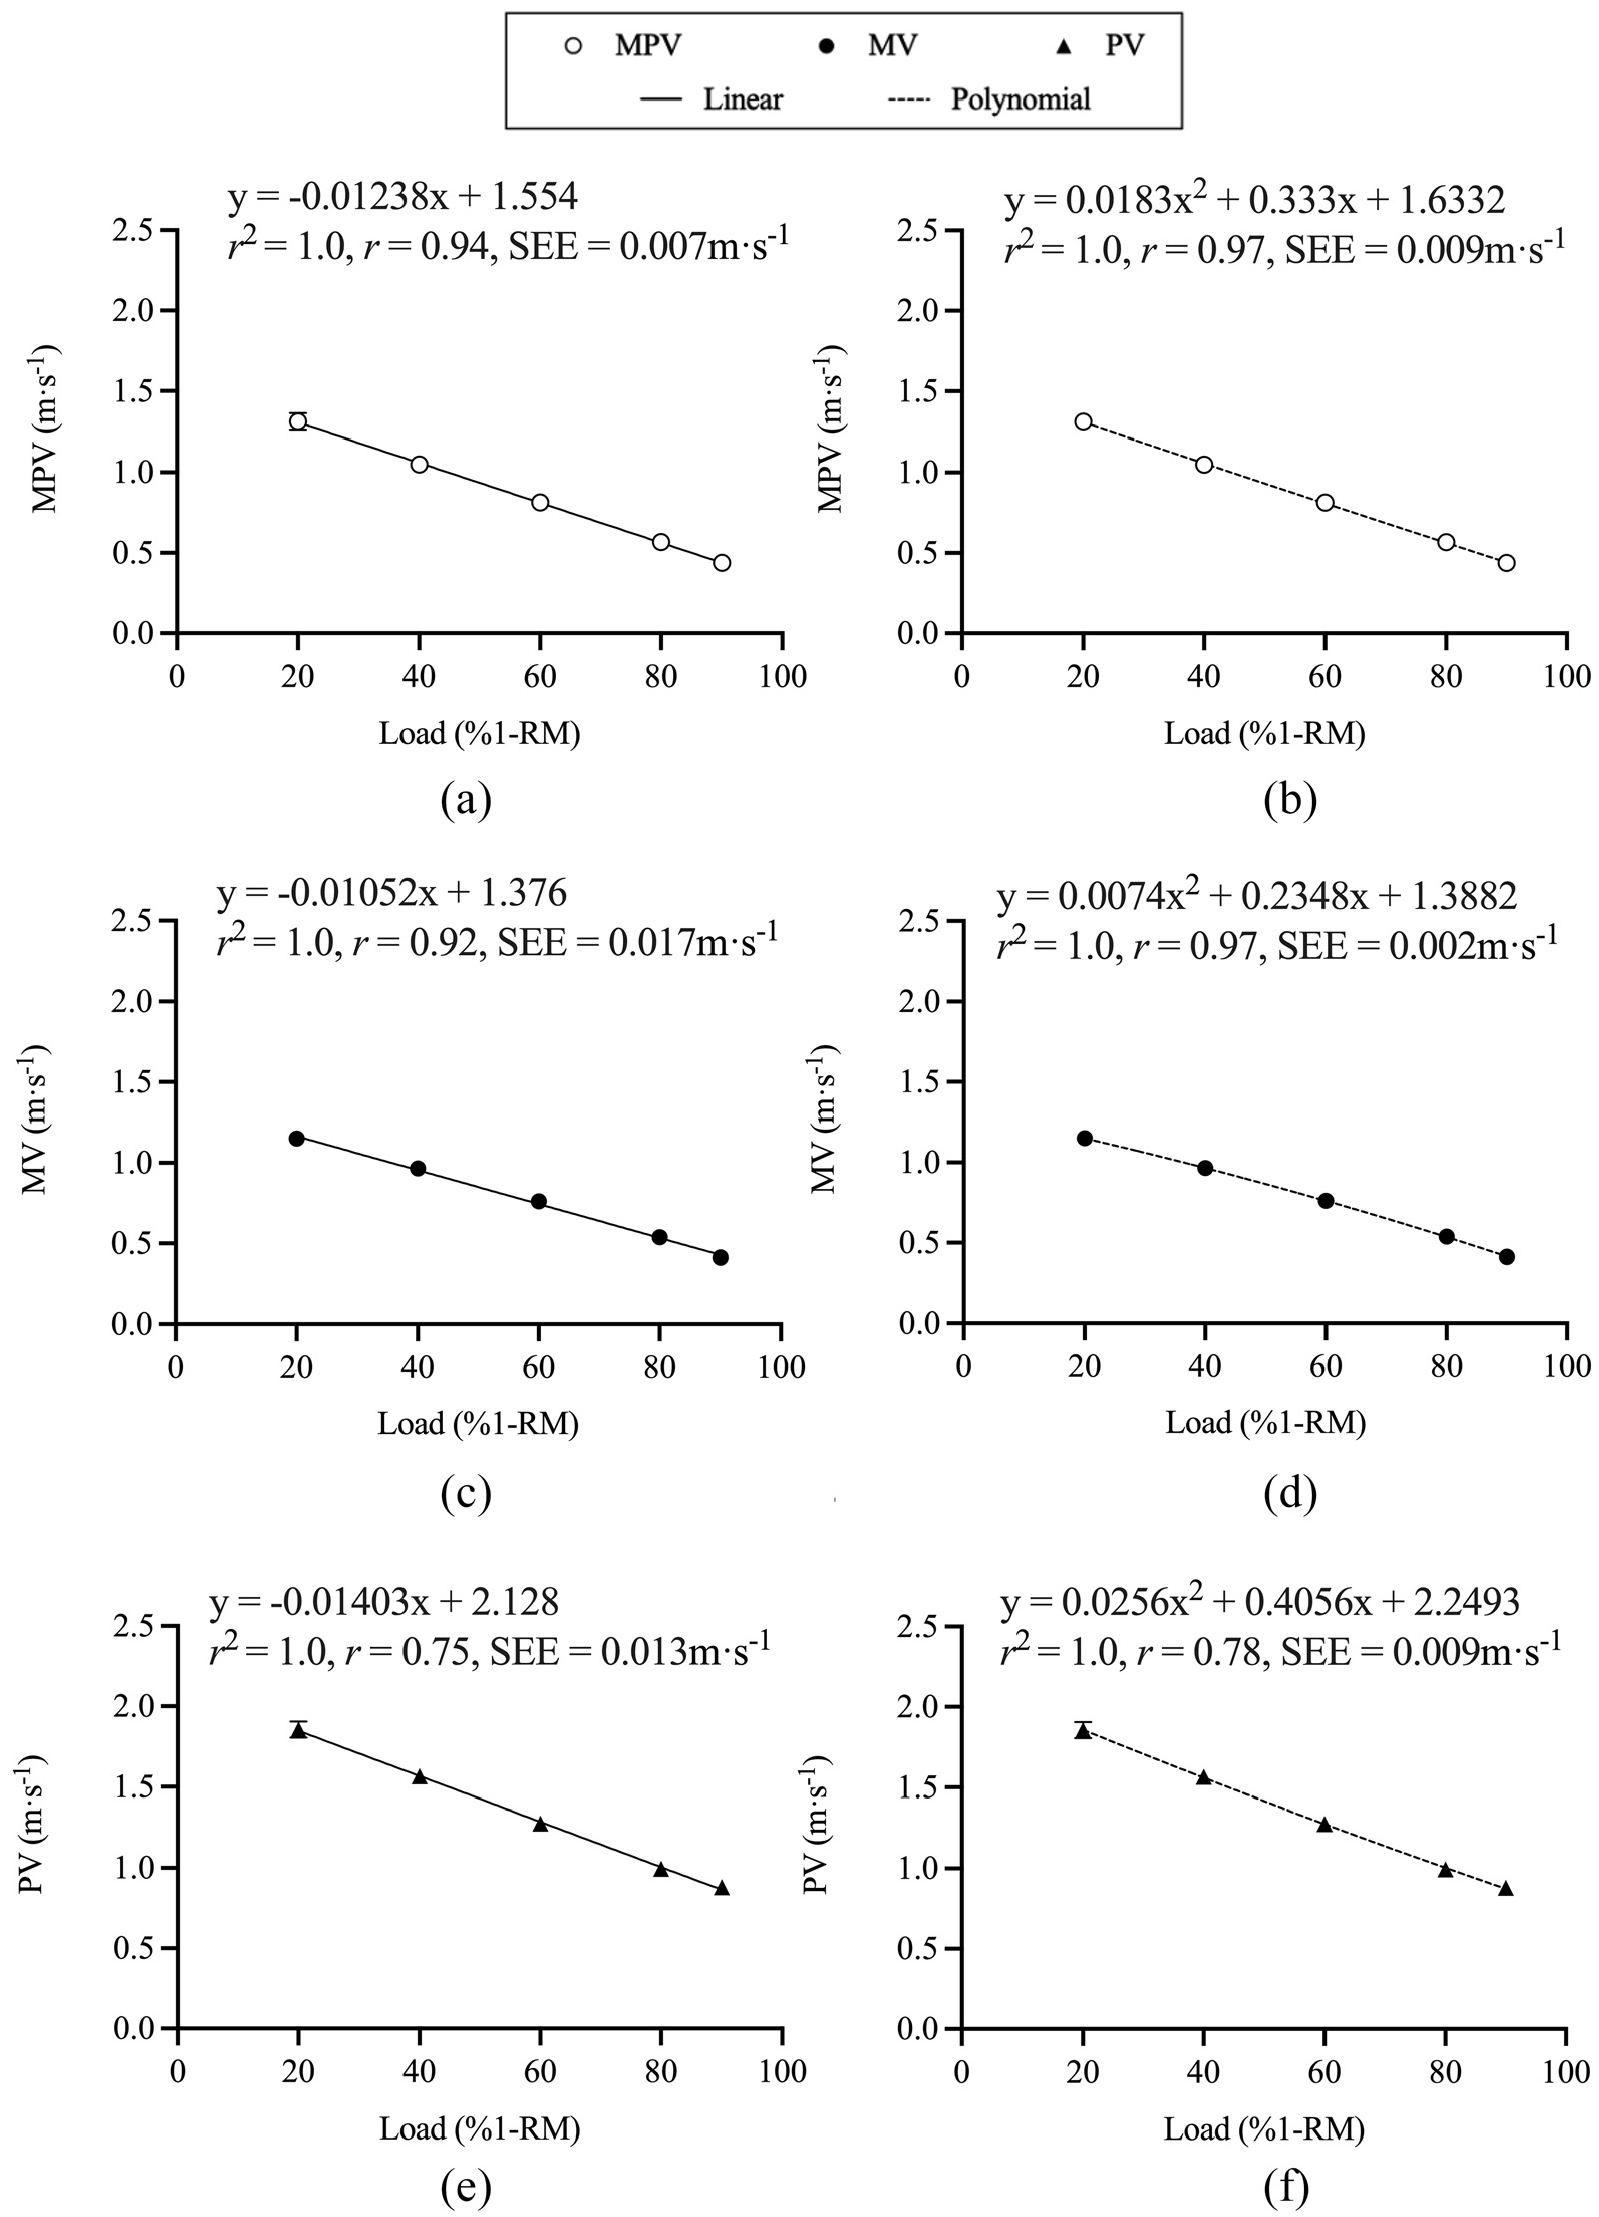
Relationship between relative load (%1-RM) and MPV, MV and PV using linear and polynomial regression: (a) MPV linear fit from 20% to 90% 1-RM, (b) MPV polynomial fit from 20% to 90% 1-RM, (c) MV linear fit from 20% to 90% 1-RM, (d) MV polynomial fit from 20% to 90% 1-RM, (e) PV linear fit from 20% to 90% 1-RM, (f) PV polynomial fit from 20% to 90% 1-RM. Error bars indicate SD. 1-RM indicates 1-repetition maximum; MPV: mean propulsive velocity; MV: mean velocity; PV: peak velocity; r2: bivariate coefficient of determination; r: Pearson correlation coefficient; SEE: standard error of the estimate.
Forest plot displaying the test re-test reliability of 1-RM prediction methods using linear and polynomial regression with relative loads between 20% and 90% of 1-RM: (a) ICC, (b) CV, (c) ES and (d) SEM. Grey-shaded area indicates the zone of acceptable reliability. Error bars indicate 95% confidence limits. PV indicates peak velocity; MV: mean velocity; MPV: mean propulsive velocity;1-RM: 1-repetition maximum; ICC: intraclass correlation coefficient; CV, coefficient of variation; ES, effect size; SEM, standard error of the measurement.
The paired samples t test revealed that all PV derived 1-RM predictions were not statistically different to measured 1-RM (PV linear: t24 = −0.23, p = 0.82; PV polynomial: t21 = 0.24, p = 0.81). All other models were found to differ significantly from measured 1-RM (MPV linear: t24 = −3.23, p = 0.004; MPV polynomial: t24 = −4.09, p < 0.001; MV linear: t24 = −4.87,p < 0.001; MV polynomial: t24 = −2.80, p = 0.01). Figures 4 and 5 feature Bland–Altman plots describing the agreement and heteroscedasticity of error present between measured and predicted 1-RM using the respective models. Figure 6 contains further validity findings of 1-RM prediction using data from both trials. The PV polynomial model was the only regression method which satisfied the acceptable criteria of validity. All models demonstrated significant (p < 0.001) correlations between measured 1-RM and predicted 1-RM ranging from very large to nearly perfect. The Fisher r to z-transformation revealed all 1-RM prediction models were significantly different from each other (linear models: p < 0.001; polynomial models: p = 0.001–0.03). Poor CV and moderate ES were apparent in all other models. Figure 7 expresses the absolute difference between measured 1-RM and predicted 1-RM. All MPV and MV derived models consistently overestimated 1-RM. Whereas all PV derived models were capable of overestimating and underestimating 1-RM.
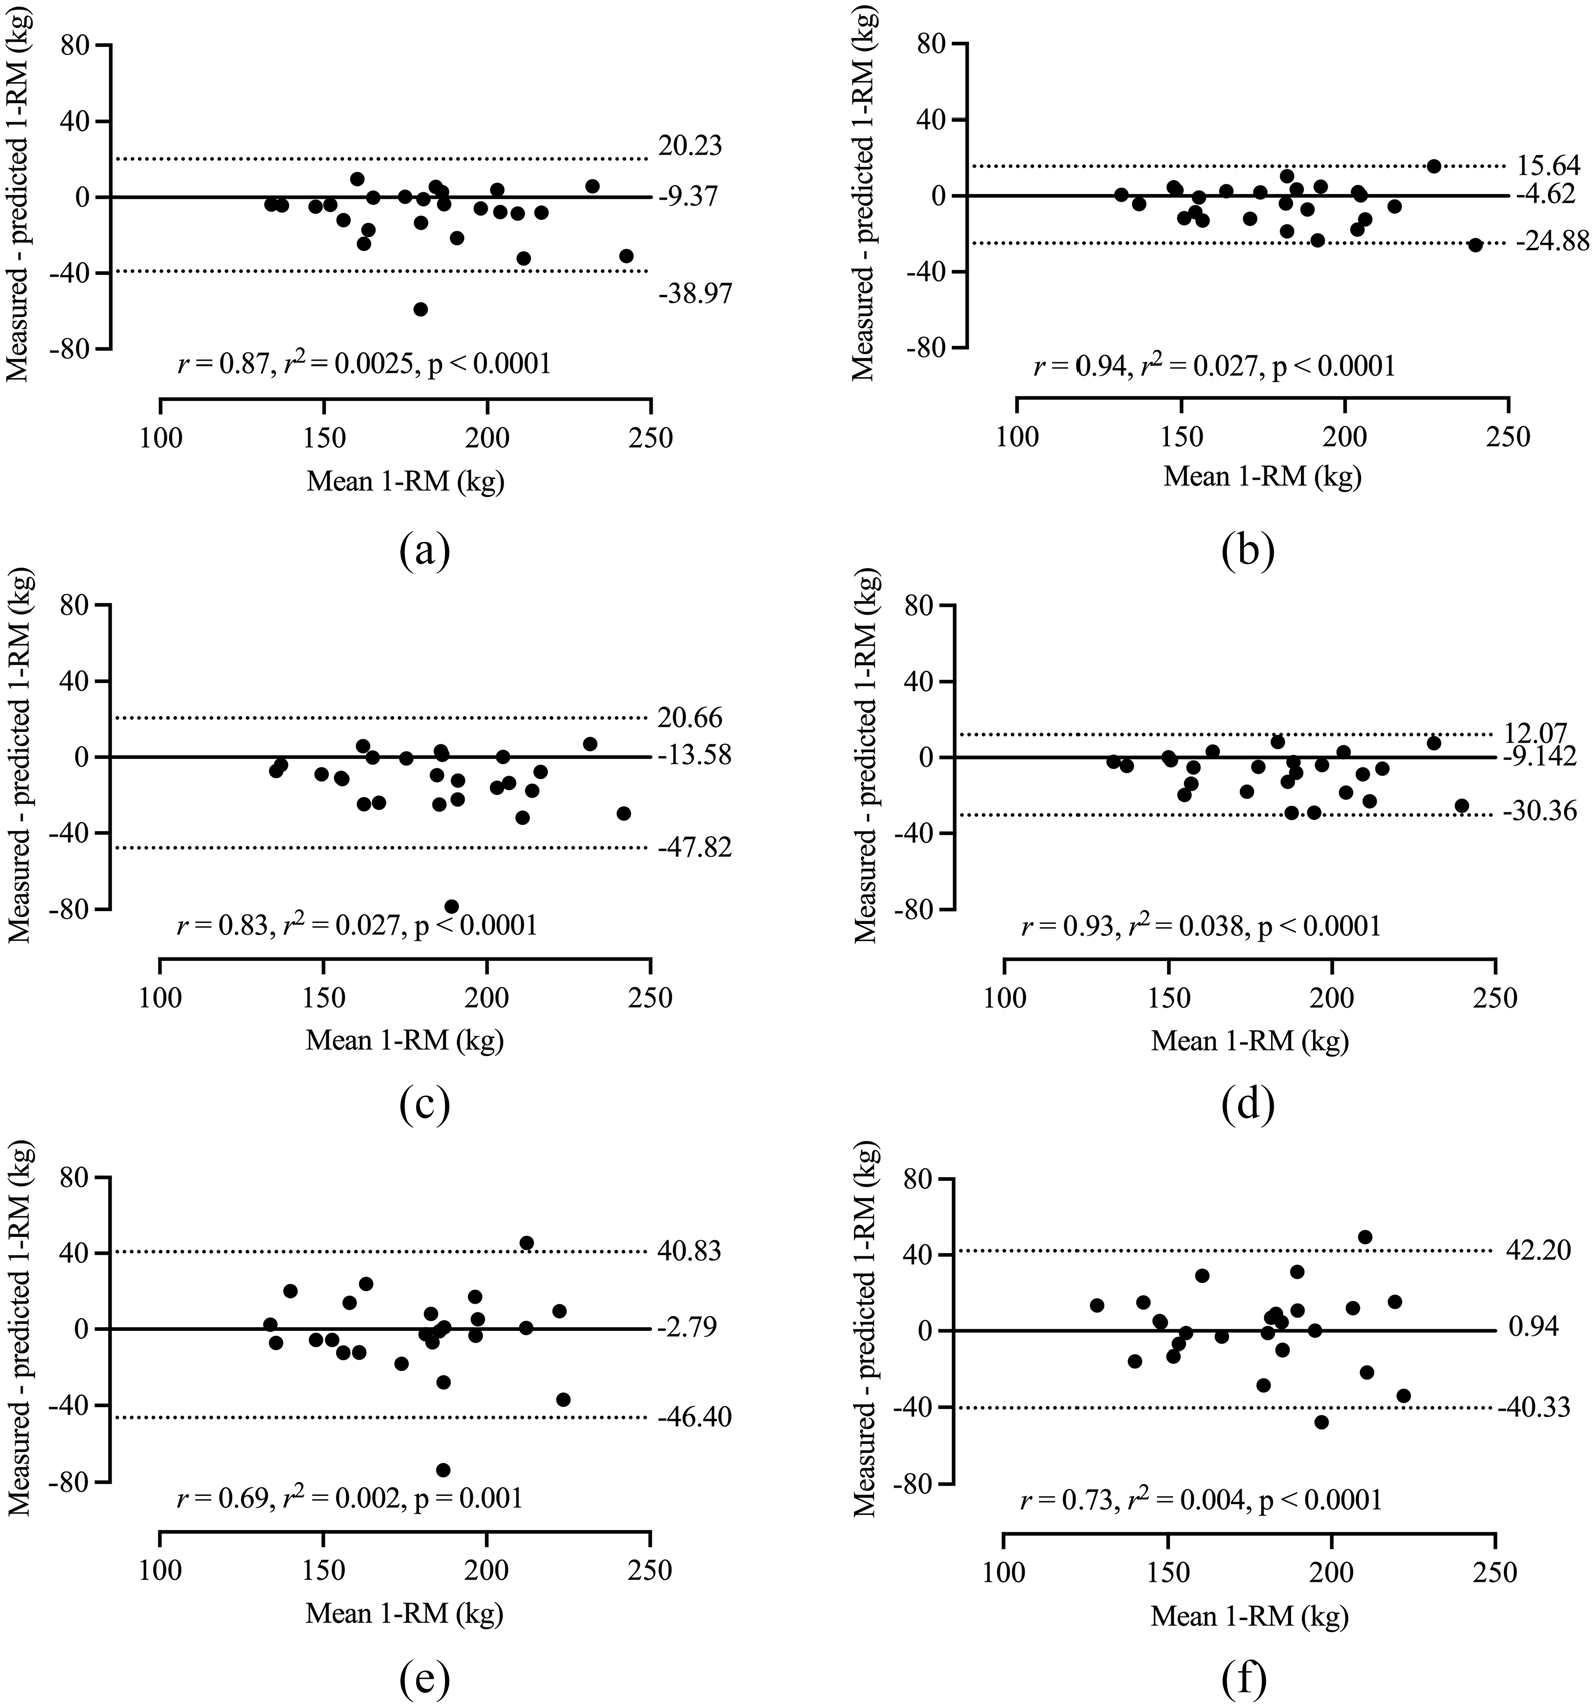
Bland-Altman plots illustrating the variation in measured 1-RM against predicted 1-RM using linear regression and loads 20%–90% 1-RM for trials 1 and 2. (a) MPV (kg) trial 1; (b) MPV (kg) trial 2; (c) MV (kg) trial 1; (d) MV (kg) trial 2; (e) PV (kg) trial 1; (f) PV (kg) trial 2.
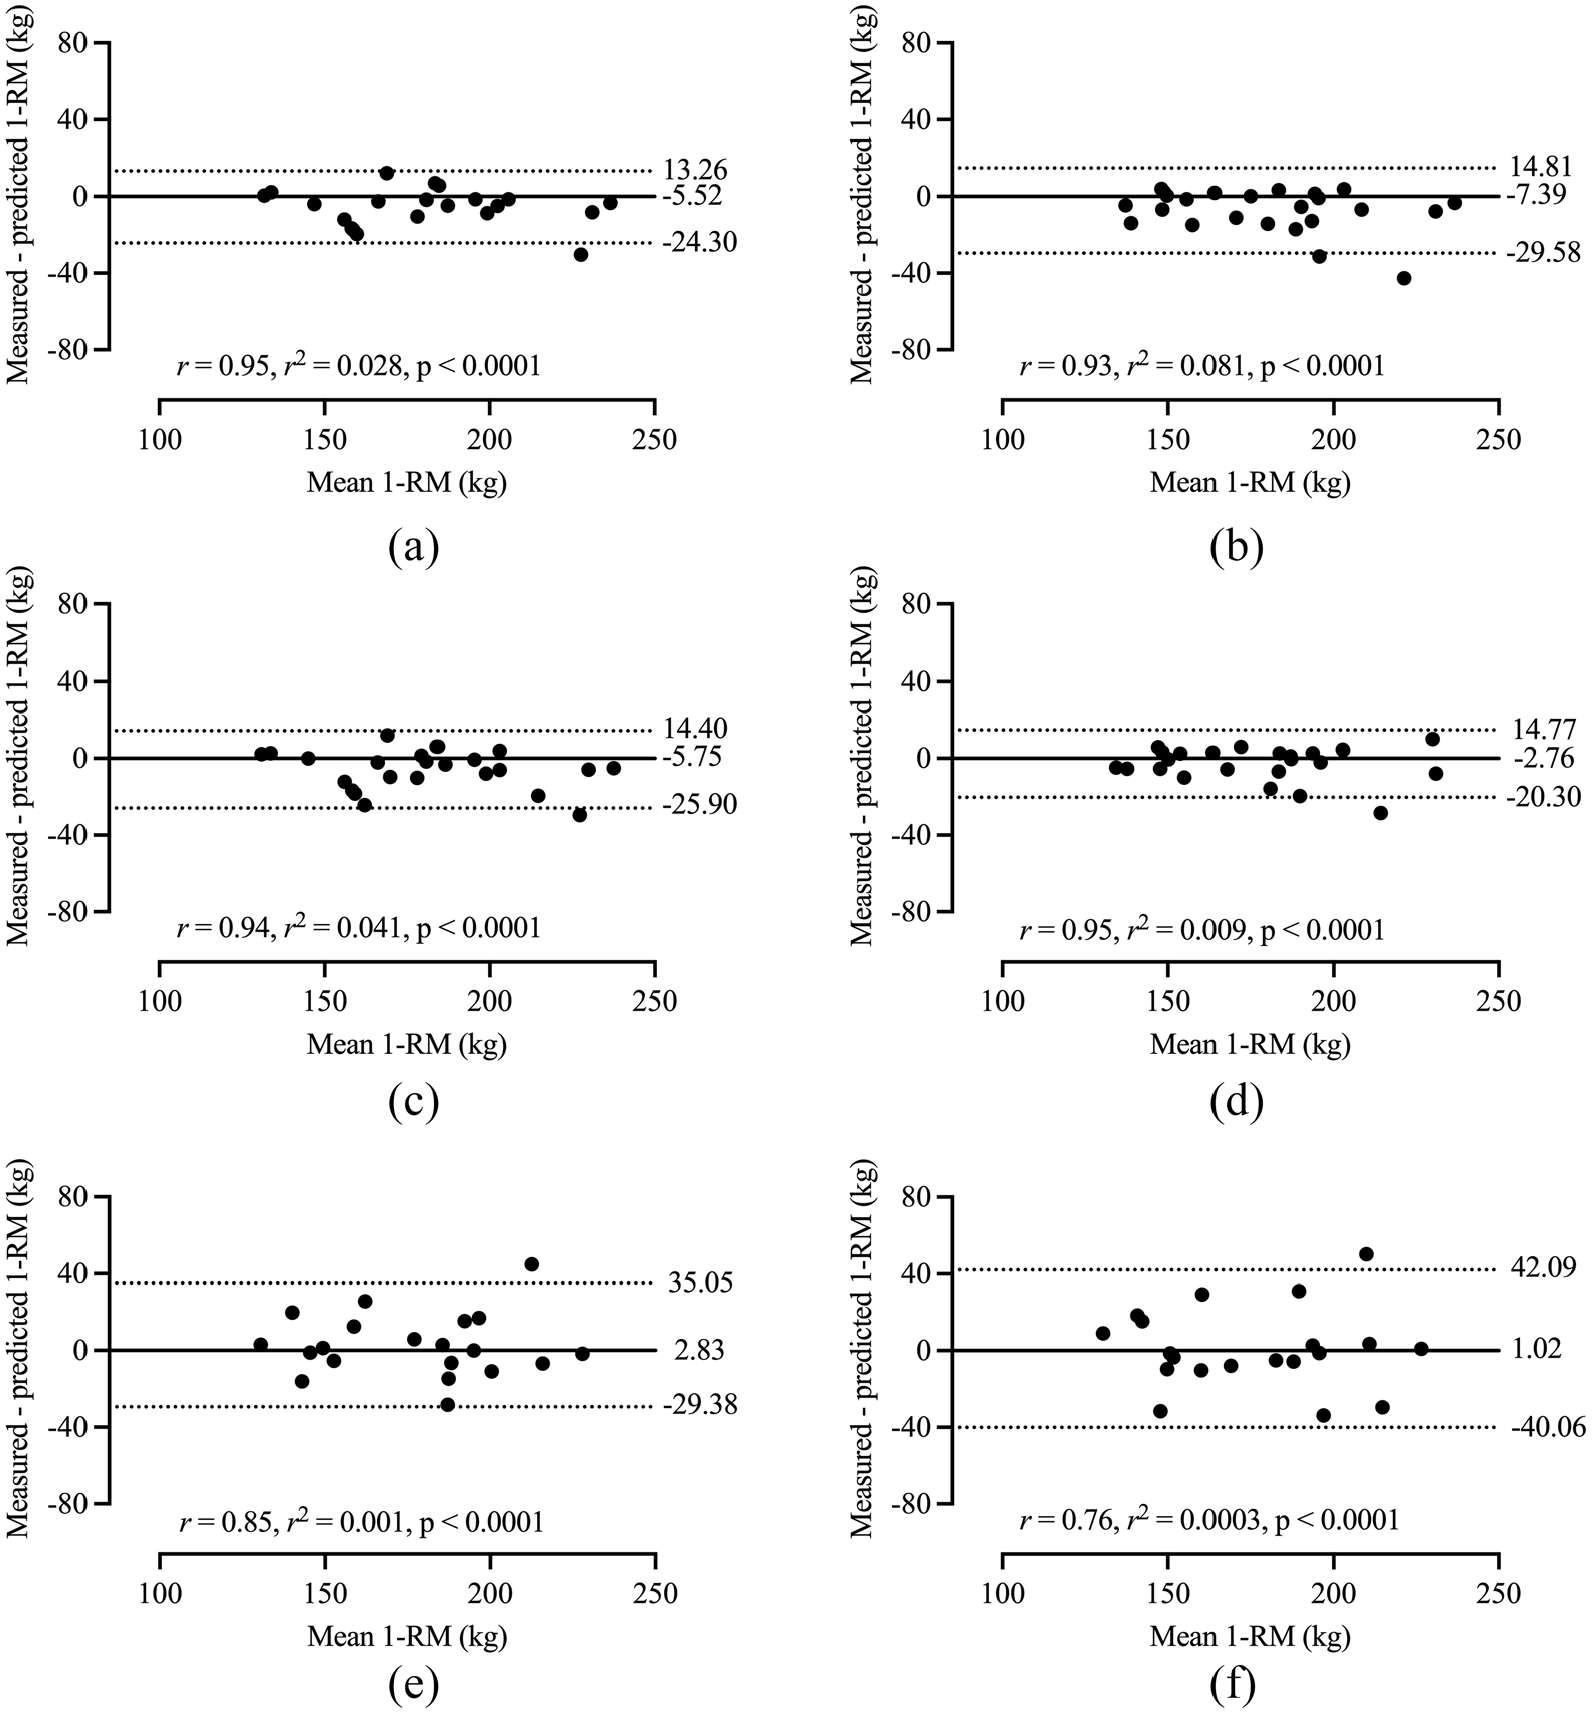
Bland-Altman plots illustrating the variation in measured 1-RM against predicted 1-RM using second order polynomial regression and loads 20%–90% 1-RM for trials 1 and 2: (a) MPV (kg) trial 1; (b) MPV (kg) trial 2; (c) MV (kg) trial 1; (d) MV (kg) trial 2; (e) PV (kg) trial 1; (f) PV (kg) trial 2.
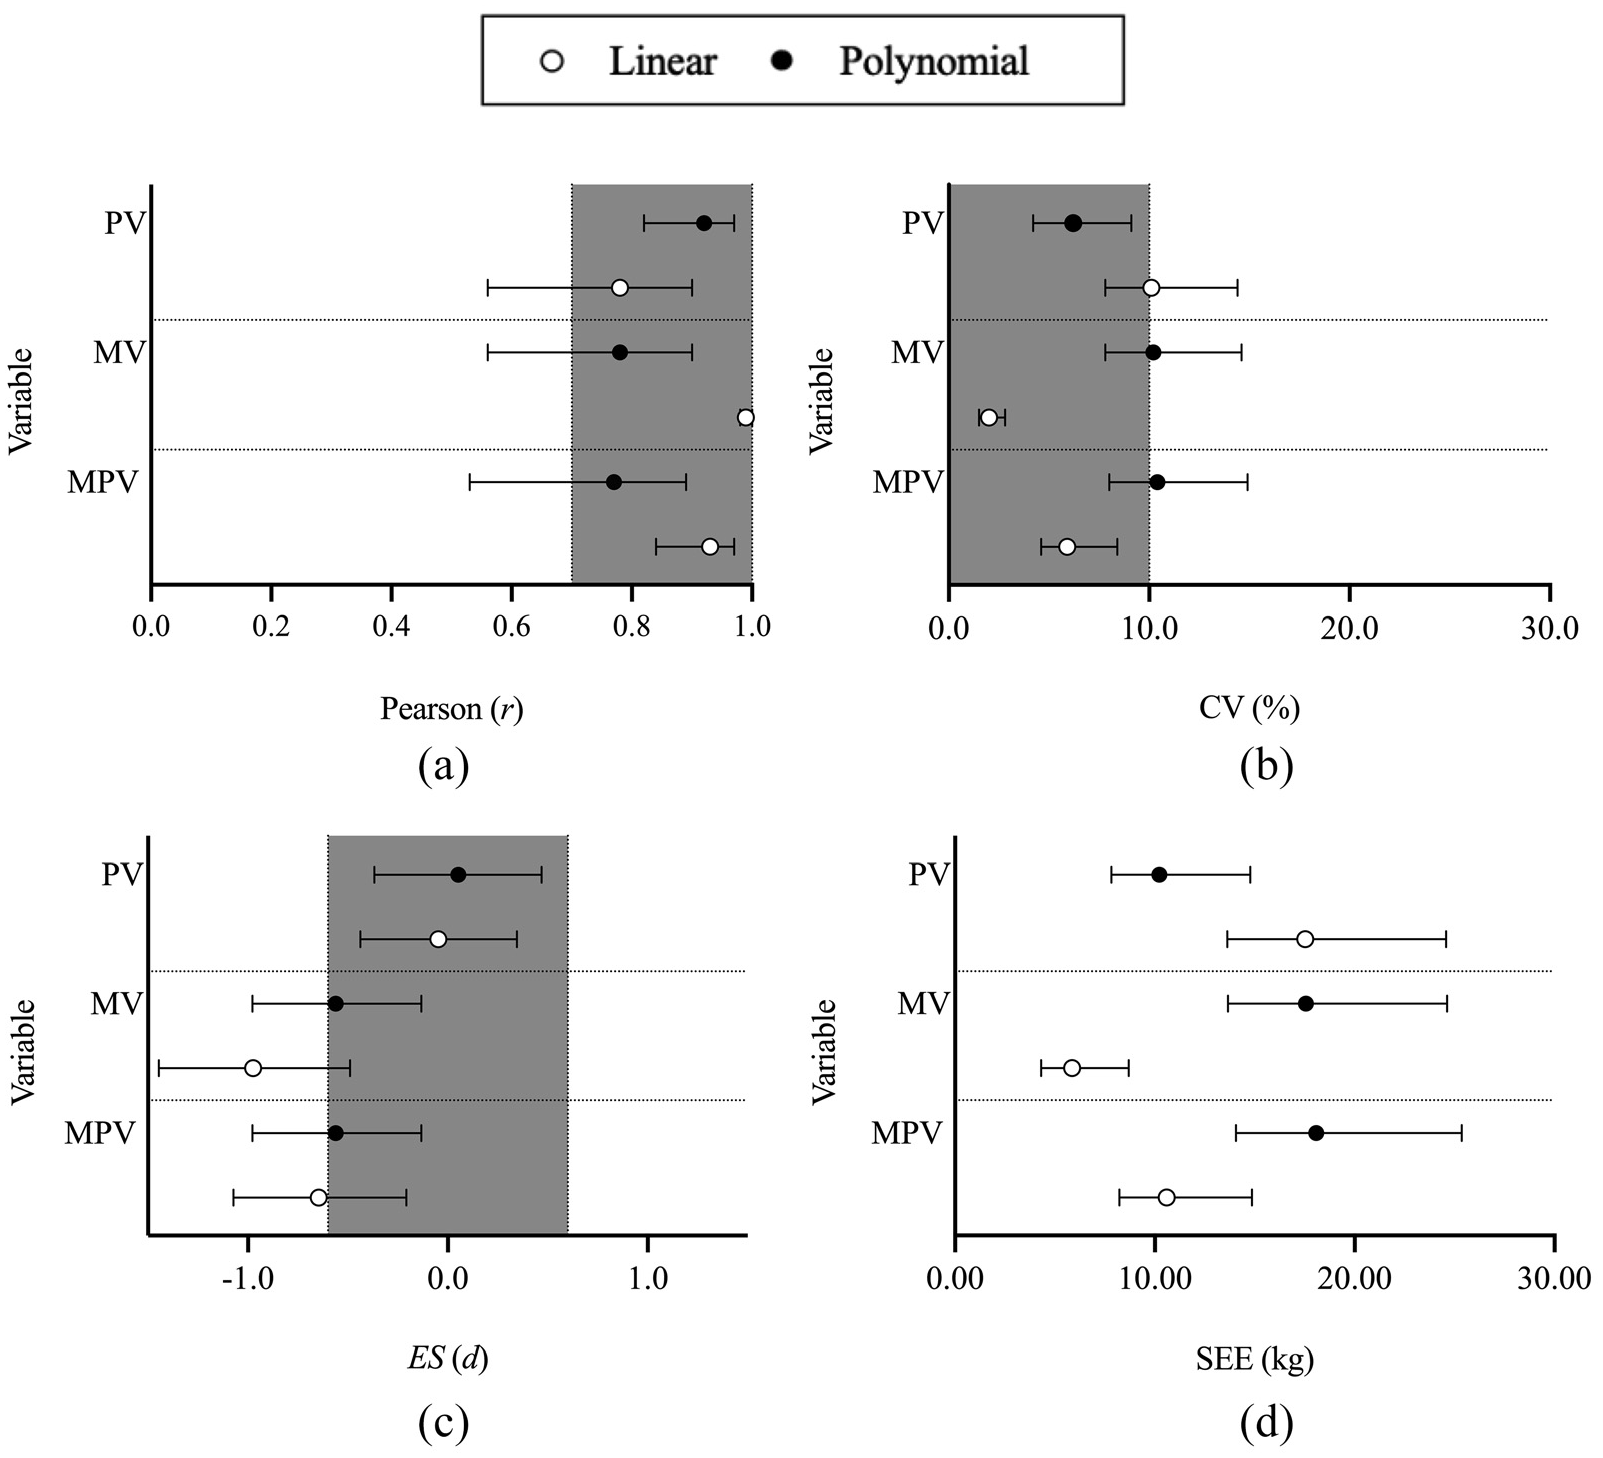
Forest plot displaying the validity of 1-RM prediction methods using linear and polynomial regression with relative loads between 20% and 90% of 1-RM. (a) r. (b) CV. (c) ES. (d) SEE. Grey-shaded area indicates the zone of acceptable validity. Error bars indicate 95% confidence limits. PV indicates peak velocity; MV, mean velocity; MPV, mean propulsive velocity; r, Pearson correlation coefficient; CV, coefficient of variation; ES, effect size; SEE, standard error of the estimate.
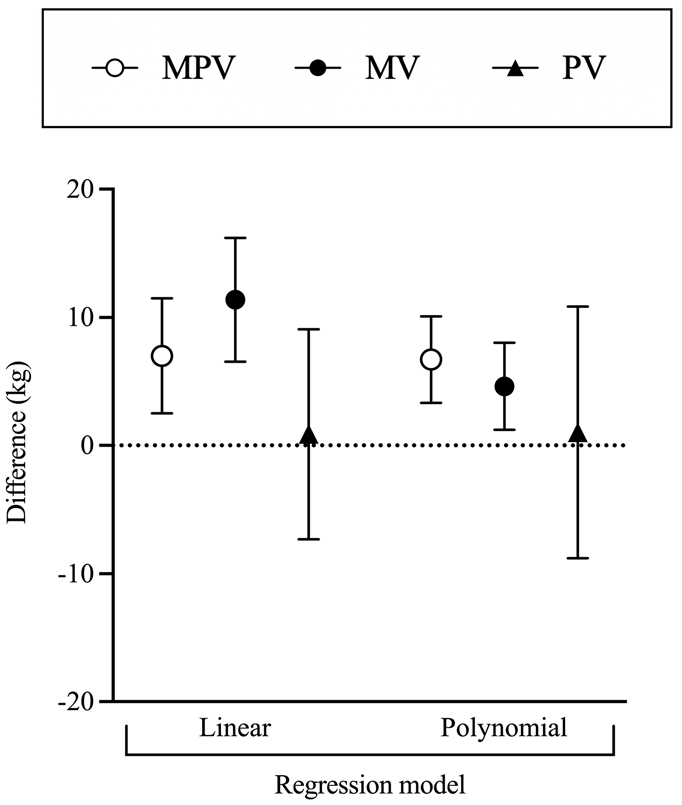
Point graph demonstrating the mean absolute difference between measured 1-RM and predicted 1-RM using linear and polynomial regression with relative loads between 20% and 90% of 1-RM. Error bars indicate SD. 1-RM indicates:1-repetition maximum; MPV: mean propulsive velocity;MV: mean velocity; PV: peak velocity.
Discussion
This is the first study to assess the reliability of MPV, MV and PV to develop LVPs using the Vitruve LPT during back-squat exercise. The findings deduce MPV and MV are highly reliable across 20%–90% 1-RM. Similarly, PV was highly reliable at all intensities apart from 60% 1-RM. The secondary aim examined the reliability and validity of 1-RM back-squat predictions derived from MPV, MV and PV using linear and polynomial regression models. Notably, this is the first study to compare all velocity measures and regression methods within the same study. All 1-RM predictions were highly reliable but displayed poor validity. While both the MPV and MV linear models demonstrated acceptable predictive ability, the MV model was marginally better, whereas both PV models showed the worst predictive ability. However, all prediction models overestimated or underestimated 1-RM. Further, all estimations of 1-RM were significantly different from each other.
Reliability of outcome measures
The reliability results from this study compare favourably to that of the GymAware, which is widely regarded as the most accurate LPT. 43 Using the same intensities from this study, Orange et al. 42 found the GymAware produced either the same or more SEM for PV (range = 0.03–0.05 m·s−1) and MV (range = 0.06–0.09 m·s−1). Interestingly, the 95% CI for ICC were markedly wider than reported in this study for MV (20%: ICC = 0.49–0.86; 60%: ICC = 0.67–0.92; 80%: ICC = 0.66–0.92) and PV (20%: ICC = 0.57–0.89; 60%: ICC = 0.61–0.90; 80%: ICC = 0.42–0.84; 90%: ICC = 0.37–0.82) across light to heavy intensities. Using the correlation classification in this study, 55 the ICC at 20%, 80% and 90% overlap into the moderate category, which was not observed in our study. The tighter CI from the present study could signify confidence in the Vitruve’s reliability, although variations in ICC may also imply the load-velocity relationship is participant-dependant.10,50 Nonetheless, across 20%–90% 1-RM the difference in SEM between the Vitruve and GymAware is marginal for MPV and MV (<0.02 m·s−1). 49 The Vitruve also produced less SEM for MV and PV in comparison to other free-weight squat investigations.43,44,54,60,61 Although the Vitruve’s reduced reliability at 90% 1-RM was consistent with other analyses.38,42,43,49,50 This has been attributed to horizontal variations in the barbell path during the free-weight squat 41 and the use of the SSC.62,63 This is why previous investigations have used Smith machine modalities which minimise error, but at the cost of ecological validity. For instance, Martinez-Cava et al..32 found superior results for PV (ICC = 0.99; CV = 0.86%; SEM = 0.01 m·s−1) and MPV (ICC = 0.99; CV = 1.24%; SEM = 0.01 m·s−1) from the Vitruve.
An unexpected finding was the detection of significant differences for MV and PV between trials at 60% 1-RM. This unexplained variance could be attributed to the fast execution of light to moderate loads which may result in a lower degree of limb coordination and more varied muscle activation patterns.48,49 Collectively, this study recommends all three velocity measures can be used to predict 1-RM. Considering that small differences (<0.1 m·s−1) in movement velocity could represent variations equating to approximately 5% in training intensity 10 : changes in velocity greater than the SDD presented herein may be used to monitor improvements in performance.
Maximum strength prediction
A novel finding from this study was the repeatability of all back-squat 1-RM estimations, regardless of the velocity measure or regression model used. To date, only 3 studies have investigated back-squat 1-RM prediction using linear regression, MV, and strength trained males.38,54,64 Neither Banyard et al. 38 nor Hughes et al 54 detected significant differences between predictions using loads 20%–90% 1-RM, which coincides with this study. Almost identical variation was observed by Hughes et al.54 (ICC = 0.92; CV = 5.0%), and Banyard et al. 38 (CV = 5.7%; SEM = 8.6 kg; ES = −0.02). Despite each study utilising a different LPT, the similar findings may be explained by methodological parallels in relation to the sample’s relative strength (>1.5 squat body ratio) and squat depth (knee flexion: 121.0° ± 10.9°). 38
Contrariwise, this study adds to the reports of significant overestimations of 1-RM in the free-weight back-squat.38,54 Large absolute errors and systematic biases were observed, notwithstanding very large to nearly perfect correlations between load and velocity and little to no heteroscedasticity of error. This finding reflects other studies,65,66 and demonstrates the interindividual variability associated with 1-RM predictions in lower body multi joint exercises.38,54,67–69 Alternatively, one study reports lower SEE and systematic biases in tandem with a tendency for linear models to underestimate back squat 1-RM. 64 Although this may be attributable to the study’s reliance on a different extrapolation method using data up to 80% 1-RM. Other studies found linear models using MV are known to overestimate back-squat 1-RM between 2.2 and 20.0 kg.38,54 The larger absolute differences found by Banyard et al. 38 may be attributed to the researchers four trial assessment of 1-RM. Considering the variability of 1RMMVT (CV = 25%), multiple assessments of 1-RM may have amplified the variation observed in that study in comparison to our study. This supports previous findings that daily predictions of maximal strength are not sensitive enough to detect fatigue or modify training load, 70 as originally propositioned.10,19 Intriguingly, a recent study found bench press 1-RM can be estimated more accurately with machine learning methods than the MVT method, 71 but it is unknown if this can be translated into free-weight examinations. This should be a consideration for future research.
It was not anticipated the data would suggest both PV models possessed the most valid estimation of back-squat 1-RM in relation to measured 1-RM. Under closer inspection, the range of estimated 1-RMs from the PV polynomial and PV linear models were considerably wider in comparison to the MPV and MV models (Figure 7). This study does not recommend the use of PV for back-squat 1-RM prediction. This is informed by both PV models presenting higher SEE and CV than the other models, which is consistent with other investigations. 48 Though PV may be used to monitor ballistic exercises, this is beyond the scope of this study. Altogether, this study found the MV linear model displayed the highest validity.
The higher precision of linear 1-RM estimations in this study weighs in on the assertion that polynomial regression adds an unnecessary complexity.36,38,49,54,72 Predicting 1-RM beyond the known data of a polynomial curve is known to yield implausible results. 66 In this study two participants (n = 2) exhibited a hyperbolic curve for PV which resulted in no estimation of 1-RM at all. Moreover, some studies advocating polynomial regression have breached the assumption of independence by pooling data.10,48 This practice has been critiqued within the literature.5,22 When data from multiple LVP sessions are combined for a given participant, the data observations are no longer independent. This causes autocorrelation which overinflates regression statistics. 73 Consequently, overestimations of relative load may occur. A runs test can be used to detect both autocorrelation and whether a data set differs from its desired model. 74 It is important to note the runs test found none of the linear models in this study departed from linearity. Furthermore, all of the variance between load and velocity was accounted for by the linear models. This objectively infers polynomial curve fitting in this instance is not only an unnecessary complexity, but also a statistical misdemeanour. The inclusion of a runs test is a distinguishing feature between this study and the extensive work of Thompson et al, 64 whose findings conflict with ours in recommending quadratic modelling for the prediction of back squat 1-RM. Altogether, the acceptance of a linear load-velocity relationship would be consistent with the growing consensus concerning the linearity of the force velocity relationship during multi-joint movements. 75
The present study shows that all 3 velocity measures produced by the Vitruve can generate stable individualised LVPs. Although practitioners should be consistent with their use of velocity measure. Lamentably, this study was unable to distinguish the variability associated with the Vitruve LPT from the variability associated with the subjects. Although the Vitruve is known to display very high inter-device reliability during Smith machine back-squat exercise (MPV: SEM = 0.03 m·s−1; SDC = 0.08 m·s−1; CV = 3.09%; PV: SEM = 0.02 m·s−1; SDC = 0.07 m·s−1; CV = 1.60%), 32 future research must consider the influence of biological variation when assessing the reliability of the Vitruve during free weight exercise. 27 Otherwise researchers risk misreporting the true precision of a given device. 37
Prediction methods may not be sensitive enough to replace direct assessment of 1-RM. However, LVPs using linear regression and MPV or MV may still provide practical information regarding an individual’s performance potential. Future research should consider whether a combination of lighter loads, smaller range of velocities, or machine learning can improve the efficiency of 1-RM prediction in free-weight exercise.
Conclusions
The Vitruve provides reliable LVPs for MPV, MV and PV in the back-squat using strength-trained males. Linear regression is superior for 1-RM prediction. Any further investigations using polynomial regression should publish statistics which confirm the assumptions of regression are met.
Research Data
sj-xlsx-1-pip-10.1177_17543371221093189 – for Reliability and validity of velocity measures and regression methods to predict maximal strength ability in the back-squat using a novel linear position transducer
sj-xlsx-1-pip-10.1177_17543371221093189 for Reliability and validity of velocity measures and regression methods to predict maximal strength ability in the back-squat using a novel linear position transducer by Jonathan Kilgallon, Emily Cushion, Shaun Joffe and Jamie Tallent in Proceedings of the Institution of Mechanical Engineers, Part P: Journal of Sports Engineering and Technology
Footnotes
Acknowledgements
The authors would like to thank all of the participants who volunteered for this study. The findings from this investigation do not constitute endorsement of any products assessed by the authors or the journal.
Declaration of conflicting interests
The author(s) declared no potential conflicts of interest with respect to the research, authorship, and/or publication of this article.
Funding
The author(s) received no financial support for the research, authorship, and/or publication of this article.
Supplementary materials
All data generated or analysed during this study are included in this published article [and its supplementary information files].
References
Supplementary Material
Please find the following supplemental material available below.
For Open Access articles published under a Creative Commons License, all supplemental material carries the same license as the article it is associated with.
For non-Open Access articles published, all supplemental material carries a non-exclusive license, and permission requests for re-use of supplemental material or any part of supplemental material shall be sent directly to the copyright owner as specified in the copyright notice associated with the article.