
Abstract
There is a lack of research assessing Motion Performance Indicators (MPIs), which have been recently made commercially available. Therefore, this study explored: (1) the influence of incremented exercise on MPIs and; (2) the relationships between MPIs and cycling performance at different intensities during a graded exercise test (GXT) in professional cyclists. Thirty-six professional cyclists performed GXT until exhaustion with their own bikes attached to a cycle ergometer. MPIs were collected using a real-time motion capture system based on inertial measurement units at 100 Hz of sample rate. Data were extracted from intensities of the GXT when lactate thresholds (LT1, LT2) and peak power (POpeak) were determined. Results showed that only Pelvic Angle (p < 0.01, d > 1.15) and Pelvic Rotation (p < 0.01, d > 1.37) were sensitive to increases in exercise intensity (i.e. greater inclination and increased rotation at greater power). Multivariate liner regression analyses showed that a reduced range of movement (ROM) for the upper legs at sub-maximum intensities (LT1 and LT2) was associated with greater power production (r2 > 0.21), whilst a reduced ROM for the right foot was associated with greater POpeak (r2 = 0.20). In conclusion, changes in movement patterns were limited to a greater inclination and rotation of the pelvis at maximum power without changes in other MPIs throughout the GXT. Cyclists who produced greater power presented less ROM for their upper legs at LT1 and LT2 whilst at POpeak and greater power production was moderately associated with less ROM for the right foot. Coaches may be able to use MPI to analyze for excess ROM, particularly at higher exercise intensities, as this seems to increase inefficiencies and limit power production.
Introduction
Numerous studies demonstrate that movement patterns in cycling are sensitive to changes in exercise intensity,1,2 pedaling cadence,3,4 fatigue,5,6 and body position on the bicycle.7–9 However, there is a lack of research assessing wearable Motion Performance Indicators (MPIs), which have been recently made available commercially. Wearable MPIs have been proposed to explain performance and distinguish cyclists’ technique refinement based on movement patterns. Experienced cyclists presented greater consistency (i.e. less variability) in ankle movement than novice cyclists, 10 less hip flexion than non-cyclists 1 and increased lateral inclination and rotation of the spine than recreational cyclists. 11 It is possible that a refined pedaling technique could help to explain better performance in cycling. However, it is known that pedaling technique depends on cycling experience, 12 and the relationship between technique and cyclists’ performance (i.e. if cyclists with better performance present different movement patterns) needs further clarification.
The development of wearable inertial measurement units (IMUs) for the assessment of MPIs has increased access to movement analysis for practitioners. IMU-based devices have lower cost and are portable compared to gold-standard 3D camera-based methods.13–16 Portable IMU-based motion systems have an important advantage in practice, as they allow for tracking cyclists outdoors while providing real-time feedback from torso, knee and ankle angular ranges or motion, in addition to informing on pedaling smoothness. 16 However, little is known about the relationship between these MPIs and cycling performance.
Previous studies on cyclists have examined how body kinematics are affected by the combined fatigue and workload effects, which lead to particular postural adjustments, joint angles, and asymmetries.1,2,5,11,17,18 However, few studies have examined the changes in body kinematics related to physiological events commonly used to prescribe training loads in cycling, such as the heart rate, 2 power output,19,20 or ventilatory thresholds. 1 Moreover, evidence on the relationships between the MPIs provided by IMU-based motion systems 16 and cycling intensity is lacking. Therefore, the aim of this study was to assess the relationships between MPIs and cycling performance at different intensities during a graded exercise test (GXT) in professional cyclists.
Materials and methods
Study design
This is a cross-sectional comparative study on a single cohort of elite cyclists, gathered during teams’ technical stages (December 2019 to February 2020). Participants performed an individualized GXT with their own bikes attached to an ergometer. Workload intensity was determined by estimating ventilatory thresholds (Phase I and Phase II) from blood lactate following standardized procedures. 21 Cycling MPIs were evaluated in real time during the GXT using a worn motion capture system comprising five, three-axis gyroscope and accelerometer sensors synchronized with a camera.
Participants
Thirty-six professional elite cyclists, including 21 men (mean ± SD: age = 23.3 ± 6.3 years, body mass = 66.3 ± 6.9 kg; LT2 = 5.5 ± 0.5 W kg–1) and 15 women (mean ± SD: age = 22.5 ± 8.3 years, body mass = 59.1 ± 8.4 kg; LT2 = 4.5 ± 0.5 W kg–1) volunteered to participate in this study. All cyclists were professionals competing at the international level with 11.1 ± 6.0 years of experience and training routine of 5–7 days per week for 15.9 ± 4.4 h per week. All participants were familiarized with the testing protocols as a part of their training regimen. No physical limitations or musculoskeletal injuries that could affect testing were reported. Participants signed a written informed consent form. The study was conducted in accordance with the Code of Ethics of the World Medical Association (Declaration of Helsinki) and approved by the Local University Ethics Committee.
Individualized maximal graded exercise tests
Participants performed an individualized GXT test following standardized procedures. 21 The GXT started with a 5-min warm-up at the individual workload (15%–20% of the cyclists’ second lactate threshold (LT2), followed by increments of 25 W min–1 until exhaustion. Cyclists completed the tests using their own bicycles attached to a Cycleops Hammer ergometer (CycleOps, Madison, WI, USA), pedaling seated and at self-selected cadence. 22 Heart rate was continuously monitored (Polar Bluetooth H7, Oy, Finland). The mean power output (W) and cadence (rev min–1) were transmitted to a unit display (Garmin Edge 1000; Garmin International, Inc., Olathe, KS, USA) fixed on the handlebars. Intensity thresholds were estimated from blood lactate according to procedures earlier described.21,23 In brief, capillary blood samples were collected every 2 min (i.e. each 50 W increments) to determine two intensities: Lactate threshold (LT1), considered the workload at which lactate starts to increase above resting values, and LT2, as an estimate of the second ventilatory threshold, located at the intensity which causes an increase of 2 mMol L–1 above baseline measurements.
Motion Performance Indicators
A real-time motion capture system (TYPE-R, Leomo, Boulder, CO, USA) based on IMU was used to record the cyclists’ movements at 100 Hz. Five three-axis gyroscope and accelerometer sensors were placed on the cyclists’ pelvis (posterior), right foot and thigh, and left foot and thigh, according to instructions from the manufacturer (Figure 1).
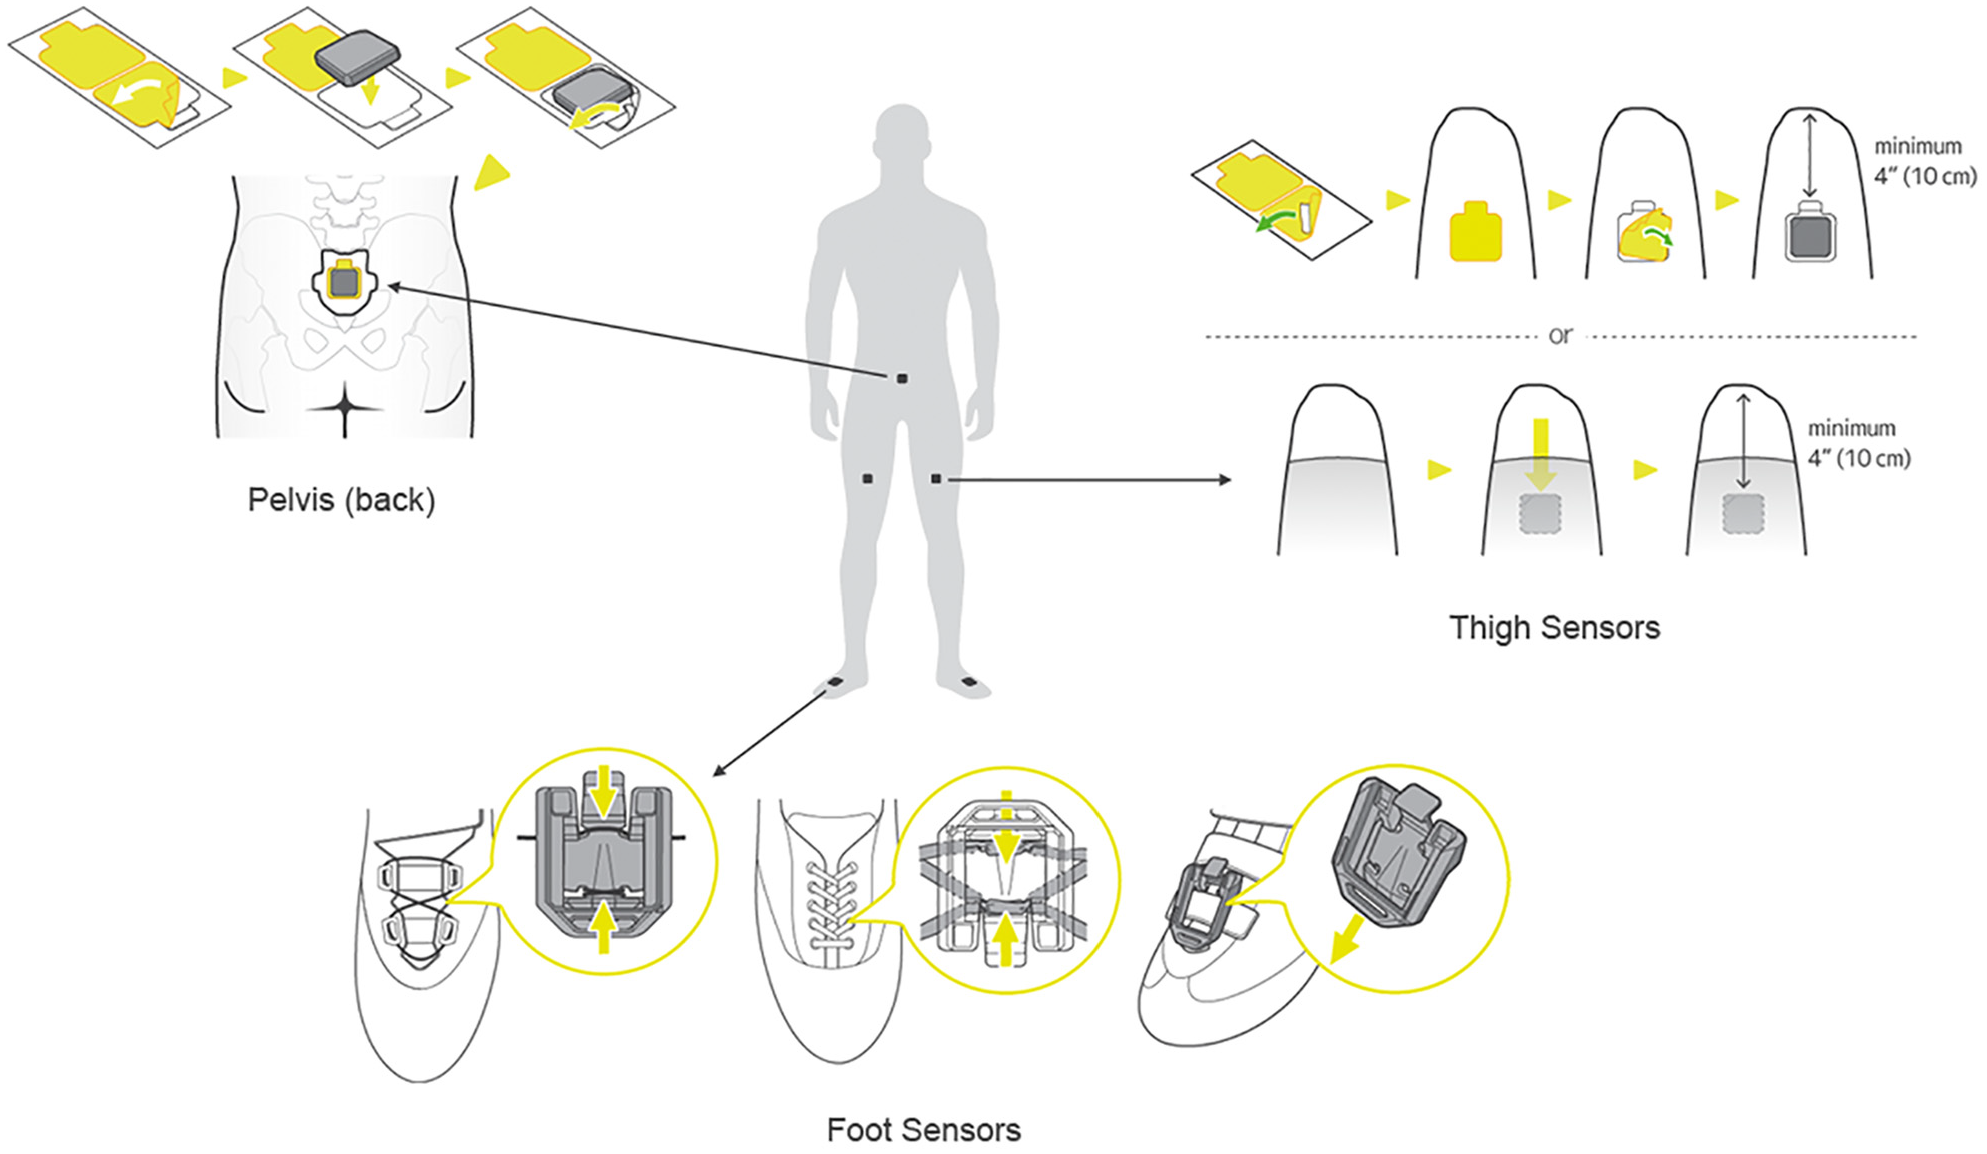
Location of the five motion sensors (used with permission from Leomo, Boulder, CO, USA).
The following cycling MPIs were collected during the GXT: Dead Spot Score (DSS – determines the locations and magnitudes where foot angular velocity deviates from a sinewave curve, lacking smoothness); Foot Angular Range (Foot AR – angular range of motion of the foot); Foot Angular Range (Foot AR Q1 – extracts the foot angular range for the propulsive phase of the crank cycle, 12 o’clock to 3 o’clock position); Leg Angular Range (Leg AR – angular range of motion for the upper leg, thigh); Pelvic Angle (mean angle of the pelvis sensor in the sagittal plane); Pelvic Rock (mean angle of the pelvis sensor in the coronal plane); and Pelvic Rotation (mean angle of the pelvis sensor in the transverse plane).
Raw data were exported as CSV files and analyzed using customized codes in MATLAB (R2020a; MathWorks, Natick, MA, USA). This program allowed for attenuation of fluctuations in angular data using a moving average function with a window of five samples. After that, mean values were calculated from ±15 s of data from the 30 s time stamp of the step test to ensure that earlier and later portion of each step were removed from the analysis. Data were extracted from intensities of the GXT when LT1, LT2, and peak power (POpeak) were determined.
Statistical analysis
Normality of data distribution was analyzed using Shapiro-Wilk’s tests. Comparisons of differences in angular data between LT1, LT2, and POpeak were performed using repeated measures ANOVAs, followed by post-hoc tests using Holm’s correction for multiple comparisons whenever main effects were observed. For data breaching normal distribution, Friedman’s tests were employed, followed by Conover’s post hoc corrections. Pairwise differences were also compared using Cohen’s 24 effect sizes (d), which were ranked as trivial (0–0.20), small (0.20–0.50), moderate (0.50–0.80), and large (>0.80). In order to assess which of the MPIs could help explain cycling performance in the GXT, three Stepwise Multivariate Linear Regressions were performed, one for each exercise intensity (i.e. LT1, LT2, and POpeak) using power output as the dependent variables and the MPIs as independent variables. Statistical analyses were performed in JASP (https://jasp-stats.org/). Correlation coefficients were ranked according to Dancey and Reidy 25 (i.e. r2 = 1.0 indicates perfect association, r2 between 0.82 and 0.99 indicates a very strong association, r2 between 0.48 and 0.81 indicates strong association, r2 between 0.16 and 0.47 indicates moderate association, and r2 less than 0.15 indicates small to no association).
Results
Power outputs at LT1, LT2 and POpeak were 215 ± 55, 324 ± 61, and 378 ± 63 W, respectively. A main effect from increments in power output was detected by the ANOVA for Foot AR right (p = 0.04), but no difference was observed in comparison between exercise intensities. Pelvic angle was reduced (i.e. greater inclination for the pelvis) at POpeak compared to LT1 (p < 0.01, d = 1.48) and LT2 (p < 0.01, d = 1.15). Pelvic rotation was increased at POpeak compared to LT1 (p < 0.01, d = 1.86) and LT2 (p < 0.01, d = 1.37). No effect from exercise intensity was observed for left leg DSS (p = 0.63), right leg DSS (p = 0.65), Foot AR left (p = 0.08), Leg AR left (p = 0.36), Leg AR right (p = 0.16), foot AR Q1 left (p = 0.07), foot AR Q1 right (p = 0.18), and pelvic rock (p = 0.76), as illustrated in Figure 2.
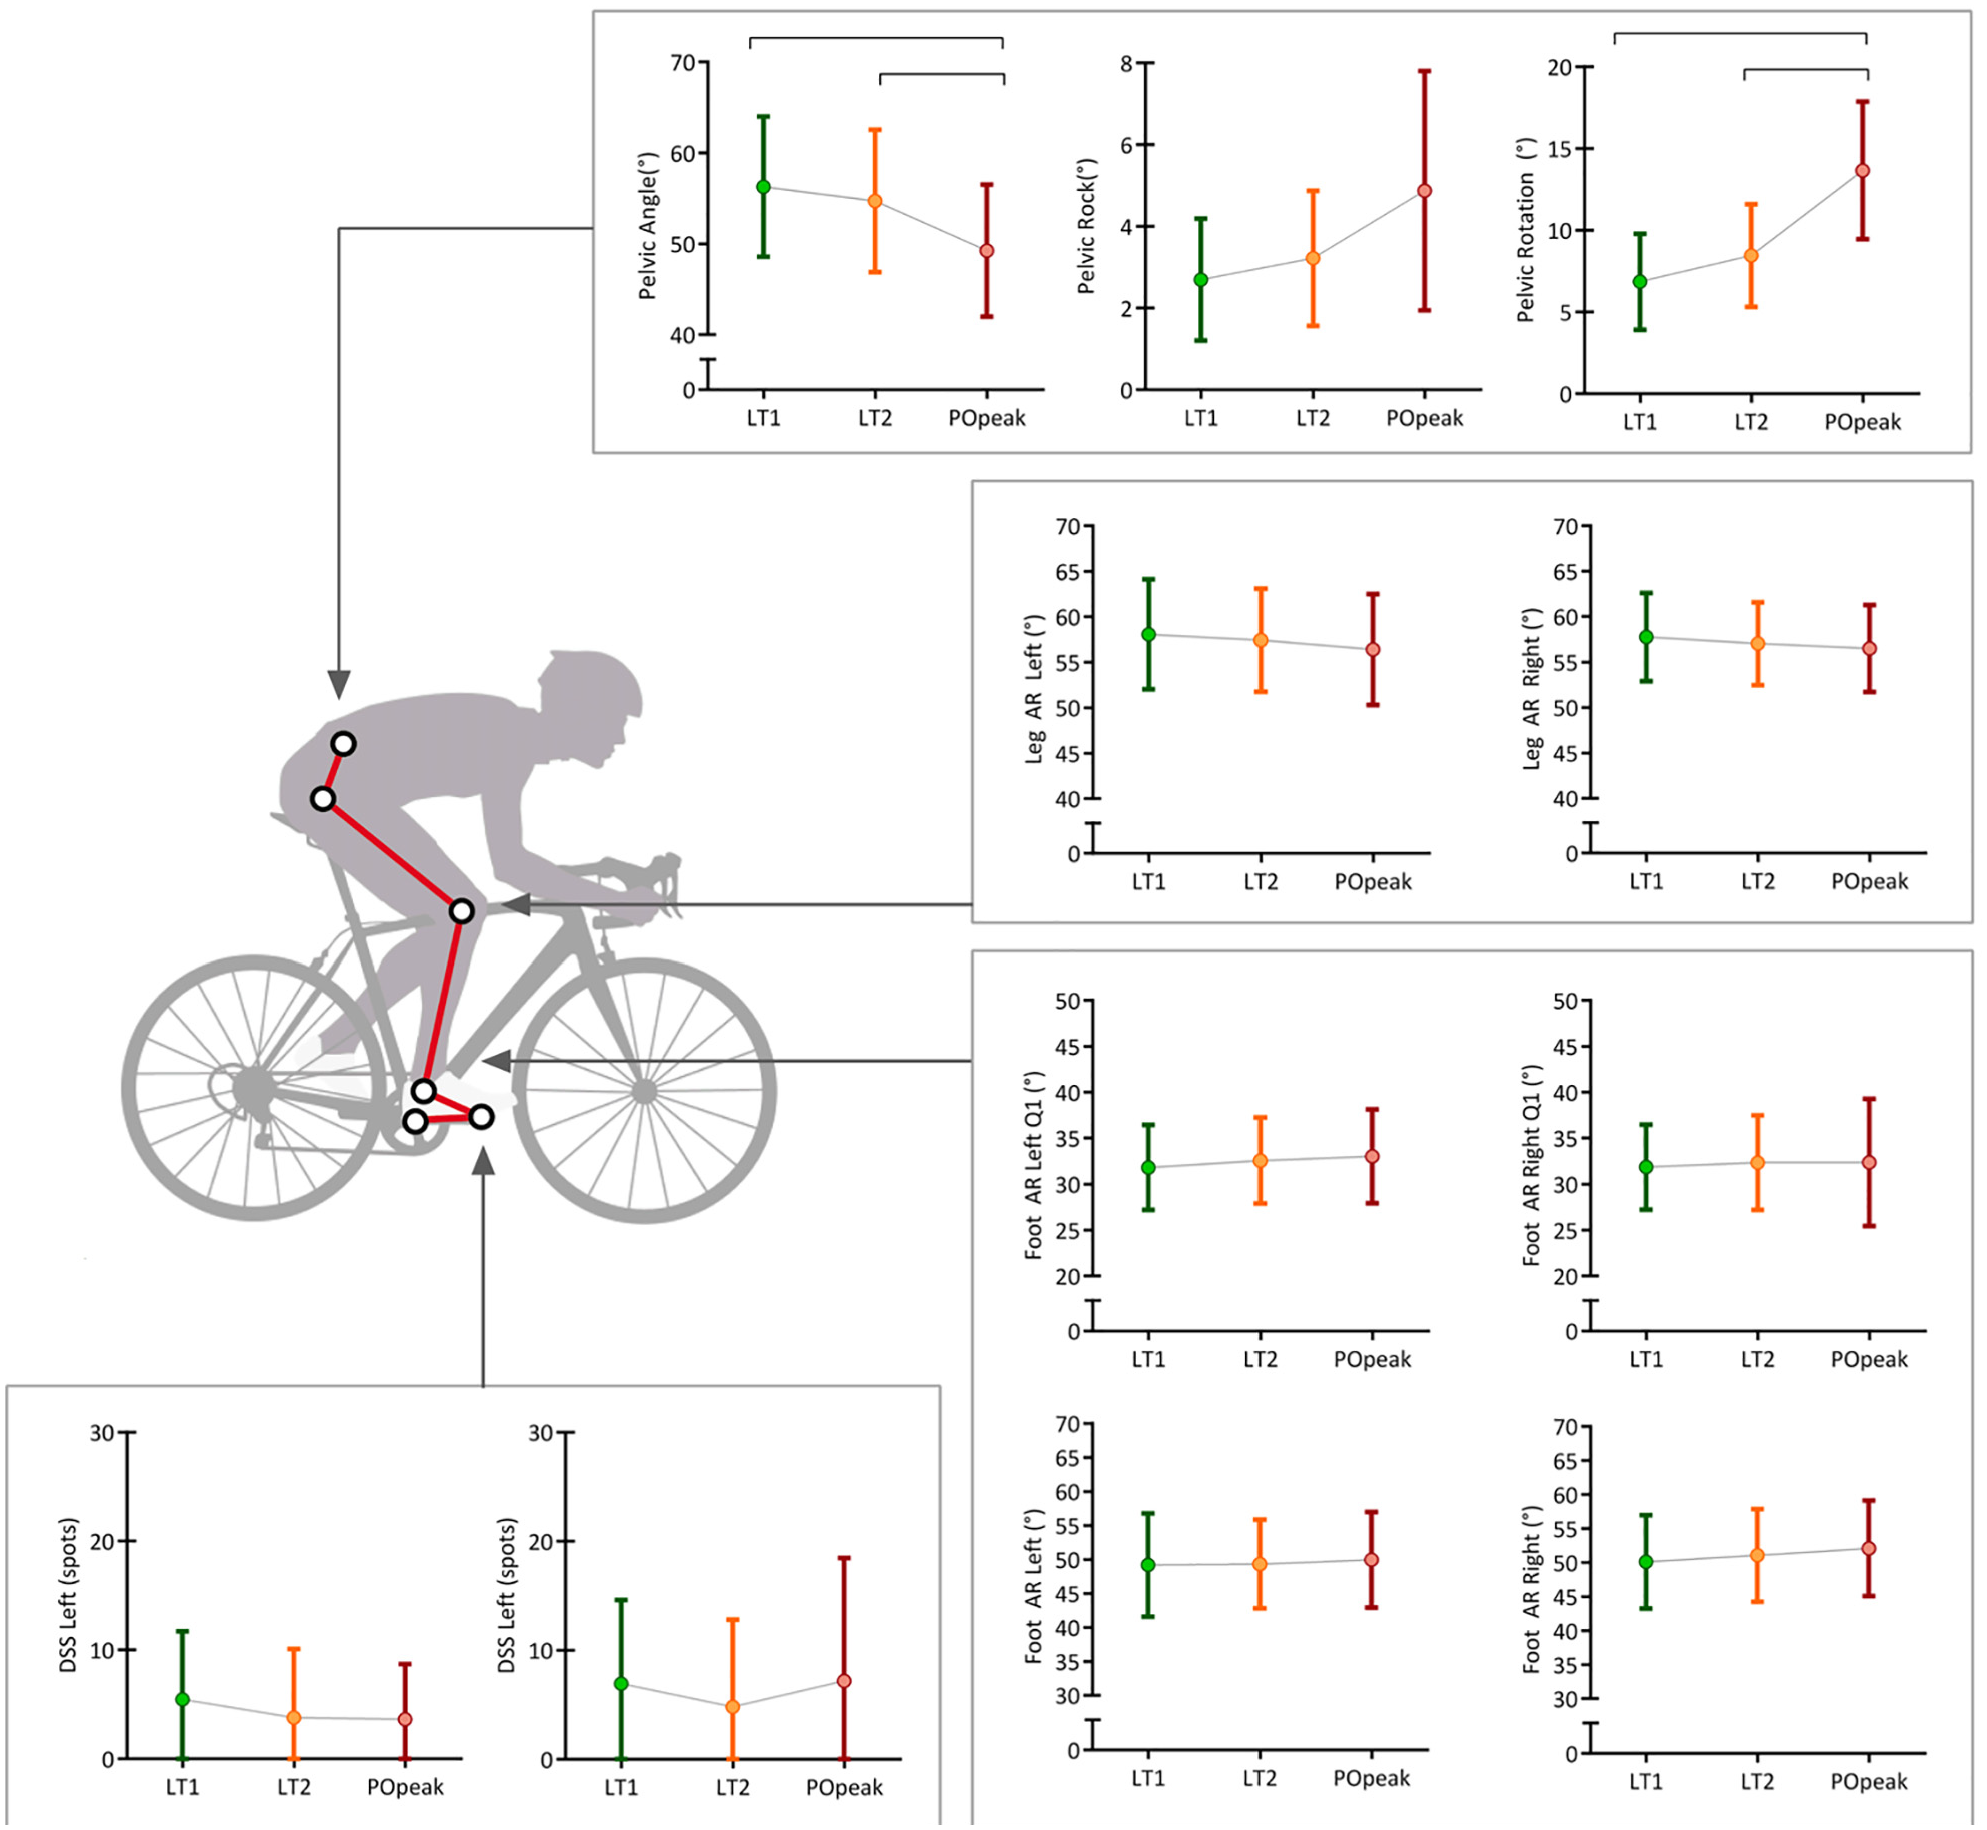
Changes in Motion Performance Indicators (MPIs) during the three exercise intensities. Square brackets show significant changes based on repeated-measures ANOVA. Data are means (markers) and SD (error bars).
Linear regression analysis (Figure 3) revealed that greater power output was moderately associated with reduced right Leg AR at LT1 (r2 = 0.21; p < 0.01). At LT2, greater power output was moderately associated with reduced left Leg AR (r2 = 0.22; p < 0.01). At POpeak, greater power output was strongly associated with less right Foot AR (r2 = 0.20, p = 0.01).
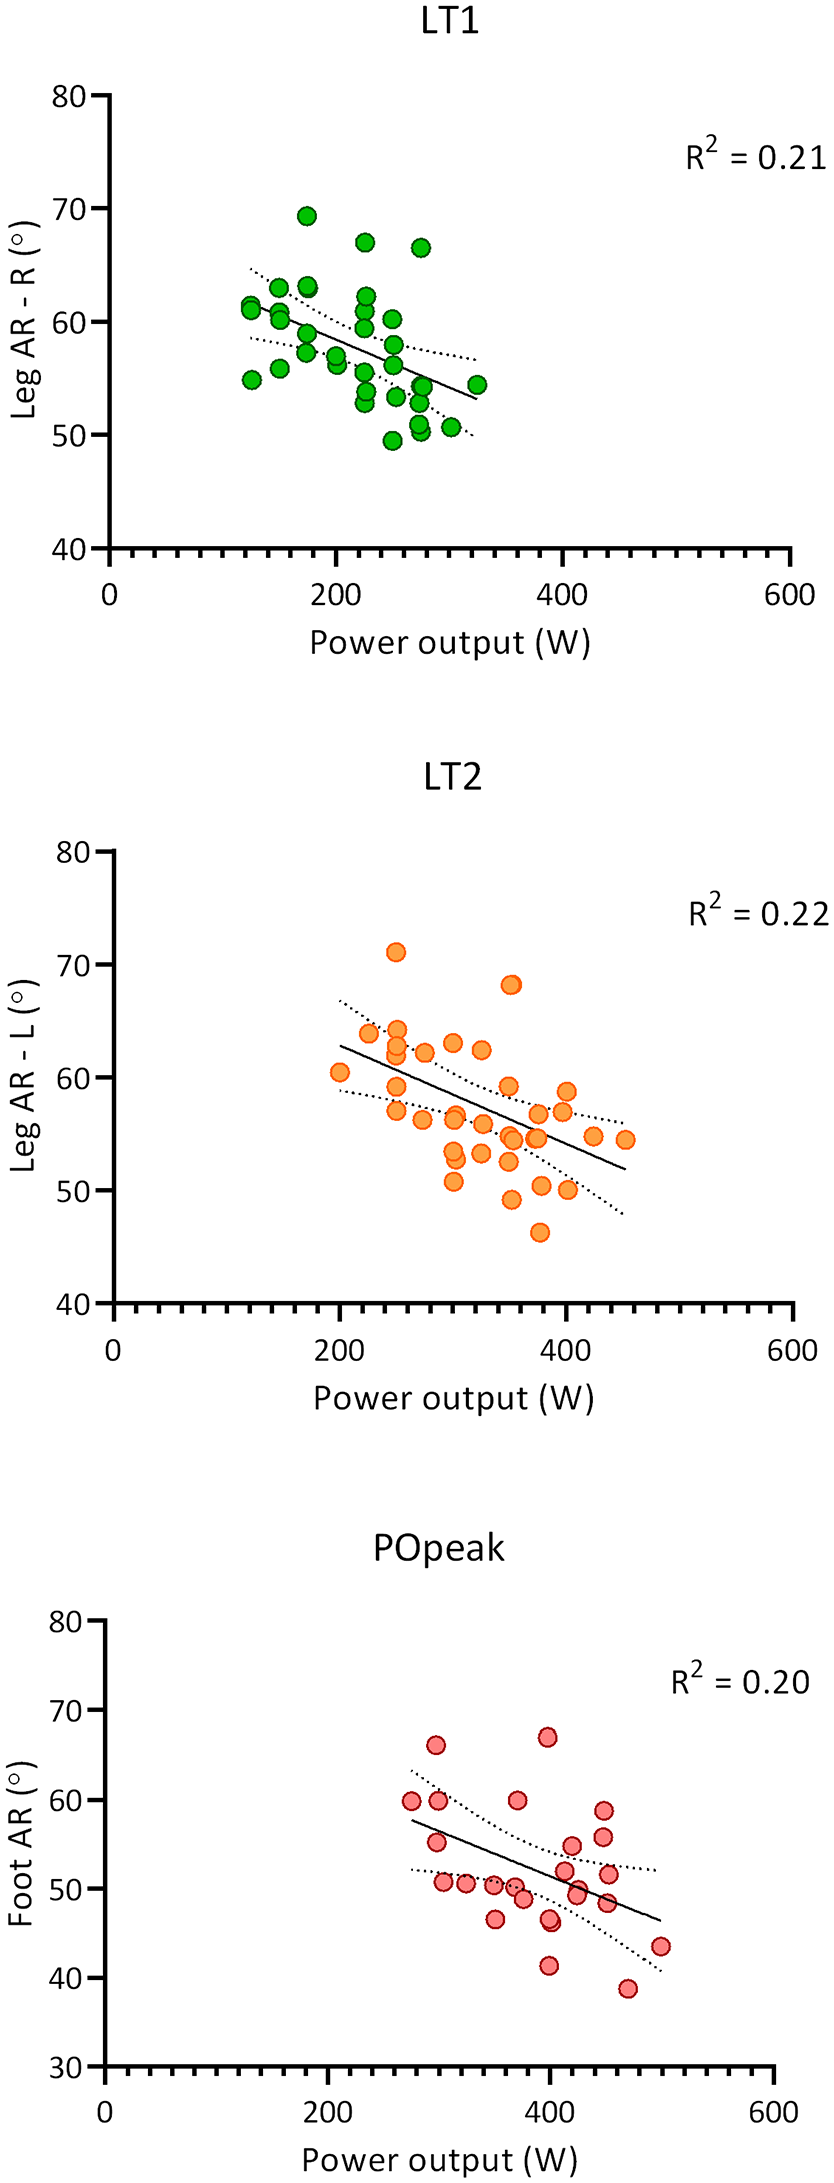
Linear regression analysis showing significant relationships of Motion Performance Indicators (MPIs) during the three exercise intensities.
Discussion
This study compared the influence of increasing exercise intensity on MPIs and assessed the relationships between these MPIs and cycling performance during a GXT. It was observed that only Pelvic Angle and Pelvic Rotation were sensitive to increases in exercise intensity (i.e. greater inclination and increased rotation at greater power). It was also observed that a reduced ROM for the upper legs at sub-maximum intensities (LT1 and LT2) was associated with greater power production, whilst a reduced ROM for the right foot was associated with greater POpeak. These findings are novel because the sensitivity of MPIs in cycling has not been explored previously and the responses from professional cyclists to changes in exercise intensity has not been reported. 12
During a time to exhaustion protocol at constant power output, Dingwell et al. 26 observed that cyclists reduce their torso inclination as their fatigue state increases. Similarly, cyclists presented increased forward displacement on the saddle when performing a GXT, 1 which is in line with data from the current study. Thus, fatigue and intensity alter upper body movement of cyclists. Interestingly, a study looking at torso acceleration observed an increase in the mediolateral component during an adapted graded exercise test, suggesting rotation of the torso at higher intensities. 13 During a sustained exercise test (i.e. 60 min at 88% of LT2), cyclists presented increased lateral movement of the torso, which also suggests an increased engagement of the upper body segments when cycling at increased fatigue state. 27 Therefore, the data from the present study demonstrated that the cyclists could maintain their movement patterns mostly unchanged during a GXT. They produced an increased engagement of their upper body at greater levels of fatigue and exercise intensity, results that should be contrasted with a sample of lower-level cyclists to assess if these conclusions can be generalized. Future studies should compare cyclists with different levels of skills and experience, and additionally analyze if upper body movements actually remain unchanged when intensity and fatigue increase concurrently in these athletes given the measurements in the present study were limited to the pelvis.
The proposed analysis of the dead score spots could be related to changes in kinematics of the ankle and foot. Based on information provided by the manufacturers, this outcome seems to provide a score based on how large the foot angular velocity deviates from a sinewave. The absence of changes in this outcome is contrary to findings from prior studies, which observed larger ROM for the ankle joint at increased fatigue states using different testing protocols.5,20 As previously noted, professional cyclists assessed in the current study may have presented a consistent technique, which remained largely unchanged during the GXT. However, it is critical to assess if changes in pedal forces, as explored in other studies,20,28 are also observed in elite cyclists. Interestingly, Garcia-Lopez et al. 12 did not find differences in crank torque for professional cyclists pedaling at 200, 250, and 300 W, which provides further support to the hypothesis that cyclists with better performance may be able to sustain unaltered technique when the intensity increases concurrently.
Data from the current study suggest that reduced ROM for the upper leg seems to contribute to better aerobic performance in cycling. At submaximal loads, a reduced ROM for the right and left upper legs was moderately associated with greater power at LT1 and LT2. Likewise, at POpeak, reduced right foot motion in the sagittal plane (i.e. less ankle ROM) was moderately related to increased power production. These outcomes suggest that in order to sustain greater power, it seems beneficial to limit ROM, particularly at the foot and ankle. This finding is somehow conflicting with data from Kautz et al. 29 who showed that cyclists of similar performance can present two main ankle technique styles. They observed that one technique involved limited ROM and the other technique relied on increased ROM for the foot and ankle when exercise intensity was increased. The implications of these two types of techniques involved greater pushing for the rigid ankle group vs. increased circling for the group with larger ROM. 29 Further data is required to ascertain if findings from the current study represent any difference in pedal forces or joint kinetics. In addition, given that significant relationships were limited to the right foot, it is important to explore if inter-limb asymmetries in ankle motion or lower limb preference may play a role in cycling performance or power production.
During fatigue, it has been observed that cyclists tend to increase ankle ROM to sustain torque production at the ankle joint.5,6 In addition, cyclists with less experience have been shown to produce movement with greater ROM. 10 The implications seem to suggest a limited magnitude of work produced at the ankle joint. 7 The reason for this loss in work could be that, with increased ROM, the stretch-shortening component observed in the ankle joint results in less time for the muscles to cover a greater range of muscle stretching and shortening. Sanderson et al. 30 suggested that when the ankle muscles operate in a more constrained range of shortening velocities (i.e. less ROM), they may be able to maximize force production. This may have been reflected in the decrease in ankle joint contribution when pedaling cadence was increased to >80 rpm compared to <50 rpm. 31 However, further studies are required to determine if similar responses are observed when ankle ROM is increased and decreased in a controlled trial.
This study was limited to some extent. Even though the use of GXT allowed for analysis of movement pattern at individualized exercise intensities, the separate contributions from increases in load and fatigue could not be determined. Therefore, future studies should assess loads in a randomized order with rest time interspaced to ensure that fatigue effects are minimized and to measure MPIs during fatigue protocols (e.g. time to exhaustion). The validity of MPIs derived from IMUs still requires further analysis by direct comparison with optoelectronic motion capture systems (i.e. gold-standard). More specifically, it is important to determine how well segmental ROM determined by IMUs truly detect body segmental movements. Prior studies utilizing IMUs observed errors of 0.4–8.8° for pelvis orientation, 0.2– 9.3° for hip angles, 1–11.5° for knee angles, and 0.4–18.8° for the ankle joint in varied movements. 32 With this in mind, future studies should compare IMU derived measurements with gold-standard motion capture systems to determine validity and reliability of MPIs in cycling.
In conclusion, changes in movement patterns were limited to a greater inclination and rotation of the pelvis at maximum power without changes in other MPIs throughout the GXT. Cyclists who produced greater power presented less ROM for their upper legs at LT1 and LT2, whilst at POpeak, greater power production was moderately associated with less ROM for the right foot. Coaches may be able to use MPI to detect excessive ROM, particularly at higher exercise intensities, as this seems to increase inefficiencies and limit power production.
Footnotes
Declaration of conflicting interests
The author(s) declared no potential conflicts of interest with respect to the research, authorship, and/or publication of this article.
Funding
The author(s) received no financial support for the research, authorship, and/or publication of this article.