
Abstract
Background:
Myocardial infarctions (MIs) are the leading cause of death in the United States (US). Differences in MI mortality rates exist between rural and urban areas in the US. Early recognition of MI symptoms can lead to receiving prompt lifesaving treatment. In this study, we identified the influence of living in a rural area, rurality, on disparities in MI symptom awareness across the US.
Methods:
We examined 2007 and 2009 Behavioral Risk Factor Surveillances System survey data using logistic regressions to model the impact of rurality on MI symptom awareness while controlling for sociodemographic and MI clinical factors. From the results of these models, we created a type of marginal probability, known as average adjusted predictions (AAPs) and the difference in AAPs, called average marginal effects (AMEs), to determine patterns of awareness for each MI symptom between rural, suburban, and urban areas.
Results:
We found that there were similar odds and probabilities of being aware of all five MI symptoms between rural, suburban, and urban areas, although rural residents consistently had a slightly higher odds and probability of being aware of all five MI symptoms compared with suburban and urban residents. Rural, suburban, and urban residents had the highest probability of being aware of chest pain/discomfort (95.5–96.1%) and the lowest probability of being aware of jaw/back/neck pain (68.6–72.0%). After adjustment, more than 25% of rural, suburban, and urban residents were found to be unaware that jaw/back/neck pain and feeling weak/light-headed/faint were symptoms of MI. AMEs were greatest for all areas for jaw/back/neck pain (−3.5% to −3.2%) and smallest for chest pain/discomfort (−0.6% to −0.2%).
Conclusions:
The study’s results highlight the need to increase awareness of the MI symptoms of jaw/back/neck pain and feeling weak/light-headed/faint to shorten hospital delay and time to treatment, especially for rural areas where cardiovascular disease mortality is high.
Introduction
Approximately 735,000 myocardial infarctions (MIs) occur annually in the United States (US), making it the country’s leading cause of death. 1 In terms of hospitalization expenses and loss of productivity, cardiovascular disease (CVD) costs the US an estimated US$555 billion each year with this number expected to rise to US$1.1 trillion by 2035. 2 Additionally, people who suffer an MI may experience significant morbidity and are at increased risk for repeated MIs following the event.3,4 The distribution of common MI risk factors (obesity, smoking) and mortality in the US varies considerably between rural and urban areas.5–9 For instance, 29.6% and 39.6% of the rural US population regularly smokes and is obese compared with 24.2% and 33.4% of the urban US population.7,9 Even within the same state, the severity of MI mortality can differ greatly between rural and urban areas; a study examining 30-day mortality after an MI conducted in Nebraska showed that people who lived in rural areas were 43% more likely to die compared with people who resided in urban areas.10–12 The high prevalence of MI risk factors coupled with greater MI mortality in rural parts of the US makes it important to find ways to reduce MI deaths in these areas.9,11
For a person suffering an MI to have the best possible outcome, they must receive treatment as quickly as possible after an MI’s onset. 13 There is substantial evidence linking increased awareness of MI symptoms with timely treatment and improved outcomes.14–23 Therefore, it is of concern that more than 36% of adults in the US do not recognize two of the five Centers for Disease Control and Prevention (CDC)-determined MI symptoms. 24 While several studies have identified the role of sociodemographic and MI clinical factors in shaping the awareness of MI symptoms, little is known about the influence of living in a rural area (rurality), on the awareness of MI symptoms across the US.14,22,23,25–28 Existing work that examines the influence of rurality on MI symptoms in the US is limited by small sample size, lack of adjustment for MI clinical factors, inability to determine awareness of individual MI symptoms after accounting for sociodemographic factors, and does not isolate the influence of rurality from other factors that act upon the awareness of MI symptoms.24,29
In this study, we evaluated the influence of rurality on the awareness of MI symptoms in the US using a large nationally representative dataset. Through regression models, we examined associations between rurality and awareness of each of the five CDC-mandated MI symptoms, while controlling for important sociodemographic and MI clinical factors. We then used marginal probabilities to go beyond rurality and MI symptom awareness associations and determined the isolated impact of rurality on each individual MI symptom. The study findings provide a comprehensive understanding of the impact of rurality on the awareness of MI symptoms across the US and offer insights on specific MI symptoms that should be targeted for future MI educational interventions.
Methods
Data source
The Behavioral Risk Factor Surveillances System (BRFSS) is a nationwide landline- and cell-phone-conducted survey that is administered by the CDC and carried out by each state’s health department. 30 BRFSS surveys conducted prior to 2011 only contacted participants through landlines, while surveys conducted from 2011 onwards contacted participants through both landlines and cell phones. 30 Through extensively validated questions, the BRFSS elicits information on a survey participant’s sociodemographic background, health behaviors, and chronic health conditions.31–33 The BRFSS performs oversampling in certain parts of the US to ensure that minority groups and rural residents with limited telephone and cell phone access are well represented. 34 BRFSS surveys are a vital tool for US health-related research and can be accessed for use at the CDC’s website (www.cdc.gov/brfss/annual_data/annual_data.htm). 30 As the BRFSS is a publicly available secondary data source where all identifying information has been removed, our study was exempt from ethics approval and informed consent was not needed. 30
Our study population comprised combined 2007 and 2009 BRFSS survey participants ⩾18 years who responded to the MI symptom awareness questions contained in the survey’s heart attack and stroke module.31,35 Even though these are not the most recent BRFSS survey years, they are the most recent BRFSS survey years that contained questions on MI symptom awareness with the same weighing structure.36,37 The most recent BRFSS surveys from 2012 to 2017 do not include questions on MI symptom awareness.37–42 Although the 2011 BRFSS survey does have MI symptom awareness questions, its weighting scheme differs from those of the 2007 and 2009 BRFSS surveys, making it difficult to combine datasets.34,43 The decision was made to not use the 2011 BRFSS survey alone because there would not have been enough people for adequately powered analyses. 43 In addition, we chose to exclude the 2008 BRFSS as it did not contain all the covariates needed for model adjustment. 44 By choosing the 2007 and 2009 BRFSS surveys, we were able to have a large enough study population for our analyses, consistent weighting throughout our data, and a dataset that included all the covariates needed for the study’s adjustment process.32,33
Outcomes and covariates
The study’s outcomes consist of levels of awareness of each of the five MI symptoms found in the BRFSS’s heart attack and stroke module. 34 In the module, a set of five questions assess a person’s ability to recognize key MI symptoms: (1) ‘Do you think pain or discomfort in the jaw, neck, or back are symptoms of a heart attack?’ (HASYMP1); (2) ‘Do you think feeling weak, light-headed, or faint are symptoms of a heart attack?’ (HASYMP2); (3) ‘Do you think chest pain or discomfort are symptoms of a heart attack?’ (HASYMP3); (4) ‘Do you think pain or discomfort in the arms or shoulder are symptoms of a heart attack?’ (HASYMP5); and (5) ‘Do you think shortness of breath is a symptom of a heart attack?’ (HASYMP6). 34 We did not include ‘Do you think sudden trouble seeing in one or both eyes is a symptom of a heart attack?’ (HASYMP4) as in other rurality and MI symptom awareness work because HASYMP4 is an incorrect symptom that is used as a ‘dummy’ question by the CDC to determine whether BRFSS participants will respond ‘yes’ to every MI symptom in the module.24,38 We excluded HASYMP4 because we wanted our study to only reflect awareness of actual MI symptoms. The BRFSS categorizes responses to these five questions as either ‘yes’, ‘no’, ‘don’t know/not sure’, or ‘refused’. 34 Following a precedent set by CDC-conducted analyses of BRFSS data, we excluded people who responded either ‘don’t know/not sure’ or ‘refused’ to any of these five questions but did not further exclude people if they had missing covariate values.39,40 As the heart attack and stroke module is optional, not every state completed it.31,35 The states included in our study were Alabama, Arizona, Arkansas, Connecticut, Florida, Georgia, Idaho, Indiana, Kentucky, Louisiana, Minnesota, Mississippi, Missouri, Montana, North Carolina, North Dakota, South Carolina, Oklahoma, Virginia, West Virginia, Wisconsin, and Wyoming.31,35
Sociodemographic (age, sex, race, household income, education, marital status, healthcare coverage, personal doctor or healthcare provider) and MI clinical factors [body mass index (BMI), hypertension, smoking status, heavy drinking, physical activity] were included in the study to allow for adjustment during analyses. We included sociodemographic factors and MI clinical factors because there is a large body of work indicating associations between these particular factors and health awareness and literacy.1,27,41–67 Failure to adjust for these sociodemographic and MI clinical factors may produce biased study estimates.68,69 Categorization of all sociodemographic and MI clinical factors were based on the 2007 and 2009 BRFSS codebooks with collapsing of some variable categories to ensure models did not become too sparse: age (18–24, 25–34, 35–44, 45–54, 55–64, 65 years or older); sex (female, male); race (White, Black, Hispanic); household income (<US$15,000, US$15,000 to <US$25,000, US$25,000 to <US$35,000, US$35,000 to <US$50,000, >US$50,000); education (never attended school/only kindergarten, elementary, some high school, high-school graduate, some college or technical school, college graduate); marital status (married, divorced, widowed, separated, never married, a member of an unmarried couple); healthcare coverage (yes, no); personal doctor or healthcare provider (yes, only one; yes, more than one; no); BMI [neither overweight nor obese (BMI < 18.50 or 18.50 ⩽ BMI < 25.00), overweight (25.00 ⩽ BMI < 30.00), obese (BMI ⩾ 30.00)]; hypertension (yes, no); smoking status (everyday smoker, someday smoker, former smoker, nonsmoker); heavy drinking [yes (>2 drinks/day for men and >1 drink/day for women), no (<2 drinks/day for men and <1 drink/day for women)]; and physical activity (meet recommendations for moderate and vigorous physical activity, meet recommendations for vigorous physical activity, meet recommendations for moderate physical activity, insufficient activity to meet moderate or vigorous recommendations, no moderate or vigorous physical activity).35,36
To distinguish between rural, suburban, and urban areas and to explore the impact of rurality on MI symptom awareness, we relied on the BRFSS’s Metropolitan Status Code (MSOCDE) variable which is derived from the Metropolitan Statistical Areas (MSA) classification system. 31,35 The MSA system comes from the US Office of Management and Budget and is the standard when designating metropolitan and micropolitan areas for the US Census. 70 We defined MSCODE5 (not in an MSA) areas as rural, MSCODE3 (inside a suburban county of the MSA) areas as suburban, and MSCODE1 (in the center city of an MSA) and MSCODE2 (outside the center city of an MSA but inside the county containing the center city) areas as urban. 36 MSCODE 4 (in an MSA that has no center city) was not used because preliminary analyses revealed that none of these areas remained after excluding people who did not answer ‘yes’ or ‘no’ to all five MI symptom awareness questions.
Bivariate analyses
We conducted bivariate analyses between individual sociodemographic and MI clinical factors included in the study and each MI symptom awareness outcome. Bivariate analyses were also used to examine the percentage of correct (‘yes’ response) and incorrect answers (‘no’ response) to each MI symptom awareness outcome by MSCODE. All bivariate analyses were carried out using Stata 15 software. 71
Statistical modelling
We created five logistic regression models, one for each of the five MI symptom awareness measures, to examine associations [odds ratios (ORs)] between rurality and MI symptom awareness. The complex survey design and unequal weighting of BRFSS data necessitated the use of survey weights in the logistic regression models in order to account for these data features.31,35 Covariates included in the five models were age, sex, race, household income, education, marital status, healthcare coverage, personal doctor or healthcare provider, BMI, hypertension, smoking status, heavy drinking, and physical activity. For covariates with missing values, we created and included an indicator variable for the ‘missing’ category in the logistic models. Results for this indicator variable are not presented since they offer limited practical interpretation. All logistic models were run in Stata 15. 71
Marginal probabilities
We built on associations explored in the five logistic models by creating average adjusted predictions (AAPs), a type of marginal probability, which can be thought of as an adjusted prevalence.72–75 AAPs attempt to remove the influence of other sociodemographic and MI clinical factors on MI symptom awareness besides the one factor under study by considering a hypothetical respondent population with no variation in the factor being considered but retaining original values for other sociodemographic and MI clinical factors. 72 For example, the rural AAP is the predicted MI symptom awareness probability where the survey population was hypothetically all residing in rural areas and had original values for all other covariates. 72 In addition to the AAPs, we also calculated urban/suburban versus rural AAP differences, which are called average marginal effects (AMEs). 72 An AME is the difference in MI symptom awareness for a particular MI symptom between a hypothetically all-urban/suburban survey population and a hypothetically all-rural one. 72 The margins command in Stata was used to generate AAPs and AMEs from the logistic model results.71,72
Results
Our study comprised 863,519 people, the majority of whom were ⩾45 years (67.9%), male (60.6%), White (76.2%), had an income ⩾US$35,000 (54.9%), were high-school graduates or higher (89.5%), married (64.7%), had healthcare coverage (88.2%), and had a personal doctor or healthcare provider (77.3%; Table 1). In terms of MI clinical factors, a substantial proportion of the study population was overweight/obese (61.2%), did not have hypertension (65.4%), were nonsmokers (54.3%), did not drink heavily (92.0%), and did not meet guidelines for physical activity (35.5%) in the study. People in the study mainly resided in urban areas (61.63%), specifically in the center city of an MSA (MSCODE1) and outside the center city of an MSA but inside the county containing the center city (MSCODE2). In unadjusted bivariate analyses of MI symptom awareness by MSCODE, we observed that the percentage of people who correctly recognized the MI symptoms ranged 61.0–71.7% for awareness of jaw/back/neck pain as an indicator of a heart attack (HASYMP1), 71.8–73.3% for awareness of feeling weak/light-headed/faint as an indicator of a heart attack (HASYMP2), 95.1–95.7% for awareness of chest pain/discomfort as an indicator of a heart attack (HASYMP3), 91.4–92.9% for awareness of pain or discomfort in arms/shoulder as an indicator of a heart attack (HASYMP5), and 90.4–91.4% for awareness of shortness of breath as an indicator of a heart attack (HASYMP6; Table 2). Except for awareness of chest pain/discomfort as an indicator of a heart attack and awareness of pain or discomfort in the arms/shoulder as an indicator of a heart attack, a higher percentage of rural residents were able to correctly identify MI symptoms compared with urban residents.
Sociodemographic and MI clinical factors among 2007 and 2009 behavioral risk factor surveillance survey participants (n = 863,519).

BMI, body mass index; MI, myocardial infaction; MSA, Metropolitan Statistical Area.
Unadjusted percetnage of correct and incorrect recognition of MI symptoms by metropoiltiation status code.

MI, myocardial infaction; MSA, Metropolitan Statistical Area.
Compared with people who lived in suburban and urban areas, people who lived in rural areas had a slightly higher odds of being aware of all five MI symptoms (Table 3). However, these results were not statistically significant (p < 0.05) for chest pain/discomfort. With rural areas as the reference, the odds of awareness for all five MI symptoms for suburban and urban areas ranged from 0.81 to 0.95. People in suburban areas had the highest odds of awareness for chest pain/discomfort (0.90) and pain or discomfort in arms/shoulder (0.90) and the lowest odds for shortness of breath (0.81). On the other hand, people in urban areas tended to have the highest odds of awareness for chest pain/discomfort (0.86 and 0.95) and the lowest odds for jaw/back/neck pain (0.83 and 0.83). We also observed that being female, White, having healthcare coverage, having a personal doctor or healthcare provider, being obese, having high blood pressure, and not being a heavy drinker were associated with higher levels of awareness for all five MI symptoms.
Associations between sociodemographic and MI clinical factors and self-reported MI symptoms awareness in 2007 and 2009 behavioral risk factor surveillance surveys. a

Model adjusted for age, sex, race, household income, education, marital status, healthcare coverage, personal doctor or healthcare provider, BMI, hypertension, smoking status, heavy drinking, and physical activity.
BMI, body mass index; MI, myocardial infaction; MSA, Metropolitan Statistical Area; ref. reference group.
Using AAPs, we determined that people living in rural areas had the highest probability of being aware of all five MI symptoms compared with people living in suburban and rural areas (Table 4). People residing in rural, suburban, and urban areas all had the highest adjusted probability of being aware of chest pain/discomfort [rural (MSCODE5) AAP: 96.1%, suburban (MSCODE3) AAP: 95.7%, and urban (MSCODE1 and 2) AAPs: 95.5% and 95.9%] and the lowest adjusted probability of being aware of jaw/back/neck pain [rural (MSCODE5) AAP: 72.0%, suburban (MSCODE3) AAP: 68.8%, and urban (MSCODE1 and 2) AAPs: 68.6% and 68.6%]. We also found that more than 25% of rural, suburban, and urban residents were unaware that jaw/back/neck pain and feeling weak/light-headed/faint were MI symptoms. The AMEs revealed that there was not a large difference in adjusted probabilities of awareness for all five MI symptoms between rural, suburban, and urban areas as AMEs ranged from −3.5% to −0.2%. In addition, the MI symptom that people in all areas had the lowest adjusted probability of being aware of (jaw/back/neck pain), was the symptom with the largest AMEs (−3.5% to −3.2%), whereas chest pain/discomfort, the MI symptom people had the highest awareness of, had the smallest AMEs (−0.6% to −0.2%).
AAPs (%) for different urban/rural categories and AMEs (%) of MSCODE 1, 2, 3 versus MSCODE 5 with respect to self-reported MI symptom awareness.
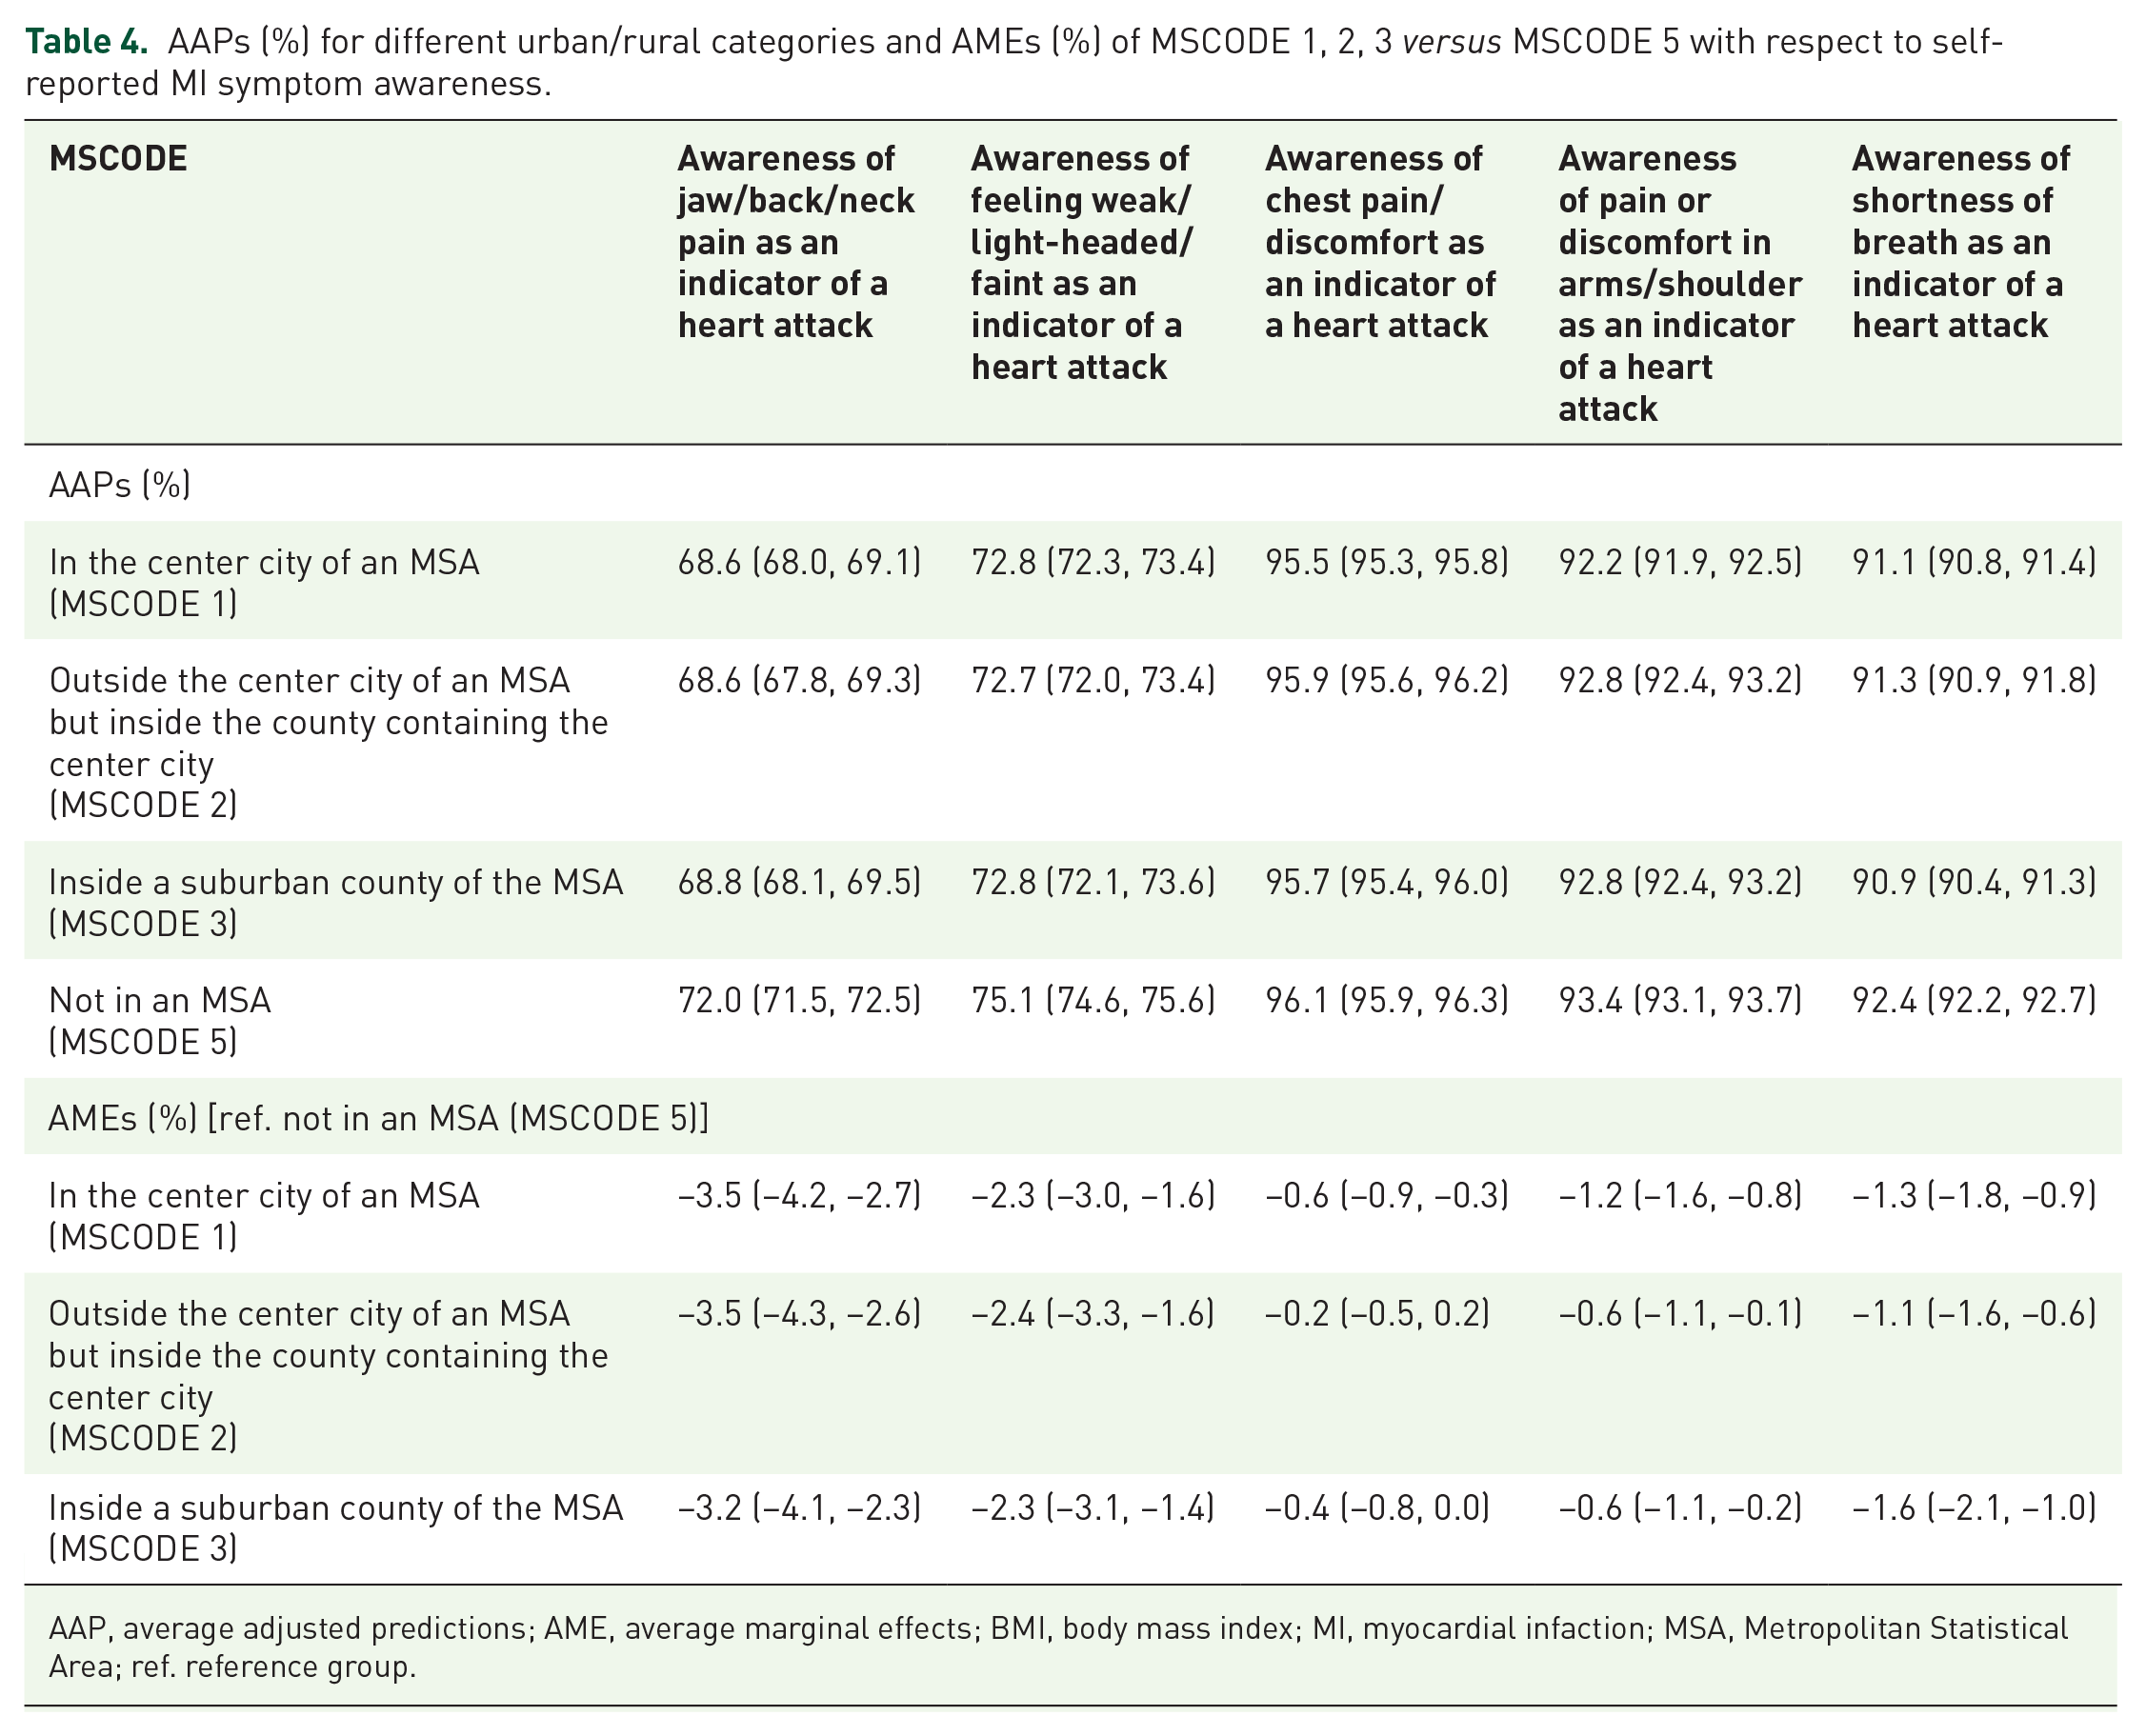
AAP, average adjusted predictions; AME, average marginal effects; BMI, body mass index; MI, myocardial infaction; MSA, Metropolitan Statistical Area; ref. reference group.
Discussion
In this large nationwide study, we examined the influence of rurality on MI symptom awareness across the US while controlling for important sociodemographic and MI clinical factors that can bias this relationship. We found that rural areas consistently had a slightly higher odds and adjusted probabilities of being aware of all five MI symptoms compared with suburban and urban areas. People in rural, suburban, and urban areas had the highest probability of being aware of chest pain/discomfort and the lowest probability of being aware of jaw/back/neck pain. Differences in adjusted probabilities were largest for chest pain/discomfort and smallest for jaw/back/neck pain in all-rural, suburban, and urban areas.
Our study expands on the small body of work that looks at the impact of rurality on MI symptom awareness.24,29 One of these two studies was by Jackson and colleagues and examined the influence of rurality on MI symptom awareness among 33 older rural women in the Midwestern US, finding that these women had difficulty identifying MI symptoms and cited it as the chief reason they did not seek immediate medical help for a MI. 29 However, it is difficult to compare the results of this study to ours as there was no urban comparison group in this study on older rural women. 29 The other study by Swanoski and colleagues used 2005, 2007, and 2009 BRFSS data to look at the unadjusted percentage of incorrect and correct response by rural and urban residents to questions on MI symptom awareness as well as associations between rurality and achieving a high score on a composite MI symptom awareness outcome. 24 In contrast, we are unable to directly compare our adjusted logistic regression model estimates with those of Sanowski and colleagues because of two main reasons: (1) their decision to collapse all MI awareness questions into one composite question and then dichotomize this question into a low and high awareness score, and (2) not adjusting for MI clinical factors. 24 Choosing to collapse all MI awareness questions into one composite question and then dichotomizing this question into a low and high awareness score results in an inability to determine the impact of rurality on specific individual MI symptoms as well as a large amount of study power and information being lost. 76 Our study circumvents these limitations by looking at associations between rurality and each individual MI symptom while adjusting for sociodemographic and MI clinical factors, allowing us to obtain a better understanding of awareness for each MI symptom, crucial to development of MI educational interventions. In addition, we go one step further by isolating the impact of rurality on MI symptom awareness through marginal probabilities that provide actual numerical values that allow for easy interpretation without the need to have a reference group, as with logistic model ORs. 72
We chose to provide AAPs and AMEs in addition to the logisitc model results in our study because it is difficult for most people to interpret ORs and have an intuitive sense of their real-world application, as ORs obscure the probability of success (treatment effectiveness).
77
For instance, let us say that in Experiment 1, the probability of success in the treatment and control group are 0.2 and 0.11, respectively, which would give us an OR of 2
From the AAPs in Table 4, we can see that residents of MSCODE 5 (those not in an MSA) consistently have the highest predicted probability of being aware of all heart attack symptoms. Although the magnitude of the AMEs are not large, based on their associated confidence intervals, the knowledge of rural residents with respect to symptom awareness is in most cases significantly higher than that of suburban or urban residents. While it may seem counterintuitive for rural areas, which have higher MI mortality rates than suburban and urban areas, to have the highest awareness of all MI symptoms, our results could be explained by the ecological model of health behavior. 75 This model states that interpersonal relationships and the surrounding community are key in determining a person’s health behavior and knowledge. 78 Studies have documented that people living in rural communities tend to have stronger interpersonal relationships with their neighbors and closer bonds of kinship with their community than their suburban and urban counterparts.79–82 These stronger community ties may facilitate a greater sharing of health knowledge on cardiovascular disease in rural communities than in more urbanized areas.79,80 Although determining whether rural/urban differences in MI symptom awareness can be attributed to stronger rural community ties would entail a more qualitative approach and is beyond the scope of this study, it is an area that warrants future study. Regardless, it is of note that even after adjustment for multiple factors, more than 25% of rural, suburban, and urban residents in the study were not aware that jaw/back/neck pain and feeling weak/light-headed/faint are indicators of a heart attack. This translates into millions of US adults around the country being unable to recognize two out of the five common MI symptoms, leaving room for continued educational efforts and interventions to improve MI symptom awareness to reduce time to hospital and MI treatment delay as well as decrease MI morbidity and mortality. Although recognition of chest pain, arm/shoulder discomfort, and shortness of breath as heart attack symptoms are above 90% regardless of the place of residence, there is no harm in also increasing awareness of these three heart attack symptoms.
Our study has a few limitations that need to be considered. While BRFSS measures of sociodemographic and MI clinical factors are self-reported, BRFSS validation studies have shown them to correlate with a high degree with in-person measurements.83,84 For example, a study examining 911 people in New York showed that the correlations between in-person obesity and smoking measurements and BRFSS responses ranged from 74 to 82%. 83 In another study that compared Massachusetts electronic health records (EHRs) to Massachusetts BRFSS responses, researchers found that the prevalence of smoking (EHR: 13.5%, BRFSS: 14.7%), hypertension (EHR: 26.3%, BRFSS: 29.6%), and obesity (EHR: 22.8%, BRFSS: 23.8%) were very similar between the two datasets. 84 Additionally, any misclassification of our data due to self-reporting is likely nondifferential and would bias our estimates towards the null.33,85 Confounding may still remain even after extensive adjustment; however, we controlled for many sociodemographic, and MI clinical factors that were also adjusted for in previous studies looking at MI symptoms awareness.14,22,23,25,27,28 The study’s limitations are countered by our ability to identify adjusted levels of awareness for each of the five MI symptoms and to isolate the impact of rurality on MI symptom awareness in a large nationally representative dataset.
Conclusion
Overall, this study allowed us to more clearly see whether MI symptom awareness differs between rural, suburban, and urban areas after extensive adjustment for sociodemographic and MI clinical factors as well as to identify which MI symptoms people still had low awareness of even after adjustment. By adjusting for a wide array of factors and isolating the impact of rurality on MI symptom awareness, we observed that, although there were similar levels of awareness for rural and urban residents, more than a quarter of US adults were unaware that jaw/back/neck pain and feeling weak/light-headed/faint are MI symptoms. These study findings can serve as a guide as to which MI symptoms best need educational interventions to increase awareness. As there is a link between quickly recognizing MI symptoms, receiving timely treatment, and better outcomes; it is crucial to ensure that awareness of all five common MI symptoms is as widespread as possible, especially in rural areas of the US where the burden of cardiovascular disease is high.10–12
Summary
MI symptom awareness is linked to quicker MI treatment and better outcomes; however, little is known about the influence of rurality on MI symptom awareness.
We found that, although MI symptom awareness was similar in all areas, rural residents had slightly higher awareness compared with suburban and urban residents, and there was substantially higher awareness of certain MI symptoms compared with others in all areas.
This study reveals the impact of rurality on MI symptom awareness in the US and which MI symptoms should be targeted for future educational interventions.
Footnotes
Acknowledgements
This article does not contain any studies with human participants or animals performed by any of the authors. The BRFSS data used in this study is a secondary publicly available data source that has been completely anonymized and released for public use by the US Centers for Disease Control and Prevention (CDC).
Conflict of interest statement
The authors declare that there is no conflict of interest.
Funding
The authors received no financial support for the research, authorship, and/or publication of this article.