
Abstract
Background:
Autophagy is closely involved in the control of mycobacterial infection.
Objectives:
Here, a diagnostic model was developed using the levels of autophagy-related genes (ARGs) in the blood to differentiate active tuberculosis (ATB) and latent tuberculosis infection (LTBI).
Design:
Secondary data analysis of three prospective cohorts.
Methods:
The expression of ARGs in patients with ATB and LTBI were analyzed using the GSE37250, GSE19491, and GSE28623 datasets from the GEO database.
Results:
Twenty-two differentially expressed ARGs were identified in the training dataset GSE37250. Using least absolute shrinkage and selection operator and multivariate logistic regression, three ARGs (FOXO1, CCL2, and ITGA3) were found that were positively associated with adaptive immune-related lymphocytes and negatively associated with myeloid and inflammatory cells. A nomogram was constructed using the three ARGs. The accuracy, consistency, and clinical relevance of the nomogram were evaluated using receiver operating characteristic curves, the C-index, calibration curves, and validation in the datasets GSE19491 and GSE28623. The nomogram showed good predictive performance.
Conclusion:
The nomogram was able to accurately differentiate between ATB and LTBI patients. These findings provide evidence for future study on the pathology of autophagy in tuberculosis infection.
Keywords
Introduction
Tuberculosis (TB), caused by Mycobacterium tuberculosis (Mtb), significantly contributes to population mortality worldwide.1,2 According to the Global Tuberculosis Report 2022, about 10.6 million new diagnoses and 1.6 million deaths occurred in 2021. 3 Approximately one-third of the world’s population are estimated to carry Mtb infection and of these, between 5% and 15% will develop active TB at some point in their lives.4,5 The treatment of TB can be a complex and prolonged process, often resulting in poor patient compliance. The factors that ultimately govern the transition between active TB (ATB) and latent TB infection (LTBI) remain to be fully clarified, and the clinical differentiation between these two disease states remains challenging despite being critical to providing patients with appropriate treatments aimed at curtailing further TB spread. The two approaches most frequently used to assess TB infection are the interferon γ-release assay (IGRA) and the tuberculin skin test (TST) but neither can distinguish between ATB and LTBI in all cases.6,7 In patients with TB suffering from malnourishment or comorbid human immunodeficiency virus (HIV) infection, TST or IGRA results may be nonreactive.7–9 False-positive results can occur in cases of infection with nontuberculous mycobacteria or following Bacillus Calmette-Guérin (BCG) vaccination. There is thus a need for the reliable differentiation between these two forms of Mtb infection. The TB community has expressed an urgent need for additional TB diagnostic tests for patients in whom disease is difficult to diagnose, as well as simple and reliable biomarker tests to assess the presence of LTBI in patients at high risk of active TB. 9
Host cell death is closely involved in the control Mtb infection.10–12 Several gene signatures have been identified that not only reveal the pathogenic mechanism but can also be used as novel biomarkers for distinguishing ATB from LTBI.13–15 Autophagy is a cellular process involved in the degradation of dysfunctional cellular components, such as misfolded proteins and damaged organelles, and invading pathogens, including bacteria, fungi, and viruses, thus maintaining cell homeostasis. Pathogens entering the cell are encapsulated in double-membrane autophagosomes which subsequently fuse with lysosomes resulting in the lysosomal degradation of their cargo, a specific form of autophagy termed xenophagy. 10 Autophagy is stimulated by increased expression of Interferon-gamma (IFN-γ), and raised IFN-γ levels in macrophages have been linked to immunity against Mtb infection. 16 Mtb suppresses autophagy by preventing the fusion of autophagosomes with lysosomes. This is a marked characteristic of Mtb infection and is a major cause of TB development. Autophagic clearance of Mtb is associated with reduced infection, while inhibition of autophagy promotes the survival of the pathogen. 16
However, most studies have been performed in vitro and there is limited clinical information on autophagy in relation to Mtb infection. Here, we analyzed the protein levels of autophagy-related genes (ARGs) in the blood of TB patients using bioinformatic methods, with the aim to establish a novel and reliable diagnostic model to distinguish ATB from LTBI.
Methods
Data source
Datasets containing mRNA sequencing information from blood samples of TB patients were downloaded from the National Center for Biotechnology Information-Gene Expression Omnibus (NCBI-GEO). The inclusion criteria for the data were that (1) the patients were over the age of 15 years, (2) the samples had been obtained before anti-TB treatment, (3) the patients had no severe autoimmune disease, malignancies, diabetes, immunocompromised status (including HIV infection, or taking immunomodulatory or immunosuppressive medications), and were not pregnant. Three prospective datasets, namely, GSE37250, GSE19491, and GSE28623 were selected according to these criteria. The training dataset, GSE37250, included samples of whole blood collected from 97 ATB and 83 LTBI samples and data on ARGs were used for the creation of a diagnostic model. The validation datasets, GSE19491 and GSE28623, included mRNA information on 89 ATB and 69 LTBI samples and 46 ATB and 25 LTBI samples.
All patients with ATB had been diagnosed based on the confirmed isolation and culture of Mtb from respiratory samples, together with clinical symptoms consistent with TB, or negative Mtb cultures together with clinical and radiological findings consistent with ATB. LTBI was diagnosed according to confirmed contact with individuals with positive TB smear results together with positive TST or IGRA results in the absence of any clinical or radiological signs of ATB on follow-up. The study design is shown in Figure 1.

Flow chart of the study.
The reporting of this study conforms to the STARDstatement 17 (Supplemental File 1).
Screening of differentially expressed ARGs
A total of 222 ARGs (Supplemental File 2) were identified from the Human Autophagy Database (HADb). The expression profiles of the genes were normalized in the training cohort GSE37250 using the ‘justRMA’ function 18 in the ‘limma’ package in R (V.4.2.0). Batch effects were removed and backgrounds adjusted using the ‘ComBat’ function 19 in the ‘sva’ package (V.4.2.1), resulting in the identification of differently expressed genes (DEGs) using a false discovery rate (FDR) <0.05. The differentially expressed ARGs (DE-ARGs) were identified from the overlap between the DEGs and the ARGs.
Functional analysis of DE-ARGs
DAVID 20 and Metascape 21 are the two comprehensive databases that are used for the annotation and visualization of genes, as well as for investigation of pathway enrichment. Functional analysis was performed using gene ontology (GO) and Kyoto Encyclopedia of Genes and Genomes (KEGG) 22 analysis of the DE-ARGs while DisGeNET and PaGenBase analyses were undertaken using Metascape. The cutoff p value was <0.05 and the top 10 terms were selected from each analysis.
The gene set enrichment analysis (GSEA) package in R (V.4.2.0) was used to further explore pathways associated with the DE-ARGs by calculation of the associations between the DE-ARGs and all other genes in the GSE37250 dataset. These genes were then rank ordered based on the strength of the correlations and were used as the test gene set while the KEGG pathway gene set was used as the target for enrichment analyses.
Establishment of the diagnostic model based on ARGs
A least absolute shrinkage and selection operator (LASSO) regression analysis 23 was undertaken using the ‘glmnet’ R package (V.4.2.3) to determine the genes for inclusion in the model. The best λ was chosen and several genes showing partial collinearity were removed to reduce bias. The genes were then included in a multivariate regression analysis, selecting parameters with p values <0.05 for inclusion in the final version. The risk score was determined by the product of the linear combinations of the expression levels of the ARGs (α) and the corresponding coefficient (β), calculated as risk score = α1 * β1 + α2 * β2 + . . . + αn * βn. The R ‘rms’ package (V.4.2.3) was used to assess the ATB probability. The identified independent factors were used to construct an overall ATB risk score. The accuracy of the model in the prediction of ATB was assessed using the ‘pROC’ R package (V.4.2.1) to determine the areas under the curve (AUC) for the receiver operating characteristic (ROC) curves. Harrell’s concordance index, or C-index, was used to assess the predictive ability of the model, and calibration curves were compiled using the ‘Hmisc’ and ‘rms’ R packages (V.4.2.2) to compare the predictions with actual data. For verification of the model’s effectiveness and reliability, the model was validated against the GSE19491 and GSE28623 datasets using the above analysis and decision curve analysis (DCA). 24
The relationships between immune cell levels and ARG expression
The relative levels of infiltrating immune cells were determined in the training set using single-sample gene set enrichment analysis (ssGSEA). The differential levels of 28 immune cell types were assessed using violin plots, and Spearman’s correlations between the infiltrating cells and ARGs were evaluated using the ‘ggplot2’ package in R (V.4.2.3).
Results
Identification of DE-ARGs in patients with TB
A total of 2388 DEGs with an FDR <0.05 were found between ATB and LTBI samples [Figure 2(a)]. Overlap between these genes and ARGs from the HADb resulted in the identification of 22 DE-ARGs [Figure 2(b)] that showed clear differences in expression between ATB and LTBI patients. For example, CCL2, ITGA6, and ATIC were downregulated, while CCR2, DDIT3, and ATF6 were upregulated in ATB individuals compared with LTBI patients [Figure 2(c)].

Differentially expressed ARGs. (a) Volcano plot showing DEGs in the GSE37250 dataset. Red indicates upregulation, blue downregulation, and gray no change. (b) Venn diagram showing the 22 DE-ARGs (overlap between the DEGs and ARGs). (c) Heatmap of DE-ARGs in GSE37250. (d) GO and (e) KEGG analyses of DE-ARGs using DAVID. (f) Bar graph showing DE-ARG enrichment assessed by Metascape (colored by p value). (g) DisGeNET enrichment. (h) ssGSEA enrichment of DE-ARGs in ATB samples from GSE37250. (i) ssGSEA enrichment of DE-ARGs in LTBI samples from GSE37250.
Functional analysis of DE-ARGs
Evaluation of the functions of the DE-ARGs was undertaken using GO and KEGG enrichment in DAVID and Metascape. DisGeNET and PaGenBase enrichment was also analyzed using Metascape. GO analysis indicated that the DE-ARGs were mostly involved in ‘regulation of autophagy’, ‘cellular component’, or ‘organelle disassembly’ [Figure 2(d) and Supplemental File 3]. The KEGG analysis indicated involvement of the DE-ARGs in pathways associated with ‘lipid and atherosclerosis’, ‘mitophagy’, and ‘virus or bacterial infection’ [Figure 2(e) and Supplemental File 4]. These results were confirmed by those of the Metascape analysis, where the DE-ARGs mainly participated in ‘regulation of cell death’, ‘autophagy’, ‘immune response’, and ‘diseases of tumor or infections’ [Figure 2(f) and (g)].
To better understand the ability of the identified DE-ARGs to distinguish between samples from LTBI and ATB patients, a single-gene GSEA-KEGG pathway analysis was conducted. The results showed the DE-ARGs were enriched in pathways associated with inflammation (e.g. ‘KEGG_COMPLEMENT_AND_COAGULATION_CASCADES’ and ‘KEGG_LEUKOCYTE_TRANSENDOTHELIAL_MIGRATION’) in ATB samples [Figure 2(h)]; and showed enrichment in adaptive immune response pathways (e.g. ‘KEGG_ANTIGEN_PROCESSING_AND_PRESENTATION’ and ‘KEGG_T_CELL_RECEPTOR_SIGNALING_PATHWAY’) in LTBI samples [Figure 2(i)].
Construction and assessment of the predictive model
Eleven DE-ARGs identified by the LASSO analysis were included in the diagnostic model [Figure 3(a) and (b)]. Multivariate regression identified three key DE-ARGs with p values <0.05, namely, FOXO1, ITGA3, and CCL2 which were used to construct the model. The coefficients of these key DE-ARGs are shown in Table 1. Risk scores for these genes were calculated as risk score = FOXO1 × (−3.551760036) + ITGA3 × (−0.760397595) + CCL2 × (−0.186666745). The nomogram was then constructed [Figure 3(c)]. According to the actual measurements of the expression levels of the three DE-ARGs in the blood, users could find them on the corresponding scale in the nomogram, followed by projection from the point to the scale on top to read the point of each variant. The sum of all points represents the total number of points. The likelihood of a patient suffering from ATB could then be assessed from the bottom scale by the downward projection of the total points.

Construction of the nomogram and DE-ARG selection using LASSO and multivariate regression. (a) Cross-validation for selection of lambda (λ). (b) Coefficients for key DE-ARGs identified by LASSO. (c) Nomogram based on the three key ARGs.
The coefficients and odds ratio values of three hub DE-ARGs estimated by logistics regression.

DE-ARG, differentially expressed autophagy-related genes.
Assessment and validation of the model
ROC curves were used to examine the model efficacy [Figure 4(a)]. The AUC for the training set GSE37250 was found to be 0.893, indicative of good predictive efficacy. The AUCs for the validation datasets GSE19491 and GSE28623 were 0.827 and 0.883, respectively, again confirming the efficacy of the model [Figures 5(a) and 6(a)]. The C-indices were 0.893 for the training set and 0.883 and 0.827 for the validation sets GSE28623 and GSE19491, respectively. Furthermore, the calibration curves for the prediction of ATB risk were consistent between the training [Figure 4(b)] and the validation [Figures 5(b) and 6(b)] sets. DCA indicated a ratio threshold of 4–100%, demonstrating good clinical net benefit [Figures 4(c), 5(c), and 6(c)]. Better net benefit ratios are indicative of relevance to clinical application. The heatmap shows that the levels of the three key ARGs were lower in ATB patients than in LTBI patients in the validation sets [Figures 5(d) and 6(d)], consistent with the findings on the training sets [Figure 2(c)].

The prediction performance of the three-gene-based diagnostic model for the training set GSE37250. (a) ROC curve. (b) Calibration curve. (c) Decision curve analysis.

The prediction performance of the three-gene-based diagnostic model for the validation set GSE19491. (a) ROC curve. (b) Calibration curve. (c) Decision curve analysis. (d) The heatmap of the expression levels of the three hub ARGs in GSE19491.
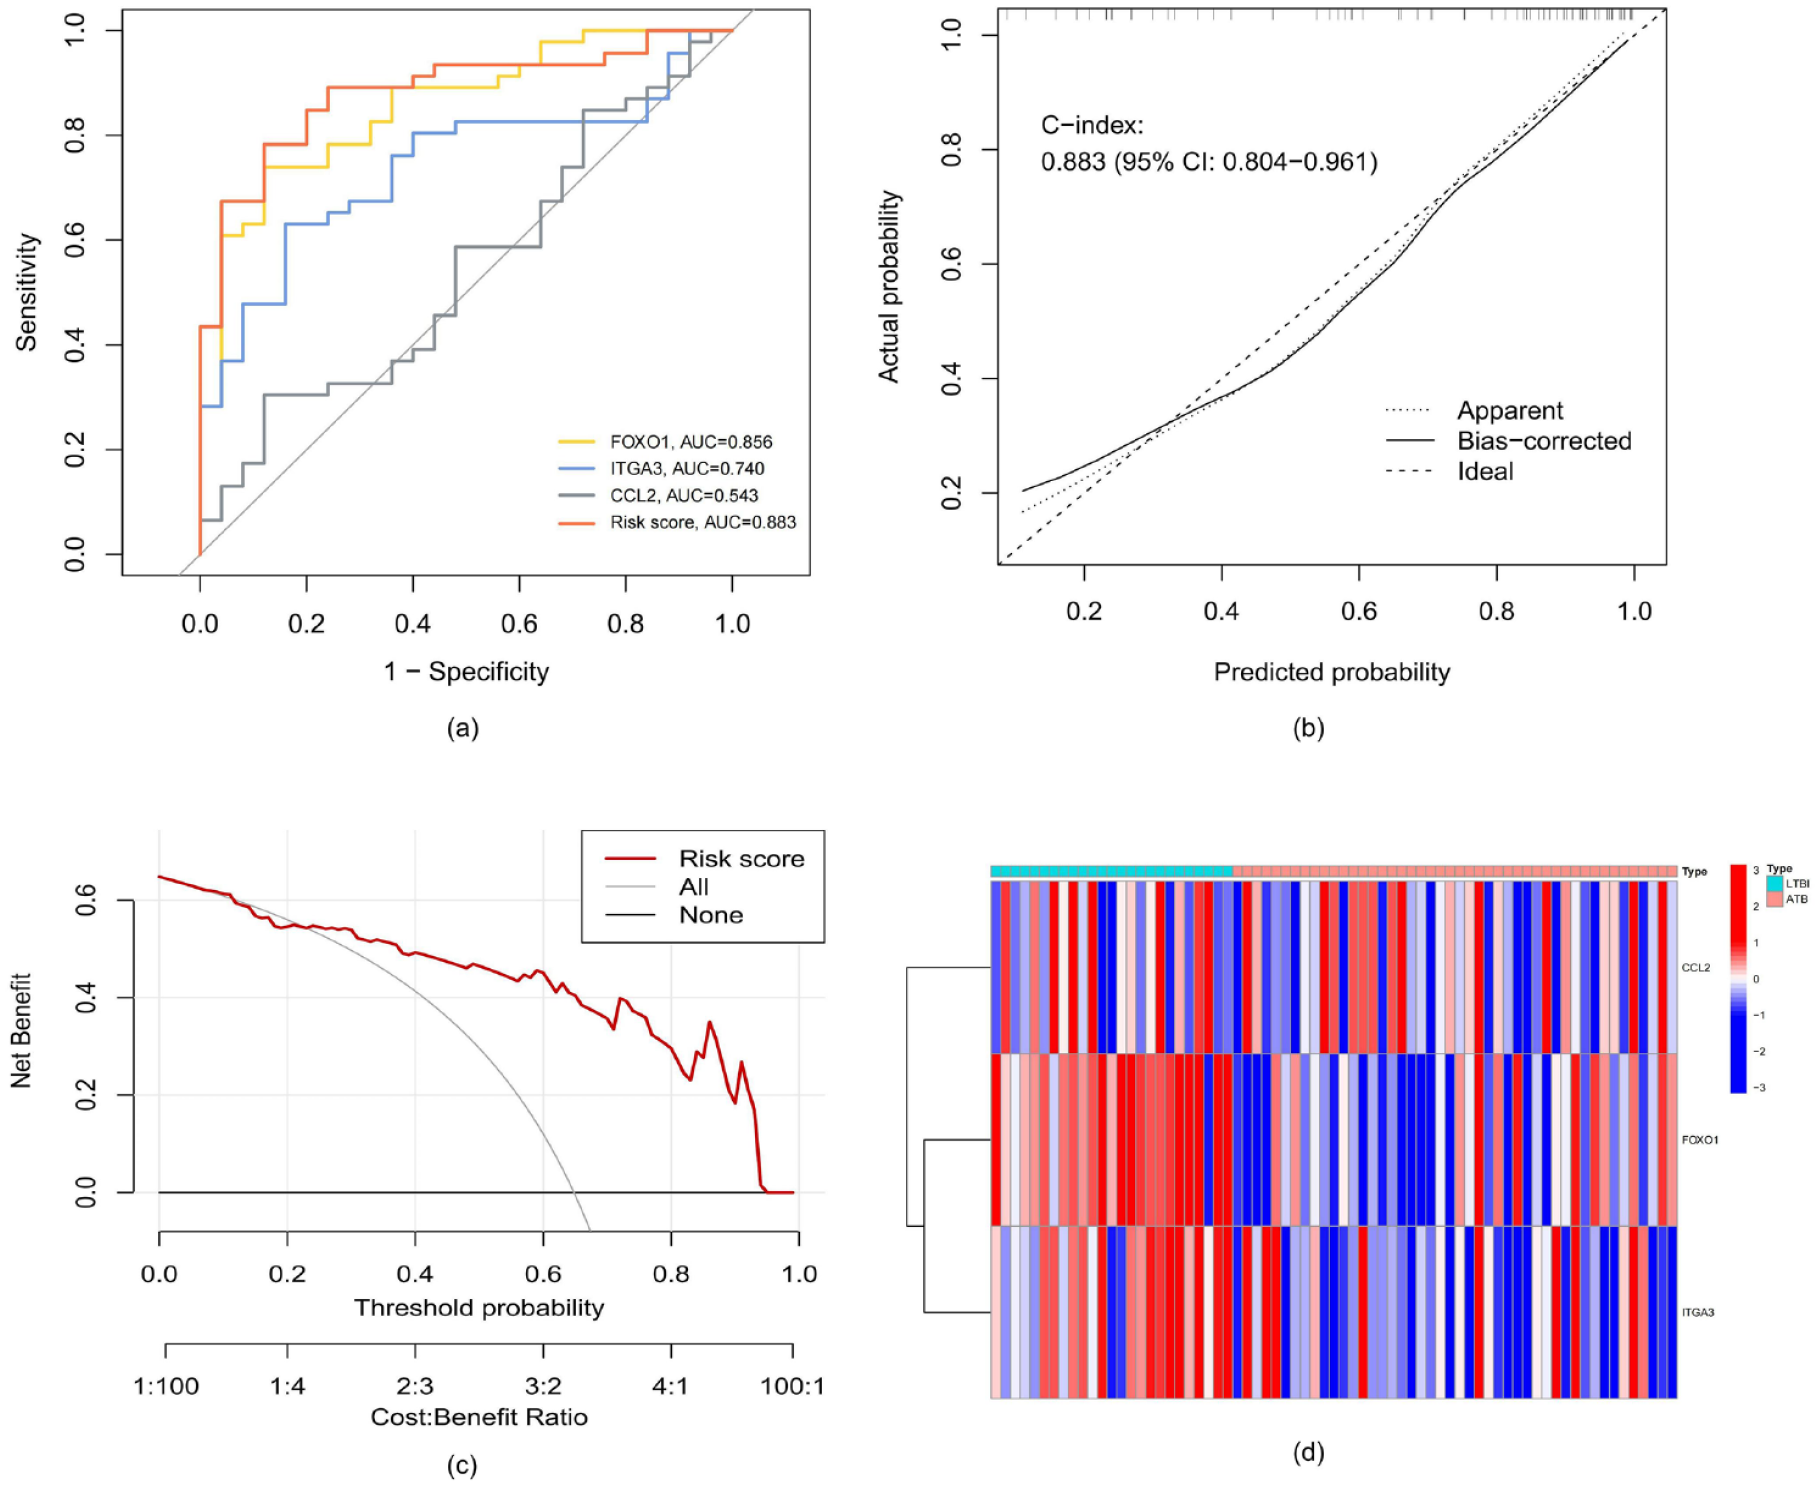
The prediction performance of the three-gene-based diagnostic model for the validation set GSE28623. (a) ROC curve. (b) Calibration curve. (c) Decision curve analysis. (d) The heatmap of the expression levels of the three hub ARGs in the GSE28623
Relationships between immune cell abundance and ARG expression
Analysis of immune cell infiltration showed marked differences between the immune microenvironments of ATB and LTBI patients [Figure 7(a) and Supplemental File 5]. Compared with LTBI, ATB showed reduced adaptive immune-related lymphocyte numbers (e.g. active B cells, active CD8+ T-cells, etc.) but higher levels of myeloid and inflammatory cells (e.g. monocytes, macrophages, and neutrophils). This suggested ATB was associated with depression of adaptive cellular and humoral immune responses, together with elevated inflammation. Meanwhile, correlation analysis showed that FOXO1, ITGA3, and CCL2 were positively associated with lymphocytes while FOXO1 was negatively correlated with myeloid cells and inflammatory cells [Figure 7(b)].

The relationships between immune cell abundance and ARG expression. (a) Boxplots showing immune cell infiltration in ATB and LTBI samples. (b) Correlations between infiltrating immune cells and key DE-ARGs.
Discussion
TB is a leading cause of death throughout the world.1–5 Recent transcriptomic research efforts have highlighted a range of genes and gene expression patterns related to the pathology of TB. Here, we investigated the overlap between 2388 DEGs identified from GEO datasets and 222 ARGs from the HADb, leading to the identification of 22 differentially expressed autophagy-related genes (DE-ARGs). LASSO regression reduced this number to 11, while subsequent multivariate analysis identified three key DE-ATGs (FOXO1, ITGA3, and CCL2) that were incorporated into the diagnostic model and nomogram. The AUC value indicated good predictive efficacy and the C-index demonstrated the ability of the model to distinguish between ATB and LTBI while calibration curves showed consistency between the predictions and actual data. This appears to be the first study investigating the combination of DEGs between ATB and LTBI with autophagy-associated parameters for the construction of a diagnostic model. The predictive accuracy of the model suggests that it may be useful for the differential diagnosis of different types of TB infection.
Immune responses are critical in the regulation of Mtb infection. Increasing evidence indicates that the crosstalk between cell death pathways and host immune responses is essential for the development of ATB.25,26 In line with previous reports, this study showed that, compared with LTBI, the immune status of ATB patients was characterized by the suppression of adaptive immune, which manifested as significant decreases in the active CD8+ T cells and B cell populations, together with the activation of myeloid and inflammatory cells (macrophages. neutrophils, and monocytes).27–30 T cells are important in granuloma formation in macrophages, restricting and containing Mtb, and T cell subsets are responsive to numerous Mtb-generated. 27 Of these, CD8+ T cells are especially important, and CD8+ T cells activated by Mtb are present in both the blood and bronchoalveolar lavage in patients with LTBI. 28 It has been found that multifunctional CD8+ T cells are involved in the prevention of Mtb dissemination. B cells and antibodies produced by B cells can influence the development of granulomas. 29 CD4+ T cells that are activated by Mtb assist macrophages in the control of intracellular pathogens by secreting cytokines. 30 Previous studies found the polyfunctional CD4+ T cells in ATB were associated with a higher proportion of bifunctional T-cells producing IFN-γ and TNF-α and an effector-memory phenotype, whereas bifunctional TNF-α+ IL-2+ CD4+ T cells and a terminally-differentiated effector phenotype were associated with LTBI.31,32 A suppressed adaptive immune-related lymphocyte response is therefore associated with uncontrolled Mtb infection and the transition from LTBI to ATB. Elevated inflammatory responses, involving dendritic cells, monocytes, macrophages, and neutrophils, occur in ATB patients in response to disseminated bacterial presence and accompanying tissue damage.27,33 All the three key ARGs identified in this study were downregulated in ATB patients, which were positively associated with adaptive immune-related lymphocytes but negatively correlated with myeloid and inflammatory cells. The dysregulation of ARGs and their association with immune cell populations highlight the potentially important role that autophagy may play in the immunopathogenesis of Mtb infection.
Forkhead box protein 1 (FOXO1) functions downstream of mitogen-activated protein kinase (MAPK) and is involved in a variety of processes, including proliferation, stress tolerance, differentiation, apoptosis, and the maintenance of homeostasis and metabolic function. 34 The transcription factor FOXO1 regulates two cellular proteolytic pathways, namely, the proteasomal system that degrades ubiquitinated proteins, and autophagy, whereby material is degraded in the lysosome. Evidence suggests that FOXO1 promotes autophagy in a manner independent of its transcriptional function. 35 FOXO1 negatively regulates the functions of Natural Killer (NK) cells and its activation induces the formation of adaptive memory in both human CD4+ T cells and mouse models.35,36 Reduced FOXO1 expression leads to lowered levels of plasma interleukin-7 (IL-7) and soluble IL-7 receptor, reducing anti-mycobacterial effector activities in ATB patients. 37 On the other hand, overexpression of FOXO1 counteracted mycobacterial survival in macrophages. 38 The chemokine (C–C motif) ligand 2 (CCL2) is closely associated with the innate immune response, especially in the recruiting mononuclear and other cells to infection sites, and is also involved in the formation of granulomas, preventing the spread of Mtb. 39 Upregulation of CCL2 is seen during inflammation in response to pro-inflammatory stimulation and tissue damage where it is produced by both inflammatory and stromal cells, including endothelial cells. 40 Apart from functioning as a conventional chemotactic cytokine, CCL2 can also act as a transcriptional regulator. Monocyte chemoattractant protein-1 (MCP-1)/CCL2-induced protein is a recently identified zinc-finger protein that has been found to initiate a signaling cascade leading to both endoplasmic reticulum and oxidative stress. This can result in autophagy and the subsequent differentiation or death of the cell according to the specific context. 39 Mutations in CCL2 have been linked to TB susceptibility. 41 Hasan et al. 42 showed that its levels declined significantly in the sera of patients with severe TB infections compared with controls and patients with less severe infections. CCL2 is thus linked to TB severity, perhaps through the elevated levels of systemic inflammation seen in disseminated TB cases or resulting from greater infiltration of monocytes into the lung parenchyma. Integrin α3 (ITGA3) is cell-surface adhesion molecule that interacts with components of the extracellular matrix, such as laminin. 43 Reduced expression of ITGA3 has been shown to inhibit phosphatidylinositol 3-kinase/protein kinase B (PI3K-Akt) signaling and promote tumorigenic cellular behavior. 44 Its role in TB is unknown. Our results suggest that ITGA3 may be involved in the progression of LTBI to ATB. The detection method based on the expression of ATGs in peripheral blood has the advantages of being economical and easy to apply, meeting the needs of individuals in whom there is difficulty in distinguishing between ATB and LTBI, and may thus be soon converted for clinical application. The DE-ATG candidates could also supply novel targets both for treatment and research into potential mechanisms.
The present study has some important limitations. First, despite our efforts to retrieve all of the data available online, the sample size remained relatively small, potentially restricting the accuracy of the findings. Second, the relationships between key genes and immune cells were defined by correlation analysis, which does not indicate causality. Analysis of the levels of the proteins encoded by these key genes in relation to TB severity would confirm these correlations. Last, although various DEGs were identified between individuals with ATB and LTBI, it remains unclear whether these host factors are specific for Mtb infection. Further research is needed to explore the function of these key ARGs and their underlying functions in Mtb infection.
Conclusion
In summary, this study presented a comprehensive evaluation of the expression levels of ARGs and immune cell infiltration in patients with ATB and LTBI. A three-gene-based model was constructed to predict ATB risk. This suggests that autophagy is associated with the activation of Mtb infection and could be used as a novel and reliable biomarker for distinguishing ATB from LTBI.
Supplemental Material
sj-docx-1-tar-10.1177_17534666231217798 – Supplemental material for A diagnostic model for distinguishing between active tuberculosis and latent tuberculosis infection based on the blood expression profiles of autophagy-related genes
Supplemental material, sj-docx-1-tar-10.1177_17534666231217798 for A diagnostic model for distinguishing between active tuberculosis and latent tuberculosis infection based on the blood expression profiles of autophagy-related genes by Chengbin Wang, Jie Hua, Xiaopu He, Liang Chen and Shuhan Lv in Therapeutic Advances in Respiratory Disease
Supplemental Material
sj-xlsx-2-tar-10.1177_17534666231217798 – Supplemental material for A diagnostic model for distinguishing between active tuberculosis and latent tuberculosis infection based on the blood expression profiles of autophagy-related genes
Supplemental material, sj-xlsx-2-tar-10.1177_17534666231217798 for A diagnostic model for distinguishing between active tuberculosis and latent tuberculosis infection based on the blood expression profiles of autophagy-related genes by Chengbin Wang, Jie Hua, Xiaopu He, Liang Chen and Shuhan Lv in Therapeutic Advances in Respiratory Disease
Supplemental Material
sj-xlsx-3-tar-10.1177_17534666231217798 – Supplemental material for A diagnostic model for distinguishing between active tuberculosis and latent tuberculosis infection based on the blood expression profiles of autophagy-related genes
Supplemental material, sj-xlsx-3-tar-10.1177_17534666231217798 for A diagnostic model for distinguishing between active tuberculosis and latent tuberculosis infection based on the blood expression profiles of autophagy-related genes by Chengbin Wang, Jie Hua, Xiaopu He, Liang Chen and Shuhan Lv in Therapeutic Advances in Respiratory Disease
Supplemental Material
sj-xlsx-4-tar-10.1177_17534666231217798 – Supplemental material for A diagnostic model for distinguishing between active tuberculosis and latent tuberculosis infection based on the blood expression profiles of autophagy-related genes
Supplemental material, sj-xlsx-4-tar-10.1177_17534666231217798 for A diagnostic model for distinguishing between active tuberculosis and latent tuberculosis infection based on the blood expression profiles of autophagy-related genes by Chengbin Wang, Jie Hua, Xiaopu He, Liang Chen and Shuhan Lv in Therapeutic Advances in Respiratory Disease
Supplemental Material
sj-xlsx-5-tar-10.1177_17534666231217798 – Supplemental material for A diagnostic model for distinguishing between active tuberculosis and latent tuberculosis infection based on the blood expression profiles of autophagy-related genes
Supplemental material, sj-xlsx-5-tar-10.1177_17534666231217798 for A diagnostic model for distinguishing between active tuberculosis and latent tuberculosis infection based on the blood expression profiles of autophagy-related genes by Chengbin Wang, Jie Hua, Xiaopu He, Liang Chen and Shuhan Lv in Therapeutic Advances in Respiratory Disease
Footnotes
References
Supplementary Material
Please find the following supplemental material available below.
For Open Access articles published under a Creative Commons License, all supplemental material carries the same license as the article it is associated with.
For non-Open Access articles published, all supplemental material carries a non-exclusive license, and permission requests for re-use of supplemental material or any part of supplemental material shall be sent directly to the copyright owner as specified in the copyright notice associated with the article.