
Abstract
Background:
It is unclear whether microRNAs could be a potential diagnostic biomarker for asthma or not. The objective of this study is to figure out the diagnostic value of microRNAs in asthma.
Methods:
Literature retrieval, screening of publications, specific data extraction, and quality evaluation were conducted according to the standard criteria. Stata 14.0 software was used to analyze the diagnostic value of microRNA for asthma, including the combined sensitivity (Sen), specificity (Spe), the area under the curve (AUC), positive likelihood ratio (PLR), negative likelihood ratio (NLR), and diagnostic odds ratio (DOR).
Results:
A total of 72 studies, containing 4143 cases and 2188 controls, were included for this comprehensive analysis. None of the included publications were rated low in quality. We summarized that, compared with controls, more than 100 miRNAs were reported differently expressed in asthma, although the expression trends were inconsistent. Besides, there were five studies among these 72 articles that applied the diagnostic evaluation of microRNAs in asthma. We found that the pooled Sen, Spe, and AUC for the combination of miR-185-5p, miR-155, let-7a, miR-21, miR-320a, miR-1246, miR-144-5p, and miR-1165-3p in asthma were 0.87 (95%CI: 0.72–0.95), 0.84 (95%CI: 0.74–0.91), and 0.93 (95%CI: 0.89–0.94) individually, and the PLR, NLR, and DOR were 5.5 (95%CI: 3.1–9.7), 0.15 (95%CI: 0.07–0.36), and 35 (95%CI: 10–127) in asthma, respectively. In terms of subgroup analyses, we found that the Sen for these combination miRNAs from serum was higher than that in plasma, while the Spe in plasma worked better than that in serum. Furthermore, compared with children, the combination of above miRNAs from adults had higher Spe and similar Sen.
Conclusions:
From our analysis, the combination of miR-185-5p, miR-155, let-7a, miR-21, miR-320a, miR-1246, miR-144-5p, and miR-1165-3p from peripheral blood could potentially act as a diagnostic biomarker for asthma.
The reviews of this paper are available via the supplemental material section.
Introduction
Asthma is a common disease that affects the health of about 330 million people worldwide. 1 As a chronic airway inflammation disease, it is characterized by airway hyperresponsiveness and reversible airway obstruction, resulting in shortness of breath, recurrent wheezing, chest tightness, and coughing. 2 Currently, the widely used diagnostic criteria for asthma, such as the Global Initiative for Asthma (GINA),3–6 mainly focus on the medical history of respiratory symptoms and lung function tests, for which there are also some drawbacks. For instance, asthma may be neglected when patients suffer from multiple diseases (heart failure, anemia, etc.) which could cause dyspnea. 7 Besides, forced expiratory volume in 1 s, acting as an effective way to detect airway obstruction and an important tool in the diagnosis of asthma, 8 cannot be used alone for classification of different types and stages of asthma.9–11 Therefore, a universal and high-specificity biomarker to assist the diagnosis of asthma is required in clinical practice.
MicroRNA (miRNA) is a class of endogenous non-coding small RNAs of approximately 19–22 nucleotides in length, which serve as posttranscriptional regulators of gene expression.12,13 Studies have shown that miRNAs can be involved in the pathogenesis of a variety of allergic diseases, such as asthma, allergic rhinitis, 14 eosinophilic esophagitis,15,16 and eczema.17,18 miRNA may play a role in coordinating the phenotypic programming of immune and airway epithelial cells to increase the production of cytokines and other mediators, leading to inflammatory characteristics. Niu et al. 19 found that miR-33b can inhibit mast cell degranulation by inhibiting the release of calcium and the inhibitory pathway of antigen- and IgE-dependent aggregation of the high-affinity IgE receptor (FcεRI), and could also play a role in airway inflammation of asthma and mast cell biology. miR-21 was shown to target and inhibit the expression of IL-12p35, induce dendritic cells to produce more IL-12 and CD4+ T cells, and thus reduce the production of interferon-g (IFN-g) and IL-4. 20
Recently, miRNA is proposed to be effective in the diagnosis of asthma based on a series of studies. 19 Suojalehto et al. 21 found that the expression of miR-155 was downregulated in the nasal mucosa of asthmatic patients. Furthermore, the decrease of let-7a-5p in asthma was associated with peripheral blood eosinophil ratio. 22 Compared with non-asthmatics and mild-to-moderate asthmatics, plasma miR-155 level was significantly elevated in patients with severe asthma. 23 Besides, the increased expression of miR-146 was known to inhibit the nuclear factor-kappa B factor (NF-κB), this limiting to inflammatory responses in plasma from asthma. 24 The over-expression of miR-126 in acute asthma was found to be correlated with signs of immune imbalance and could predict the severity of childhood asthma. 25
However, the position that miRNAs could be a group of good biomarker candidates for asthma is inconsistent. Tang et al. 26 pointed out that the expression of miR-1268 was higher in the bronchoalveolar lavage fluid (BALF) of asthmatic adults, while Levänen et al. 27 reported no significant changes of miR-1268 in BALF in asthmatic adult patients compared with the control group. As for the let-7 family, the expression of let-7f was upregulated in bronchial epithelial cells (BECs) from asthmatic patients, 28 whereas let-7f was downregulated in CD4+ T cells from peripheral blood mononuclear cells (PBMCs).28,29 Furthermore, the miR-146a was decreased in bronchial biopsies from Australian patients with asthma; 30 however, it was increased in plasma from asthma in Egypt. 31 All these may partly be explained by different ethnicities, applications for different diagnosis criteria, different sample sources, detection methods, and so on.
To determine whether miRNA could be a good biomarker candidate for the diagnosis of asthma or not, we conducted a comprehensive qualitative and combined quantitative research of the diagnostic value of miRNAs in asthma. We found that more than 100 miRNAs were reported differently expressed in asthma, and the combined miRNAs of miR-185-5p, miR-155, let-7a, miR-21, miR-320a, miR-1246, miR-144-5p, and miR-1165-3p from peripheral blood could play a role as diagnostic biomarkers for asthma from our analysis.
Materials and methods
Search strategy
We searched databases including PubMed, Embase, Web of Science, and Cochrane Library through 31 May 2020, with the key terms “asthma,” “miRNA” and “microRNA”. At the same time, the references of relevant literature were manually searched. The whole process of literature searching and screening was done by two independent staff. When there was a dispute, it was discussed with a third party.
Inclusion criteria based on PICOS
The inclusion criteria for the selection of eligible studies were according to the PICOS principle as follows:
(1) Participants (P): the study included asthma patients of different ages, including children and adults. All cases were reported as asthma based on GINA,4–6 American Thoracic Society Guidelines (ATSG), 32 National Heart, Lung, and Blood Institute (NHLBI), 33 Spanish guidelines of the management of Asthma (GEMA), 34 International Study of Asthma and Allergies in Children (ISAAC), 35 Chinese guideline for the prevention and management of bronchial asthma (CGBS), 36 Guidelines for Diagnosis and Prevention of Bronchial Asthma in Pediatric Group (GDPB),37,38 Guideline of Severe Asthma Research Program (GSARP) 39 and asthma patients diagnosed by physician.
(2) Intervention (I): specific designed or commercial arrays, quantitative real-time polymerase chain reaction (qRT-PCR), or next-generation sequencing (NGS) were used to detect the miRNAs expression levels in all participants.
(3) Control (C): all controls were from healthy people or non-asthmatic controls.
(4) Outcomes (O): (1) Qualitative analysis: publications reported the specific miRNA types which were differently expressed between cases and controls. (2) Quantitative analysis: publications reported specific differently expressed miRNAs with data for diagnosis evaluation among all participants, including true positive (TP), false positive (FP), false negative (FN), and true negative (TN).
(5) Studies (S): Case-control design or cohort design.
Exclusion criteria
Studies were excluded if: (1) the literature was not in English; (2) the type of the research was a review, case report, or conference summary; (3) the publication was a small-sized study on the same topic from the same team which also shared overlapped participants with large-sized studies; (4) the data were incomplete for analysis.
Data extraction
The extracted data consisted of two parts: the first part contains basic information such as the first author, the year and region of publication, the numbers and ages of participates, and the details of differently expressed miRNA, including the specific miRNA types, the sources of researched samples, detection methods of reported miRNAs, and expression trend between cases and controls. The second part is the diagnostic data used for quantitative analysis, including TP, FP, FN, and TN for all participants. Two independent researchers extracted the data. Disagreements were discussed and resolved with the third researcher.
Quality assessment for publications
We used the Newcastle–Ottawa Scale (NOS), 40 a common tool for quality evaluation of non-randomized study, to estimate all qualitative and quantitative studies included. The total score of the NOS evaluation is 9 points. Five points or more is considered not of low quality. Besides, we also evaluated the papers applied for quantitative analysis by the Quality Assessment of Diagnostic Accuracy Studies-2 (QUADAS-2) 41 through RevMan5.3 with the levels of “high,” “low” and “unclear.”
Data analysis
In this research, we used the bivariate model for quantitative analysis of the diagnostic value of miRNAs in asthma. 42 To test whether the study effect size could be combined or not, the Spearman correlation coefficient was used to determine whether there was a threshold effect in the study. Generally, r = 0.6 is taken as the critical value, and if the Spearman correlation coefficient value is greater than this value, the threshold effect is considered to exist. 43 Then, Stata 14.0 statistical software (Stata Corporation, College Station, TX, USA) was used for data analysis and to calculate the pooled sensitivity (Sen), specificity (Spe), positive likelihood ratio (PLR), negative likelihood ratio (NLR), diagnostic odds ratio (DOR) the area under curve (AUC) and corresponding 95% credible interval (CI). To show the clinical utility of miRNAs for asthma, Fagan analysis was used to prove the relationship among prior probability, likelihood ratio, and posterior probability under the pre-test probabilities of 25%, 50% and 75% which presented for clinical suspicion of asthma at 25%, 50% and 75%, respectively.
I2 is applied to measure the heterogeneity, which describes the percentage of variation between analyzed studies. 44 If I2 = 25%, it means that slight heterogeneity existed; I2 = 50% meant moderate heterogeneity; high heterogeneity was present when I2 = 75%. 45 Next, subgroup analysis and meta-regression analysis were used to find the sources of heterogeneity, which we performed from the aspect of sample sources (serum versus plasma) and ages (adults versus children), respectively. If there was a significant decrease in heterogeneity in either subgroup, it would be considered as the source of heterogeneity. Additionally, meta-regression analysis was carried out by taking age and sample sources as covariables respectively and using the restrictive maximum likelihood method to establish the regression model of effect size to a single covariable. When the tau 2 , which represented the estimate of between-study variance, decreased significantly in a covariable (sample sources or ages), this covariable would be considered as the source of heterogeneity. 45
Sensitivity analysis, which is conducted by excluding one of the included studies in turn, was used to determine whether a single study has an undue influence on the overall result. We used the Funnel plot to evaluate the publication bias. Generally speaking, when the Funnel plot is basically symmetrical, it is considered that there may be no publication bias; otherwise, it may indicate the existence of publication bias. 46
Results
Publication selection and quality assessment
Through the literature retrieval method mentioned above, a total of 3091 studies were initially obtained. According to the Preferred Reporting Items for Systematic Reviews and Meta-Analyses (PRISMA) standard, 47 the standard literature selection process was conducted as shown in Figure 1. We finally included 72 articles21,22,25–31,48–110 with 4143 patients and 2188 controls based on the inclusion and exclusion criteria. The features of the included research are presented in Table 1. For the quality of all publications included, 36 studies had NOS scores higher than 7, 30 studies had a NOS score of 7, and six studies had a score of 6, indicating that the none of included studies were of low quality.

Flowchart of study selection based on the inclusion and exclusion criteria.
Characteristics of 72 studies included to explore the diagnostic value of microRNAs in asthma.

From peripheral blood.
From PBMCs.
From BALF.
ASMCs, airway smooth muscle cells; BALF, bronchoalveolar lavage fluid; BECs, bronchial epithelial cells; PBMCs, peripheral blood mononuclear cells.
In particular, there were five publications51,53,55,61,92 among the 72 articles with the data details required for quantitative diagnosis analysis for miRNAs in asthma (Table 2). There is no threshold effect based on the analysis of Spearman (Spearman correlation = 0.5946) which means that the study effect size could be combined. Through the QUADAS-2 quality evaluation of these five studies, we rated that the research quality at the middle and upper grades (Supplemental Figure 1).
Basic diagnostic data extracted from the five articles included in the quantitative analysis.
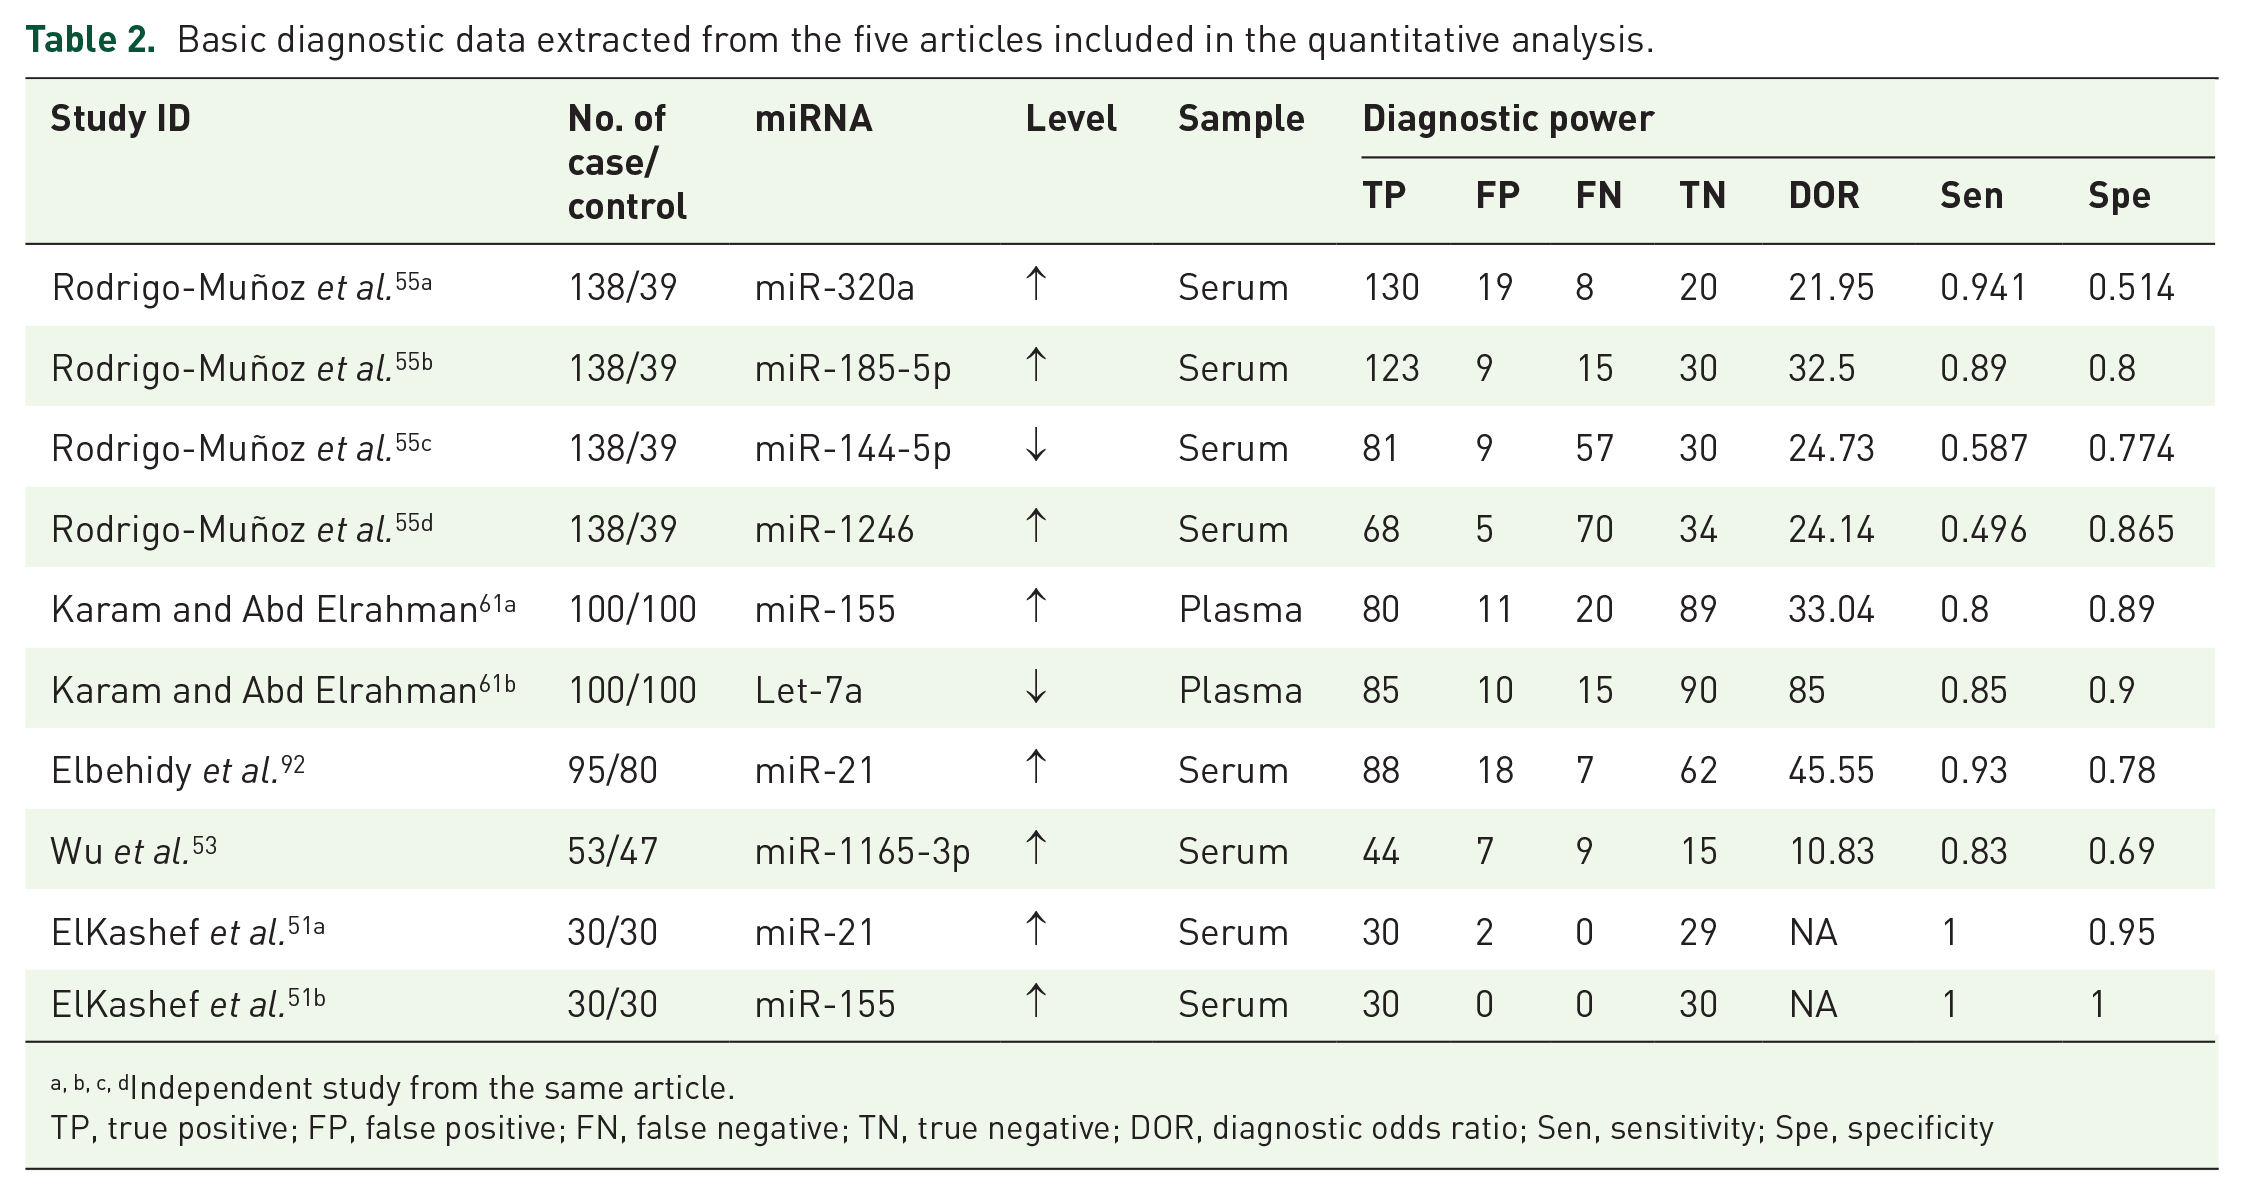
Independent study from the same article.
TP, true positive; FP, false positive; FN, false negative; TN, true negative; DOR, diagnostic odds ratio; Sen, sensitivity; Spe, specificity
Profile of miRNAs in asthma
Here, we conducted a qualitative analysis from all included studies. Firstly, we found that there were more than 100 miRNAs differently expressed between asthma and controls in all included publications (Table 1). Then we created a category for miRNAs that were studied in more than two articles. We summed up that there were three miRNAs families (miR-34 family, miR-27 family, and miR-570 family) and two miRNAs (miR-192 and miR-18a) consistently downregulated. Besides, there were two miRNAs (miR-98 and miR-145) and two miRNA families (miR-148 family and miR-223 family) upregulated in asthma. However, the expression trends were different in the other four miRNAs (miR-155, miR-126, miR-19a, and miR-224) and nine miRNA families (let-7 family, miR-21 family, miR-146 family, miR-200 family, miR-221 family, miR-449 family, miR-125 family, miR-181 family, miR-30 family) (Figure 2a).
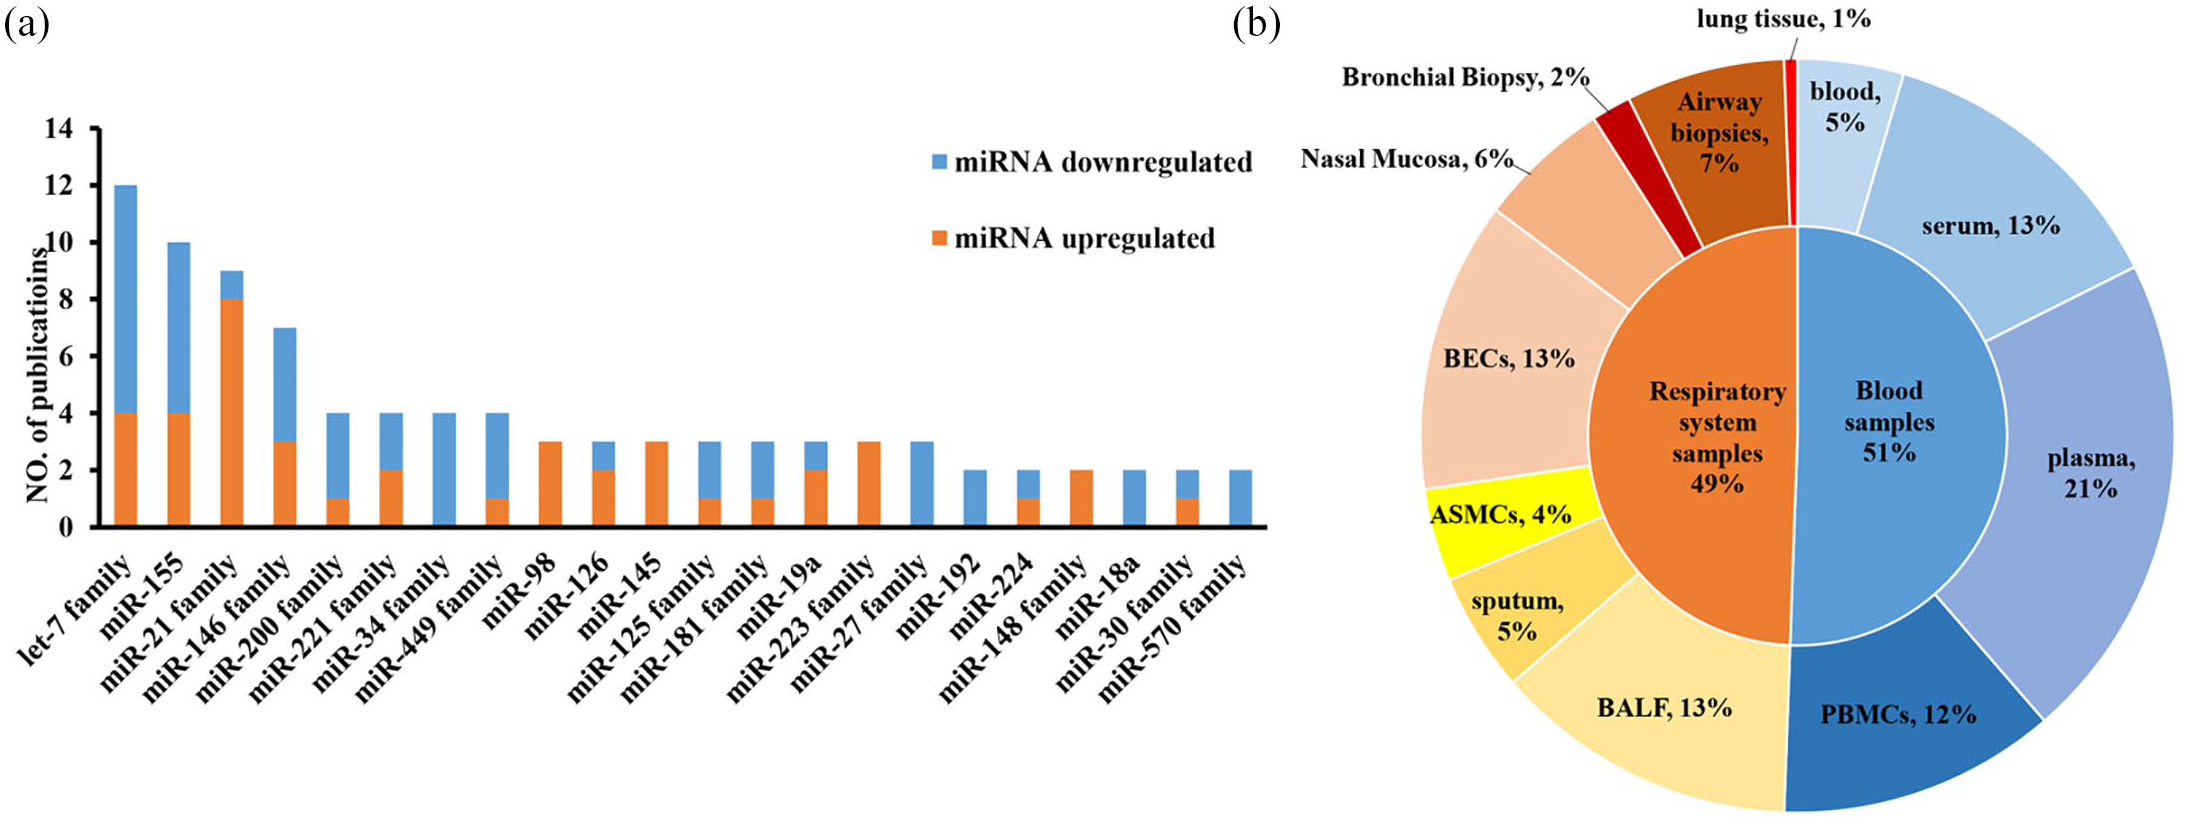
Profile of miRNAs in asthma. (a) differentially expressed miRNAs between asthma patients and controls reported in more than two studies. The orange and blue individually represent upregulated and downregulated miRNA in asthma patients compared with controls; (b) distribution of the specimen for all differently expressed miRNA between asthma patients and controls, and each color stands for a specific sample source. All these data were summarized from 72 included publications according to our listed criteria.
Then, we analyzed the distribution characteristics for the sources of all specimens. Since asthma is a kind of respiratory system disease, upper or lower airway-derived sample sources containing BECs (13%), airway biopsies (7%), nasal mucosa (6%), sputum (5%), airway smooth muscle cells (ASMCs) (4%), BALF (13%), bronchial biopsy (2%), and lung tissue (1%), could directly reflect the pathologic change of the disease and have a good representative role (Figure 2b). We also found that blood or specific part separated from plasma (21%), peripheral blood including serum (13%), and PBMCs (12%) are possible good options for candidate biomarker sources as they are easy and non-invasive to access (Figure 2b).
From Figure 2a, we discovered that the most widely reported differently expressed miRNAs in asthma were the let-7 family (let-7a, let-7d, let-7e, and let-7f), miR-155, and miR-21 family (miR-21 and miR-21-5p). When we tried to explore the relationships between these differently expressed miRNAs and their specimen sources, we found that the expression levels of miR-155 and let-7 family were differently expressed in sputum, BECs, BALF, plasma, serum, and PBMCs of asthma patients, which reflects the specificity of these miRNAs in different sample sources.
The diagnostic value of combined different miRNAs for asthma
Based on the listed criteria for the diagnostic data, we evaluated the diagnostic value of a combination of eight miRNAs (miR-185-5p, miR-155, let-7a, miR-21, miR-320a, miR-1246, miR-144-5p, and miR-1165-3p) for asthma (Table 2) from all reported differently expressed miRNA in five articles included for quantitative analysis. We analyzed that the pooled sensitivity and specificity of the above miRNAs are 0.87 (95%CI: 0.72–0.95) and 0.84 (95%CI: 0.74–0.91) respectively (Figure 3). The pooled AUC is 0.93 (95%CI: 0.89–0.94) (Figure 4). Additionally, we calculated that the pooled PLR, NLR, and DOR of the eight miRNAs for asthma were 5.5 (95%CI: 3.1–9.7), 0.15 (95%CI: 0.07–0.36), and 35 (95%CI: 10–127) individually, which indicates that the probability of asthma increased by 5.5 times when the miRNA test was positive, while the incidence of asthma only increased by 0.15 times when miRNA was negative. This information supports that the combination of these miRNAs has a relatively good biomarker role in asthma.

Forest plots for the diagnostic value of the combination of eight miRNAs in asthma. Left is the pooled sensitivity analysis. Right is the pooled specificity analysis. The combined miRNAs contain miR-185-5p, miR-155, let-7a, miR-21, miR-320a, miR-1246, miR-144-5p, and miR-1165-3p.

The summary receiver operating characteristic curve for the diagnosis value of the combination of the eight miRNAs in asthma. The combined miRNAs contain miR-185-5p, miR-155, let-7a, miR-21, miR-320a, miR-1246, miR-144-5p, and miR-1165-3p. The red diamond represents the pooled analysis of all included studies. The number of each black circle represents each separate study as follows: ① 2020, ElKashef, Smmae.(miR-21); ② 2020, ElKashef, Smmae.(miR-155); ③ 2019, Wu, C. (miR-1165-3p); ④ 2019, Rodrigo-Muñoz, J. M. (miR-320a); ⑤ 2019, Rodrigo-Muñoz, J. M. (miR-185-5p); ⑥ 2019, Rodrigo-Muñoz, J. M. (miR-144-5p); ⑦ 2019, Rodrigo-Muñoz, J. M. (miR-1246); ⑧ 2019, Karam, R. A. (miR-155); ⑨ 2019, Karam, R. A. (Let-7a); ⑩ 2016, Elbehidy, R. M. (miR-21).
When testing the possibility of application, we deduced that given a pre-test probability (Prob) of 25% (low clinical suspicion of asthma: 25%), the posterior probability positive and negative were 65% and 5%, respectively (Figure 5a). Similarly, the combination of these miRNAs could increase the diagnosis of asthma to 85% (Figure 5b) and 94% (Figure 5c) separately when setting the pre-test prob at 50% (clinical suspicion of asthma: 50%) or 75% (high clinical suspicion of asthma: 75%). These results indicate that the combination of these miRNAs could increase the diagnosis rates of asthma, and imply the potential application value of these miRNAs in the future.

Fagan plots of the combined of eight miRNAs for asthma. (a–c) were performed under the prior probability value of 25%, 50%, and 75%, respectively. The combined miRNAs contain miR-185-5p, miR-155, Let-7a, miR-21, miR-320a, miR-1246, miR-144-5p, and miR-1165-3p.
Subgroup analysis and meta-regression analysis
To explore the sources of heterogeneity for combined effect size (I2 = 79.3%), we performed a subgroup analysis firstly from the aspect of sample sources. We found that the combination of the above eight miRNAs from serum performed better in Sen than plasma (0.89, 95%CI: 0.77–1.00 versus 0.83, 95%CI: 0.54–0.96), and plasma performed better in Spe than serum (0.90, 95%CI: 0.79–1.00 versus 0.81, 95%CI: 0.72–0.91). The I2 of the serum group was 0.0%; however, the I2 value in the plasma group was still high (I2 = 77.3%) (Supplemental Figure 2a), which indicated the sample sources might be one of the sources of heterogeneity and needed to be further confirmed by regression analysis. Then, in terms of ages, we found that children with asthma had higher Spe (0.87, 95%CI: 0.75–0.98 versus 0.86, 95%CI: 0.74–0.98) than adults with asthma. Adults and children have same Sen (0.87, 95%CI: 0.69–1.00 versus 0.87, 95%CI: 0.87–1.00). Similarly, the I2 of the children group was 0.0%, but the I2 in the adult group was still high (I2 = 81.6%) (Supplemental Figure 2b), suggesting age might be one of the sources of heterogeneity and needed further exploration.
Next, meta-regression analysis was used to further verify the source of heterogeneity and explore the heterogeneity contribution of ages and sample sources. Sample sources (serum and plasma) and ages (adults and children) were taken as covariables, respectively. Through the regression analysis of age, it was found that the tau 2 (represent for variance) decreased from 0.9775 (p = 0.000) to 0.04453 (p = 0.035), a decrease of 95.44%, indicating that age could explain the 95.44% of heterogeneity source. However, from the aspect of sample types, there was no significant change in tau 2 (0.9775 versus 0.9055), suggesting that the specimen types may not be a main source of heterogeneity (Supplemental Figure 3).
Sensitivity analysis and publication bias
Through sensitivity analysis, we found that there is no significant variation of the compiled value when excluding one study in turn for all included data, indicating that the results for the overall studies were not overly dependent on one study (Supplemental Table 1). Moreover, the Funnel plot was symmetrical and showed no significant publication bias in the present analysis (Supplemental Figure 4).
Discussion
We conducted a qualitative and combined quantitative study to evaluate the diagnostic value of miRNA in asthma. To sum up, there were more than 100 miRNAs from all included studies differently expressed in asthma. Though the expression levels and trends were different depending on different publications, we found that the pooled miRNAs (miR-185-5p, miR-155, let-7a, miR-21, miR-320a, miR-1246, miR-144-5p, and miR-1165-3p) had a high diagnostic value (Sen = 0.87, 95%CI: 0.72–0.95; Spe = 0.84, 95%CI: 0.74–0.91; AUC = 0.93, 95%CI: 0.89–0.94). As far as we know, this is the first comprehensive analysis of the diagnostic value of miRNA for asthma.
It is reported in many studies that microRNA could act as a new potential biomarker for a series of respiratory diseases. The role of miRNAs in lung cancer has been confirmed. In 2018, Pan et al. 112 found that miR-33a-5p and miR-128-3p had high sensitivity and specificity in the early diagnosis of lung cancer, either in combination or alone. The diagnostic value of miR-339-5p and miR-21 in lung adenocarcinoma, especially in early stage, has also been demonstrated in the study of Zhang et al. 113 Additionally, Wang et al. 114 proposed that miR-210 was significantly decreased in peripheral blood of patients with chronic obstructive pulmonary disease, and had a high diagnostic value of Sen (85.6%), Spe (72.6%), and AUC (0.821). Similar situations were reported in pulmonary tuberculosis (PTB). According to the research of Zhang et al., 113 six kinds of serum-derived miRNAs (miR-378, miR-483-5p, miR-22, miR-29c, miR-101, and miR-320b) were significantly different in PTB compared with healthy people, and other respiratory diseases had a high Sen, Spe, and AUC of 95.0%, 91.8%, and 95%, respectively. Furthermore, by comparing acute lung injury (ALI) and healthy patients, the application of miR-140 from peripheral blood had a high AUC of 93.5% in ALI. 115 To some extent, the evidence supports the potential and possibility of miRNA in the application of diagnosis for asthma.
Related function and mechanism studies also support the pathogenesis role for miRNAs, such as miR-185-5p, miR-155, let-7a, miR-21, and miR-1165-3p, as biomarkers for asthma. Studies have shown that miR-155 could inhibit interleukin 13 (IL-13)-induced bronchial smooth muscle cell proliferation and migration by targeting TAB2 and affecting asthma signaling pathways, and also participates in allergic airway inflammation by regulating the transcription factor PU1.111,116 miR-21 could stimulate fibroblasts through TGF-1, affecting relevant targets of the Wnt pathway, and thereby affect lung disease, especially lung fibroblast function in asthma according to the study of Ong et al. 117 Besides, Kumar et al. 118 reported that Let-7a could regulate the imbalance of T-lymphocyte subsets in asthma and changes the expression of Th2 and Th17-related cytokines IL-13 and IL-17. Furthermore, the upregulation of miR-1165-3p could lead to a decrease in airway hyperreactivity and airway inflammation through directly targeting IL-13. 119 As for miR-185-5p, it participates in calcium signaling by targeting NFAT and CaMKII proteins in cardiomyocytes, and may play a role in muscle cell hypertrophy, proliferation, and cell contraction in asthma.120,121 These results suggest that these biomarker candidates play a role in the pathogenesis of asthma.
According to our results, the combined miRNAs (miR-185-5p, miR-155, let-7a, miR-21, miR-320a, miR-1246, miR-144-5p, and miR-1165-3p) could be a potential biomarker for the diagnosis of asthma based on a relatively high Sen of 0.87, Spe of 0.84, and high AUC of 0.93. Sensitivity is the ability to correctly find an individual with a specific disease, while specificity is to correctly classify the person as disease-free. When faced with inconsistent trends of Sen and Spe, we need to consider the diseases themselves in the clinical setting. For instance, for diseases with high mortality like cancers, biomarkers with high sensitivity are essential for early screening. Meanwhile, in the course of disease diagnosis and treatment, especially for those with obvious side effects, a tool with high specificity is required. Besides, the value of AUC can directly reflect the diagnostic effect. AUC between 0.5 and 0.7 indicates a low diagnostic value, a value between 0.7 and 0.9 is good, and above 0.9 is considered very good.
However, there was some heterogeneity in the pooled quantitative statistics for the combination of the above eight miRNAs. From the results of subgroup analysis and meta-regression analysis, we found that age may be one of the main causes of heterogeneity, which suggested that it would be better to perform analyses in different age groups to explore the diagnosis role of miRNAs for asthma in future research. Besides, the qualitative analysis also provided some evidence for understanding the origin of heterogeneity to some extent. For instance, the expression level for miR-155 could go in a different direction when compared with different control groups.49,72 Moreover, depending on the cut-off of expression value of miRNAs, the Sen and Spe for miR-155 could be as high as 100% 51 or go down to 80% and 89%, respectively. 61 Similar situations of samples derived from different regions or different cut-off also affect the results of miR-21 for asthma.26,27,51,92 These indicate that further research could be optimized from the above aspects to increase the homogeneity.
There are still some limitations to this analysis. Firstly, there were only five studies available for quantitative analysis, resulting in a small sample size of patients and controls included in the study, which may weaken the diagnostic value of miRNAs in asthma. Besides, due to the limited amount of available data, we were unable to explore the diagnostic value of individual miRNAs for asthma. Nor can we compare the diagnostic power between a single miRNA and the combination of specific miRNAs in asthma. Additionally, we did not explore the relationship between miRNAs and related clinical phenotypes. Finally, although the bivariate model is widely used in diagnostic meta-analysis,122–125 we were not able to verify the results in an independent data set due to the limitations of the included data.
In conclusion, this study suggests that the combination of miR-185-5p, miR-155, let-7a, miR-320a, miR-1246, miR-144-5p, miR-21, and miR-1165-3p may have a potential diagnostic value for asthma.
Supplemental Material
sj-docx-10-tar-10.1177_1753466620981863 – Supplemental material for A comprehensive analysis of microRNAs as diagnostic biomarkers for asthma
Supplemental material, sj-docx-10-tar-10.1177_1753466620981863 for A comprehensive analysis of microRNAs as diagnostic biomarkers for asthma by Li Xu, Minhan Yi, Yun Tan, Zixun Yi and Yuan Zhang in Therapeutic Advances in Respiratory Disease
Supplemental Material
sj-docx-11-tar-10.1177_1753466620981863 – Supplemental material for A comprehensive analysis of microRNAs as diagnostic biomarkers for asthma
Supplemental material, sj-docx-11-tar-10.1177_1753466620981863 for A comprehensive analysis of microRNAs as diagnostic biomarkers for asthma by Li Xu, Minhan Yi, Yun Tan, Zixun Yi and Yuan Zhang in Therapeutic Advances in Respiratory Disease
Supplemental Material
sj-docx-6-tar-10.1177_1753466620981863 – Supplemental material for A comprehensive analysis of microRNAs as diagnostic biomarkers for asthma
Supplemental material, sj-docx-6-tar-10.1177_1753466620981863 for A comprehensive analysis of microRNAs as diagnostic biomarkers for asthma by Li Xu, Minhan Yi, Yun Tan, Zixun Yi and Yuan Zhang in Therapeutic Advances in Respiratory Disease
Supplemental Material
sj-docx-7-tar-10.1177_1753466620981863 – Supplemental material for A comprehensive analysis of microRNAs as diagnostic biomarkers for asthma
Supplemental material, sj-docx-7-tar-10.1177_1753466620981863 for A comprehensive analysis of microRNAs as diagnostic biomarkers for asthma by Li Xu, Minhan Yi, Yun Tan, Zixun Yi and Yuan Zhang in Therapeutic Advances in Respiratory Disease
Supplemental Material
sj-docx-8-tar-10.1177_1753466620981863 – Supplemental material for A comprehensive analysis of microRNAs as diagnostic biomarkers for asthma
Supplemental material, sj-docx-8-tar-10.1177_1753466620981863 for A comprehensive analysis of microRNAs as diagnostic biomarkers for asthma by Li Xu, Minhan Yi, Yun Tan, Zixun Yi and Yuan Zhang in Therapeutic Advances in Respiratory Disease
Supplemental Material
sj-docx-9-tar-10.1177_1753466620981863 – Supplemental material for A comprehensive analysis of microRNAs as diagnostic biomarkers for asthma
Supplemental material, sj-docx-9-tar-10.1177_1753466620981863 for A comprehensive analysis of microRNAs as diagnostic biomarkers for asthma by Li Xu, Minhan Yi, Yun Tan, Zixun Yi and Yuan Zhang in Therapeutic Advances in Respiratory Disease
Supplemental Material
sj-pdf-1-tar-10.1177_1753466620981863 – Supplemental material for A comprehensive analysis of microRNAs as diagnostic biomarkers for asthma
Supplemental material, sj-pdf-1-tar-10.1177_1753466620981863 for A comprehensive analysis of microRNAs as diagnostic biomarkers for asthma by Li Xu, Minhan Yi, Yun Tan, Zixun Yi and Yuan Zhang in Therapeutic Advances in Respiratory Disease
Supplemental Material
sj-pdf-2-tar-10.1177_1753466620981863 – Supplemental material for A comprehensive analysis of microRNAs as diagnostic biomarkers for asthma
Supplemental material, sj-pdf-2-tar-10.1177_1753466620981863 for A comprehensive analysis of microRNAs as diagnostic biomarkers for asthma by Li Xu, Minhan Yi, Yun Tan, Zixun Yi and Yuan Zhang in Therapeutic Advances in Respiratory Disease
Supplemental Material
sj-pdf-3-tar-10.1177_1753466620981863 – Supplemental material for A comprehensive analysis of microRNAs as diagnostic biomarkers for asthma
Supplemental material, sj-pdf-3-tar-10.1177_1753466620981863 for A comprehensive analysis of microRNAs as diagnostic biomarkers for asthma by Li Xu, Minhan Yi, Yun Tan, Zixun Yi and Yuan Zhang in Therapeutic Advances in Respiratory Disease
Supplemental Material
sj-pdf-4-tar-10.1177_1753466620981863 – Supplemental material for A comprehensive analysis of microRNAs as diagnostic biomarkers for asthma
Supplemental material, sj-pdf-4-tar-10.1177_1753466620981863 for A comprehensive analysis of microRNAs as diagnostic biomarkers for asthma by Li Xu, Minhan Yi, Yun Tan, Zixun Yi and Yuan Zhang in Therapeutic Advances in Respiratory Disease
Supplemental Material
sj-pdf-5-tar-10.1177_1753466620981863 – Supplemental material for A comprehensive analysis of microRNAs as diagnostic biomarkers for asthma
Supplemental material, sj-pdf-5-tar-10.1177_1753466620981863 for A comprehensive analysis of microRNAs as diagnostic biomarkers for asthma by Li Xu, Minhan Yi, Yun Tan, Zixun Yi and Yuan Zhang in Therapeutic Advances in Respiratory Disease
Footnotes
Conflict of interest statement
The authors declare that there is no conflict of interest.
Funding
The authors disclosed receipt of the following financial support for the research, authorship, and/or publication of this article: This research was supported by the National Natural Science Foundation of China (No. 82001357, No. 31500999), the Hunan Provincial Natural Science Foundation of China (No. 2020JJ5951), the Youth Science Foundation of Xiangya Hospital (No. 2019Q17), the International Postdoctoral Exchange Fellowship Program (No. 2020118), the Degree & Postgraduate Education Reform Project of Central South University (No. 2020JGB125), the Undergraduate Education Reform Project of Central South University (No. 2020jy146), and the Fundamental Research Funds for the Central Universities of Central South University (No. 2020zzts432).
Supplemental material
The reviews of this paper are available via the supplemental material section.
References
Supplementary Material
Please find the following supplemental material available below.
For Open Access articles published under a Creative Commons License, all supplemental material carries the same license as the article it is associated with.
For non-Open Access articles published, all supplemental material carries a non-exclusive license, and permission requests for re-use of supplemental material or any part of supplemental material shall be sent directly to the copyright owner as specified in the copyright notice associated with the article.