
Abstract
Background:
Respiratory viruses are important etiologies of community-acquired pneumonia. However, current knowledge on the prognosis of respiratory virus-related pneumonia (RV-p) is limited. Thus, here we aimed to establish a clinical predictive model for mortality of patients with RV-p.
Methods:
A total of 1431 laboratory-confirmed patients with RV-p, including 1169 and 262 patients from respective derivation and validation cohorts from five teaching hospitals in China were assessed between January 2010 and December 2019. A prediction rule was established on the basis of risk factors for 30-day mortality of patients with RV-p from the derivation cohort using a multivariate logistic regression model.
Results:
The 30-day mortality of patients with RV-p was 16.8% (241/1431). The RV-p score was composed of nine predictors (including respective points of mortality risk): (a) age ⩾65 years (1 point); (b) chronic obstructive pulmonary disease (1 point); (c) mental confusion (1 point); (d) blood urea nitrogen (1 point); (e) cardiovascular disease (2 points); (f) smoking history (2 points); (g) arterial pressure of oxygen/fraction of inspiration oxygen (PaO2/FiO2) < 250 mmHg (2 points); (h) lymphocyte counts <0.8 × 10⁹/L (2 points); (i) arterial PH < 7.35 (3 points). A total of six points was used as the cut-off value for mortality risk stratification. Our model showed a sensitivity of 0.831 and a specificity of 0.783. The area under the receiver operating characteristic curve was more prominent for RV-p scoring [0.867, 95% confidence interval (CI)0.846–0.886] when compared with both pneumonia severity index risk (0.595, 95% CI 0.566–0.624, p < 0.001) and CURB-65 scoring (0.739, 95% CI 0.713–0.765, p < 0.001).
Conclusion:
RV-p scoring was able to provide a good predictive accuracy for 30-day mortality, which accounted for a more effective stratification of patients with RV-p into relevant risk categories and, consequently, help physicians to make more rational clinical decisions.
The reviews of this paper are available via the supplemental material section.
Introduction
Community-acquired pneumonia (CAP) is a common infectious disease. Despite the current advances in medical technology and global economy, CAP has considerably contributed to increased morbidity and mortality across the globe.1,2 As a result of advances in nucleic acid diagnostics and its clinical applications, respiratory viruses (RVs) have been increasingly recognized as a major player in the occurrence of CAP.3,4 Previous research has indicated that the prevalence of RVs in CAP ranges from 20% to 50%,5,6 which is eventually higher than that of Streptococcus pneumoniae, 7 the most common pathogen in patients with CAP. One European meta-analysis, comprising 21 studies, has indicated that the pooled proportion of RVs in patients with CAP is 22% [95% confidence interval (CI) of 18–27%]. However, this percentage increased to 29% (95% CI of 25–34%) in patients who underwent polymerase chain reaction (PCR) diagnostic methods. 8
Emergent work has focused on evaluating illness severity upon confirmation of diagnosed pneumonia. For this, several prediction rules have been established to help clinicians anticipate the mortality rate of patients with pneumonia. Among the major assessment tools, the score for mental confusion, urea, respiratory rate, blood pressure, age ⩾65 years, known as the CURB-65 score, and the pneumonia severity index (PSI) are the most widely used indices capable of predicting 30-day mortality rates for patients diagnosed with CAP.9,10 However, the validity of these two measures in patients affected by respiratory virus-related pneumonia (RV-p) is questionable. A few studies focusing on influenza pneumonia have suggested that the CURB-65/PSI score is not powerful enough in assessing disease severity.11,12 Therefore, current knowledge about potential predictors for mortality due to RV-p is restricted, especially in regard to immunocompetent individuals with non-influenza RV-p.13–15 Hence, no standard procedures for the calculation of severity scores in the setting of RV-p have been developed.
Based on this rationale, we conducted a multicenter, retrospective study aiming to establish an easy-to-use and reliable severity assessment tool that comprises parameters at admission to predict the 30-day mortality rate of patients with RV-p.
Methods
Study design and patient recruitment
Hospitalized patients who tested positive for the presence of nucleic acids from nine distinct types of RVs (i.e. influenza, respiratory syncytial virus, rhinovirus, parainfluenza virus, metapneumovirus, adenovirus, coronavirus, enterovirus, and bocavirus) were screened. Virus detection was performed at the microbiology laboratories of five tertiary hospitals in China, between 1 January 2013 and 31 May 2019. Details about these participating centers are listed in Supplemental Material 1. Patients with RV-p confirmed by laboratory tests were included. Exclusion criteria were: patients aged less than 18 years old; patients not diagnosed with CAP (i.e. pneumonia onset ⩾48 h postadmission and hospitalized within the last 28 days) 16 due to limited association between viral respiratory infection and nosocomial pneumonia; patients affected by immunocompromised factors, since the clinical characteristics and outcomes in immunocompromised patients with RV-p might be distinct from those of immunocompetent hosts.17,18
Disease and treatment definitions
Patients with RV-p were defined as those individuals who were positive for RV-derived nucleic acids, according to PCR-utilizing respiratory specimens (i.e. nasal/nasopharyngeal swabs, sputum, bronchial aspirates, or bronchoalveolar lavage fluid), and who also manifested respiratory symptoms, together with newly emerging pulmonary infiltrates, as detected by chest radiograph. Early neuraminidase inhibitor (NAI) therapy was defined as any NAI administered, within 2 days of illness onset, in patients with influenza-related pneumonia. 19 Systemic corticosteroid usage was defined when at least one dose of any systemic corticosteroid was administered during hospitalization. Community-acquired respiratory conditions co-infected with pathogens were defined upon pathogen identification within the first 48 h following admission, using standard microbiologic procedures. The microbiological criteria of co-infection are shown in Supplemental Material 2). 20
Data collection
Patient data were retrospectively retrieved from the medical records using a standardized case report form. These data included: demographic information; underlying disease (comorbidities are illustrated in Supplemental Material 3); clinical symptoms; vital signs; laboratory and radiological findings at admission; community-acquired respiratory co-infections; management and outcomes (i.e. administration of NAIs, antibiotics, systemic corticosteroids, invasive and noninvasive mechanical ventilation, admittance to the intensive care unit (ICU), and 30-day mortality). Patients hospitalized for fewer than 30 days were followed up by phone to determine their survival status.
Statistical analysis
A total of 1431 patients with RV-p were randomly divided into two groups: a derivation cohort comprising 80% of the patients and a validation cohort with the remaining 20% of all affected subjects. The derivation cohort was used to establish the statistical model, while the validation cohort was used to validate this model.
According to the survival status after 30 days of admission, these 1431 patients were also divided into surviving and deceased groups. Baseline characteristics of these two groups were further compared. Variables with a p value < 0.1 in the univariate analyses were entered into a logistic regression model to explore respective 30-day mortality risk factors. For pragmatic reasons, the score for each predictor received an integer value relative to the regression coefficient (β). A cut-off point was designated following a Youden’s index from the receiver operating characteristic (ROC) curve. A Kaplan–Meier analysis was performed to compare the difference in 30-day mortality rates between the low- and high-risk groups, according to the designated cut-off value. The performance of respective cut-off scores was estimated by measuring the area under the ROC (AUROC) curve, followed by the quantification of sensitivity and specificity measures.
Data were normalized according to a Kolmogorov–Smirnov test. Variables with a normal distribution were presented as mean ± standard deviation. Alternatively, variables with a non-normal distribution were expressed as median. Categorical variables were analyzed by chi-square or Fisher’s exact tests. Continuous variables were examined according to Student’s t-test or the Mann–Whitney U test. For all analyses, a two-tailed p value < 0.05 was considered as statistically significant. All statistical analyses were calculated using SPSS (version 22.0) or MedCalc (version 19.0) software.
Ethical considerations
The study design was approved by the Ethics Committee of Beijing Jishuitan Hospital (No. 201911-15). Given the retrospective nature of this study, the Ethics Committee determined that an informed consent was not required.
Results
Screening process
A total of 4150 hospitalized patients, who tested positive for nucleic acids originating from RVs, were assessed. Thereafter, 1431 patients with laboratory-confirmed RV-p were recruited, including 693 infected with influenza A-related pneumonia, 386 with influenza B-related pneumonia, 127 with human rhinovirus-related pneumonia (RSV-p), 66 with rhinovirus-related pneumonia (hRV-p), 42 with parainfluenza virus-related pneumonia, 55 with metapneumovirus-related pneumonia, 51 with adenovirus-related pneumonia, and 11 patients co-infected with 2–3 types of viruses (4 patients with rhinovirus and parainfluenza, 4 with rhinovirus and metapneumovirus, and 3 with rhinovirus + parainfluenza + adenovirus) (Figure 1).

Patient screening algorithm for RV-p.
Overview of patients with RV-p
Upon assessment of clinical records, we verified that 54.2% (776/1431) of patients with RV-p were men, and 34.0% (478/1431) were over 65 years of age. The most frequent comorbidities detected among the affected patients were cardiovascular disease (24.2%, 347/1431), diabetes mellitus (11.5%, 165/1431), and chronic obstructive pulmonary disease (COPD) (10.8%, 155/1431). A total of 30.1% (431/1431) of patients had a history of smoking. Mental confusion and respiratory rates ⩾30 beats/min were identified in 13.4% (192/1431) and 13.5% (193/1431) of patients upon admission, respectively. Only 1.3% (19/1431) of patients presented a systolic blood pressure <90 mmHg, but 29.3% (403/1377) of patients showed arterial pressure of oxygen/fraction of inspiration oxygen (PaO2/FiO2) <250 mmHg. Multilobar infiltrates and pleural effusion were observed by chest radiograph in 72.4% (1036/1431) and 30.7% (440/1431) of patients, respectively (Table 1).
Comparison of clinical characteristics and outcomes between deceased and surviving patients.

Variables which were entered into the multivariate logistic regression model. The bold values are p values < 0.05, which represented significant differences between the surviving group and the deceased group.
Equivalent to methylprednisolone.
ALB, albumin; BG, blood glucose; BUN, blood urea nitrogen; COPD, chronic obstructive pulmonary disease; HB, hemoglobin; ICU, intensive care unit; IQR, interquartile range; NAI, neuraminidase inhibitor; pO2/FiO2, arterial pressure of oxygen/fraction of inspiration oxygen; SBP, systolic blood pressure; SD, standard deviation.
Co-infection with other community-acquired pathogens was identified in 33.3% (476/1431) of patients. The top three pathogenic agents identified were Klebsiella pneumoniae (33.2%, 158/476), Streptococcus pneumoniae (25.2%, 120/476), and Staphylococcus aureus (18.9%, 90/476) (Supplemental Material 4).
During hospitalization, all patients with RV-p were administered with antibiotics. About 21.3% (305/1431) of patients received systemic corticosteroids. The median dose of systemic corticosteroids was equivalent to 0.7 mg/kg methylprednisolone, and the mean duration of this treatment was 2 days. Noninvasive and invasive ventilation were conducted in 13.7% (196/1431) and 15.7% (224/1431) of patients, respectively. Moreover, 19.3% (276/1431) of patients were admitted to the ICU, and the 30-day all-cause mortality was 16.8% (241/1431) (Table 1).
No significant differences were observed in regard to demographic characteristics, clinical features, clinical management, and outcomes between patients from both the derivation (n = 1169) and validation (n = 262) cohorts (Supplemental Material 5).
Stratification of mortality rates in patients with RV-p according to CURB-65 score and PSI
The actual and predicted mortality rates in patients with RV-p were stratified by PSI risk class as well as CURB-65 score (Supplemental Material 6). Regarding the deceased patients, the proportions of those with PSI risk from I to V were 21.6% (52/241), 14.9% (36/241), 26.6% (64/241), 36.9% (89/241), and 0% (0/241), respectively. The proportions of deceased patients with CURB-65 scores from 0 to 5 were 1.7% (4/241), 48.5% (117/241), 17.4% (42/241), 32.4% (78/241), and 0% (0/241), respectively.
Risk factors for 30-day mortality in patients with RV-p
According to our univariate analyses, the following factors and/or conditions were positively associated with the 30-day mortality rate of patients with RV-p: age ⩾65 years; cardiovascular disease; COPD; chronic kidney disease; obesity; smoking history; lymphocyte counts <0.8 × 10⁹/L; hemoglobin levels <100 g/L; serum albumin levels <35 g/L; blood urea nitrogen (BUN) >7 mmol/L; arterial PH < 7.35; PaO2/FiO2 <250 mmHg; systemic corticosteroid use. After their identification, these variables were evaluated by a backward stepwise logistic regression analysis to possibly explore putative independent risk factors related to 30-day mortality (Table 1).
A multivariate logistic regression model was designed, thus revealing that the following variables/conditions were significantly associated with the 30-day mortality of patients with RV-p (Figure 2): (Continued) (a) age ⩾65 years [odds ratio (OR) 2.205, 95% CI 1.336–3.639, p = 0.001; 1 point]; (b) COPD (OR 1.891, 95% CI 1.026–3.484, p = 0.041; 1 point); (c) mental confusion (OR 2.239, 95% CI 1.028–4.873, p = 0.042; 1 point); (d) BUN >7 mmol/L (OR 2.348, 95% CI 1.354–4.074, p = 0.002; 1 point); (e) PaO2/FiO2 < 250 mmHg (OR 2.727, 95% CI 1.743–4.264, p < 0.001; 2 points); (f) cardiovascular disease (OR 4.132, 95% CI 1.790–9.535, p < 0.001; 2 points); (g) smoking history (OR 4.674, 95% CI 2.510–8.703, p < 0.001; 2 points); (h) lymphocyte counts <0.8 × 10⁹/L (OR 5.622, 95% CI 3.065–10.314, p < 0.001; 3 points); (i) arterial PH <7.35 (OR 7.829, 95% CI 3.587–17.088, p < 0.001; 3 points). In order to develop a simple and useful clinical predicting tool, a relative weight was assigned according to the regression coefficient (β) of each categorical variable (Figure 2).

Risk factors associated with mortality of patients with RV-p in multivariate analysis.
Comparison of severity scores related to the mortality prediction
As indicated, the AUROC curve of the derivation cohort was 0.864 (95% CI 0.841–0.885). This value was higher than the one obtained by CURB-65 score (AUROC = 0.736, 95% CI 0.707–0.764, p < 0.001) and the PSI risk class (AUROC = 0.602, 95% CI = 0.570–0.633, p < 0.001) (Supplemental Material 7 and Supplemental Figure 1). At the same time, the AUROC curve of the validation cohort was 0.910 (95% CI 0.861–0.946), which was also higher than the CURB-65 score (AUROC = 0.753, 95% CI 0.686–0.811, p < 0.001) and the PSI risk class (AUROC = 0.567, 95% CI 0.494–0.637, p < 0.001) (Supplemental Material 8 and Supplemental Figure 2). When considering the whole patient cohort (n = 1431), the AUROC was 0.867 (95% CI 0.846–0.886), which was again higher than the CURB-65 score (AUROC = 0.739, 95% CI 0.713–0.765, p < 0.001) as well as the PSI risk class (AUROC = 0.595, 95% CI 0.566–0.624, p < 0.001) (Table 2 and Figure 3). The sensitivity, specificity, and actual mortality associated with the RV-p scores for all patients positive with RV-p are listed (Table 3). In accordance with the cut-off score previously described, patients were divided into low- and high-risk groups based on a threshold value of 6. Kaplan–Meier survival curves indicated that 30-day mortality rates were significantly elevated in high-risk patients when compared with patients at lower risk (46.6% versus 4.7%, log-rank test, p < 0.001) (Figure 4).
AUROC for mortality predictions in patients with RV-p (full sample).
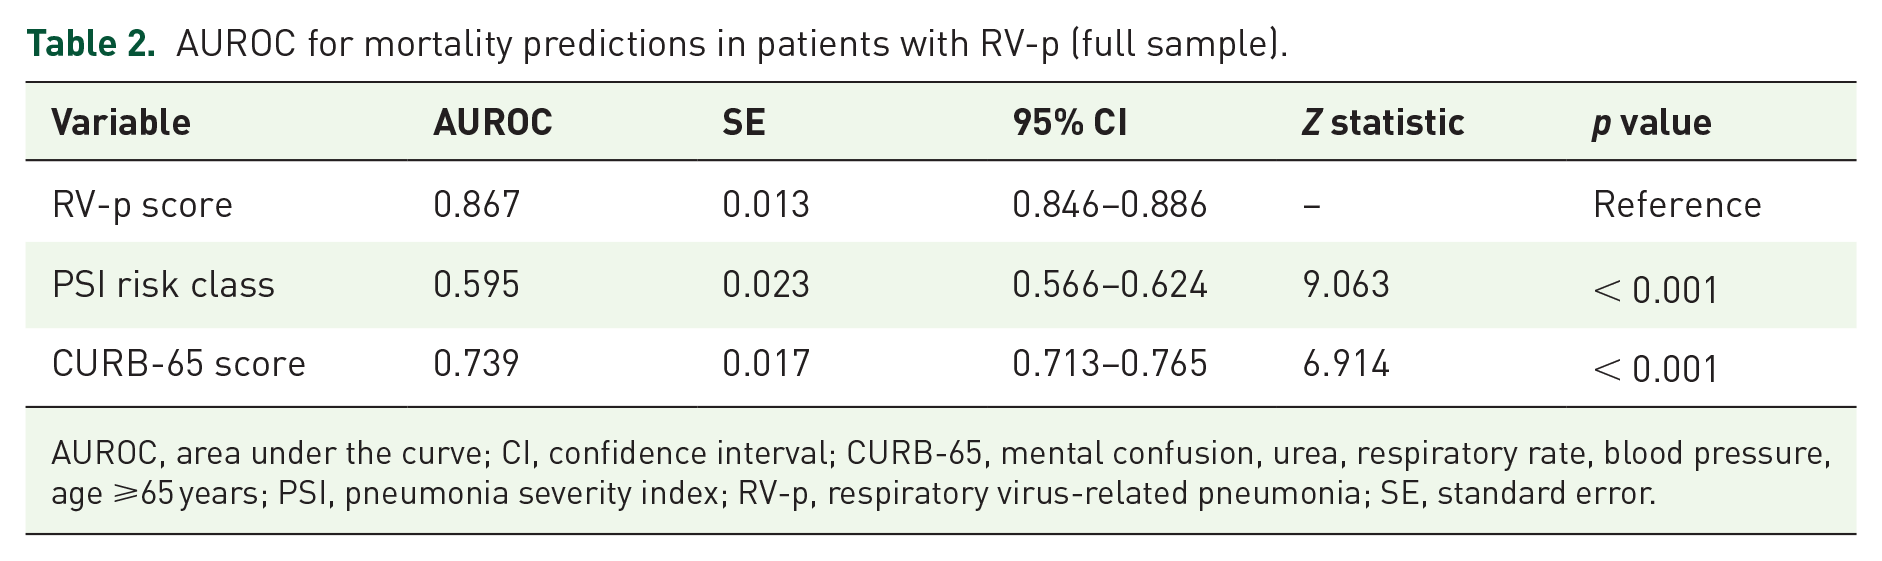
AUROC, area under the curve; CI, confidence interval; CURB-65, mental confusion, urea, respiratory rate, blood pressure, age ⩾65 years; PSI, pneumonia severity index; RV-p, respiratory virus-related pneumonia; SE, standard error.
RV-p score and actual mortality.

CI, confidence interval; +LR, positive likelihood ratio; –LR, negative likelihood ratio; RV-p, respiratory virus-related pneumonia.

ROCs for mortality prediction of three severity scores in patients with RV-p.

Survival curves of patients with RV-p by different levels of RV-p scores. For 30-day mortality: RV-p score <6: low risk; RV-p score ⩾6: high risk.
Discussion
According to our current multicenter and large sample study, we have identified several risk factors for mortality due to RV-p. However, we were able to establish a simple and reliable assessment tool for 30-day mortality in related RV-p patients. This scoring concept could predict disease prognosis with greater accuracy when compared with PSI and CURB-65.
To assess the severity and prognosis of CAP, both CURB-65 and PSI have been recommended as scoring methods by numerous organizations, including the British Thoracic Society, the Infectious Diseases Society of America, the American Thoracic Society, and the Chinese Thorax Society.9,10,21 Moreover, previous studies have confirmed that these two severity scores can be implemented in diverse clinical settings for more predictive accuracy. 22 However, some studies have recently suggested that CURB-65 and PSI are insufficient for predicting mortality in patients with influenza or other viral-based pneumonia.11,12,23 Likewise, our results suggest that these scoring methods may underestimate the mortality of patients with RV-p. In fact, 63.1% and 67.6% of the deceased patients had been classified as PSI risk class I–III and CURB-65 score 0–2, respectively, commonly regarded as low risks for death.
It is worth noting that PSI and CURB-65 scores are not well designed to categorize viral pneumonia cases. Indeed, patients discriminated by these scoring methods have been primarily diagnosed with standard or atypical bacterial pneumonia.24,25 Thus, some key predictors for the prognosis of viral pneumonia, such as lymphocyte counts, have not been included. Lymphocytopenia is often observed in severe influenza, with an incidence of 50–100%,26,27 but this condition can be also detected in critically ill patients affected by RSV and/or other respiratory virus infections.28,29 Shi and colleagues have suggested that lymphocytopenia serves as an early and reliable predictor of mortality in patients diagnosed with influenza A(H1N1)pdm09-related pneumonia. 30 Moreover, Vakil and colleagues 31 have indicated that lymphopenia is associated with increased 60-day mortality in patients with hematologic malignancies and severe RSV infection. Some reports have suggested that the apoptosis of CD4+ helper and CD8+ cytotoxic lymphocytes can be caused by increased plasma levels of the soluble Fas ligand and, in this case, caspase-1 appears to be involved in the reduction of T-lymphocyte levels. 32 Nevertheless, the mechanism(s) related to lymphocytopenia in severe RV infection are not fully elucidated.
Cellular immunity plays a critical role in fighting virus infection. In fact, virus-induced T-lymphocyte depletion and compromised cellular immunity are capable of delaying the clearance of viruses. Another explanation is that lymphocytes could be sequestered or recruited in respiratory tracts from the circulating blood. 33 The aggregation of lymphocytes in lungs would result in severe inflammation and tissue damage.
Smoking represents another important prognostic factor of RV-p. Significant epidemiological evidence has suggested that exposure to cigarette smoke can increase the incidence and severity of viral infections, including influenza, RSV, and adenoviruses.34–36 For instance, Wong and colleagues 34 have applied a Cox proportional hazard model to estimate the hazard ratio of mortality related to an increase of 10% in influenza virus activity in healthy (nonsmoker) individuals as well as previous and current smokers. In this case, it has been found that influenza-associated hazard ratio is greater in current and ex-smokers, in regard to mortality due to natural causes, and cardiovascular and respiratory diseases. Furthermore, numerous studies have previously confirmed that passive smoking exposure is associated with increased disease severity of RSV airway infection in children. 35 A prospective, population-based cohort study, performed by Miller and colleagues, 36 has revealed that current smokers or individuals living with a smoker are more likely to be hospitalized after RSV infection. The same association of smoking, with worse outcome, has also been observed in a recent epidemiological study of the SARS-CoV-2 virus. 37 Smoking may disrupt the normal defenses of the respiratory tract by causing peribronchiolar inflammation, slowing mucociliary clearance, decreasing pulmonary dendritic cells, and/or damaging respiratory epithelial cells. 38 Specifically, smoking can induce inflammatory mediators in vitro and suppress innate immunity against virus infection in a mouse model. 39 Furthermore, smoking might increase viral replication by directly suppressing epithelial antiviral pathways and, at the same time, facilitating cytokine release by the activation of mucosal innate immunity and increasing DNA methylation upon viral infection. 40 It is noteworthy that smoking is also associated with increased mortality of patients with RV-p independent of COPD.
Previous studies have shown that severe influenza A(H1N1)pdm09 often occurs in young individuals, as indicated by a large proportion of patients aged 30–50 years experiencing acute respiratory failure. 41 However, in the context of seasonal influenza and other non-influenza respiratory virus infections, advanced age has been frequently correlated with a poor outcome.42,43 Early studies have suggested that high levels of CD8+ T cells and low activity of natural killer cells are significantly correlated with the survival of older patients affected by infectious diseases, thus suggesting that aging may lead to an increasing immunity deficiency and mortality. 44 Hence, it appears unreasonable to deny fully the importance of aging in RV-p progression. Mental confusion, BUN, PaO2/FiO2, and arterial PH are parameters that have been included in PSI or CURB-65 scoring methods. Our study shows that these parameters are valuable predictors of mortality but, when used to predict the death risk of patients with RV-p, appropriate weight adjustment is needed to enhance the predictive capacity of the model. Previous studies have suggested that other variables, such as obesity, pregnancy, and some underlying diseases (e.g. diabetes mellitus, and chronic heart, pulmonary, and kidney diseases) are associated with increased mortality due to severe influenza infection.19,45 However, only cardiovascular disease and COPD have been validated as predictors for patients with RV-p. Similarly, bacterial co-infection and the systemic use of corticosteroids have been reported to correlate with a poor outcome of influenza or other respiratory virus infections.15,19 Despite the lack of significance of these variables in our multivariate analyses, further detailed studies are still needed to investigate the potency of these risk factors. For instance, the cumulative dose, duration, and timing of corticosteroid usage may influence the clinical outcomes of pneumonia caused by respiratory viruses.46,47
Despite the applicability of early NAI therapy to enhance the survival rates of patients with influenza pneumonia, this approach is unlikely to serve as a predictor for all patients with RV-p, due to the lack of approved antiviral medications for other non-influenza respiratory viruses. 48
RV-p score represents a very simple severity assessment tool that contains nine parameters widely used in the clinic, and even available in small and primary hospitals. In addition, RV-p score can also serve as a reliable prediction rule. At first, ROC has shown some better predictive validity when compared with PSI risk class and CURB-65 score. Using a cut-off value of 6, the new RV-p score was able to stratify patients into two groups with significantly different death risks. Thus, we believe this novel assessment tool could be largely applied in a variety of clinical settings for patients with RV-p.
Some limitations of our current study should be pointed out. First, despite our representative sample size and comprehensive statistical approach, the design of this retrospective study was prone to some unavoidable selection bias. For instance, nucleic acid tests were performed based on the subjective judgment of the attending physicians. Thus, it was possible that more severe (or milder) patients were inclined to be tested and, as a result, not all respiratory cases were eligible for swabbing, thus leading to some sort of selection. In this case, patients infected with human enterovirus, human coronavirus, and human bocavirus were not included. Second, due to the pre-established features of the retrospective design, incomplete patient data might have lowered the accuracy of our results. Finally, some studies have suggested that the clinical characteristics and prognosis of immunocompromised patients with RV-p is not the same as those for immunocompetent individuals. 49 Thus, it is important that our prediction model be further assessed in immunocompromised patients.
Conclusion
We have successfully developed a simple and reliable prediction rule for 30-day mortality in patients hospitalized with RV-p. This prediction rule may help clinicians to assess more accurately RV-p severity. Specifically, we advise clinicians to pay particular attention to those patients with RV-p scores ⩾6, since these individuals have an increased risk of death due to the disease.
Supplemental Material
Author_Response_1 – Supplemental material for Derivation and validation of a prediction rule for mortality of patients with respiratory virus-related pneumonia (RV-p score)
Supplemental material, Author_Response_1 for Derivation and validation of a prediction rule for mortality of patients with respiratory virus-related pneumonia (RV-p score) by Liang Chen, Xiudi Han, YanLi Li, Chunxiao Zhang and Xiqian Xing in Therapeutic Advances in Respiratory Disease
Supplemental Material
Author_Response_2 – Supplemental material for Derivation and validation of a prediction rule for mortality of patients with respiratory virus-related pneumonia (RV-p score)
Supplemental material, Author_Response_2 for Derivation and validation of a prediction rule for mortality of patients with respiratory virus-related pneumonia (RV-p score) by Liang Chen, Xiudi Han, YanLi Li, Chunxiao Zhang and Xiqian Xing in Therapeutic Advances in Respiratory Disease
Supplemental Material
Reviewer_1_v.1 – Supplemental material for Derivation and validation of a prediction rule for mortality of patients with respiratory virus-related pneumonia (RV-p score)
Supplemental material, Reviewer_1_v.1 for Derivation and validation of a prediction rule for mortality of patients with respiratory virus-related pneumonia (RV-p score) by Liang Chen, Xiudi Han, YanLi Li, Chunxiao Zhang and Xiqian Xing in Therapeutic Advances in Respiratory Disease
Supplemental Material
Reviewer_1_v.2 – Supplemental material for Derivation and validation of a prediction rule for mortality of patients with respiratory virus-related pneumonia (RV-p score)
Supplemental material, Reviewer_1_v.2 for Derivation and validation of a prediction rule for mortality of patients with respiratory virus-related pneumonia (RV-p score) by Liang Chen, Xiudi Han, YanLi Li, Chunxiao Zhang and Xiqian Xing in Therapeutic Advances in Respiratory Disease
Supplemental Material
Reviewer_2_v.1 – Supplemental material for Derivation and validation of a prediction rule for mortality of patients with respiratory virus-related pneumonia (RV-p score)
Supplemental material, Reviewer_2_v.1 for Derivation and validation of a prediction rule for mortality of patients with respiratory virus-related pneumonia (RV-p score) by Liang Chen, Xiudi Han, YanLi Li, Chunxiao Zhang and Xiqian Xing in Therapeutic Advances in Respiratory Disease
Supplemental Material
Reviewer_2_v.2 – Supplemental material for Derivation and validation of a prediction rule for mortality of patients with respiratory virus-related pneumonia (RV-p score)
Supplemental material, Reviewer_2_v.2 for Derivation and validation of a prediction rule for mortality of patients with respiratory virus-related pneumonia (RV-p score) by Liang Chen, Xiudi Han, YanLi Li, Chunxiao Zhang and Xiqian Xing in Therapeutic Advances in Respiratory Disease
Supplemental Material
Supplementary_files – Supplemental material for Derivation and validation of a prediction rule for mortality of patients with respiratory virus-related pneumonia (RV-p score)
Supplemental material, Supplementary_files for Derivation and validation of a prediction rule for mortality of patients with respiratory virus-related pneumonia (RV-p score) by Liang Chen, Xiudi Han, YanLi Li, Chunxiao Zhang and Xiqian Xing in Therapeutic Advances in Respiratory Disease
Footnotes
Acknowledgements
Author contribution(s)
Conflict of interest statement
The authors declare that there is no conflict of interest.
Funding
The authors disclosed receipt of the following financial support for the research, authorship, and/or publication of this article: This study was founded by Beijing JST research (ZR-201921).
Supplemental material
The reviews of this paper are available via the supplemental material section.
References
Supplementary Material
Please find the following supplemental material available below.
For Open Access articles published under a Creative Commons License, all supplemental material carries the same license as the article it is associated with.
For non-Open Access articles published, all supplemental material carries a non-exclusive license, and permission requests for re-use of supplemental material or any part of supplemental material shall be sent directly to the copyright owner as specified in the copyright notice associated with the article.