
Abstract
Sepsis is a leading cause of mortality. Plasma cytokine levels may identify those at increased risk of mortality from sepsis. Our aim was to understand how obesity alters cytokine levels during early sepsis and its correlation with survival. Six-week-old C57BL/6 male mice were randomized to control (non-obese) or high fat diet (obese) for 5–7 weeks. Sepsis was induced by cecal ligation and perforation (CLP). Cytokine levels were measured from cheek bleeds 8 h after CLP, and mice were monitored for survival. Other cohorts were sacrificed 1 h after CLP for plasma and tissue. Septic obese mice had higher survival. At 8 h after sepsis, obese mice had higher adiponectin, leptin, and resistin but lower TNFα and IL-6 compared to non-obese mice. When stratified by 24-h survival, adipokines were not significantly different in obese and non-obese mice. TNFα and IL-6 were higher in non-obese, compared to obese, mice that died within 24 h of sepsis. Diet and to sepsis significantly impacted the cecal microbiome. IL-6 is a prognostic biomarker during early sepsis in non-obese and obese mice. A plausible mechanism for the survival difference in non-obese and obese mice may be the difference in gut microbiome and its evolution during sepsis.
Introduction
Sepsis is a leading cause of morbidity and mortality worldwide.1–3 Despite the high mortality rate and association with long-term complications, therapeutic interventions for sepsis, comprised of supportive care and antimicrobial therapy, remain unchanged over the past several decades. 4 To improve outcomes from sepsis, a heterogeneous disease process that affects a heterogeneous population, there is an effort to move toward tailoring treatment to the individual. 5 To develop targeted interventions, enrichment strategies are employed to identify patients at increased risk for poor outcomes from sepsis (prognostic enrichment) and identify patients that will respond to a specific treatment based on their biologic characteristics (predictive enrichment).
Obesity, defined by the Centers of Disease Control and Prevention as body mass index (BMI) ≥ 95th percentile in children 2–19 years old and in adults as a BMI > 30 kg/m2, is an important biological variable to investigate during critical illness. Obesity is an ongoing epidemic in both pediatric and adult populations with increasing prevalence worldwide. 6 As the prevalence of obesity continues to rise, the number of overweight (BMI 25–29.9 kg/m2) and obese patients in intensive care units (ICU) is also increasing.7,8 Furthermore, there is evidence obesity impacts outcomes from sepsis; however, whether the impact is beneficial or harmful remains unclear. Several studies have demonstrated obesity is associated with increased risk of infection and increased risk of mortality during sepsis.9,10 In contrast, other studies demonstrate that obesity is associated with improved survival from sepsis, known as the “obesity paradox”.11–13
Plasma cytokines have been extensively studied as early biological markers (biomarkers) to predict outcomes and treatment responses during sepsis. Interleukin-6 (IL-6) has the most support in predicting length of hospitalization and mortality in pediatric and adult sepsis patients.14–19 However, IL-6 is not specific to sepsis, and IL-6 plasma levels change over the course of sepsis. Thus, there is no single cytokine that reliably and accurately predicts mortality from sepsis. Instead, more recent evidence suggests that a multiplex biomarker approach to prognosticate septic patients may be more reliable and accurate.14,20–22 These studies, however, did not analyze septic biomarkers based on weight categories. Therefore, it is unclear whether cytokine levels are impacted by obesity during sepsis and whether obesity impacts the prognostic value of these cytokines during sepsis.
To address this knowledge gap, we investigated whether obesity impacted cytokine expression and outcomes in mice with sepsis. We hypothesized that obese mice with sepsis have increased inflammatory and decreased anti-inflammatory cytokine expression compared to non-obese mice with sepsis and this would be associated with increased mortality. We found that obese mice had lower inflammatory cytokine levels and lower mortality compared to non-obese mice but no difference in bacterial burden. Given our knowledge that diet can impact the gut microbiome, which in turn can impact the immune response, we hypothesized that the difference in cytokine expression and mortality was due to non-obese mice having more pathogenic bacteria in the cecum during sepsis.
Methods
Murine model of diet-induced obesity
The investigations conformed to the Guide for the Care and Use of Laboratory Animals 23 and was approved by the Cincinnati Children's Hospital Medical Center (CCHMC) Institutional Animal Care and Use Committee. Mice were housed in the animal facility at CCHMC. Food and water were provided ad libitum. Male C57BL/6 mice at six weeks of age from Charles River Laboratories International, Inc (Wilmington, MA, USA) were randomized by cage to high-fat diet (HFD; TestDiet 58Y1:60% kcal provided by fat) or normal diet (ND; Formulab no.5008; 16% kcal provided by fat) for 6–8 weeks. Body weights were monitored weekly throughout the diet phase and within 24 h of the experiment. Mice fed a normal diet were the control groups and mice fed a high fat diet were the experimental groups. No mice were excluded from our studies. No blinding occurred during the study since the high fat diet is blue in color and the normal diet is brown.
Polymicrobial sepsis model
After the dietary intervention mice underwent cecal ligation and puncture (CLP) to induce polymicrobial sepsis. Mice were anesthetized with isoflurane, the abdomen was opened, the cecum exteriorized and ligated by a 3.0 ligature at its base with a 21 g needle, double puncture technique as previously described. 24 The peritoneum was closed with 3.0 suture and skin was closed with Gluture, a liquid topical adhesive. For pain management, mice received buprenorphine (0.05 mg/kg i.p) and 0.25% lidocaine (40uL/25 g subcutaneously) after surgery. Mice received 0.7 ml normal saline subcutaneously for fluid resuscitation and recovered from anesthesia on a heating pad.
Body composition
To quantify fat mass, lean mass, free water, and total water we analyzed body composition using NMR imaging by EchoMRI body composition analyzers, as previously described (EchoMRI, Houston, TX). 25
Survival studies
In separate studies, after the dietary intervention, mice underwent CLP to induce polymicrobial sepsis and were monitored for survival for 96 h. Whole blood was collected from the facial vein at 8 h after CLP. Mice were monitored every 6–8 h. An injury severity scale was used to assess the severity of symptoms. Mice were graded on a scale of 0 to 3 for lethargy, diarrhea, ocular discharge, and pilo-erection. A score of 0 referred to no signs of illness, with 1, 2, and 3 referring to minimum, mild, and severe symptoms. The scores were tallied for the four categories for each mouse, and if the total score was an 8 or higher, the mouse was euthanized and declared dead. Mice were censored at 96 h.
Adipokine and cytokine analysis
Plasma levels of leptin, IL-6, adiponectin, and TNFα were measured with a multiplex assay kit (EMD Millipore) using the manufacturer's protocol.
Bacterial burden
Under anesthesia, blood was collected via cardiac puncture to limit contamination. Blood underwent centrifugation for collection of plasma and then diluted in PBS. To collect peritoneal fluid, 2 ml of sterile PBS was injected into the peritoneal cavity and 1 ml was removed. The left lung was collected, flash frozen in liquid nitrogen, and homogenized in PBS. All samples were diluted in sterile PBS. The following dilutions were plated on sheep blood agar plates: plasma 1:100 and 1:1000; lung and peritoneal fluid 1:10,000 and 1:100,000. Colony-forming units were counted after 24 h.
Fecal shotgun metagenomics
DNA extraction was performed from 0.25 g of a stool sample with Power Fecal DNA Isolation Kit® by MO BIO® per kit instructions. DNA concentration was measured using Qubit®. Amplified library generation was performed with Nextera XT® adapters (Illumina, Inc), and sequencing was performed on an Illumina NovaSeq 6000 machine to obtain 150 bp DNA paired end reads to a depth of approximately 15 million reads per sample.
Raw sequence reads were extracted and demultiplexed using the Illumina program bcl2fastq. Raw reads were then filtered and trimmed for quality control using the program Sickle. 26 Trimmed reads were aligned using Kraken2 to a custom microbial genome database (that includes all RefSeq bacterial, fungal, parasitic, and viral genomes supplemented with additional bacterial and fungal genome sequences from the National Center for Bioinformatics to determine quantitative genus and species abundance for more than 40,000 microbial species genomes).27,28 An exact sequence read match of k-mer length 32 was used in Kraken to assign reads to the lowest common ancestor. Normalization of count data to the lowest number of total reads mapped among the samples was performed using rrarefy with the Vegan package in R to give the relative abundance at both the genus and species level. 29 To visualize differences in microbial composition between groups principal component analysis was performed using the Factoextra package in R. 30
Statistical analysis
Data were analyzed using Sigmaplot v.14.5 (SysStat Software, San Jose, CA, USA). Normality and equal variance were tested and if assumptions were not met, data was transformed with log10 or square-root., If the transformed data violated the assumptions then non-parametric test was performed. Normally distributed data were presented as mean + standard error of mean and non-normally distributed data were presented as median + interquartile range. Continuous data with two groups were analyzed by t-test when data were normally distributed or Wilcoxon rank sum testing when data were non-normally distributed. For continuous data with three or more groups, statistical analysis was performed using two-way ANOVA with the Holm Sidak method for parametric data and the two way ANOVA on rank with the Holm Sidak post hoc test for nonparametric data. Survival analysis was performed by the Kaplan-Meier method with log-rank test. A value of p ≤ 0.05 was considered significant. Statistical testing for differences in overall microbial community composition between groups was performed using the multi-response permutation procedures (MRPP) test from the vegan package in R. 29 To identify individual microbial taxa that significantly differ between groups, the abundance of each species was compared using Wilcoxon rank sum test. Organisms with statistically significant differences between groups then underwent effect size determination using shrinkage determinant analysis (SDA) as previously described. 31 Any taxa that was significantly different after Bonferroni correction and having an SDA effect size of greater than 0.3 was considered as significantly different between treatment groups.
Results
Mice fed a high fat diet had higher weight and fat mass
To utilize a diet-induced obesity model, six-week-old C57BL/6 mice were randomized to a high fat (HFD) (60% kcal fat) or normal diet (ND) (16% kcal fat) (n = 16/group). After seven weeks of feeding, HFD-fed mice compared to ND-fed mice had higher weight (34.9 g ± 3.5 vs 28.5 g ± 2, p < 0.05), higher fat mass (10.9 g ± 2.5 vs. 1.5 g ± 0.9, p < 0.05), lower lean mass (23.6 g ± 2 vs. 26.7 g ± 2.4, p < 0.05), and lower total water mass (19.7 g ± 1.7 vs. 22.3 g ± 2.1, p < 0.05). Based on these data we termed HFD-fed mice obese (Figure 1).

Mice fed a high fat diet have higher weight and fat mass than mice fed a normal diet. Six-week-old C57BL/6 mice were randomized to a high fat (HFD) (60% kcal fat) or normal diet (ND) (16% kcal fat). After seven weeks of feeding, body composition was measured by ECHOMRI. Vertical box represents 25th percentile (bottom line), median (middle line), and 75th percentile (top line) values; whiskers represent 10th and 90th percentiles. *p < 0.001 vs. non-obese mice by t-test. White box = non-obese; gray box = obese (n = 16/group).
Obese mice had a higher survival during sepsis
To determine the effects of obesity on outcomes from polymicrobial sepsis we performed a survival study. Polymicrobial sepsis was induced by CLP after seven weeks of feeding. Mice were scored for illness severity every 8 to 12 h and monitored for survival. All mice died within 96 h of sepsis. Obese mice had longer survival times following polymicrobial sepsis compared to non-obese mice (42 h (IQR 28.4–69.5) vs 20 h (IQR 11.3–25.5), respectively p = .002) (Figure 2).
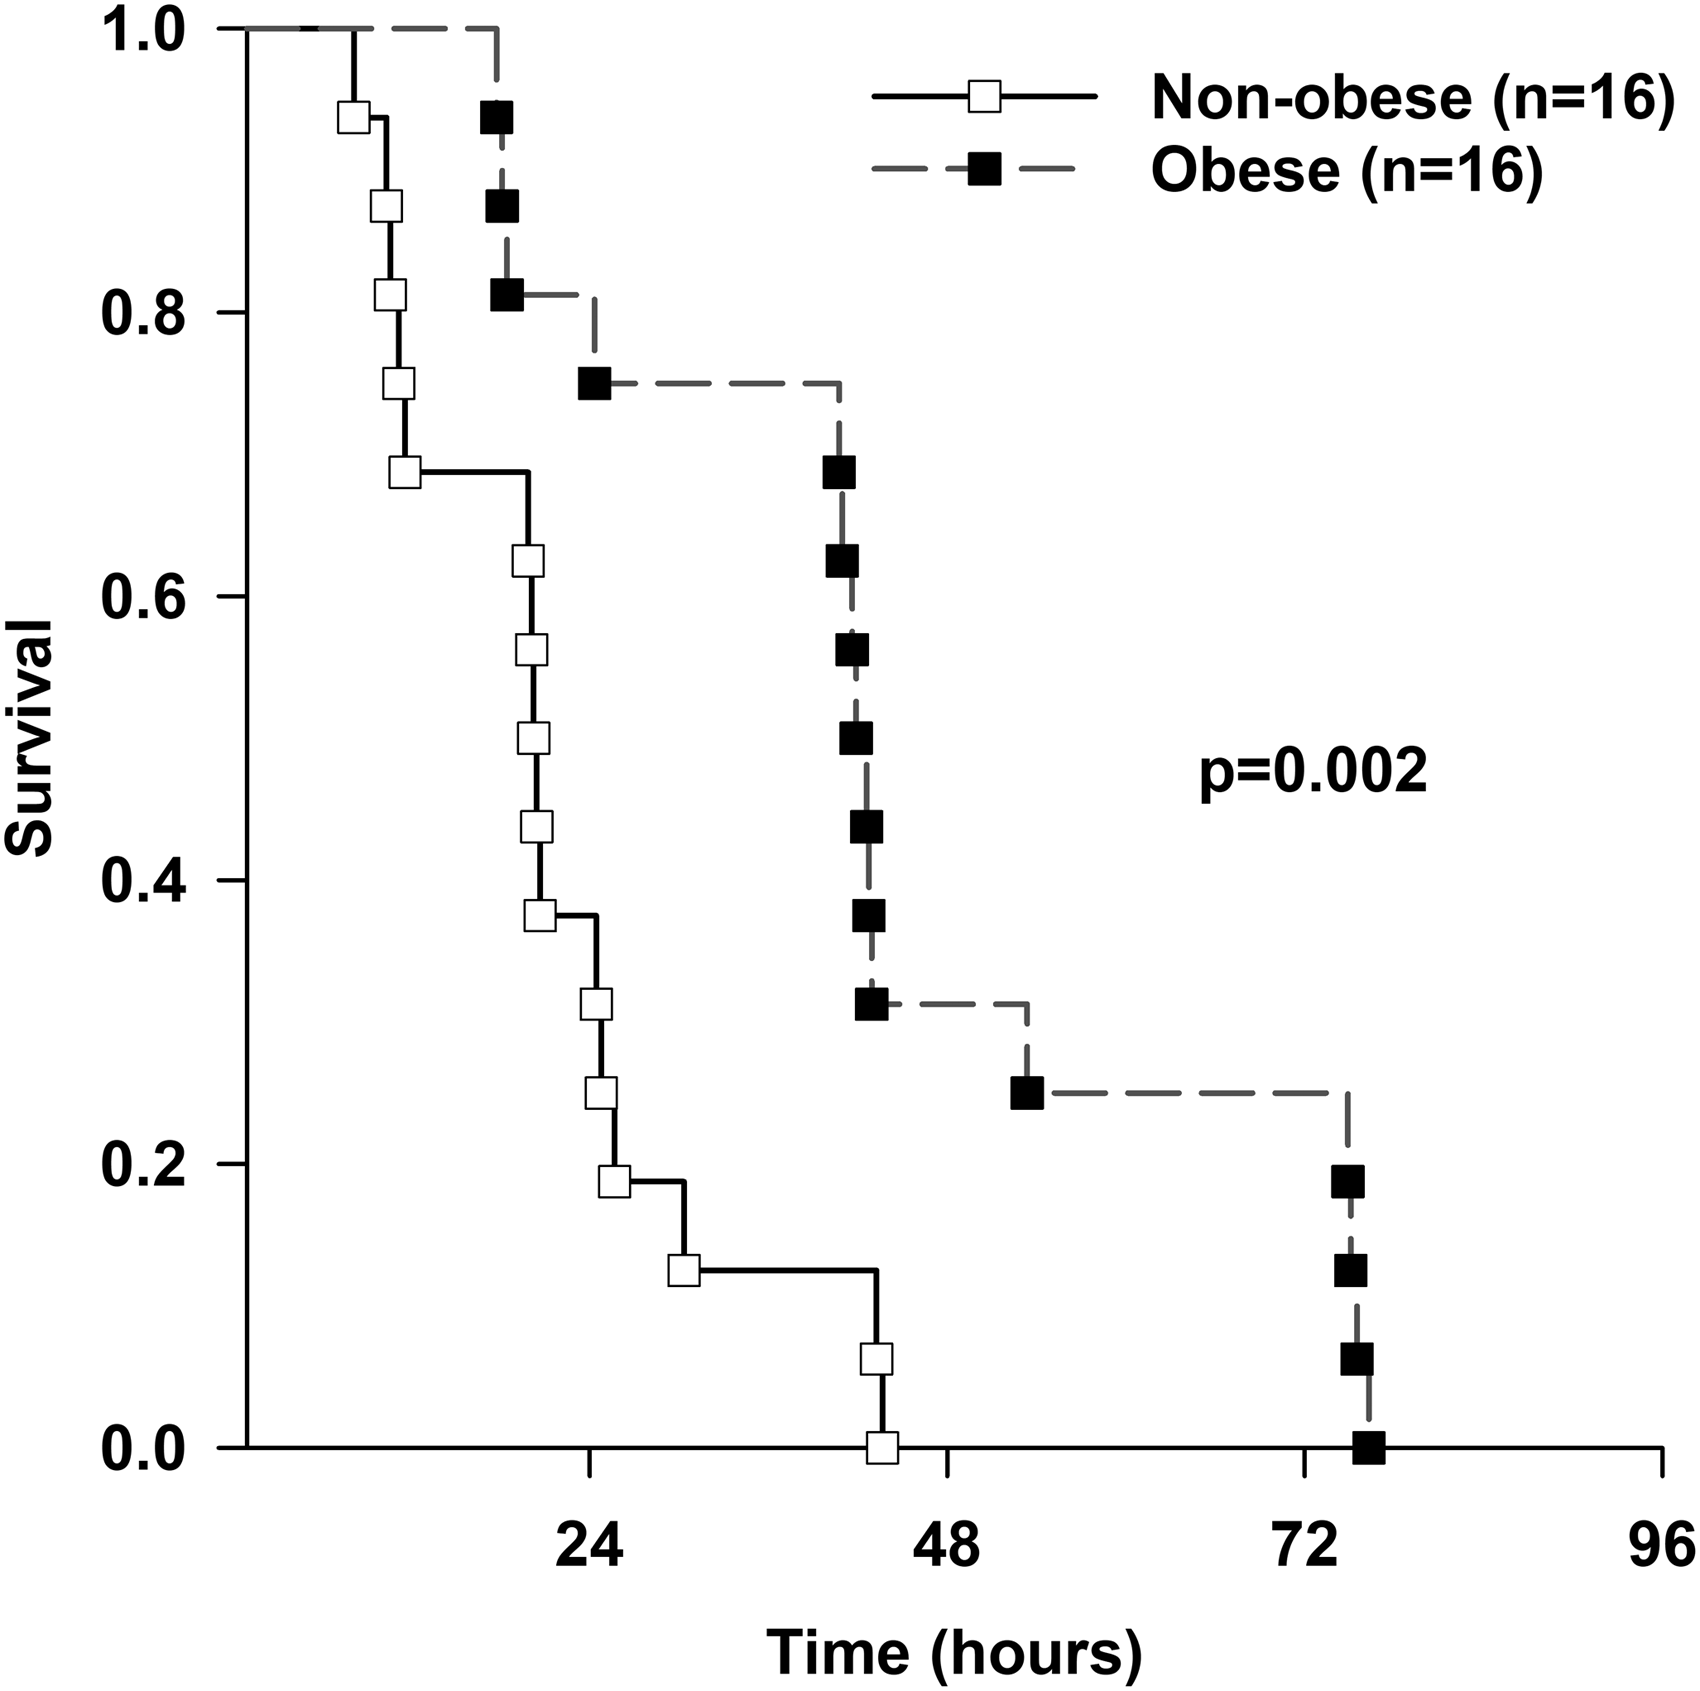
96-h survival for obese and non-obese mice. Obese mice have longer survival time after sepsis. Mice were randomized to HFD or ND for 7 weeks, CLP was performed, and survival was monitored. p = 0.002 by log-rank test (n = 16/group). White squares = non-obese, black squares = obese.
Obese mice had increased adipokine and decreased cytokine levels during early sepsis
Next, we investigated the effects of obesity on plasma adipose derived cytokine (adipokine) and pro-inflammatory cytokine levels during polymicrobial sepsis. We measured plasma adipokines and cytokines at 8 h after CLP in non-obese and obese mice, and then monitored these mice for survival. At 8 h after CLP, septic obese mice had higher plasma adiponectin level compared to septic non-obese mice (12,031 ng/ml ± 1559 vs 6269 ng/ml ± 2,345, p < 0.05) (Figure 3A). Septic obese mice had higher plasma levels of leptin (8 h after CLP) compared to septic non-obese mice (46 ng/ml IQR 34–46) vs 4.2 ng/ml (IQR 1.4–7.3), p < 0.05) (Figure 3B). Plasma resistin levels at 8 h after CLP were also higher in septic obese mice compared to septic non-obese mice (3834 pg/ml (IQR 3103–5146) vs 1711 pg/ml (IQR 1200–2932), p < 0.05) (Figure 3C). Septic non-obese mice had higher TNFα levels compared to septic obese mice at 8 h after sepsis (426 pg/ml (IQR 166–1803) vs 40 pg/ml (IQR 31–113), p < 0.05) (Figure 4A). Similarly, septic non-obese mice had higher IL-6 levels compared to septic obese mice at 8 h after sepsis (317 ng/ml ± 237 vs 135 ng/ml ± 119, p < 0.05) (Figure 4B).

Adipokines are higher in septic obese mice compared to septic non-obese mice. Plasma adipokine levels were measured 8 h after polymicrobial sepsis induced by CLP. Adiponectin (A), leptin (B), and resistin (C) are all higher in septic obese mice compared to septic non-obese mice. Vertical box represents 25th percentile (bottom line), median (middle line), and 75th percentile (top line) values; whiskers represent 10th and 90th percentiles. #p < 0.05 vs. non-obese mice. White box = non-obese; gray box = obese (n = 16/group).

TNFα and IL-6 are lower in septic obese mice compared to septic non-obese mice. Plasma cytokine levels were measured 8 h after polymicrobial sepsis induced by CLP. TNFα (A) and IL-6 (B) are lower in septic obese mice compared to septic non-obese mice. Vertical box represents 25th percentile (bottom line), median (middle line), and 75th percentile (top line) values; whiskers represent 10th and 90th percentiles. #p < 0.05 vs. non-obese mice. White box = non-obese; gray box = obese (n = 16/group).
Adipokine levels do not predict survival in septic non-obese and obese mice
To determine if adipokine levels obtained during early sepsis could identify which mice are at increased risk for early mortality from sepsis, we compared adipokine levels measured at 8 h after CLP in non-obese and obese mice being monitored for survival. With a median survival of 25 h, we chose to compare non-obese and obese mice that were alive or dead at 24 h after CLP. There was no significant difference in plasma adiponectin, leptin, and resistin levels at 8 h after CLP between non-obese mice that were dead at 24 h compared to non-obese mice that were alive at 24 h (Figure 5). There was also no significant difference in plasma adiponectin, leptin, and resistin levels at 8 h after CLP in obese mice that were dead compared to those that were alive 24 h after CLP. Adiponectin, leptin, and resistin levels were higher in obese mice compared to non-obese mice regardless of survival at 24 h.

Adipokines are not significantly different in dead compared to alive septic mice. Plasma adiponectin (A), leptin (B), and resistin (C) at 8 h after CLP in non-obese and obese mice stratified by 24 h survival. Vertical box represents 25th percentile (bottom line), median (middle line), and 75th percentile (top line) values; whiskers represent 10th and 90th percentiles. #p < 0.05 vs. non-obese mice. White box = non-obese; gray box = obese (n = 3–13/group).
TNFα predicts survival in septic non-obese mice and Il-6 predicts survival in septic non-obese and obese mice
Given there was no significant interaction between 8 h adipokine levels and 24 h survival in septic obese and non-obese mice, we investigated whether plasma IL-6 and TNFα levels measured at 8 h after CLP were different in non-obese mice and obese mice that were dead or alive at 24 h after CLP. We found that TNFα, measured at 8 h after CLP, was higher in non-obese mice that were dead at 24 h after CLP compared to those that were alive at 24 h after CLP (1278 pg/ml ± 1058 vs 227 pg/ml ± 180, p < 0.05) (Figure 6A). We found no difference when comparing TNFα from obese mice who survived to TNFα from obese mice who died. TNFα was significantly lower in obese mice compared to non-obese mice that were alive at 24 h after CLP (227 pg/ml ± 180 vs 63 pg/ml ± 48 vs 227 pg/ml ± 180, p < 0.05) and that were dead at 24 h after CLP (115 pg/ml ± 99 vs 1278 pg/ml ± 1,058, p < 0.05).

TNFα and IL-6 are significantly elevated in non-obese mice that die within 24 hours of sepsis. Plasma TNFα and IL-6 were measured 8 h after polymicrobial sepsis induced by CLP and mice were monitored for survival. Vertical box represents 25th percentile (bottom line), median (middle line), and 75th percentile (top line) values; whiskers represent 10th and 90th percentiles. #p < 0.05 vs. non-obese mice. *p < 0.05 vs alive mice. White box= non-obese; gray box= obese (n = 3–13/group).
Plasma IL-6 levels measured at 8 h after CLP were higher in non-obese mice that were dead at 24 h after CLP compared to non-obese mice that were alive at 24 h after CLP (427 ng/ml ± 207 vs 132 ng/ml ±159, p < 0.05) (Figure 6B). IL-6 was also higher in obese mice that were dead at 24 h after CLP compared to obese mice that were alive at 24 h after CLP (302 ng/ml ±159 vs 96 ng/ml ±94, p < 0.05). There was no significant difference in IL-6 in non-obese compared obese mice, when comparing those that lived and those that died.
Bacteria burden did not differ significantly in septic obese and non-obese mice
To determine whether obese mice and non-obese mice had significantly different bacterial burden during early sepsis, we collected and plated plasma, lung, and peritoneal fluid at 6 h after CLP. At 24 h after plating samples, colony-forming units were counted. There was no significant difference in the number of colony-forming units in septic obese mice compared to septic non-obese mice in plasma, lung, and peritoneal fluid (Figure 7). As there was no difference in the organism burden between obese and non-obese mice, we wondered if there was a difference in the community of organisms in the cecum, the source of organisms in the bloodstream. This led us to investigate the bacterial composition of the cecal microbiome.

Bacteria count from plasma, lung, and peritoneal fluid were not different in septic non-obese and obese mice. Plasma, lung, and peritoneal fluid collected 6h after CLP in non-obese and obese mice were plated and colony-forming-units were counted 24h later. White box= non-obese; gray box = obese (n = 8/group).
Obese mice had significantly different cecal microbiome compared to non-obese mice
CLP causes necrosis and bacteria seeding, both of which contribute to the inflammatory response. To investigate whether the microbiome in the cecum was impacted by diet and sepsis, the cecum was removed and cecal contents collected from mice without CLP or 1 h after CLP. Shotgun metagenome sequencing was performed on the cecal contents to identify bacterial species in the cecum. A comparison of the Shannon Diversity among groups showed a trend toward decreased diversity at 1 h after sepsis between the non-obese and obese mice; however, this did not reach statistical significance (Figure 8A). However, comparison of the gut microbiome composition using between-class principal-component analysis (PCA) with statistical demonstrated significant differences between the four groups: Non-obese mice without sepsis, obese mice without sepsis, non-obese mice 1 h after sepsis, and obese mice 1 h after sepsis (Figure 8B). The PCA revealed there was a significant difference in the composition of the microbiome between non-obese and obese. Furthermore, non-obese and obese groups 1 h after CLP had distinct cecal microbiome composition compared to their dietary controls. In composition analysis, there were 570 species that were differentially abundant at 0 h and 628 species at 1 h after CLP, even after using post-hoc false-discovery rate (FDR) correction, suggesting that diet and CLP have a large and significant impact on cecal microbiome (Supplemental Figure 1). The difference in the microbial composition of the cecum in non-obese and obese mice with sepsis may significantly contribute to the difference we observed in cytokine profiles and mortality.

Obese mice had significantly different cecal microbiome compared to non-obese mice. Shannon Diversity Index was not significantly different among groups (A). Principal Coordinate Analysis with samples plotted were significantly different among groups (B). Circles represent 95% confidence interval around the median. Circles without overlap indicate significantly different microbiomes, which was confirmed by MRPP testing.
Discussion
Sepsis is a disease process characterized by organ dysfunction in the setting of infection and during this process pro-inflammatory and anti-inflammatory cytokine levels are altered. There is significant interest in using cytokine levels as biomarkers to identify patients at risk of poor outcomes from sepsis; however, it is not well-understood how obesity impacts cytokine levels in the setting of sepsis. To determine the influence of obesity on cytokine and adipokine levels during sepsis, we used a well-described murine model of polymicrobial sepsis in diet-induced obese mice.
Our findings that septic obese mice had significantly longer survival compared to septic non-obese mice is consistent with other studies that use a diet-induced obesity murine model and cecal ligation and puncture to induce polymicrobial sepsis.32–34 Siegl et al. found that obese mice had a significantly smaller cecum compared to the non-obese mice and may contribute to the lower mortality in obese mice with polymicrobial sepsis from CLP. 33 Despite the size difference, the mice had similar plasma and peritoneal fluid bacterial burden and plasma IL-6 levels at 6 h after CLP, leading them to the conclusion that the severity of infection was similar in non-obese and obese mice. These same observations, including difference in cecum size, were noted in our own experiments.
While IL-6 was higher in septic non-obese compared to obese mice, this difference did not persist when stratified by 24-h survival, suggesting that severity of illness, not obesity, influences IL-6 levels. This is consistent with our lab's previous findings, in which there was no difference in IL-6 levels at 6 h after sepsis in non-obese and obese mice.25,35 IL-6 has previously been described as a good prognostic biomarker in septic non-obese mice, and our findings also support the use of IL-6 as a prognostic biomarker in septic obese mice.36–38
In contrast, TNFα was not significantly higher in septic obese mice that died prior to 24 h compared to those that survived past 24 h, and therefore would not be a good prognostic biomarker in septic obese mice. A potential reason for this difference in IL-6 and TNFα is the impact of adiponectin. Septic obese mice had significantly higher adiponectin compared to septic non-obese mice. Adiponectin is an anti-inflammatory adipokine that suppresses pro-inflammatory cytokine production. Kern et al. found plasma adiponectin levels were inversely correlated with plasma TNFα levels but not plasma IL-6 levels when analyzing adiponectin expression in nondiabetic females with varying body mass index and insulin resistance. 39
Obesity is associated with decreased adiponectin levels. Our lab previously demonstrated septic obese mice have lower adiponectin levels compared to septic non-obese mice. 25 The septic obese mice in our original study also had higher mortality compared to the septic non-obese mice. This contrasts with our current study, where septic obese mice have lower mortality and higher adiponectin levels compared to septic non-obese mice. The higher adiponectin levels may have contributed to higher survival in obese mice; however, it is unclear why these septic obese mice have higher adiponectin levels when obesity is inversely related to adiponectin. The same high fat diet was fed for the same duration of time in both studies, and both studies used the same vendor for similar-aged mice. However, the mice in our previous study were housed in the vivarium years prior and environmental differences may contribute to a difference in gut microbiome. 40 Furthermore, this model of sepsis is more severe, using a larger needle gauge, and this may shift the microbiome as well after sepsis. Unfortunately, we do not have microbiome data from the mouse colonies in the previous study. Serino et al. previously demonstrated that mice fed the same high fat diet can have different metabolic phenotypes which related to specific gut microbiome compositions. 41 It is plausible that, despite being fed the same high fat diet, the obese mice used in this study had a different gut microbiome composition than the obese mice in our lab's previous study, and that the difference contributed to difference in cytokine signaling and survival. Specifically, this would also explain the difference in adiponectin signaling. Yao et al. found that adiponectin expression was altered by gut microbiome composition. 42
There is a growing body of evidence surrounding the importance of the gut microbiome during critical illness. 43 Sepsis from CLP results in significant changes in the cecal microbiome composition in non-obese and obese mice. 43 Although there was not a significant difference in the Shannon Diversity Indices among the four groups, the more comprehensive PCA demonstrated a significant difference in cecal microbiome composition in non-obese and obese mice within 1 h of CLP. This rapid change in gut microbiota is consistent with human literature in which gut microbiome changes were present within 6 h of admission of critically ill patients, prior to antibiotic administration, compared to healthy controls. 44 In addition to CLP, high fat diet significantly alters the microbiome of the cecum.45,46 Hyoju et al. found a western diet led to decreased diversity and appearance of antibiotic-resistant pathogens in the microbiota of the cecum.43,44 Interestingly, in our study, non-obese mice, compared to obese mice, regardless of sepsis were found to have a higher relative abundance of multiple Bacterioides species. Bacteroides are typically commensal enteric bacteria that can become pathogenic when it escapes its environment. 47 In this case, the resultant injury to the cecum can contribute to the pathogenicity of Bacteriodes species, which may lead to greater inflammation and mortality. Given the CLP model remains a widely used murine model to study sepsis, it will be important to understand how the gut microbiome, specifically in the cecum, changes during CLP-induced sepsis and how these changes relate to outcomes. Extrapolating these findings to humans may be further complicated by the significant differences in between human and murine microbiomes.
One limitation of this study is that CLP is a mixed model using necrosis and infection as the source of inflammation. In our study, the cecum was visibly smaller in obese mice and therefore may introduce a confounding factor in survival and inflammation in obese mice. Therefore, our findings must be taken in context of this knowledge. Future studies using an alternative source of sepsis, such as fecal slurry, may confirm our findings that obese mice have higher survival and lower inflammatory cytokines compared to non-obese mice. Additionally, this model is a severe model of sepsis without the administration of antibiotics. While this high mortality is not representative of sepsis in humans, which is treated with antibiotics, it allowed us to limit factors that would alter the gut microbiome. Furthermore, the severity of this model leads to significant necrosis of the cecum and therefore the use of fecal shotgun metagenomics is limited by the amount of mouse DNA that is mixed in with fecal samples through sloughing of the epithelium in the cecum and blood. This becomes technically more challenging as sepsis progresses.
Conclusion
In conclusion, we found that obese mice compared to non-obese mice had significantly higher survival, higher plasma adipokines, and lower plasma cytokines compared to non-obese mice during sepsis. IL-6 was the only cytokine to identify which non-obese and obese mice are at increased risk for mortality from sepsis. One possible explanation for why IL-6, but not TNFα, was a good prognostic biomarker is the negative feedback from adiponectin. Furthermore, the difference in cytokine levels and mortality in obese mice compared to non-obese mice may be due to the alterations in cecum microbiome from the high fat diet.
Supplemental Material
sj-tiff-1-ini-10.1177_17534259231205959 - Supplemental material for Obesity Alters cytokine signaling and gut microbiome in septic mice
Supplemental material, sj-tiff-1-ini-10.1177_17534259231205959 for Obesity Alters cytokine signaling and gut microbiome in septic mice by Lauren Bodilly, Lauren Williamson, Patrick Lahni and Matthew N. Alder, David B. Haslam, Jennifer M. Kaplan in Innate Immunity
Footnotes
Declaration of conflicting interests
The authors declared the following potential conflicts of interest with respect to the research, authorship, and/or publication of this article: Jennifer Kaplan serves on the Eli Lilly data safety monitoring board and is a Shock Society Program Chair. All other authors have no disclosures.
Funding
The authors disclosed receipt of the following financial support for the research, authorship, and/or publication of this article: This work was supported by the National Institute of Diabetes and Digestive and Kidney Diseases, National Institute of General Medical Sciences, (grant number P30DK078392, R01GM126551, T32GM008478).
Supplemental material
Supplemental material for this article is available online.
References
Supplementary Material
Please find the following supplemental material available below.
For Open Access articles published under a Creative Commons License, all supplemental material carries the same license as the article it is associated with.
For non-Open Access articles published, all supplemental material carries a non-exclusive license, and permission requests for re-use of supplemental material or any part of supplemental material shall be sent directly to the copyright owner as specified in the copyright notice associated with the article.