
Abstract
Plasma calprotectin has previously been reported as a biomarker for sepsis. The aim of the present study was to elucidate the kinetics of calprotectin release from neutrophils exposed to Escherichia coli and endotoxin. Whole blood samples were exposed to E. coli bacteria or endotoxin in vitro. Blood samples were collected after 0, 1, 2, 3 and 4 h and plasma calprotectin was analysed by particle enhanced turbidimetric immunoassay while TNF-α, IL-6, neutrophil gelatinase-associated lipocalin (NGAL) and kidney injury molecule-1 (KIM-1) were analyzed by ELISA. When neutrophils were exposed to either E. coli or endotoxin, calprotectin levels began to increase within a couple of hours after the challenge. Calprotectin increases early in response to bacterial challenge. Given the logistic advantages of the calprotectin analysis, this may be of interest for early diagnosis of bacterial infections.
Keywords
Introduction
Early recognition of severe bacterial infections is a key step for initializing antibiotic treatment that can be lifesaving for patients with these conditions. 1 Apart from medical history and physical examination and imaging techniques, biomarkers can help identify patients with severe infections. Although several biomarkers, such as C-reactive protein (CRP),2–4 procalcitonin, 5 and heparin binding factor, 6 are used in infection diagnostics there is no optimal biomarker for this purpose to date. 7
We and others have previously reported that plasma calprotectin can be a promising marker for the diagnostics of sepsis.8–11 Calprotectin is released from neutrophil granulocytes on inflammatory activation. 12 However, little is known about how fast calprotectin is released from these cells in response to encounters with bacteria or PAMPs. Given that a new turbidimetric method offers a relatively cheap analysis for calprotectin with rapid turn-around times from sampling to laboratory results, the clinical use of this biomarker could become more widespread given that its performance in identifying patients with infections is optimal. Turbidimetric methods are not limited to specific instrument manufacturers and are thus possible to set up on a variety of chemistry analysers present in hospital laboratories, allowing local measurements. Data on the timing of calprotectin release in response to inflammatory stimulus could thus aid in the evaluation of a laboratory results on this mediator in the clinical situation.
We hypothesized repeated measurement plasma calprotectin from human whole blood that has been challenged with bacteria or endotoxin will provide information on the time course of initial calprotectin release.
The primary endpoint of this study was to identify the timing of calprotectin increase above baseline in human whole blood from healthy volunteers after bacterial or endotoxin challenge. Additionally, other biomarkers of inflammation were measured in order to compare the kinetics of these biomarkers to that of calprotectin. TNF-α and IL-6 increase in whole blood after bacterial or endotoxin challenge was measured as these inflammatory mediators are released very early on inflammatory activation of macrophages.13,14 Neutrophil gelatinase-associated lipocalin (NGAL) another potential biomarker of sepsis, 15 released on neutrophil granulocyte activation, was also measured. Finally, we measured kidney injury molecule-1 (KIM-1) as control biomarker of inflammatory activity from non-blood cells in the same blood samples. 16
Materials and methods
Subjects
Five healthy volunteers were recruited at the Department of Clinical Chemistry, Uppsala University Hospital. The study was approved by the regional ethical review board in Uppsala, Sweden (No. 01/367). The ethical permit allows the use of anonymous blood samples presenting only age and sex.
Age and sex of the volunteers was registered and 10 ml blood was sampled from the antecubital veins into sodium heparin tubes.
The blood samples were incubated at 37°C during the experiment. Prior to adding bacteria or endotoxin, 1 ml of the blood sample was centrifuged at 1500 g at 4°C for 10 min (0 h sample). Plasma was transferred to new tubes and the tubes were frozen at –18°C. Then, 3.8 × 10⁶ E. coli strain B09-11822 (serotype O rough:K1:H7; Statens Seruminstitut, Copenhagen, Denmark) in logarithmic growth phase dissolved in 100 µL of saline, or 200 µL E. coli endotoxin 0.3 µg × mL−1 (E. coli O111:B4; Sigma Chemicals, St. Louis, MO) were added to the blood samples. Thereafter, 1 ml of the blood sample was centrifuged and handled as described above at 1, 2, 3 and 4 h.
Analysis of biomarkers
Calprotectin was measured on a Mindray™ BS-380 (Mindray Medical International, Shenzhen, China) with calprotectin reagents from Gentian (Moss, Norway). The instrument settings for the method were: sample volume = 3 µL, R1 volume = 200 µL and the R2 volume = 30 µL.
Plasma TNF-α, IL-6, NGAL and KIM-1/TIM-1 levels were analyzed with the commercial sandwich ELISA kit, (DY210, DY206, DY1757, and DY1750 R&D Systems, Minneapolis, MN). The total coefficient of variations for the assays were approximately 7%.
Statistics
Data was tested for normal distribution and all biomarkers presented a non-normal distribution. Data were therefore presented as median and interquartile range (IQR). Changes over time were assessed with Friedman’s ANOVA. Comparisons between time points were made with Wilcoxon matched pairs test. Correlations were assessed with Spearman rank order correlations. STATISTICA™ software (Version 13.2, StatSoft, Tulsa, OK) was used for the statistical calculations; P < 0.05 was considered significant.
Results
All five subjects, two women and three men, with a median age of 43 yr (range 34–61) were healthy without history or signs of ongoing inflammation.
Plasma calprotectin levels (Figure 1) were low at baseline but increased during the experiment (P < 0.001) and were significantly higher than baseline values at 3 h (P < 0.05). This increase in plasma calprotectin was similar from blood that was challenged with bacteria and that was challenged with endotoxin.
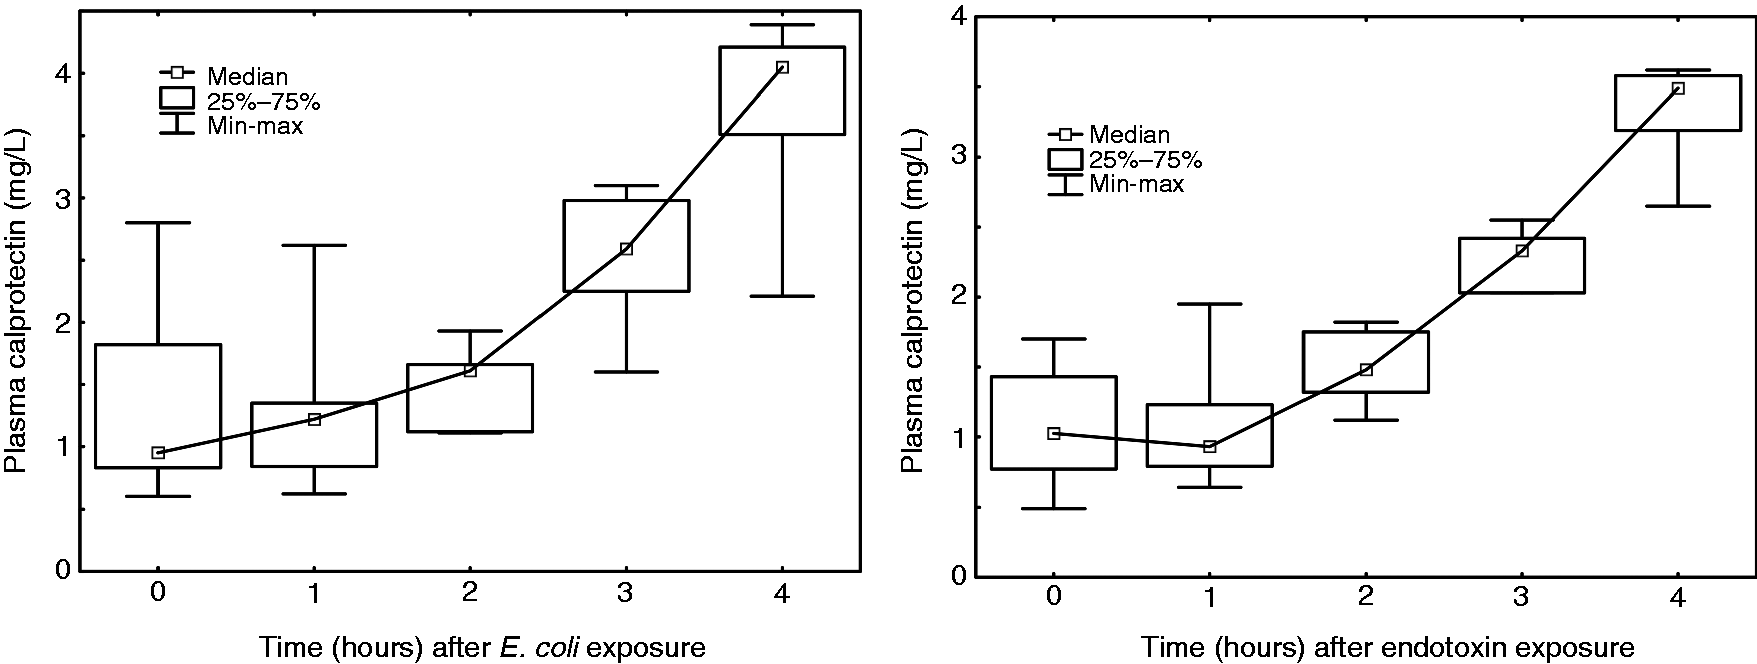
(a) The evolution of calprotectin levels in plasma after bacterial stimulation of whole blood. Calprotectin levels were higher than baseline at 3 h (P < 0.05). The time after stimulation is shown on the x-axis and the calprotectin values are shown on the y-axis. The calprotectin results are presented as median values with a box denoting lower and upper quartiles and whiskers showing minimum and maximum values. (b) The evolution of calprotectin levels in plasma after endotoxin stimulation of whole blood. Calprotectin levels were higher than baseline at 3 h (P < 0.05). The time after stimulation is shown on the x-axis and the calprotectin values are shown on the y-axis. The calprotectin results are presented as median values with a box denoting lower and upper quartiles and whiskers showing minimum and maximum values.
Plasma NGAL (Figure 2) increased linearly from baseline to 4 h (P < 0.001) with levels above baseline at 1 h for both bacterial and endotoxin stimulation (P < 0.05).
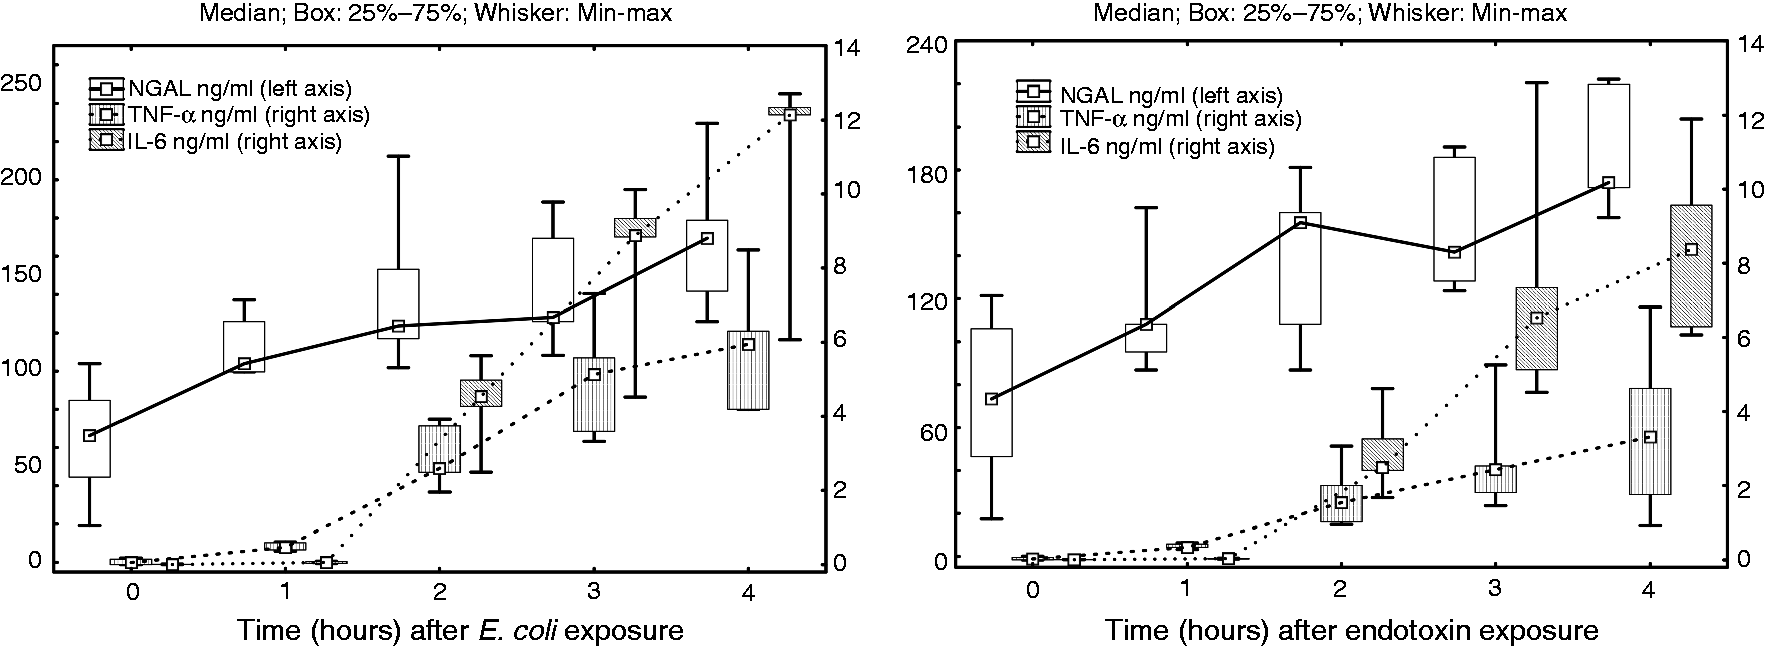
(a) The evolution of NGAL, TNF-α and IL-6 levels in plasma after bacterial stimulation of whole blood. NGAL, TNF-α and IL-6 levels were all higher than baseline at 1 h (P < 0.05). The time after stimulation is shown on the x-axis and NGAL, TNF-α and IL-6 levels are presented on the y-axis. The NGAL, TNF-α and IL-6 values are presented as median values with a box denoting lower and upper quartiles and whiskers showing minimum and maximum values. (b) The evolution of NGAL, TNF-α and IL-6 levels in plasma after endotoxin stimulation of whole blood. NGAL, TNF-α and IL-6 levels were all higher than baseline at 1 h (P < 0.05). The time after stimulation is shown on the x-axis and NGAL, TNF-α and IL-6 levels are presented on the y-axis. The NGAL, TNF-α and IL-6 values are presented as median values with a box denoting lower and upper quartiles and whiskers showing minimum and maximum values.
Both TNF-α and IL-6 (Figure 2) increased from baseline to 4 h (P < 0.001). Both of these cytokines increased above baseline at 1 h for both bacterial and endotoxin stimulation (P < 0.05). TNF-α increased with one magnitude while IL-6 increased by two orders of magnitude from 1 h to 2 h. At 4 h, correlations between calprotectin, NGAL, TNF-α and IL-6 for both bacterial and endotoxin stimulation were generally low except for TNF-α and IL-6, which exhibited a strong correlation (rho = 0.81).
Plasma KIM-1 was not detectable in 2 of 5 patients and those levels that were above detection level were solitary values (data not shown).
Discussion
The aim of the study was to define the timing of calprotectin increase above baseline in human whole blood from healthy volunteers after bacterial or endotoxin challenge. For acute conditions such as infections the focus is on early detection to allow for early treatment initiation. Ex vivo storage of whole blood for prolonged times could lead to release of cytokines from the cells independently of the challenge with bacteria or endotoxins. The observation period was thus limited to 4 h. After inflammatory challenge of whole blood from healthy volunteers, calprotectin, NGAL, TNF-α and IL-6 all increased substantially in plasma in this ex vivo stimulation of inflammatory cells. Bacterial and endotoxin challenge gave similar inflammatory response in whole blood. Calprotectin increased from baseline by the third h of the experiment while NGAL, TNF-α and IL-6 increased earlier. TNF-α and IL-6 correlated strongly to each other. KIM-1 was beyond detection limit in almost all plasma samples.
The elevated calprotectin levels in response to the bacterial and endotoxin challenge in our study have been described previously. In animals with severe bacterial infection, calprotectin increase has been described after 2 days, 17 and another animal study described similar findings a few h after endotoxin challenge. 18 Human data on the kinetics of calprotectin is scarce. van Zoelen et al. described early changes to calprotectin levels in healthy volunteers after endotoxin challenge with very low endotoxin doses due to the nature of the experiment. 19 In the current study, we used clinically relevant bacterial and endotoxin doses in human whole blood and compared changes in calprotectin to other inflammatory markers. 20
An aim of our study was also to compare the elevation of calprotectin to other early biomarkers of inflammation. To mimic a potential clinical application, we stimulated whole blood and then used the plasma for the analysis of the neutrophil markers. TNF-α and IL-6 were used for comparison with the neutrophil markers. The clotting process causes neutrophil activation, so we believe that plasma is a better matrix for this type of markers. It also shortens the test turnaround time as the samples do not need to clot prior to the testing. Calprotectin can be analyzed by particle enhanced turbidimetric assays, while the concentrations of TNF-α and IL-6 are significantly lower than the sensitivity threshold for PETIA, thus requiring other types of assays. TNF-α and IL-6 are thus either analyzed by dedicated analysers or microtitre plate based ELISAs, which limits the possibility of obtaining rapid test results. The advantage of PETIA is that it can be applied to chemistry analysers available in all hospital laboratories. The same type of instrumentation is used for, e.g., analysing creatinine, and the instruments are run as a 24/7 service. PETIAs are usually used as a randomly access test and the samples are run continuously as they arrive at the laboratory, which contributes to reduced test turnaround times. This is important if such methods are to be used to diagnose acute infections. We saw that calprotectin levels increased 2 h later than NGAL, TNF-α and IL-6. This could be related to the regulation of calprotectin production, which is dependent on other inflammatory mediators such as IL-10, 21 and thus, although an early phenomenon, the release of calprotectin is not a first line of inflammatory response.
TNF-α and IL-6 were measured in our study as they are very early markers of systemic inflammatory activation. Both these cytokines are released early from macrophages after inflammatory activation, 22 with similar kinetics to one another explaining the high level of correlation of their peak levels in our study and other studies. 14 Although TNF-α is a more proximal mediator of inflammatory response and increased rapidly in our study and increased within h of infection in previous studies, 14 the increase of this cytokine is transient and the peak may be missed, 14 making it less practical for clinical use. IL-6, similar to TNF-α, increased one hour after bacterial and endotoxin challenge in our study. IL-6 is, however, a more practical biomarker of infection than TNF-α since it is has less variable levels during sepsis.
NGAL was analyzed in our study to monitor the extent of early neutrophil activation. 23 Previous experimental and clinical studies have shown that NGAL in plasma increases within hours of an inflammatory trigger,24,25 the current study shows that NGAL levels increase as early as one hour after bacterial or endotoxin challenge.
The absence of KIM-1 in our plasma samples after bacterial and endotoxin challenge was expected as this biomarker is not expressed by circulating cells.
As far as we know, this is the first study to describe the time course of plasma calprotectin after bacterial exposure of human whole blood in an ex vivo setting. We also compare bacterial and endotoxin challenge and measure inflammatory mediators from several cell types simultaneously. Additionally, the frequent sampling is an asset of the study given its aim.
A limitation of the study is that it was performed in healthy individuals who are also much younger than the average patient in an intensive care unit. Another limitation is the relatively low sample size of the study; however, given the primary aim of the study, this number was sufficient. Finally, whole blood does not represent a whole organism’s inflammatory response to infection, but since the white blood cells play a central role in this response and calprotectin is released primarily by neutrophil granulocytes, the experimental set up has probably high relevance for in vivo conditions. The latter is also confirmed by a report on calprotectin levels in healthy volunteers exposed to subclinical endotoxin challenge.
Since calprotectin and NGAL are released early in plasma, these biomarkers could candidate biomarkers of infection and possibly also of neutrophil granulocyte response to inflammatory triggers.
Conclusions
Calprotectin increases early, although somewhat slower than NGAL, TNF-α and IL-6, in response to infectious stimulation. Given the logistic advantages of calprotectin analysis, this may be of interest for diagnostics of early infections.
Footnotes
Declaration of conflicting interests
The author(s) declared no potential conflicts of interest with respect to the research, authorship, and/or publication of this article.
Funding
The author(s) disclosed receipt of the following financial support for the research, authorship, and/or publication of this article: This study was supported financially by the Uppsala University Hospital Research Fund.