
Abstract
Myeloid-derived suppressor cells (MDSCs) inhibit T cell responses and are relevant to cancer, autoimmunity and transplant biology. Anti-thymocyte globulin (ATG) is a commonly used T cell depletion agent, yet the effect of ATG on MDSCs has not been investigated. MDSCs were generated in Lewis Lung Carcinoma 1 tumor-bearing mice. MDSC development and function were assessed in vivo and in vitro with and without ATG administration. T cell suppression assays, RT-PCR, flow cytometry and arginase activity assays were used to assess MDSC phenotype and function. MDSCs increased dramatically in tumor-bearing mice and the majority of splenic MDSCs were of the polymorphonuclear subset. MDSCs potently suppressed T cell proliferation. ATG-treated mice developed 50% fewer MDSCs and these MDSCs were significantly less suppressive of T cell proliferation. In vitro, ATG directly bound 99.6% of MDSCs. CCR7, L-selectin and LFA-1 were expressed by both T cells and MDSCs, and binding of LFA-1 was inhibited by ATG pre-treatment. Arg-1 and PD-L1 transcript expression were reduced 30–40% and arginase activity decreased in ATG-pretreated MDSCs. MDSCs were bound and functionally inhibited by ATG. T cells and MDSCs expressed common Ags which were also targets of ATG. ATG may be helpful in tumor models seeking to suppress MDSCs. Alternatively, ATG may inadvertently inhibit important T cell regulatory events in autoimmunity and transplantation.
Keywords
Introduction
Myeloid-derived suppressor cells (MDSCs) are a heterogeneous population of naturally occurring immunosuppressive cells. 1 Common myeloid precursors develop into immature myeloid cells (IMCs). 2 Under non-inflammatory conditions, IMCs develop into dendritic cells, macrophages and neutrophils. In inflammatory environments, molecules such as G-CSF, IL-2, TGF-β, CXCL1/2 and S100A8/A9 redirect IMCs to develop into immunosuppressive MDSCs.3,4 MDSCs suppress T cell responses through nutrient depletion (via arginase-1), production of NO and reactive oxygen species, and through the expansion of T-regulatory cells. 5 , 6
In mice, MDSCs are defined by the expression of the cell surface markers Gr-1 and CD11b. Total MDSCs are further categorized into two main subsets: monocytic MDSC (M-MDSCs) and polymorphonuclear MDSCs (PMN-MDSCs). M-MDSCs and PMN-MDSCs are differentiated phenotypically by the expression of Ly6C (M-MDSCs, CD11b+Ly6ChighLy6G−) and Ly6G (PMN-MDSC, CD11b+Ly6ClowLy6G+). In human cancers, and likely in transplantation, M-MDSCs and PMN-MDSCs have different immunosuppressive potentials. 1 , 7 In tumors, MDSC subset is also associated with location within the tumor microenvironment. 8
Because MDSCs suppress immune responses, they have garnered the attention of cancer, autoimmunity and transplant investigators. 2 , 9 MDSCs are also important in pregnancy, as they contribute to fetal tolerance at the maternal–fetal interface. 10 , 11 Cancer patients with higher MDSC responses have lower overall survival and cancer progression-free survival.12–14 MDSC function is aberrant in autoimmune processes such as inflammatory bowel disease. 15 With regard to transplantation, MDSCs develop in humans after kidney transplantation, 7 they suppress alloreactive T cell responses,16–19 and adoptively transferred MDSCs prolong corneal and skin graft survival. 16 , 20 MDSCs also home to transplanted organs and have been suggested as a pathway towards immunologic tolerance. 2 , 19 , 21 , 22
There are only a few incomplete studies suggesting that immunosuppressive drugs affect MDSCs, yet the associated mechanisms are undefined. 23 , 24 We hypothesized that because ATG is a polyclonal Ab which binds multiple cell types that ATG may also bind to and/or affect MDSCs. If MDSCs are affected by ATG, these findings would have implications for cancer, autoimmunity and transplant care.
The mechanism of action underlying the immunosuppressive activity of ATG has been studied extensively. 25 , 26 ATG depletes T cells in peripheral blood and lymphoid tissues through complement dependent cytotoxicity. 27 , 28 ATG also induces apoptosis, deregulates proliferation of B cells29–31 and impairs leukocyte/endothelium interactions through modulation of adhesion and cell-trafficking receptors. 32 Despite its wide range of effects, the impact of ATG on MDSCs is poorly understood.
Here we sought to determine if ATG binds MDSCs. We then sought to determine how MDSC-ATG binding would affect MDSC function. We found that ATG readily bound MDSCs and that ATG impaired MDSC function.
Materials and methods
Animals
C57BL/6J and BALB/cJ mice (female, 6–8 wk old) were purchased from The Jackson Laboratories (Bar Harbor, ME). All mice were maintained in a specific pathogen-free animal facility. The Institutional Animal Care and Use Committees (IACUC) of the University of Maryland Baltimore approved all animal study protocols, and experiments were conducted in compliance with the Guide for the Care and Use of Laboratory Animals.
Reagents and tumor models
Lewis lung carcinoma (LLC1) cells are highly tumorigenic 33 and stimulate MDSC expansion. 34 LLC1 cells were cultured in RPMI 1640 (Invitrogen Life Technologies, Carlsbad, CA) supplemented with 10% FBS (Gibco, Grand Island, NY), 100 U/ml penicillin and 100 µg/ml streptomycin (Gemini, Sacramento, CA) at 37°C in 5% CO2. For tumor challenge, 1 × 10⁶ LLC1 cells were injected subcutaneously into the right flank. Tumor growth was monitored twice a week and all tumors were 1–2 cm diameter within 2–3 wk. Tumor-bearing mice were euthanized 3 wk after LLC1 inoculation and MDSCs harvested. Mice were sacrificed if tumors exceeded 2 cm or became ulcerated. ATG was rabbit-anti-mouse and obtained from Earl Poptic in the Lerner Research Institute (Cleveland Clinic Hospital, Cleveland, OH), and injected intraperitoneally at 2 mg/kg for 5 d, as is similar in design to prior studies. 35 PBS and rabbit serum were used as a control.
Abs and flow cytometry
Mouse spleens and lymph nodes were procured and tissues mashed through 70 µm strainers to generate single cells, which were suspended in PBS. Red blood cells were removed using an ACK lysis buffer (Lonza, Walkersville, MD). Samples were washed in magnetic activated cell sorting (MACS) buffer (1× PBS supplemented with 1% FBS and 2mmol/l EDTA), incubated with Fc receptor block (CD16/32, clone 2.4G; BD Bioscience, San Diego, CA) and stained for 30 min at 4°C with the relevant Abs. The following Abs were used for flow cytometry: Ly6C, Ly6G, CD11b, CD3e, CD4, CD4, Gr-1, CD8, B220, CD25 FoxP3, CCR7, L-selectin, LFA-1 and PD-L1 (Supplemental Table 1). Functional grade purified anti-CD3e (clone 145-2C11) and anti-CD28 (clone 37.51) for T cell activation were obtained from BD Pharmingen. Live/dead fixable aqua-dead stain or DAPI (Invitrogen) were used to assess viability prior to acquisition on flow cytometer. Samples were analyzed using the LSRFortessa flow cytometer (BD Biosciences, San Jose, CA) and FlowJo software (Tree Star, Ashland, OR).
Isolation of CD4+ T cells and MDSCs
CD4+ T cells were isolated from the spleen and lymph nodes of BALB/c mice using the EasySepTM Mouse CD4+ T Cell Isolation Kit (Stem Cell Technologies, Vancouver, BC, Canada) according to the manufacturer’s instructions (Stem Cell Technologies, Vancouver, BC, Canada). Purity ranged between 90 and 99%, as determined by flow cytometry. MDSCs were isolated from spleens of tumor-bearing mice. After 20 min of blocking the splenocytes with Fc blocker, cells were stained with PE-conjugated Gr-1 Ab at room temperature (25°C). PE-conjugated Gr-1+ MDSCs were selected by using magnetic nanoparticle designed to bind with PE fluorochrome including in The EasySep™ Mouse PE Positive Selection Kit (Catalog #18554, Stem cells) and applying an EasySep™ magnet. Gr-1 negative cells suspended in the tube were poured off and Gr-1+ MDSCs bound onto the tube were collected. Total MDSC (Gr-1+CD11b+), PMN-MDSC (CD11b+Ly6G+Ly6Clow) and M-MDSC (CD11b+Ly6G-Ly6Chigh) were isolated by cell sorting using an ARIA II (Becton Dickinson, San Diego, CA, USA; Supplemental Figure 1). Purity ranged from 98 to 99%.
T Cell suppression assays
CD4+ T cells were labeled with 5 μM carboxyfluorescein succinimidyl ester (CFSE, Molecular Probes, Eugene, Oregon) in 1 ml of PBS for 15 min at 37°C. The labeling was halted by adding excess of FBS and the samples were washed twice with RPMI 1640 supplemented with 10% FBS. A total of 1 × 10⁵ CFSE-labeled CD4+T cells were plated in complete media (RPMI 1640, 10% FBS, 20 units/ml penicillin, 50 mg/ml streptomycin) supplemented with 2 mmol/l l-glutamine and 0.05 nmol/l 2-mercaptoethanol onto flat-bottomed 96-well plates (Corning, B.V.) coated with 5 µg/ml anti-CD3 and 2 µg/ml anti-CD28 (eBioscience). MDSCs were added in T cell:MDSC ratios of 1:0.5, 1:1and 1:2. Cells were cultured for 3 d. MDSCs were pre-incubated with 10 µg mitomycin C for 1 h prior to co-culture with T cells.
In-vitro ATG binding assay
For blocking non-specific binding of ATG to Fc receptors, MDSCs were pre-incubated with purified anti-mouse CD16/32 Ab for 20 min. Then, MDSCs (1 × 10⁵ cells) were incubated for 30 min with serial dilutions of ATG (0.25 µg–100 µg) at 4°C. Purified normal rabbit serum (‘normal serum’ or ‘NS’) was used as a control. Following two washes with 1× PBS, a FITC-conjugated goat-anti-rabbit IgG secondary Ab was added to the cells and further incubated for 30 min at 4°C. The cells were fixed with 4% PFA for 10 min at 4°C. After washing, cells were harvested and FITC signal of gated MDSCs was measured by flow cytometry.
Arginase activity assay
The enzymatic activity of arginase was determined by measuring the conversion of l-arginine to l-ornithine and urea using the Arginase Activity Assay Kit (Sigma Aldrich, St. Louis, MO) in Gr-1+ MDSCs and Gr-1- (Non-MDSC) cells. The procedures were performed according to the manufacturers’ protocols. Briefly, cells were treated with 5 µg/ml or 50 µg/ml of ATG, rabbit normal serum (NS), or PBS and incubated for 24 h in 5% CO2 incubator at 37°C. Each group of cells was washed twice with 1× PBS and lysed with 200 µl of lysis buffer-containing 0.4% Triton X-100, 10 mM Tris-HCl (pH 7.5) and 1 µM Pepstatin and Leupeptin protease inhibitor. After centrifugation at 13,000 g for 10 min, the supernatant was collected and placed into 96-well plates. Arginase was activated by adding l-arginine substrate buffer and incubation for 2 h at room temperature. l-arginine hydrolysis was done by incubating the activated lysates with 50 μl of l-arginine (pH 9.7) at 37°C for 60 min. The reaction was stopped by the addition of 200 μl urea stop buffer and urea concentration was measured at 540 nm after using a spectrophotometer (Thermo Fisher Scientific, Waltham, MA) followed by incubation at room temperature for 60 min. One unit of arginase is the amount of enzyme that will convert 1.0 µmole of l-arginine to ornithine and urea per minute at pH 9.5 and 37°C.
RNA isolation and real-time quantitative RT-PCR
Total RNA isolation was performed using the RNeasy RNA isolation kit according to the manufacturer’s instructions (Qiagen, Waltham, MA). The quality and integrity of RNA were evaluated via A260/A280 ratio by using Nanodrop 2000 Spectrometer (ThermoFisher Scientific). Thereafter, 1–3 µg of total RNA were reversed transcribed to first-strand cDNA using the RevertAid First Strand cDNA Synthesis Kit (Thermo Fisher Scientific). qRT-PCR was performed in duplicate using All-in-One qPCR Mix (GeneCopoeia, Inc., Rockville, MD). An Eppendorf Mastercycler Realplex PCR system was used as follows: initial denaturation 95°C for 10 min, followed by 40 cycles of denaturation at 95°C for 10 s, annealing at 60°C for 20 s and extension at 72°C for 15 s. GAPDH was used as an internal control for normalization.
Statistical analysis
Where appropriate (MDSC number, spleen mass, continuous numeric values, etc.), data are presented as mean value ± standard error (SEM). The independent Student’s t-test was used to compare the difference of mean between each of two groups. Data were analyzed using Graph Pad Prism V6.0 (LaJolla, CA,).
Results
MDSCs are expanded in tumor-bearing mice
Animals injected with LLC1 cells uniformly developed tumors. Based on prior data suggesting that MDSCs develop in large numbers by 3 wk, 36 animals were euthanized, and tissues were obtained at this time. Spleens of tumor-bearing mice were significantly larger than those of naïve animals (Figure 1a). Spleen mass and splenocyte number were 4-fold higher (4.09 ± 0.65; P < 0.001; Figure 1b) and 10-fold higher (10.57 ± 4.4; P < 0.05; Figure 1c), respectively, compared with controls. Total Gr-1+CD11b+ MDSCs were compared between animals with and without tumor. Gr-1+CD11b+ MDSCs increased (>7-fold) to comprise more than 15% of total splenocytes in tumor-bearing mice v. less than 4% for naïve mice (Figure 1d). MDSC subsets (PMN-MDSCs and M-MDSCs) from the spleens of naïve and tumor-bearing mice were also assessed (Figure 1e and f). In naïve mice PMN-MDSCs (CD11b+Ly6G+Ly6Clow) and M-MDSCs (CD11b+Ly6G-Ly6Chigh) comprised 1.7 and 0.7% of splenocytes, respectively, and the ratio of PMN-MDSC:M-MDSC was 2:1. In tumor-bearing mice PMN-MDSCs and M-MDSCs comprised 20.6 and 2.8% of splenocytes, respectively, and the ratio between these two populations was increased to 8:1. Our results thus indicate that LLC1 tumors induced the expansion of Gr-1+CD11b+ MDSCs, and of these MDSCs the majority were of the PMN-MDSC subtype.
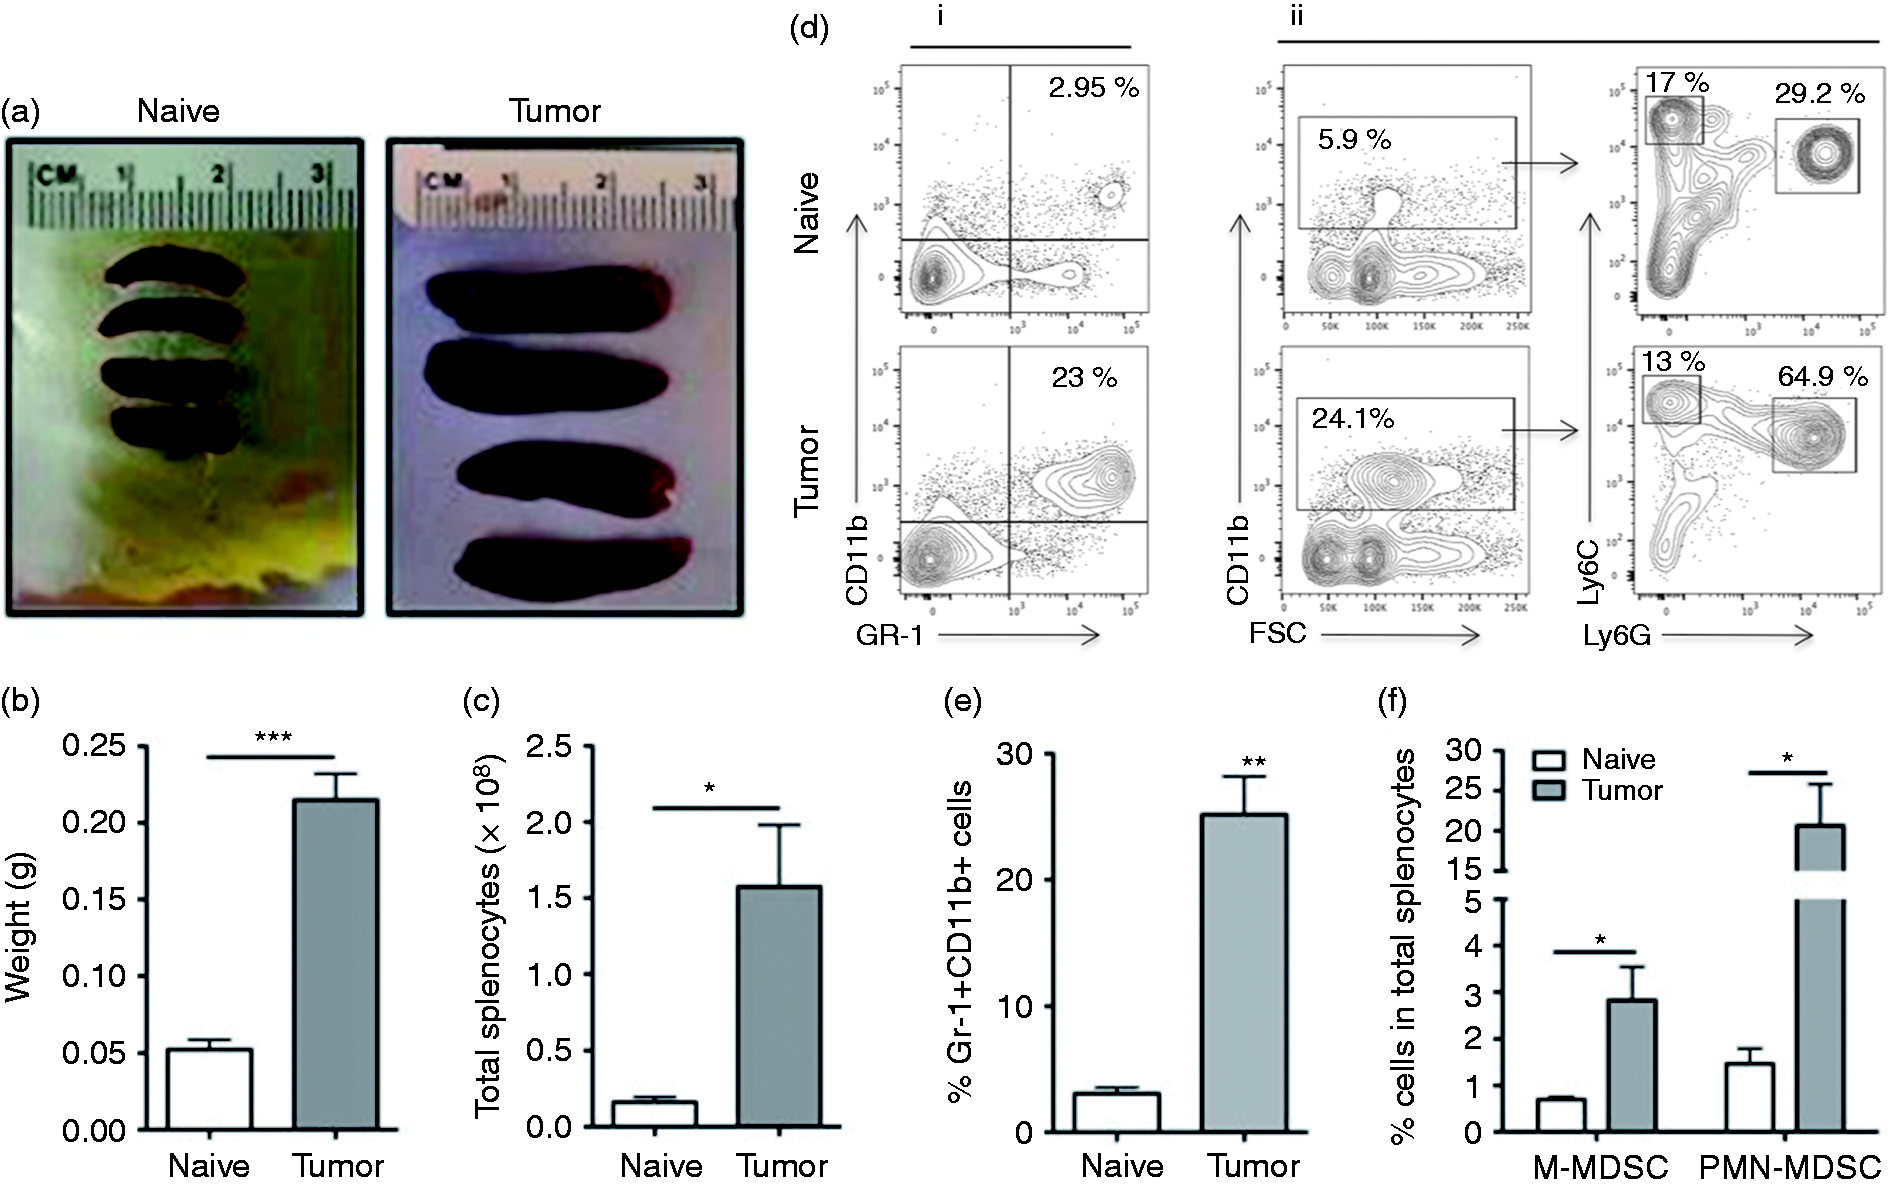
MDSCs are significantly expanded in spleen of tumor-bearing C57Bl/6 mice. One million (1 × 10⁶ cells) of Lewis lung carcinoma LLC1 cells were inoculated in the flank of C57Bl/6 female mice. Three wk after tumor inoculation, all the mice were burdened with tumor. (a–c) Spleens from naïve or tumor-bearing mice were harvested and mass and total number of splenocyte were measured. Splenocytes were subjected to immunophenotyping by flow cytometry. (d, i and ii). Representative gating strategy for identification of total MDSCs, M-MDSC and PMN-MDSC. (f) The frequency of total MDSCs (GR-1+CD11b+) (d) and M-MDSCs (CD11b+Ly6G-Ly6Chigh)/PMN-MDSCs (CD11b+Ly6G+ Ly6Clow). M- and PMN-MDSCs were subsequently identified based on the expression of CD11b, Ly6C and Ly6G, respectively (n = 5). *: P < 0.05 for statistically significant differences between naïve and tumor-bearing mice.
MDSCs suppress T cell proliferation in vitro
T cell suppression is a defining feature of MDSCs. 37 CD4+ T cells isolated from peripheral lymph nodes and spleen of BALB/c and were stimulated with anti-mouse CD3/CD28 and co-cultured with or without MDSCs from tumor-bearing BALB/c or C57BL/6J. MDSCs, in a dose-dependent fashion, potently suppressed Ab-induced T cell proliferation (Figure 2).
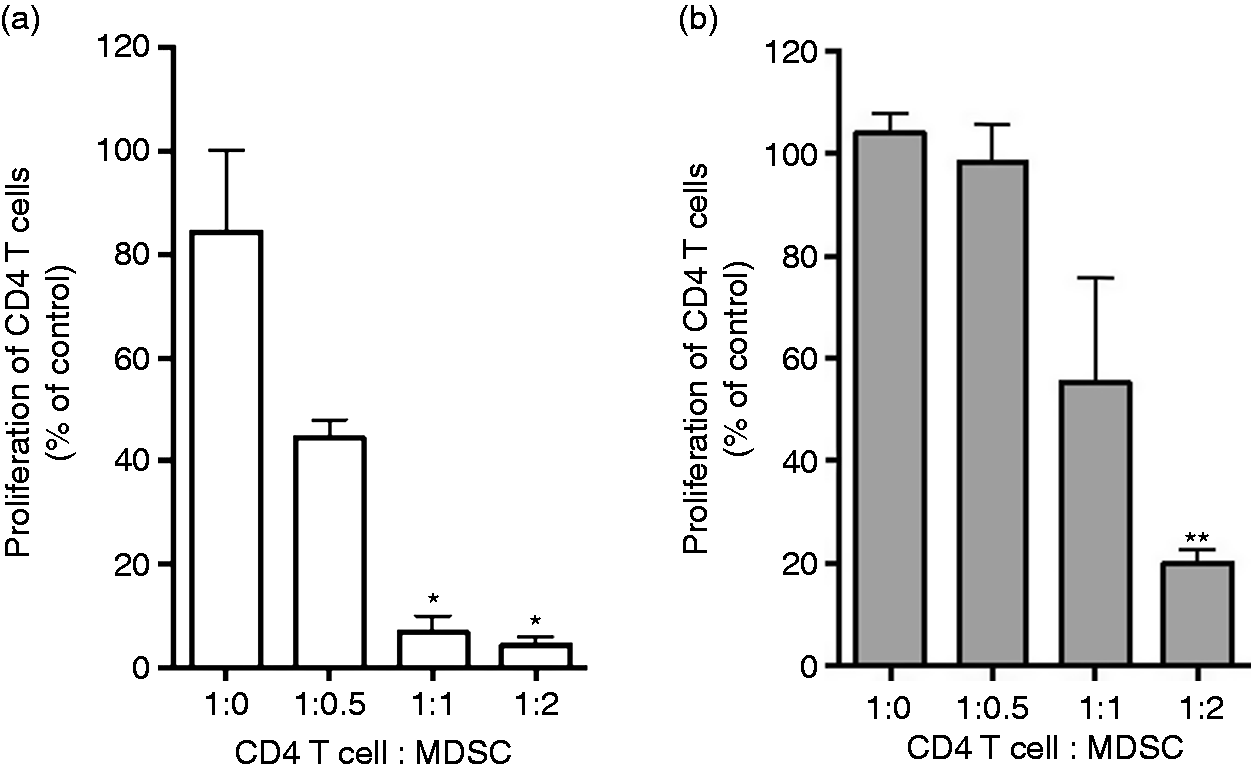
MDSCs are suppressive of T cell proliferation. CD4 T cells from BALB/c were labeled with CFSE dye (5 μM) and were stimulated with 5 μg/ml plate-bound anti-CD3, 2 μg/ml soluble anti-CD28 and co-cultured with Gr-1+ cells. Gr-1+ cells were isolated from the spleen of tumor-bearing (a) BALB/C and (b) C57BL/6. T cell proliferation was monitored 72 h later by flow cytometry as frequency of cells expressed CD4 and diluted CFSE. Cell proliferation was measured in triplicates and mean ± SD is shown. *, P < 0.05, **, P < 0.01, ns: not statistically significant.
MDSC expansion and function are inhibited by ATG in vivo
We next assessed the effect of ATG on MDSCs, T cell subsets and B cells in treated and un-treated tumor-bearing animals. Splenocytes from tumor-bearing animals were stained with variety of cell surface markers including anti-CD11b, anti-Gr-1, anti-CD4, anti-CD8, anti-CD25 and anti-B220 to assess phenotype with and without ATG treatment (Figure 3a). Tumor size and spleen size were not affected by ATG treatment (data not shown). The total splenic cell number was also unaffected by ATG treatment when compared with PBS-treated controls (Figure 3b). ATG led to a > 50% decrease in Gr-1+CD11b+ MDSCs among splenocytes (Figure 3c; P < 0.05, n = 6), and this was associated with a concomitant decrease in MDSC absolute number (Supplemental Figure 2). Consistent with the known effects of ATG, T cell populations were also decreased by ATG treatment when compared to PBS-treated mice (n = 6; Figure 3c–f). We did not detect a statistically significant reduction in B cell numbers in ATG treated mice (Figure 3g). To determine the effects of ATG on MDSC function, MDSCs isolated from ATG-treated animals were co-cultured with anti-mouse CD3/CD28 stimulated T cells. In contrast to PBS-treated animals shown in Figure 4a, MDSCs isolated from ATG-treated mice failed to suppress T cell proliferation (Figure 4b), suggesting that ATG suppressed MDSCs’ suppressive mechanisms.
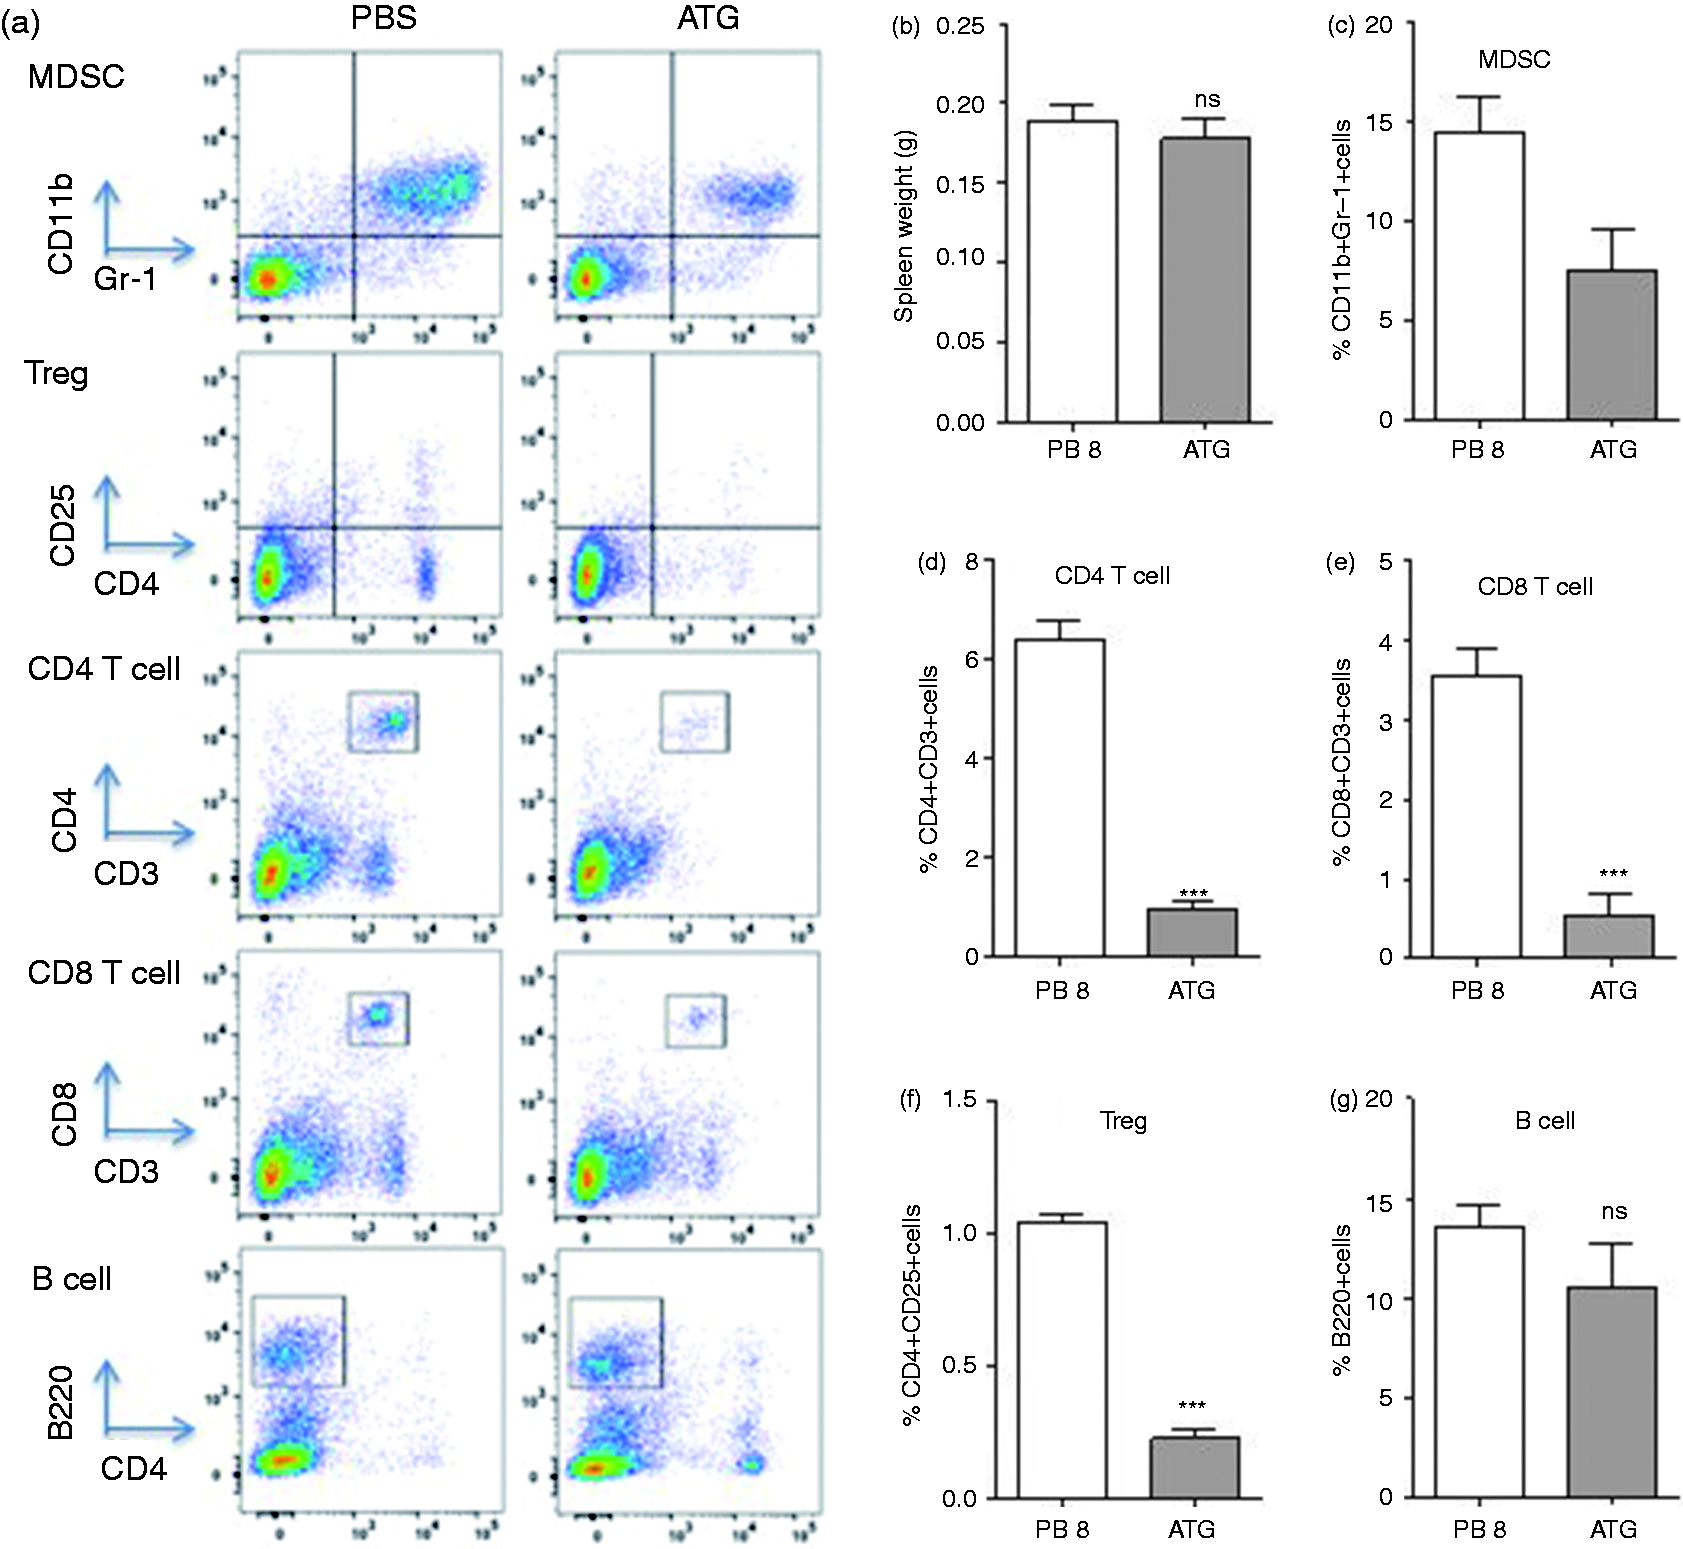
The effect of ATG on percentile of immune cells in spleen of tumor bearing mice. Two wk following tumor cell inoculation, mice were assigned to two groups (PBS or ATG) and treated for 5 d. Splenocytes were harvested on the fifth day after treatment and characterization of immune cells was performed using flow cytometry. Following staining with anti-CD4, CD8, B220, Gr-1 and CD11b Abs, (a) flow cytometry was performed and (b) the mass of spleens and (c–g) the average percentile of each immune cell was measured. Data represents the mean ± SD, n = 5. *, P < 0.05, **, P < 0.01, ***, P < 0.001, ns: not statistically significant.
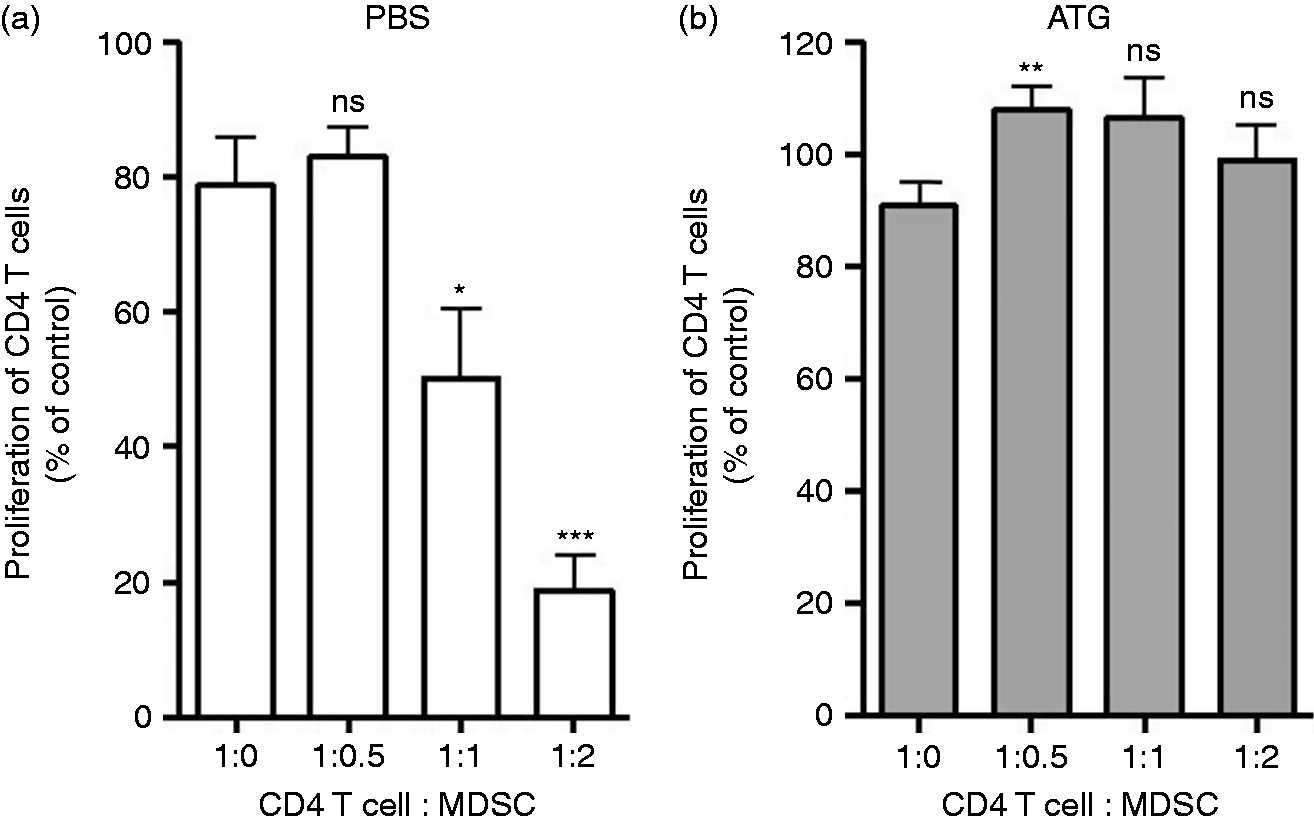
The effect of ATG on suppression activity of MDSCs in CD4+ T cell proliferation. Two wk following tumor cell inoculation, mice were assigned to two groups (PBS or ATG) and treated with ATG (2 mg/kg body mass) for 5 d. Single cells were harvested on the fifth day after treatment from the spleen of (a) PBS-treated and (b) ATG-treated mice. Gr-1+ MDSCs was isolated and CD4 T cell proliferation was performed as described in Figure 2. Data represents the mean ± SD, n = 5. *, P < 0.05, **, P < 0.01, ***, P < 0.001, ns: not statistically significant.
ATG directly binds and inhibits MDSC in vitro
We next assessed whether the observed effects of ATG on MDSCs were the result of direct ATG–MDSC binding. MDSCs from tumor-bearing mice were isolated and incubated with serial dilutions of ATG (0.25–100 µg/ml) or normal rabbit serum. Cells were then washed and stained with FITC-conjugated anti-rabbit IgG (Figure 5a). ATG bound to MDSCs in a dose-dependent fashion (Figure 5b). Weak binding was observed at an ATG dose of 1 µg/ml, however, binding increased to 8% at a dose of 2 µg/ml. More than 59% of MDSCs were bound at 4 µg/ml of ATG. Saturation (> 99%) occurred at 8 µg/ml (Figure 5b and c). To assess and avoid non-specific binding of ATG to Fc receptors (FcR) on MDSCs, FcR blocker was used to pretreat MDSCs in advance of incubation with ATG. FcR blockade did not affect capacity of ATG to bind MDSCs, indicating that ATG binding was specific. We then investigated if ATG binding would affect MDSC function in vitro. Indeed, we found that ATG treated MDSCs were less suppressive of T cell proliferation (Figure 6a and b, P < 0.001). At a T cell:MDSC ratio of 1:2, ATG-treated MDSCs were 3× less suppressive of T cell responses when compared with normal rabbit-serum-treated MDSCs (Figure 6c). Consistent with previous data, PMN-MDSCs and M-MDSCs were both suppressive of T cell proliferation, and both subsets were inhibited by ATG. 37 Notably, PMN-MDSCs appeared to be suppressed by ATG to a greater degree than were M-MDSCs (Figure 6d, P < 0.0001). Together, these data suggest that ATG treatment, in vitro, inhibited MDSC function.
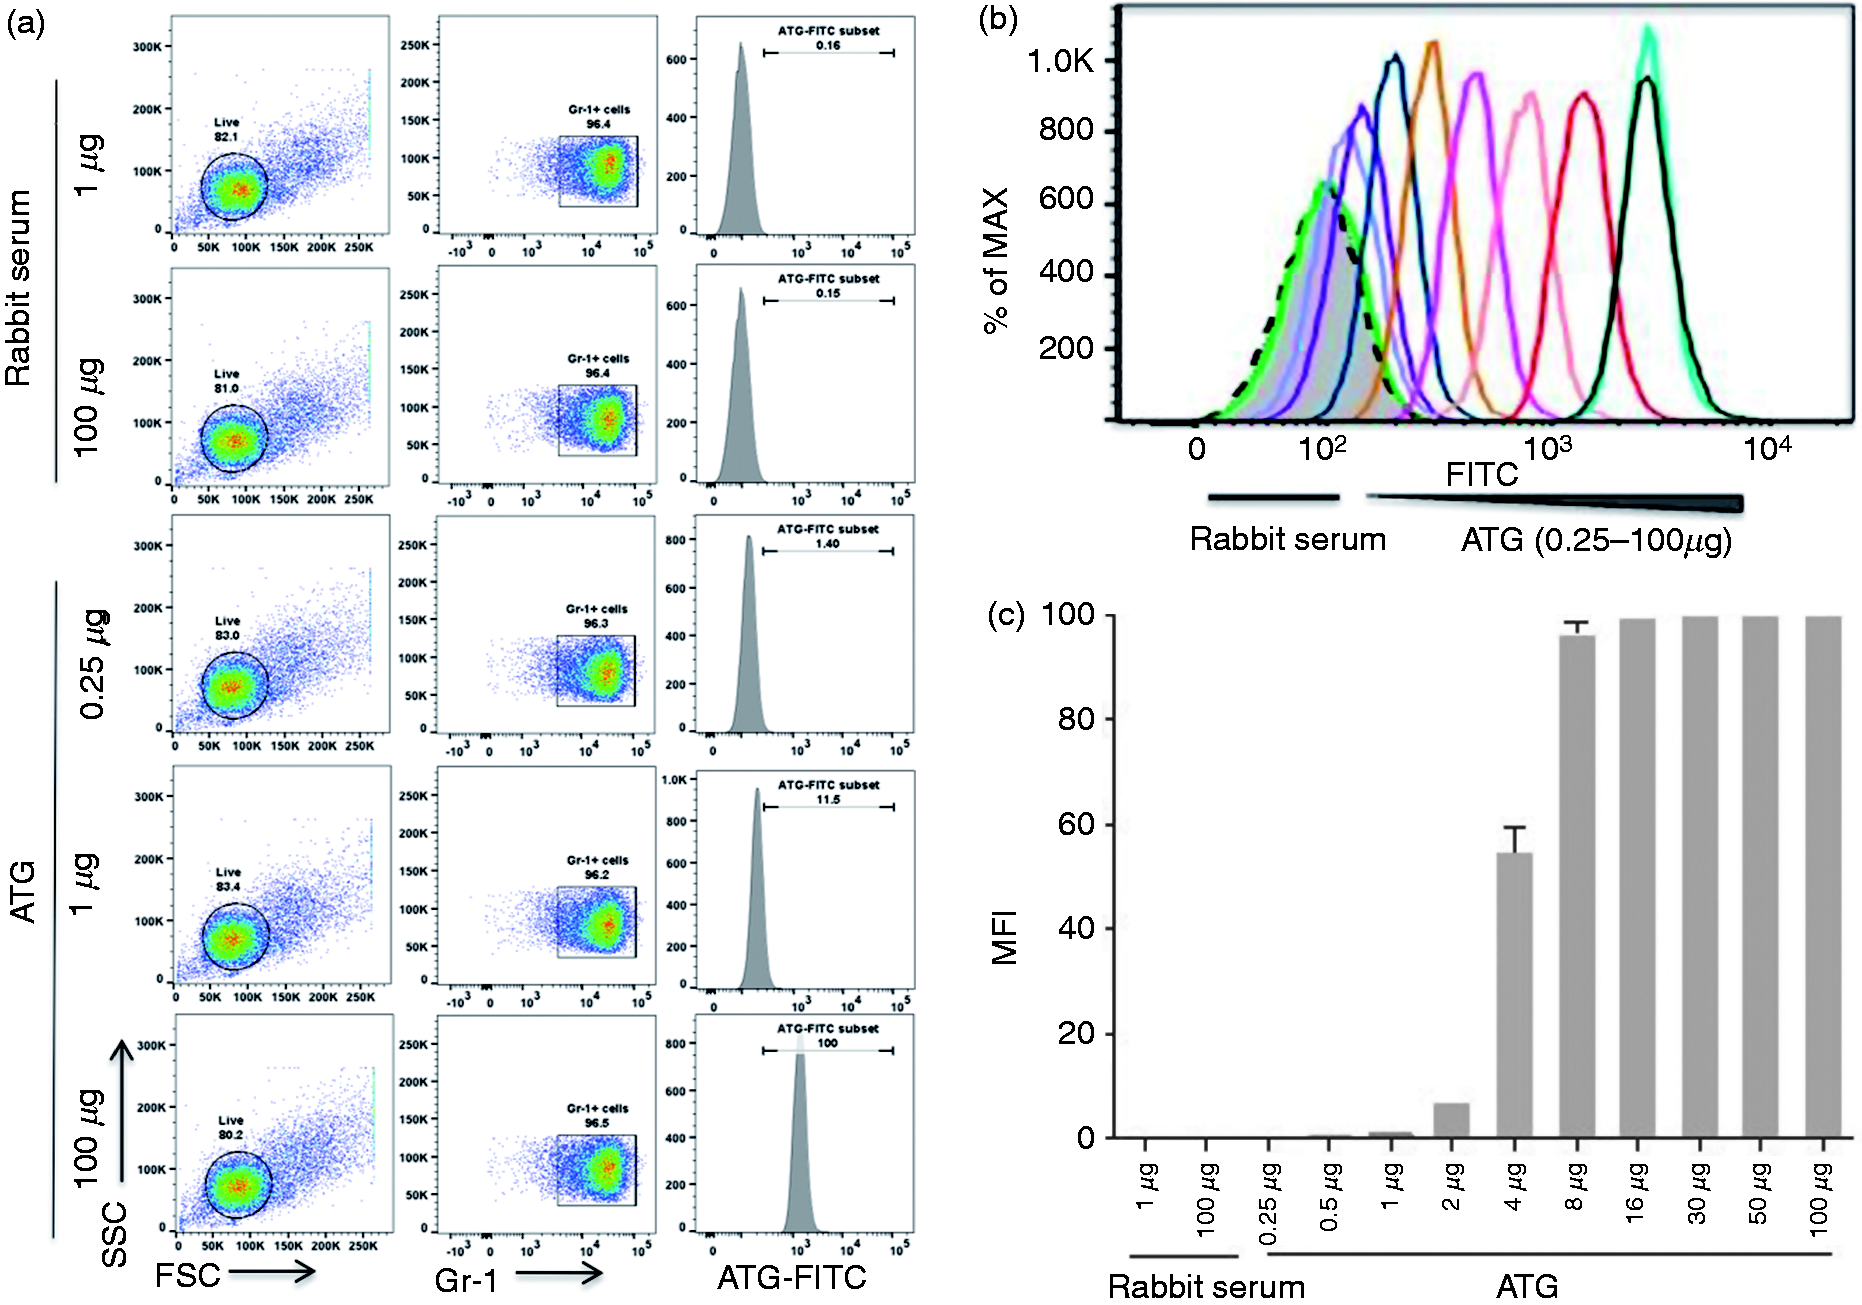
ATG bind physically with MDSCs in vitro. A million number of Gr-1+ MDSCs were incubated with a serial dilution of ATG (0.25–100 µg/ml) for 30 min at 4°C. Normal serum and PBS (data not shown) were used as controls. Following washing twice, FITC-conjugated goat-anti-rabbit IgG was added and further incubated for 30 min. (a) The typical example of flow cytometry and (b) representative histogram data. (c) Densitometric data indicating the percentile of cells bound by ATG
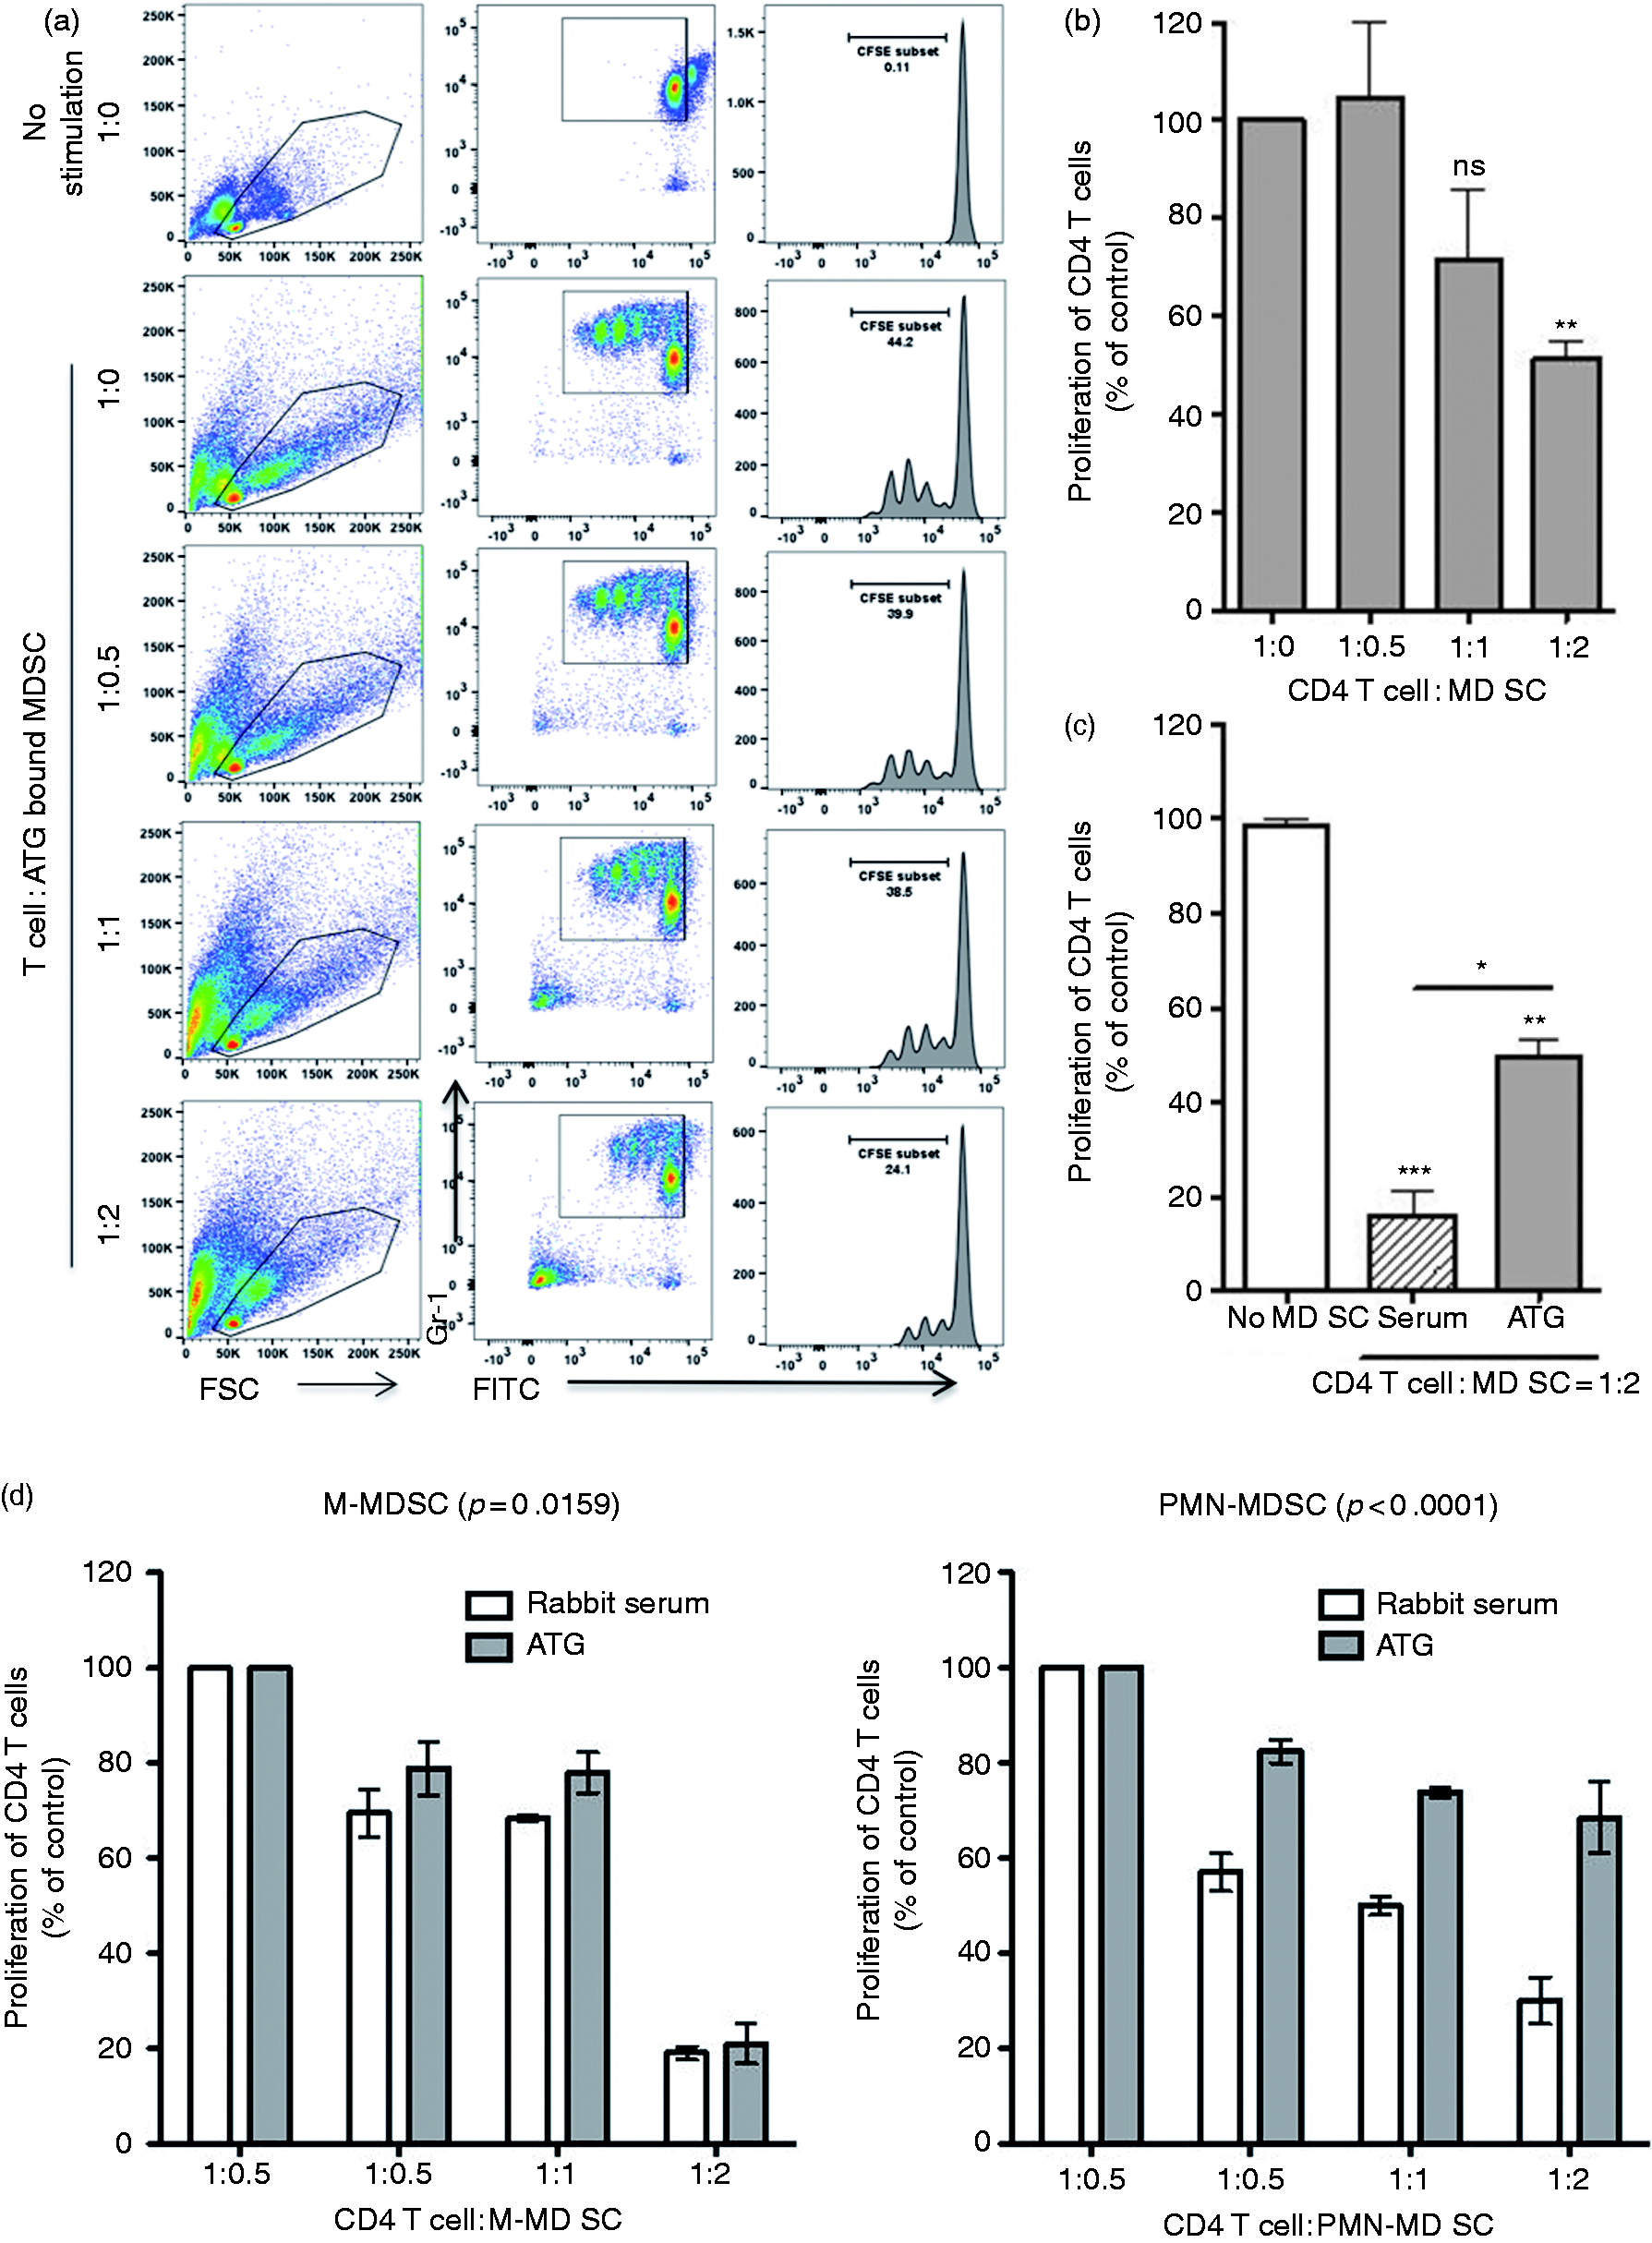
ATG inhibits the suppressive function of MDSCs. Following incubation with ATG (2 µg/ml) for 30 min, MDSCs were collected and were assessed for their suppressive activity by co-culturing with CD4 T cells as described in Figure 2. (a) Representative plot of a sample of T cell proliferation monitored 72 h later by flow cytometry. (b) Densitometric data and (c) statistically significant differences between serum and ATG-treated MDSCs. (d) PMN-MDSCs and M-MDSCs subsets incubated with ATG or control serum and co-cultured with CD4 T cells for 72 h. Cell proliferation was measured in triplicates and mean ± SD is shown. *, P < 0.05, **, P < 0.01, **, P < 0.001.
MDSCs and T cells express common Ags that are bound by ATG
As ATG is polyclonal, it is possible that MDSC depletion resulted from ATG binding of T cell Ags also expressed on MDSCs. To determine if T cells and MDSCs expressed common Ags which might act as ATG targets, we sought to determine if T cells and MDSCs expressed common Ags which, based on the literature, were also known targets of ATG (CCR7, L-selectin and LFA-1). In our hands, we observed that both T cells and MDSCs expressed CCR7, L-selectin and LFA-1 (Figure 7a). We next sought to determine if ATG pretreatment would block binding of our selected Abs, suggesting (albeit indirectly) that our selected Ags were also ATG targets. T cells and MDSCs were pretreated with ATG. Thereafter, we again stained for CCR7, L-selectin and LFA-1, using their respective Abs. ATG pre-treatment led to decreased LFA-1 binding, suggesting that LFA-1 was bound by ATG (Figure 7b).
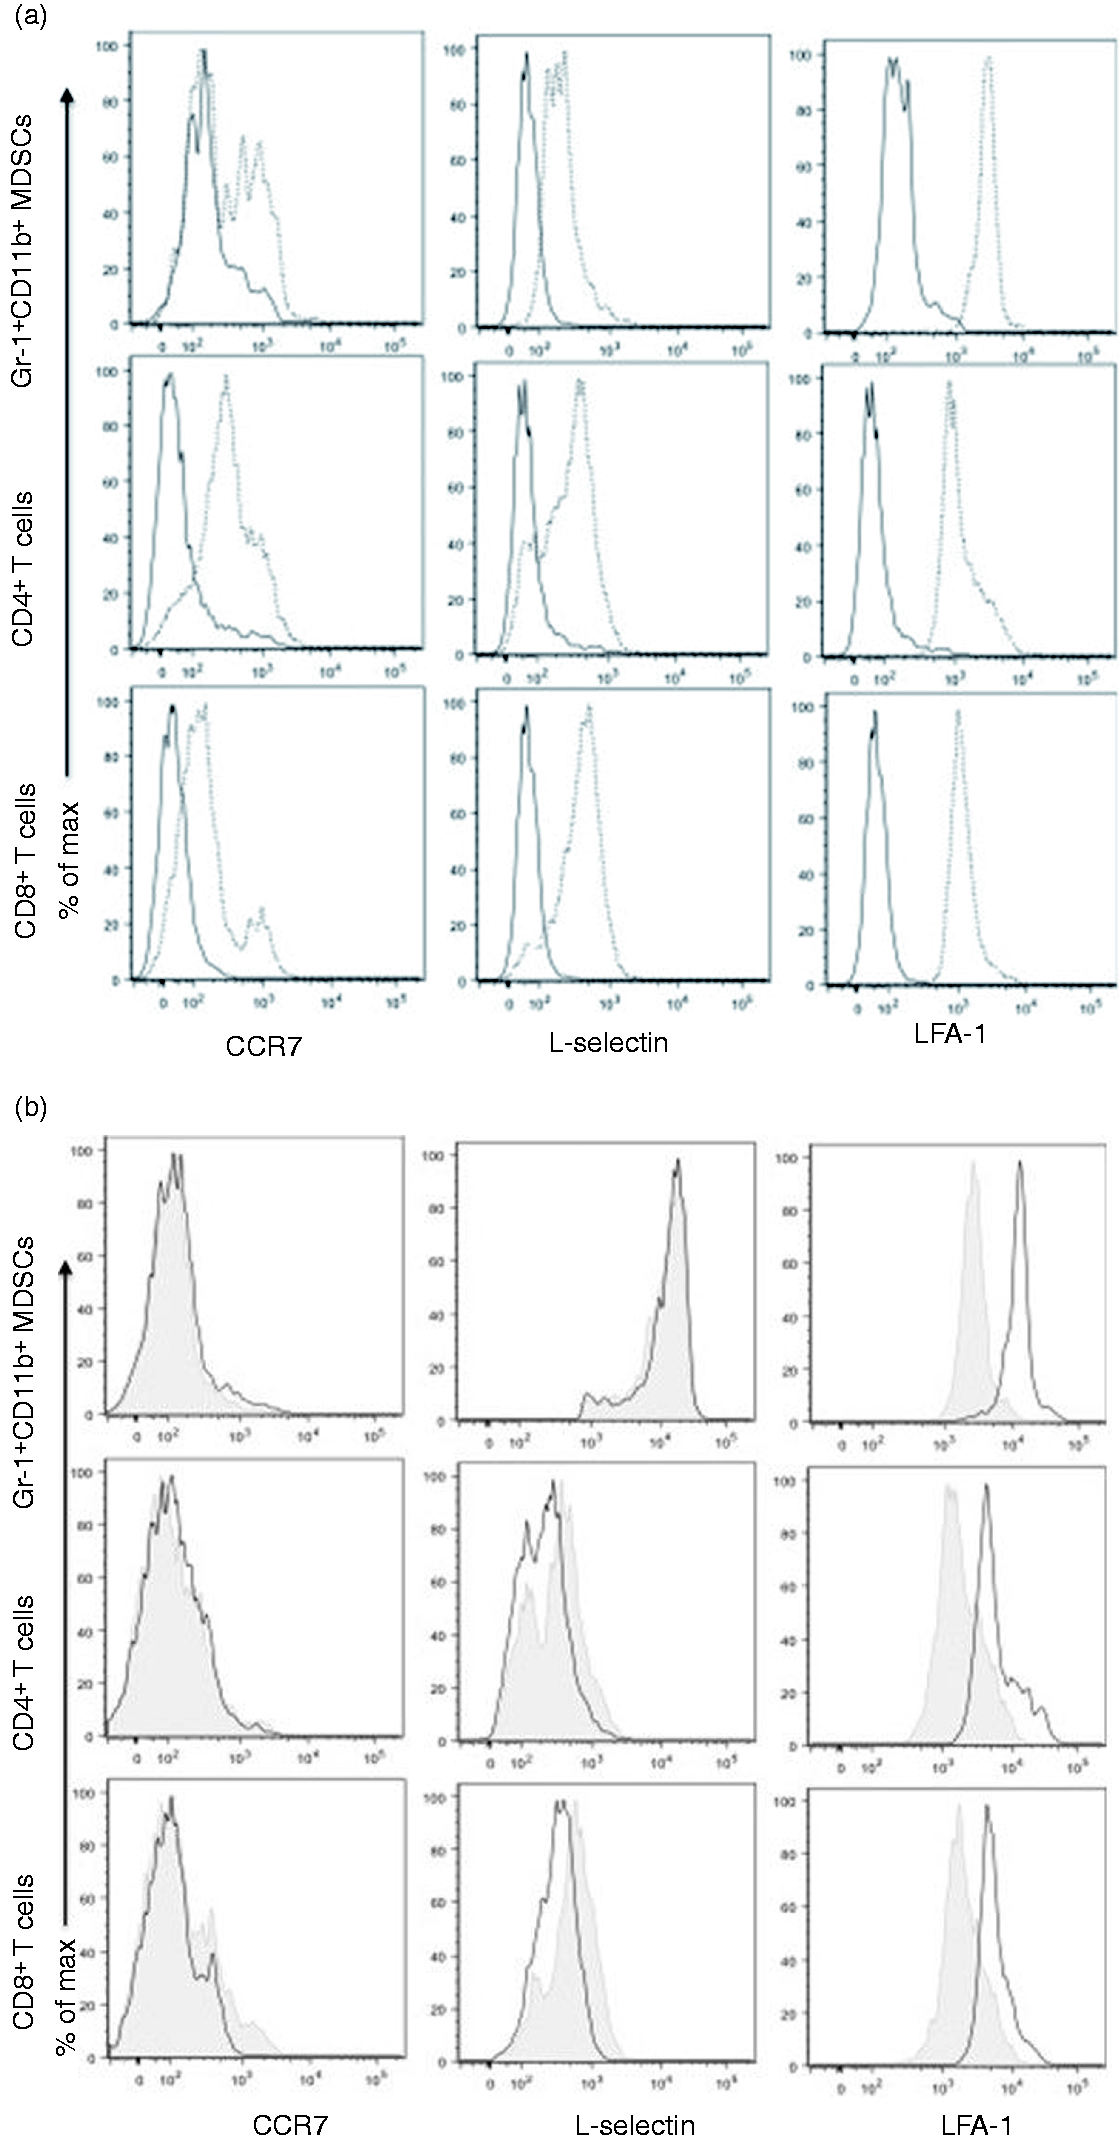
Expression of common Ags CCR7, L-selectin and LFA-1L on T cells and MDSCs, and ATG’s effect on expression of Arg-1 and PD-L1 and arginase levels. Splenocytes were collected and analyzed for the expression of LFA-1, L-selectin, CCR7 and PD-L1 by flow cytometry in T cells and MDSCs. (a) Representative histogram showed the expression of tested markers in CD4+ T cell and CD8+ T cells and Gr-1+CD11b+ MDSCs. Normal line indicates isotype control and dotted line indicate designated protein expression. (b) To determine if ATG bind and affect one of these common Ag, cells were incubated with 5 µg of ATG for 1h at 4°C prior to staining with primary Abs. Besides ATG treatment, same flowcytometry procedures were applied. Each representative histogram showed the difference in the expression of markers in the cells with or without ATG. Line indicate rabbit serum treated cells and shaded indicated ATG-treated cells. (c) Following incubation with ATG (2 µg/ml) for 30 min, MDSCs were collected and assessed for transcriptional expression of Arg-1 and iNOS, and PD-L1. (d) Arginase activity was assessed both in Gr-1+ MDSCs or Gr-1- cells. Each group of cells were incubated 24 h in the presence of 5 or 50 µg/ml of ATG. Normal rabbit serum (serum) was used as a control. All the procedures were performed as described in ‘Materials and methods’ and the enzyme activity (unit/l) was calculated by the formula provided by protocol guideline. In real-time qRT-PCR assay, expression of the interested genes was normalized to the expression of GAPDH. *, P < 0.05, **, P < 0.01, ns: not statistically significant.
ATG suppresses Arg1 and PD-L1 transcript expression and arginase-1 activity
MDSC-mediated T cell suppression in cancers and in transplantation occurs, among other mechanisms, through the actions of arginase-1, iNOS and PD-L1. The expression of each of these molecules was measured with and without ATG treatment. Real-time PCR analysis showed that, after ATG treatment, transcriptional expression of Arg-1 was decreased approximately 30% and PD-L1 approximately 40%. Expression of iNOS was unchanged (Figure 7c). Because Arg-1 expression by PCR was decreased after ATG treatment, we next sought to determine if there was a coincident decrease in arginase activity with ATG treatment. Arginase activity was measured in ATG-treated and control MDSCs by lysing MDSCs and collecting the supernatant. As anticipated, 5 we observed that MDSCs had greater arginase activity than did non-MDSC splenocytes, consistent with their suppressive phenotype. ATG treatment was associated with a dose-dependent decrease in MDSC arginase production (Figure 7d). These data suggest that, outside of ATG mediated depletion, ATG also affects MDSC function.
Discussion
ATG is a commonly used polyclonal T-cell depleting antibody. 27 , 32 Little is known about the effects of ATG on MDSCs. 2 In testing how ATG might affect MDSCs, we observed that ATG binds to MDSCs directly. ATG binding to MDSC led to MDSC depletion and suppression of MDSC function. ATG, at least partly, affected MDSCs’ ability to produce arginase. These effects on MDSCs may have important implications for cancer, autoimmunity and transplant biology.
Few MDSCs were produced in naïve mice and tumor inoculation dramatically induced MDSC expansion. Different inflammatory milieus (i.e. type of cancer, trauma, etc.) yield different numbers and ratios of PMN-MDSCs and M-MDSCs v. total MDSCs. 36 For example, when cancer types were compared, sarcoma-bearing mice generated the fewest number of MDSCs, whereas colon cancers led to much higher levels. 36 Differences in MDSC expansion are likely due to differences in the inflammatory stimuli which exist between tumor types. 1 M-MDSCs are potently immunosuppressive and are found in greater number within, rather than external to, tumors. 1 , 8 PMN-MDSCs are thought to be less immunosuppressive than M-MDSCs, and can be identified peripherally. 8 In our hands, a 15-fold increase in MDSC expansion in tumor-bearing mice was observed. The vast majority of the MDSCs present among splenocytes were PMN-MDSCs and the ratio of PMN:M-MDSC increased 4-fold in tumor-bearing mice, consistent with the literature which suggests that approximately 70% of MDSCs outside the tumor are PMN-MDSCs. 1 , 6 Furthermore, in vitro, the suppressive activity of PMN-MDSCs appeared to be disproportionately affected by ATG treatment when compared with M-MDSCs.
In patients with cancer, MDSCs are directed against the host’s own T cells. Thus, there is no MHC disparity between the T cell and the MDSC. However, in transplantation, MDSCs or T cells may be from donor (e.g. transplanted leukocytes, or ‘passenger leukocytes’) or from the recipient. 38 , 39 Further, MDSCs develop in human kidney transplant recipients after transplantation. 7 We found that MDSCs efficiently suppressed autologous and MHC disparate T cell proliferation. 16 These data are important for the present study, because they suggest that ATG may detrimentally suppress potentially helpful MDSC-mediated T cell regulation after transplantation.
ATG is a polyclonal Ab purified from rabbits immunized with donor T cells. 27 , 29 Thus, cells that express Ags common to T cells may also be bound by ATG. ATG is known to bind multiple immune cell subsets including B cells, natural killer cells, monocytes and dendritic cells. 27 , 30 , 31 We hypothesized that MDSCs may also be bound by ATG. Indeed, our ATG binding assay showed that MDSCs were bound by ATG in a dose-dependent manner. We reasoned that ATG–MDSC binding likely resulted from the expression by MDSCs of Ags also expressed by T cells. To test this hypothesis, we reviewed the literature and identified CCR7, L-selectin and LFA-1 as targets of ATG on T cells.40–43 In our hands, we observed that each Ag was expressed on both T cells and MDSCs. To determine which of these shared Ags were also bound by ATG, we pretreated T cells and MDSCs with ATG and observed a decrease in LFA-1 binding. CCR7 and L-selectin were not affected by ATG pre-treatment. This is interesting, because all three of the antigens are known targets of ATG on T cells.40–43 It is possible that in contrast to LFA-1, ATG bound to antigenic epitopes on CCR7 and L-selectin that were distinct from the antigenic targets of the Abs used to detect these molecules. These epitope differences may explain why ATG pre-treatment did not affect subsequent CCR7 and L-selectin binding. It is very likely that many other antigens are expressed by both T cells and MDSCs. A review of the literature suggests that CCR2, CD66b, TGF-β, IFN-γR and IL-4R may also be expressed by both cell types and therefore recognized by ATG. 37 , 44
Many studies have shown that ATG induces cell death by complement-dependent cytotoxcity.45–48 Further, ATG’s complement dependent cytotoxicity is dose-dependent. 49 Beyond T cells, Cumpelic et al. demonstrated ATG also binds and depletes platelets in a complement dependent manner. 48 Ayuk et al. suggested that ATG also causes caspase-dependent cell death, but that this was complement-independent. 27 , 50 To this end, we have reasoned that MDSC depletion by ATG treatment is, at least in part, complement dependent. Beyond MDSC depletion, T cell-MDSC interactions may have been indirectly affected by ATG. For example, IL-10 is known to maintain MDSCs in cancer models. 51 Thus, ATG-mediated depletion of IL-10 producing T cells may have negatively affected MDSC populations. A deeper investigation of these effects was beyond the scope of this report.
T cell suppression by MDSCs is a primary and defining feature of this cell type. MDSC mediated immunosuppression occurs through several mechanisms. Among these, nutrient starvation via arginase-1 52 reduces the local level of l-arginine important for T cell proliferation. MDSCs also generate NO through inducible NO synthase (iNOS). 53 MDSCs can expand the T regulatory cell population, at least in part, through the expression of PD-L1. 54 , 55 MDSCs derived from ATG-treated tumor-bearing mice down-regulated Arg-1 and PD-L1, perhaps explaining MDSC loss of function. The reduction in Arg-1 mRNA expression was associated with a decrease in arginase activity. However, arginase reduction was only partial (c.15% absolute reduction), suggesting (perhaps) that even small decreases in arginase production translate to substantial losses of MDSC function. Perhaps more likely, the observed loss of MDSC function was multifactorial, resulting from a combination of MDSC depletion, steric hindrance of regulatory proteins via ATG, in addition to ATG-mediated suppression of Arg-1 and PD-L1.
Other immunosuppressive agents also affect MDSCs. Glucocorticoid antagonism suppresses the MDSC response to inflammation. 56 Cyclosporine may enhance the suppressive nature of MDSCs secondary to iNOS up-regulation, however the effect of tacrolimus, a calcineurin inhibitor, is poorly understood. 23 mTOR inhibitors such as rapamycin have been shown to suppress MDSC function, though they are also known to paradoxically upregulate iNOS and Arg1. 57 , 58 Monoclonal Abs such as Alemtuzumab, Basliximab and Rituximab are poorly understood. Beyond induction agents, there are no focused studies of chronic immunosuppressive agents such as tacrolimus, belatacept, or mycophenolate moffeteil and their effects on MDSCs in the transplant setting. 23
T cell depletion in blood and peripheral lymphoid tissues is the primary immunomodulatory effect of ATG, particularly in transplantation. 27 , 59 However, accumulating evidence suggests that, beyond T cell depletion, ATG may also stimulate T regulatory cells (Treg).60–62 Indeed, Lopez et al. tested the ability of ATG to induce the generation of Tregs and found that ATG expanded CD4+CD25+ T cells and up-regulated expression of CTLA-4 and Foxp3 in the expanded cells. 63 In an in-vitro model assessing the impact of ATG, Buszko et al. recently showed that Foxp3+ Tregs can be expanded with ATG treatment as well, however, ATG mediated Foxp3+ expansion was transient and ATG mediated effects appeared to decline 10 d after ATG treatment. 64 These data suggest that ATG has immunomodulatory effects that go beyond T cell depletion. Thus, Foxp3+ Tregs generated as a result of ATG may have a protective role in delaying transplant rejection. Boenisch et al. suggested that ATG reprograms CD4+ T cells to become Tregs, and this transition was STAT3-dependent. 65 Additional evidence suggests that ATG preferentially depletes conventional T (Tconv) cells, but that it spares Tregs. Taken together, ATG can affect Tregs as well as MDSCs. 43 Because T cell proliferation in this study was enhanced by ATG administration, it is possible that ATG had a greater effect on MDSCs than on Tregs, however this important topic requires additional investigation.
MDSCs are potently immunosuppressive and are associated with metastases and poor survival in cancer patients. 12 , 14 MDSCs suppress T cell responses at the maternal–fetal interface 66 and they display aberrant function in autoimmune settings. 15 Further, MDSCs develop after organ transplants and may prolong graft survival. 7 In this regard, it may be worth studying in detail the effects of ATG in models of transplantation, specifically examining its effects on MDSCs and how these might alter transplant outcomes. Beyond transplantation, ATG may have also a role in targeting MDSCs in cancer treatment. Since the mechanisms underlying ATG-induced functional modulation are understudied, further investigations of its effects on MDSC biology are needed to better understand its role in cancer, embryology, autoimmunity and in transplantation.
Supplemental Material
Supplemental material for Myeloid-derived suppressor cells are bound and inhibited by anti-thymocyte globulin
Supplemental Material for Myeloid-derived suppressor cells are bound and inhibited by anti-thymocyte globulin by Young Suk Lee, Eduardo Davila, Tianshu Zhang, Hugh P Milmoe, Stefanie N Vogel, Jonathan S Bromberg and Joseph R Scalea in Innate Immunity
Footnotes
Acknowledgment
We are grateful to the American Surgical Association for a junior faculty development award.
Declaration of conflicting interests
The author(s) declared no potential conflicts of interest with respect to the research, authorship, and/or publication of this article.
Funding
The author(s) received no financial support for the research, authorship, and/or publication of this article.
References
Supplementary Material
Please find the following supplemental material available below.
For Open Access articles published under a Creative Commons License, all supplemental material carries the same license as the article it is associated with.
For non-Open Access articles published, all supplemental material carries a non-exclusive license, and permission requests for re-use of supplemental material or any part of supplemental material shall be sent directly to the copyright owner as specified in the copyright notice associated with the article.