
Abstract
TLR4 respond to bacterial LPS to produce inflammatory cytokines. TLR4 are expressed in dorsal root ganglia and play a role in pain. F11 dorsal root ganglia × mouse neuroblastoma cells possess many of the properties seen in nociceptive dorsal root ganglia neuronal cells. Here, we investigated the effect of 2 h and 6 h treatment with LPS upon the expression of inflammatory proteins in undifferentiated and differentiated F11 cells. The cells expressed mRNA for TRL4 (mouse, not rat) and proteins involved in TLR4 signaling. TLR4 expression was confirmed using immunohistochemistry. LPS produced modest increases in mouse and rat IL-6 and in mouse cyclooxygenase-2 levels in undifferentiated cells, but did not significantly affect mouse TNF-α expression. This contrasts with the robust effects of LPS upon cyclooxygenase-2 expression in cultured dorsal root ganglia neurons. F11 cells expressed the endocannabinoid metabolizing enzymes fatty acid amide hydrolase and N-acylethanolamine acid amidase (both murine), which were functionally active. These data suggest that F11 cells are not a useful model for the study of LPS-mediated effects but may be useful for the study of endocannabinoid catabolism.
Keywords
Introduction
TLRs are a family of PRRs that play a key role in the innate immune response. The TLRs respond to different microbial components: TLR4/MD2, for example, will recognize LPS from Gram-negative bacteria, mannan from Candida albicans, glycoinositolphospholipids from Trypanosoma, envelope proteins from RV and MMTV viruses, as well as host proteins such as heat shock proteins 60 and 70, fibrinogen, β-defensin and hyaluronan.1,2 LPS binding to the TLR4/MD2 complex leads to activation of two pathways, MyD88-dependent and MyD88-independent, where the former results in activation of NF-κB and activating protein-1 and, in consequence, the production of inflammatory cytokines.1,2
TLR4 is not only found on immune cells such as macrophages, but also on neurons in the brain, trigeminal ganglia and dorsal root ganglia (DRGs).3–5 In the ganglia, TLR4 co-localize with markers of nociceptive transmission, such as the transient receptor potential vanilloid 1 (TRPV1),4,6 and TLR4 activation by LPS markedly increases mRNA levels of the prostaglandin-synthesizing enzyme cyclooxygenase-2 (COX2), the cytokines TNF-α (deriving from the non-neuronal cells), IL-1β and the chemokine monocyte chemoattractant protein-1 in a manner blocked by TLR4 antagonists in DRG cells.7–9 Additionally, TLR4 activation affects TRPV1 expression and function. Thus, inhibition of TLR4 by a TLR4 antagonist mitigates the increase in the number of TRPV1-positive neurons in DRGs following paclitaxel treatment. 10 In HEK293 cells transfected with TLR4 and TRPV1, the TRPV1 activator capsaicin produces an inward current that is potentiated by LPS. 10 Given their localization, it is not surprising that TLR4 are involved in pain: in rats with acetic acid-induced visceral hypersensitivity, TLR4 expression in the DRG is increased, and the reduced colonic distension threshold found in these rats is reversed by a TLR4 antagonist. 11 A TLR4 antagonist also reduces the mechanical hyperalgesia induced by paclitaxel in rats. 12
From the above discussion, it is clear that TLR4 plays important role(s) in the function of DRG neurons. However, the study of these roles would be greatly aided by the identification of a simple cell culture model not requiring the isolation and culture of DRGs. One potential cell line is the F11 rat DRG × mouse neuroblastoma cell line. 13 These cells, either per se or upon differentiation to produce cells with long neurites, share many of the properties associated with DRG neurons, including functionally active voltage-activated Ca2+ channels, opioid, bradykinin, cannabinoid, TRPV1 and nicotinic acetylcholine receptors.14–21 Additionally, when transfected with protein kinase Iiα BRET sensor, the cells respond to exogenous prostaglandin E2 by a reduction in the BRET signal. 22 The undifferentiated cells express mRNA for TLR4, 21 but it is not known whether this is translated into protein levels, whether the expression is affected by differentiation or whether activation of the TLR4 pathway leads to the same changes in mRNA levels of inflammatory mediators as seen in cultured DRG neurons. These scientific questions have been investigated in the present study.
Materials and methods
Compounds and materials
[Ethanolamine 1-3H]AEA (specific activity 60 Ci/mmol) was obtained from American Radiolabeled Chemicals (St. Louis, MO, USA). Non-radioactive AEA and URB597 (3’-carbamoyl-biphenyl-3-yl-cyclohexyl-carbamate) were obtained from Cayman Chemical Co. (Ann Arbor, MI, USA). Ham’s nutrient medium F12, DMEM, HAT medium, dibutyryl cyclic AMP (db-cAMP), rat nerve growth factor-β, LPS from Escherichia coli serotype O111:B4, pentadecylamine, capsaicin and bradykinin were obtained from Sigma-Aldrich (St. Louis, MO, USA). Rabbit anti-mouse/human-TLR4 Ab, goat anti-rabbit Alexa Fluor 488 and DAPI were purchased from Life Technologies (Thermo Fisher Scientific, Waltham, MA USA).
Culture and differentiation of F11 cells
F11 hybridoma cells (passage numbers 15–30; ECACC, Porton Down, UK) were cultured as undifferentiated form in Ham’s nutrient medium F12, 10% FBS, HAT medium, 100 U/ml penicillin and 100 µg/ml streptomycin. The cells were cultured in 25 cm2 flasks at 37℃ with 5% CO2 in a cell culture incubator. The cells were split 1:2 when confluency of 60–70% was reached. Half of the medium (conditioned medium) was changed twice a week. For differentiation, cells were cultured for 24 h in the six-well plates with Ham’s F12 medium and then their medium was changed to differentiation medium, 18 which consists of DMEM, 0.5% FBS, 1 mM db-cAMP, rat nerve growth factor-β (200 µg/ml), 100 U/ml penicillin and 100 µg/ml streptomycin. Medium was changed every other day and the cells were grown up to 9 d after start of differentiation. LPS (0.1 µg/ml) treatment was undertaken on 2.5 × 10⁵ cells/well for qPCR assays for either 2 h or 6 h at 37℃.
Quantitative PCR
Primer sequences used in the present study.
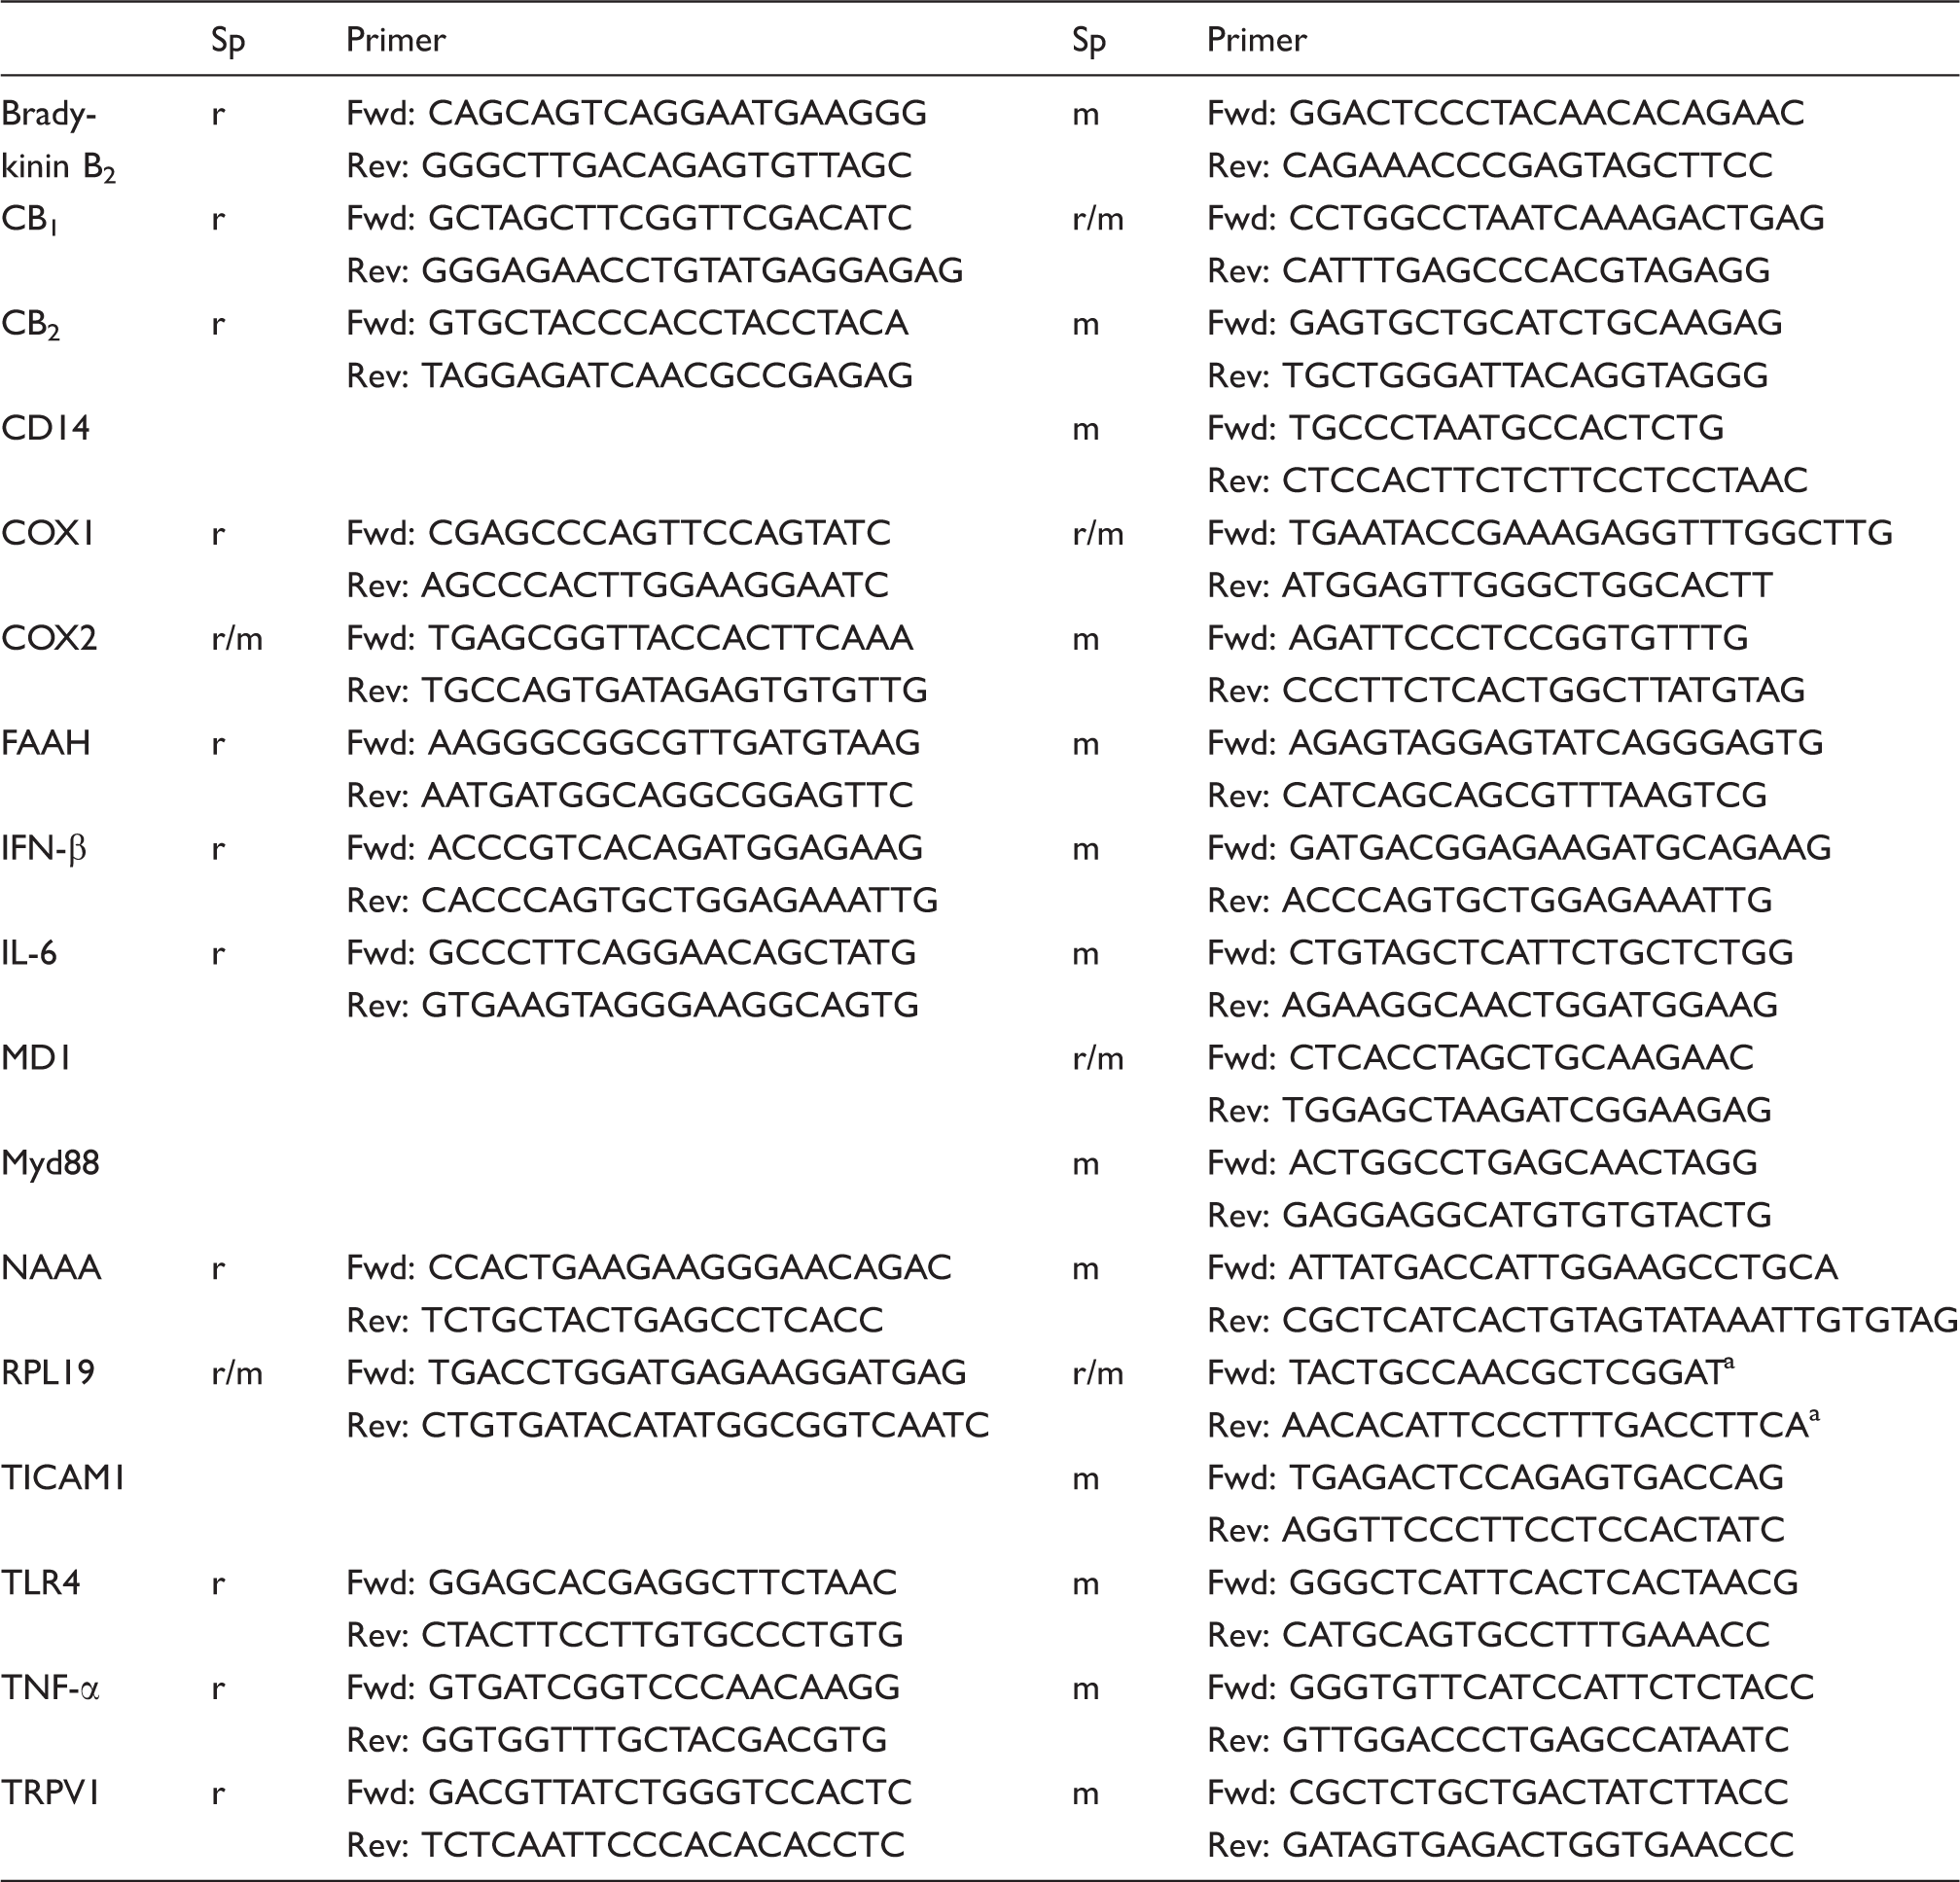
Sp: species; r: rat; m: mouse; r/m: recognizes both rat and mouse.
This primer is termed RPL19-2nd in the text.
Table 1 lists two RPL19 primers, both recognizing the gene product from mouse and rat. The primer in the left-hand column of Table 1 was used throughout in the ΔCt calculations. However, we also obtained data for the primer listed in the right-hand column of Table 1 (‘RPL19-2nd’). The Lin’s concordance correlation coefficient (a correlation coefficient measured with respect to a 45° line of identity and a useful measure of reliability of measurement 23 ) for the Ct values obtained with the two RPL19 primers was 0.85 (n = 72; 95% confidence interval 0.76–0.90). Plotting the data as difference vs. average of the two measures 24 gave a bias of −0.035 ± 0.31 (SD) and the 95% limits of agreement from −0.64 to +0.57.
Immunohistochemistry
For immunohistochemistry, cells (2.5 × 10⁵ cells/well) were plated on glass coverslips, placed in 24-well plates that were coated with poly-
Calcium imaging
Cells (1.5–2.0 × 10⁴ per experiment) were seeded on SPL petri dishes (Saveen-Werner, Limhamn, Sweden) and were incubated for 24 h at 37℃, 5% CO2, in a cell culture incubator. Cells were loaded with Fura2-AM (1.5 μM; Molecular Probes, Thermo Fisher Scientific) in Tyrode’s solution by incubating at room temperature for 1.5 h in the dark and then incubated for 15 min in Tyrode’s solution. Cells were imaged using an Olympus semi-confocal microscope IX2-DSU/BX2-DSU, CCD camera Hamamatsu camera model ORCA-ER and standard 340 and 380 nm filters. Exposure times were 15–35 ms and images were taken every 3 s. Following 1 min of baseline imaging, bradykinin (2 μM) was applied at min 1, followed by capsaicin (50 μM) at min 4, KCl (50 mM) at min 7 and finally ionomycin (5 μM) at min 10. Perfusion with each substance was followed for 1 min, after which the cells were perfused with Tyrode’s solution to wash out the substances. Analysis of recorded signals was performed using CellR software on the cells that responded to ionomycin (as positive controls). Areas under the curve were determined by totaling the observed ratio values for the 40 observations after addition of the compound after subtraction of unity (the initial ratio value at the start of the experiment) from each value.
[3H]AEA hydrolysis in intact cells
Cells (1.5 × 10⁵ per well at the start of the experiments) were cultured in 24-well plates. [3H]AEA hydrolytic capacity was measured by the method of Björklund et al. 25 Cells were washed with 400 μl pre-warmed KRH buffer (120 mM NaCl, 4.7 mM KCl, 2.2 mM CaCl2, 10 mM HEPES, 0.12 mM KH2PO4, 0.12 mM MgSO4, pH 7.4) containing 1% BSA, then 400 µl pre-warmed KRH buffer without BSA. The test compounds URB597 (concentration 1 µM during pre-incubation) and pentadecylamine (‘Penta’, concentration 30 µM during pre-incubation) or vehicle (DMSO 0.1% v/v) were then added to the cells in 350 µl of pre-warmed KRH buffer with 0.1% fatty acid-free BSA and the cells were incubated for 10 min at 37℃. [3H]AEA (50 µl in KRH buffer with 0.1% fatty acid-free BSA, final concentration of AEA 100 nM) was added to give a final volume of 400 µl and the cells were incubated at 37℃ for a further 15 min. Reactions were stopped by addition of 600 μl activated charcoal buffer (120 μl activated charcoal + 480 μl 0.5 M HCl). Aliquots (600 µl) were taken and centrifuged at 1420 g for 10 min. Aliquots (200 µl) of the supernatants were transferred to scintillation vials and analyzed for tritium content by liquid scintillation spectroscopy with quench correction.
IL-6 levels in cell lysates and cell medium
F11 cells (undifferentiated cells, and 6 d-differentiated cells, passage 23) and mouse J774 macrophage cells (passage 11) were treated with LPS as described above for 24 h. At the end of the treatment, medium was collected and stored at −80℃. The cells were washed with cold PBS (2 × 2 ml) after which cold PBS (750 µl) was added and the wells were scraped and the cells collected. Cold PBS (750 µl) was added and the wells were again scraped to collect the cells. The combined cells were centrifuged (228 g, 4℃) and 400 µl NP40 (150 mM NaCl, 1% Triton X-100, 50 mM Tris HCl, pH 8) + 2 μl protease inhibitor III (1:200) were added. Samples were shaken for 30 min at 4℃, centrifuged (14,000 g, 5 min, 4℃) and the supernatants were collected and stored at −80℃. IL-6 levels were measured using a commercial ELISA kit (cat. no. KRC061, Thermo Fisher Scientific).
Statistics
Two-way type II ANOVA with heteroscedasticity (unequal variances)-corrected (‘hc3’) coefficient covariance matrices were calculated using the function ANOVA in the car package for the R statistical programme.26,27 When significant interactions were seen (upon implementation of a 5% false discovery rate for all the data 28 ), the data for a given differentiation status (undifferentiated, 6 d) were re-analyzed using a one-way ANOVA with heteroscedasticity-corrected (‘hc3’) coefficient covariance matrices, with robust pairwise comparisons determined using the functions glht and vcovHC in the multcomp and sandwich packages, respectively, for R.29,30 Unless otherwise stated, the data shown are for cells from separate wells treated with LPS on the same occasion. Lin’s concordance correlation coefficients were calculated using the function epi.ccc in the package epiR for R. 31 Bland–Altman plots were constructed with the GraphPad Prism Computer programme (version 7.0 a for the Macintosh). Welch’s t-test, Mann–Whitney U-test, the Kolgorov–Smirnov distribution test, Fisher’s exact tests and the D’Agostino and Pearson normality tests were conducted using GraphPad Prism.
Results
Characterization of undifferentiated and differentiated F11 cells
Incubation of the cells in the differentiation medium resulted in the expected morphological changes, with the cells producing long neurites (see Figure 1a for an example, after 6 d of differentiation). Given that F11 cells are a hybrid of rat DRG cells and mouse neuroblastoma,
13
primer sequences were made towards mRNA of both mouse and rat origin (Table 1). The cells expressed mRNA for both mouse and rat B2 bradykinin receptors (Figure 1b, c), a finding consistent with the literature
21
(see Table 2, where the data for that study has been presented for all the proteins investigated here in order to aid the reader) and stimulation of the cells with 2 µM bradykinin produced a robust increase in intracellular calcium (Figure 1e). Defining a response as an area under the curve ≥10% of that seen with 5 µM ionomycin in the same cell, 46/53 of the cells responded to 2 µM bradykinin. A total of 23/53 of the cells responded to 50 mM K+ with an increase in intracellular calcium levels (Figure 1e), i.e. the population contains both bradykinin-sensitive, K+-sensitive and bradykinin-sensitive, K+-insensitive cells. In cultured mouse DRGs, the number of cells responding to this concentration of K+ increases from 5% at embryonic day 11.5 to 22% and 77% at embryonic days 12.5 and 14.5, respectively; the non-responsive cells did not respond to 100 mM K+.
32
The F11 cells are derived from E13 rat embryos,
13
which by Carnegie staging corresponds roughly to mouse E11.5.
33
Calcium influx studies on F11 cells tend to report population responses rather than individual cells, but Francel et al.
14
found that whilst the response to K+ per se was similar in differentiated and undifferentiated cells (and blocked by a calcium channel blocker), the response to a combination of K+ and a calcium channel agonist was higher in the differentiated than the undifferentiated cells. The simplest explanation for our data is that under the culture conditions used, the undifferentiated cells showed heterogeneous expression of calcium channels. The F11 cells expressed mouse but not rat TRPV1 (Figure 1d). In the undifferentiated cells, the expression of mTRPV1 was very low, and none of the 53 cells responded with a calcium signal following addition of the TRPV1 agonist capsaicin (Figure 1e), consistent with the study of Yin et al.
21
Expression levels increased upon differentiation, peaking at 6 d of differentiation (Figure 1d).
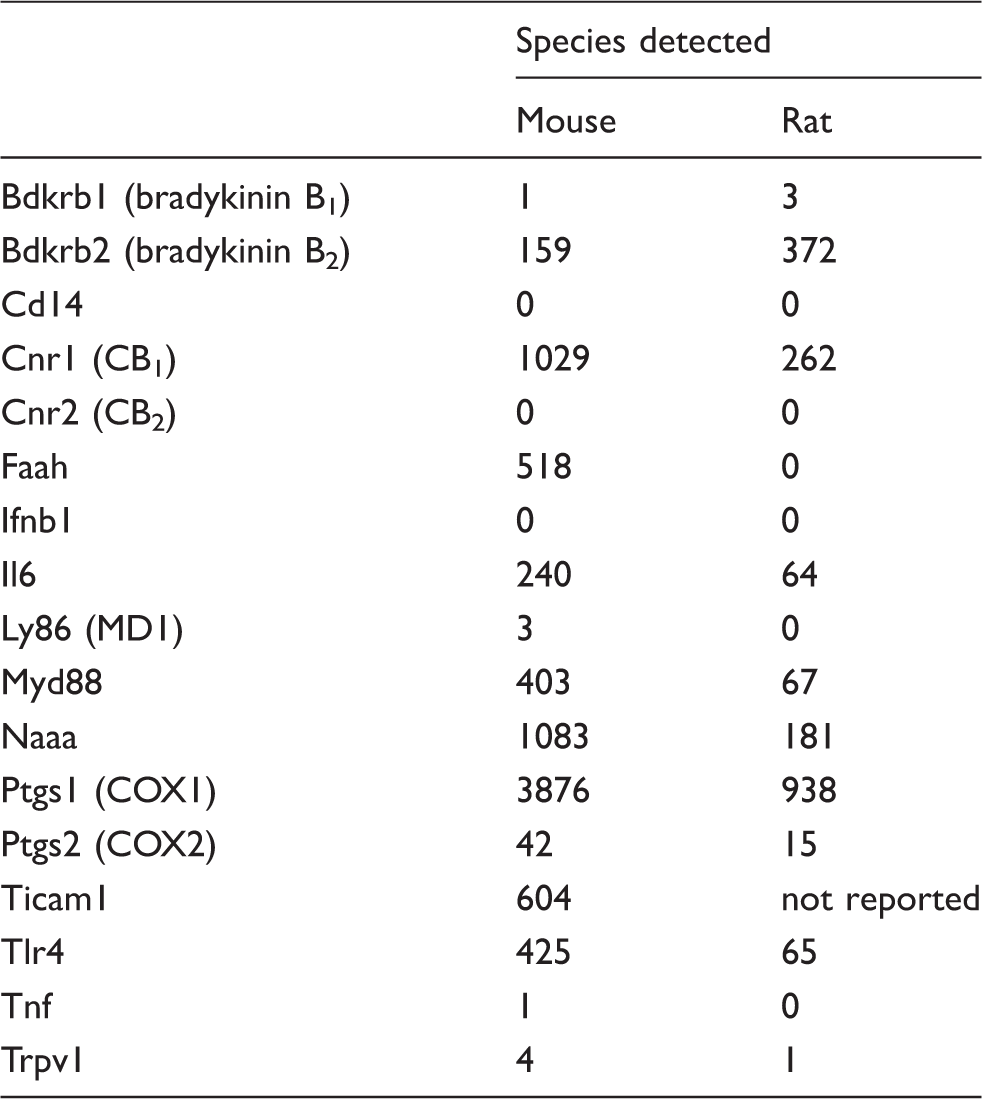
Characteristics of undifferentiated and differentiated F11 cells. (a) Photograph of F11 cells following 6 d of differentiation. The contrast of the photograph has been digitally adjusted for clarity. (b–d, f–i) mRNA levels for the proteins shown following 0–9 d of differentiation. The letter ‘m’ or ‘r’ in front of the protein in question indicates whether it is from mouse or rat. Shown are scatterplots, with the bars representing means. The right axes show the values as fold changes from the undifferentiated control mean values. P-Values were calculated for the ΔCt values by one-way ANOVA with correction for unequal variances. *P < 0.05, **P < 0.01 and ***P < 0.001 vs. the undifferentiated cells, robust post-hoc pairwise comparisons. (e) Calcium traces for undifferentiated F11 cells. Shown are means ± 95% confidence intervals (when larger than the symbols) for a total of 53 cells, taken from three SPL petri dishes, that were responsive to ionomycin (Iono, 5 µM). The concentrations of bradykinin (BK), capsaicin (Cap) and K+ were 2 μM, 50 μM and 50 mM, respectively. (j) Inhibition of 100 nM [3H]AEA hydrolysis by URB597 (‘URB’, 1 µM), pentadecylamine (‘Penta’, 30 µM) and both compounds (‘U + P’) by intact F11 cells. The data are from experiments conducted on six different occasions, and the columns are mean ± 95% confidence intervals of the activity expressed as percent of the corresponding vehicle-treated samples. Expression levels of the mRNA transcripts reported in the transcriptomic study of Yin et al.
21
for the proteins investigated in the present study in undifferentiated F11 cells. Data are taken from the files deposited by the authors of Yin et al.
21
in the gene expression omnibus [https://www.ncbi.nlm.nih.gov/geo/query/acc.cgi?acc=GSM1968259, accessed 14 August 2017. Note that these authors used a different housekeeping gene in their study (TUBA1A)].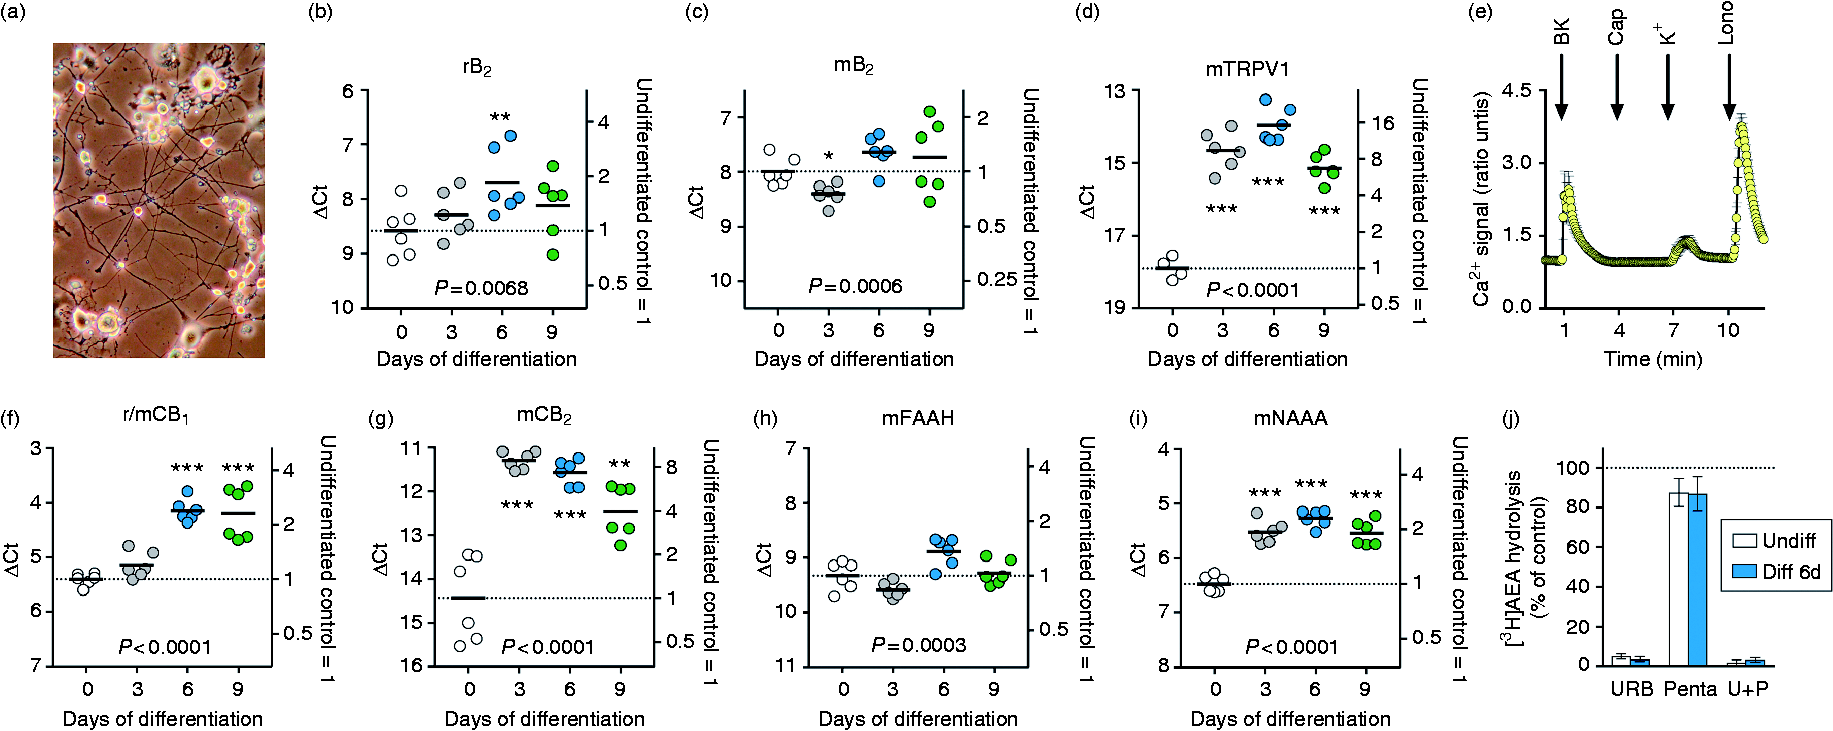
Mouse but not rat CB1 and CB2 receptor expression at the mRNA level was also detected in the cells [Figure 1f, g; note that the primers for CB1 were rat (r) and r/mouse (m), but since we saw no signal with the r primer, the signal with the r/m primer can be attributed to the mouse]. In both cases, expression levels were higher upon differentiation, with maximum expression being observed at 6 and 3 d of differentiation for CB1 and CB2 receptors, respectively. Finally, mouse but not rat fatty acid amide hydrolase (FAAH) and N-acylethanolamine acid amidase (NAAA), enzymes responsible for the hydrolysis of the endogenous CB receptor ligand anandamide and of related N-acylethanolamines, 34 were expressed in both undifferentiated and 6-d differentiated cells (Figure 1h, i). AEA is more avidly metabolized by FAAH than NAAA, and this was reflected in the enzyme activity measurements where the FAAH inhibitor URB597 almost completely inhibited the hydrolysis, whereas the NAAA inhibitor pentadecylamine produced minor, albeit significant, inhibition in both undifferentiated and 6-d differentiated cells (Figure 1j). These data indicate that, in our hands, the F11 cells had the neurochemical and morphological characteristics expected from the literature,14–19,21 and are thus suitable for investigation into the presence and functionality of TRL4.
Expression of TLR4 and related components in undifferentiated and differentiated F11 cells
mRNA for mouse but not rat TLR4 was detected (Figure 2a). Expression of mouse TLR4 increased ∼six-fold during differentiation, reaching a maximum after 6 d (Figure 2a). We also measured some (but not all) of the proteins involved in LPS binding to TLR4 and its signaling, or, in the case of MD1, the regulation of the ability of LPS to bind to TLR4 (Figure 2b).1,2 mRNA for other components, such as mouse (but not rat) LY96 (MD2) has previously been reported to be expressed in undifferentiated F11 cells.
21
TRL4 was also demonstrated immunochemically in both the undifferentiated F11 cells and, as a positive control, in mouse RAW264.7 macrophages; no immunoreactivity was seen in experiments when only the secondary Ab was used (Figure 2c–e).
Expression of TLR4 and related proteins in undifferentiated and differentiated F11 cells. (a, b) Expression at the mRNA level of TLR4, TICAM1, CD14, MD1 and Myd88, The letter ‘m’ or ‘r’ in front of the protein in question indicates whether it is from mouse or rat, respectively. Shown are scatterplots, with the bars representing means. The right axes show the values as fold changes from the undifferentiated control mean values. (a) mRNA for untreated cells and for cells treated with LPS (0.1 µg/ml) for 2 and 6 h are shown. For these and subsequent figures, P-Values are for main effects of differentiation (Pdiff), LPS (PLPS) and the interaction differentiation × LPS (Pint), and were calculated for the ΔCt values by two- way type II ANOVA with correction for unequal variances. When Pint was significant, the individual time points were re-analyzed by ANOVA, with robust post-hoc pairwise comparisons shown for the significant ANOVA; ***P < 0.001, **P < 0.01, *P < 0.05, NSP > 0.05. In (b) only untreated cells were investigated. (c–e) TLR4 (green) and the nuclear marker DAPI (blue) immunofluorescence (40-fold magnification); (c) undifferentiated F11 cells, no TLR4 primary Ab; (d) undifferentiated F11 cells, TLR4 primary Ab present; and (e) RAW264.7 macrophage cells, TLR4 primary Ab present. The bars represent 10 µm.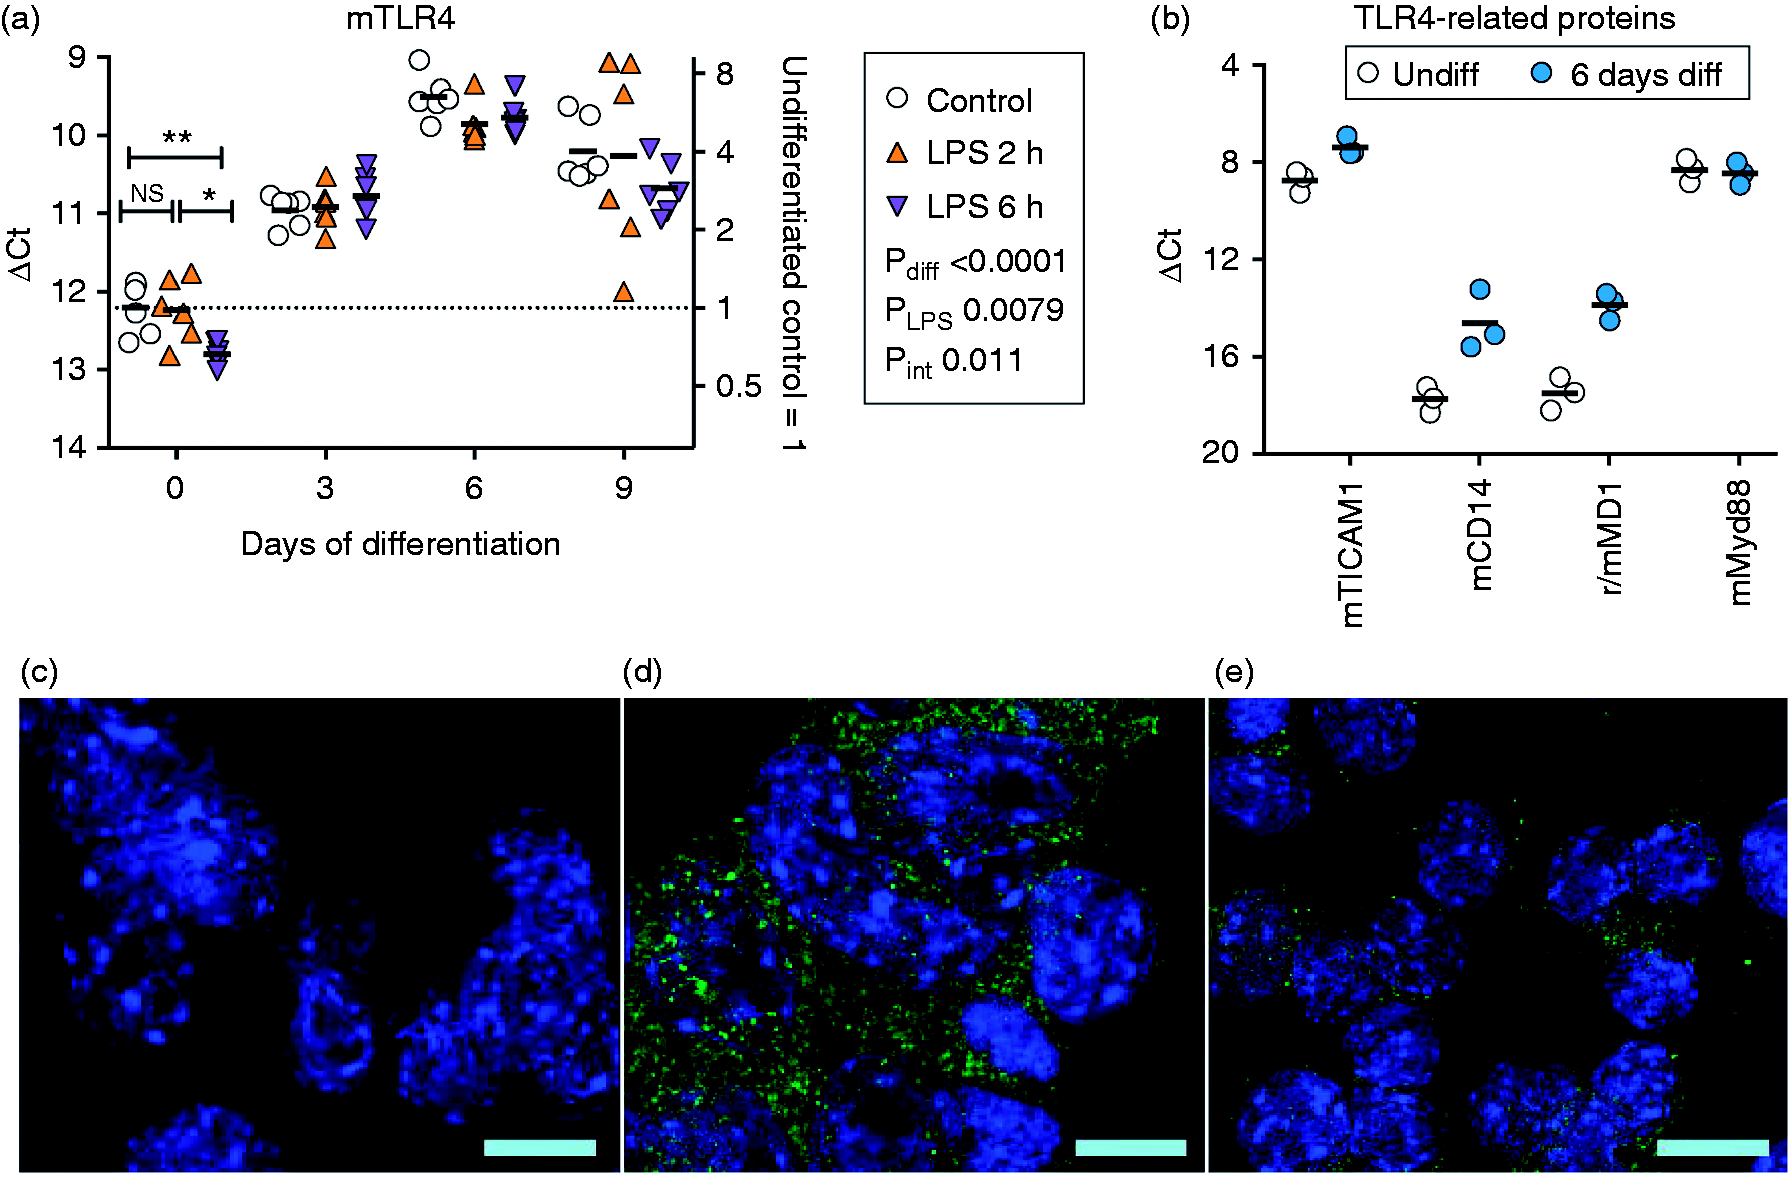
Effects of LPS upon TLR4, IL-6, IFN-β, TNF-α, COX1 and COX2 expression
The effect of LPS treatment for 2 or 6 h upon the expression of these genes at the mRNA level are shown in Figures 2(a, b), 3 and 4. For each protein investigated, two-way ANOVA were determined as described in the statistics section above. This produced 33 (11 × 3) P-values, and so we used a 5% false discovery rate for all these values to compensate for multiple testing. 28 For our data, unadjusted P-values ≤ 0.024 were considered significant using the 5% false discovery rate. Additionally, given the measurement error seen with the two r/m RPL19 primers (see ‘Materials and methods’), changes smaller than 1.6-fold (± 0.67 ΔCt units) are considered to be statistically, but not necessarily biologically, significant.
There was a significant interaction between days of differentiation × LPS treatment for mTLR4 (Figure 2a) and for rIL-6 (Figure 3a). For the undifferentiated cells, the mean ΔCt values for rIL-6 for control and 2 h LPS were 10.16 and 8.72. Calculating 2(–(8.72–10.16)) gives a fold increase of 2.7. Changes were much smaller for the differentiated cells. In preliminary experiments, we measured IL-6 levels in the cells and medium using a commercial ELISA kit (Figure 3c). The kit measures rat IL-6, with a modest cross-reactivity (5.2%, according to the manufacturers) with mouse recombinant IL-6. However, cross-reactivity was sufficient to pick up an increased IL-6 response in mouse J774 macrophages stimulated for 24 h with LPS (Figure 3c). Although the experiment should be considered preliminary in nature, there was no evidence of robustly changed IL-6 levels in either the medium or cell lysates of the undifferentiated F11 cells or in the cell lysates of the differentiated F11 cells at the 24 h time point investigated following LPS treatment (Figure 3c).
(a, b) IL-6 mRNA and (c) levels in undifferentiated and differentiated F11 cells treated with LPS (0.1 µg/ml). Shown are scatterplots, with the bars representing means. (a, b) The right axes show the values as fold changes from the undifferentiated control mean values. For details of the statistical methods, see legend to Figure 2. In (c), IL-6 levels determined using an ELISA kit for the rat cytokine are shown and using a 24-h incubation time with LPS. It should be pointed out that the J774 macrophage cells shown in the figure are of murine origin, and so the robust changes following LPS treatment presumably reflect the cross-reactivity of the kit towards murine IL-6.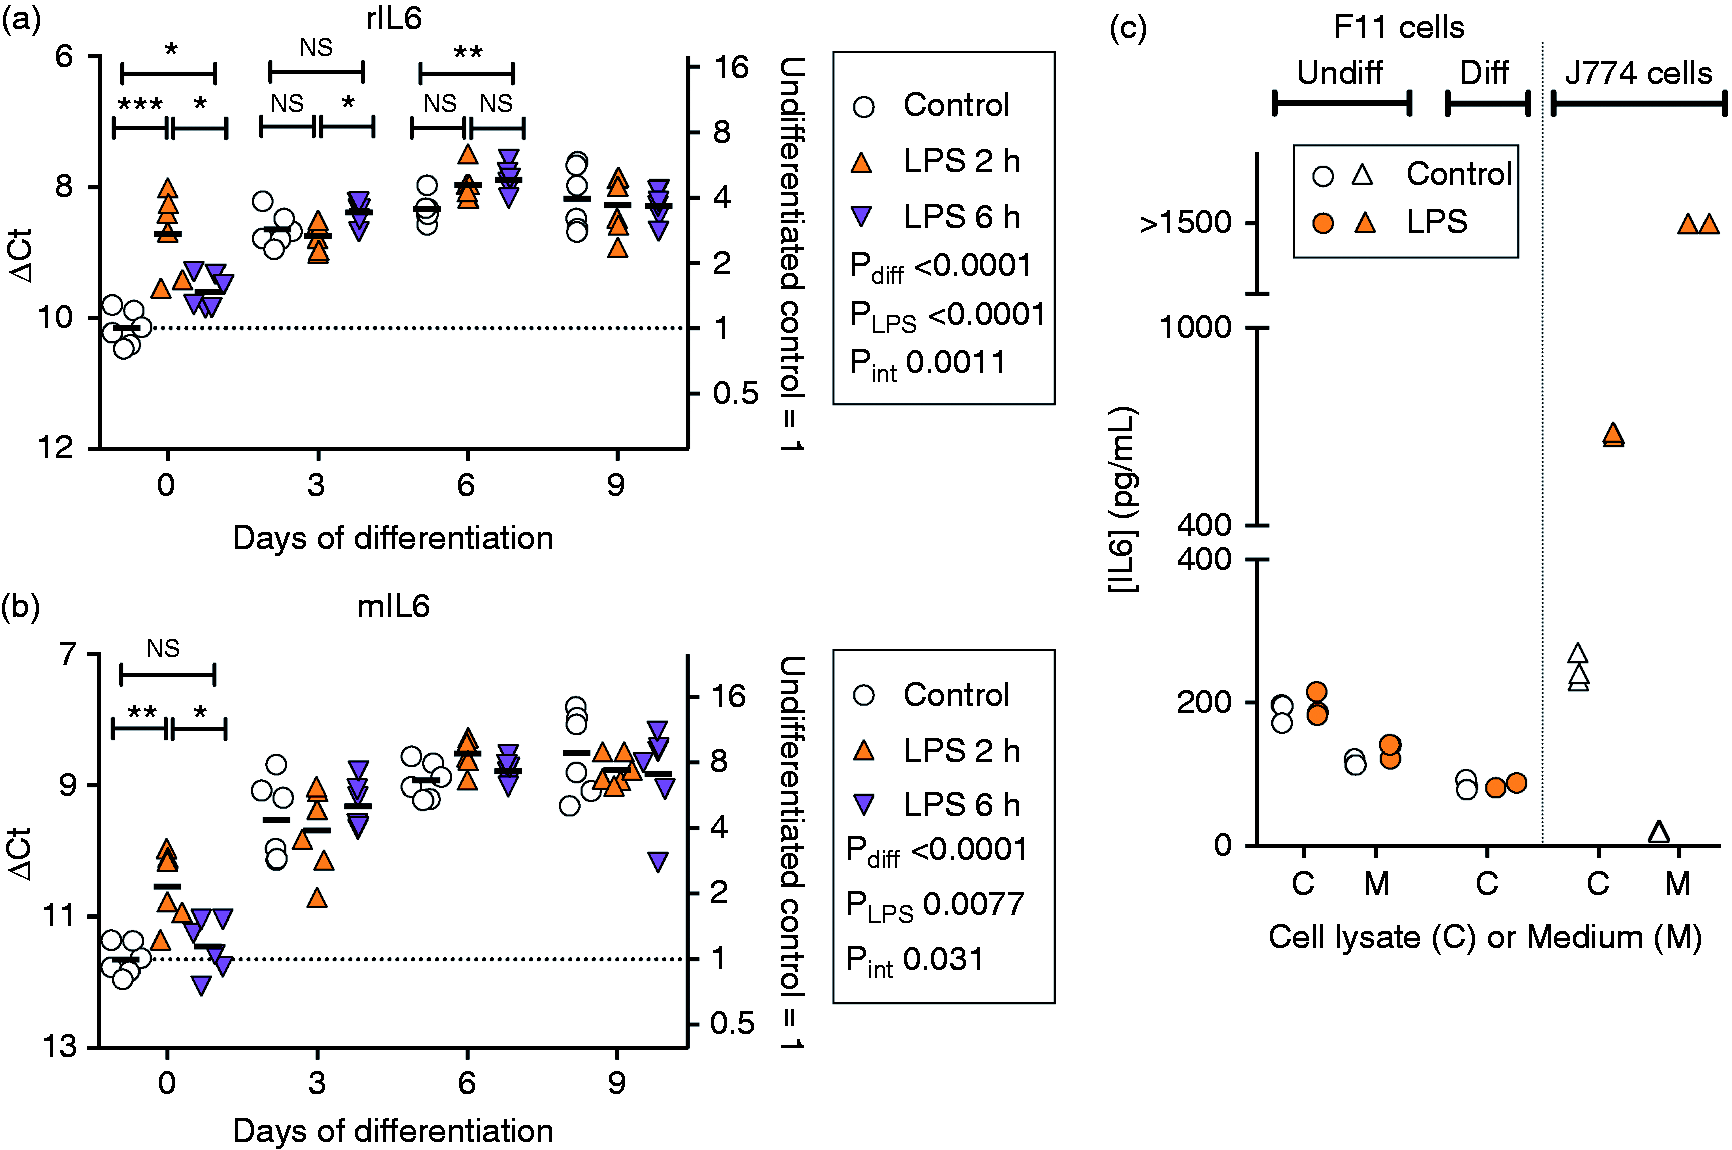
IFN-β and TNF-α from mouse, (but not rat), were detected, but LPS treatment did not significantly affect expression (Figure 4a, b), in contrast to the pronounced increases in expression seen during differentiation. A significant main effect of LPS upon the expression of mouse COX2 (Figure 4e, f) was observed, owing primarily to a decreased expression level after 6 h of treatment. For COX1, included for comparative purposes, we did not have a mouse-specific primer. However, the ΔCt value for the m/rCOX1 was about 1 unit lower for the m/rCOX1 than for the rCOX1, suggesting that about half of the signal is of mouse origin (Figure 4c, d). A two-way type II ANOVA with correction for unequal variances (see statistics) for the ΔCt(m/rCOX1-rCOX1) gave P-values of differentiation, 0.031; LPS, 0.046; differentiation × LPS, 0.93; i.e., outside the critical unadjusted P-value of ≤0.024. A similar calculation for ΔCt(m/rCOX2–mCOX2) gave P-values of differentiation, 0.65; LPS, 0.69; differentiation × LPS, 0.68.
mRNA of TNF-α, IFN-β, COX2 and COX1 in undifferentiated and differentiated F11 cells treated with LPS (0.1 µg/ml) for 2 and 6 h. For details of statistical methods, see legend to Figure 2. Note that for IFN-β (Panel b), the ANOVA values do not include the undifferentiated cells.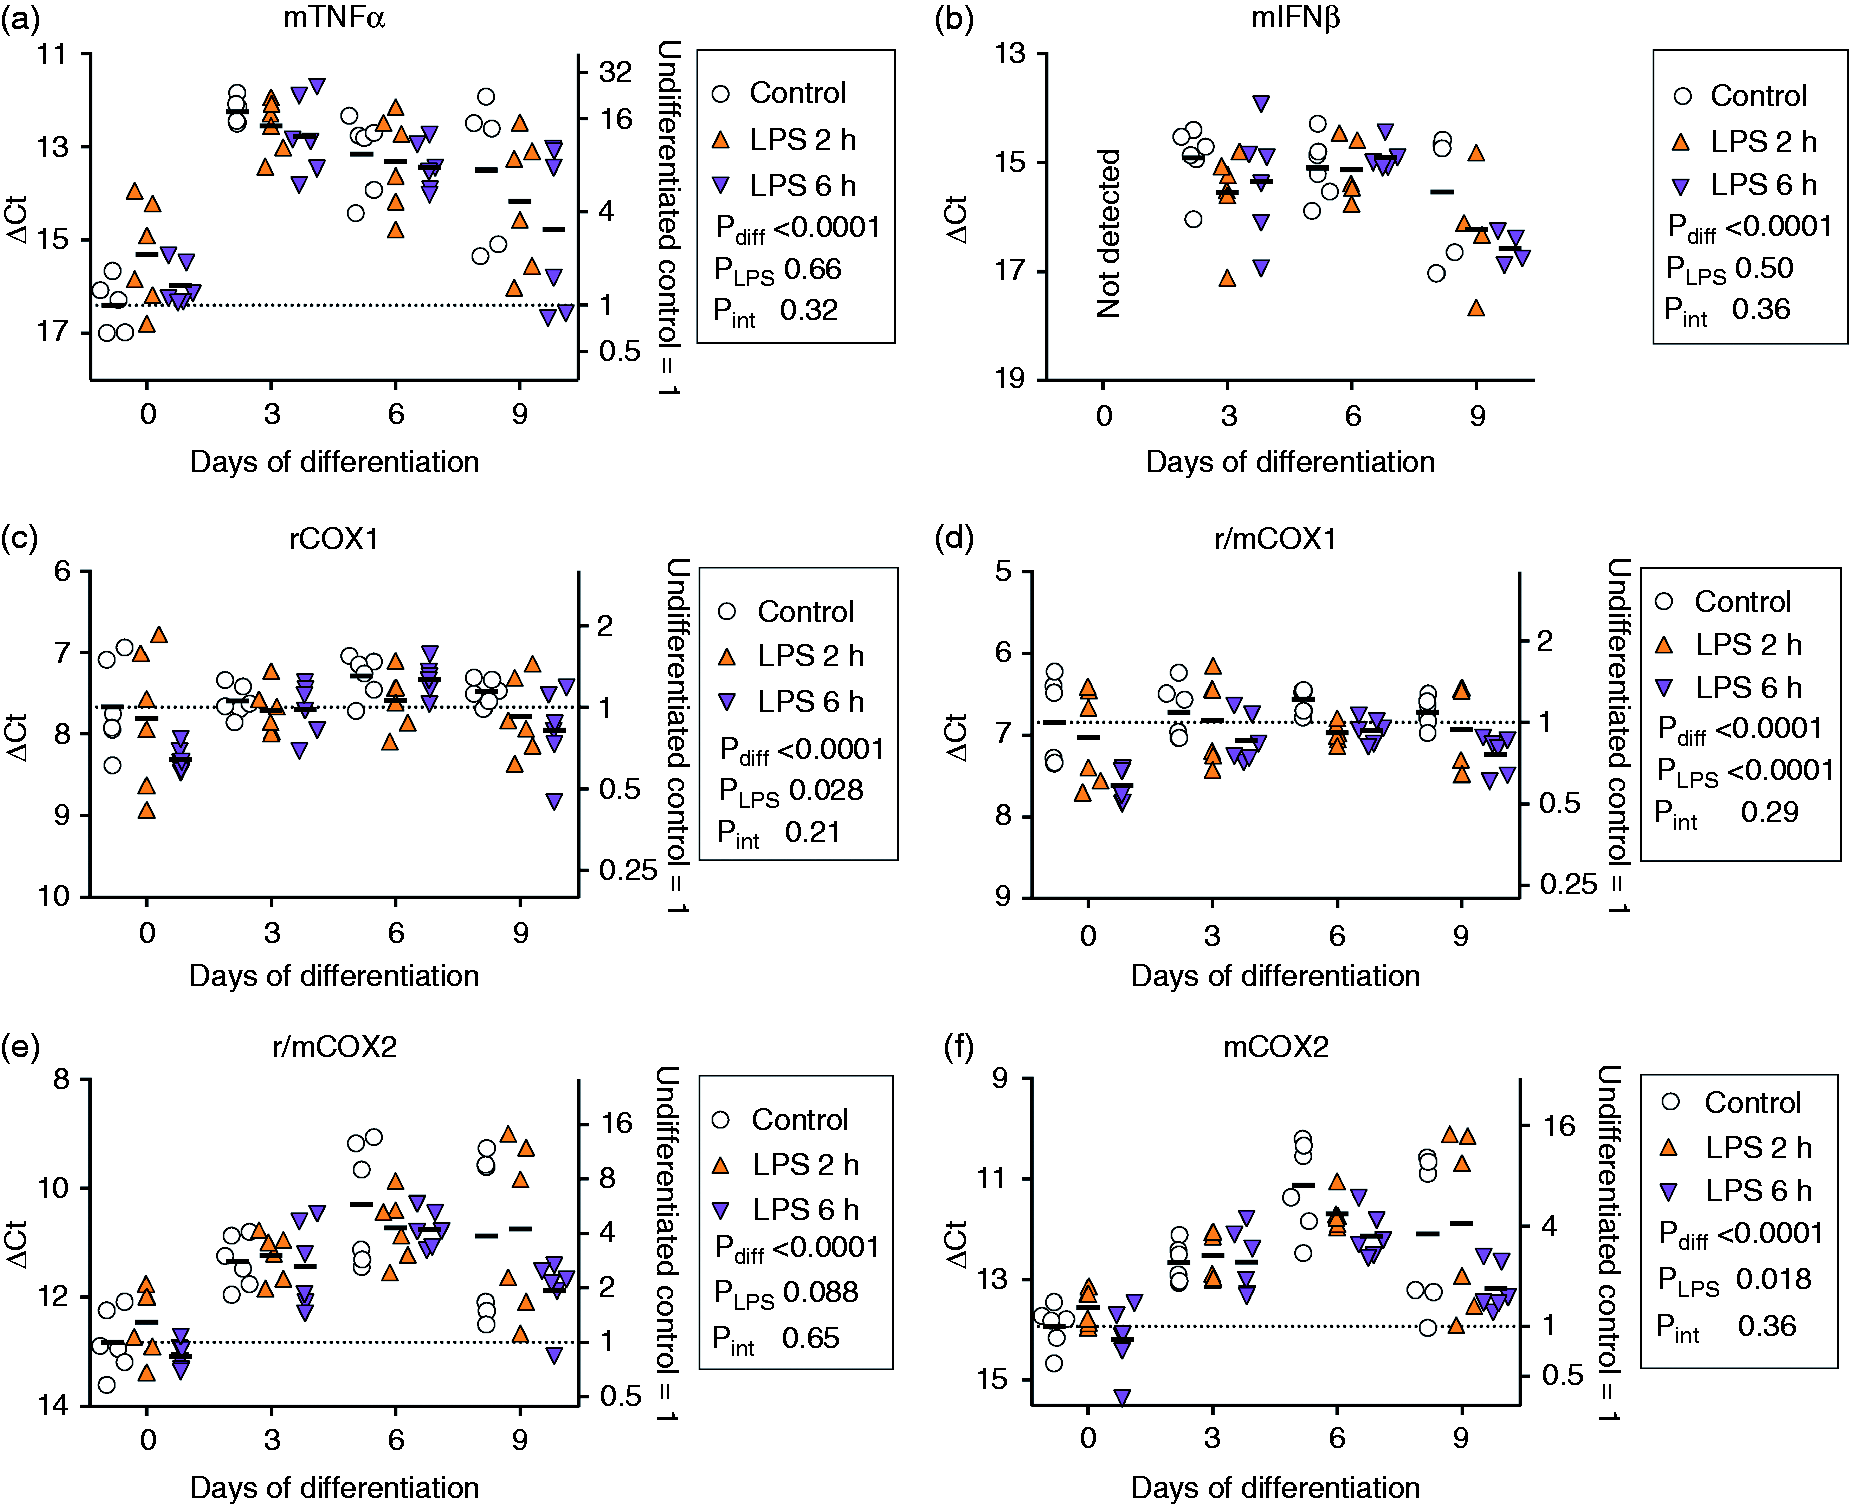
Discussion
F11 rat DRG × mouse neuroblastoma hybrid cells express many of the proteins seen in DRG nociceptive neurons and are a useful model for the study of DRG neurons (see ‘Introduction’). A recent RNA transcriptomic study reported that ∼350–450 genes associated with ‘immune system processes’ were identified in undifferentiated F11 cells as compared with ∼600 for DRG from 6–8-wk-old mice (numbers are rough estimations from Figure 1 of that paper). 21 This included TLR4 and downstream mediators (see Table 2). 21 However, it was not known whether activation of these receptors by LPS produces the same pattern of changes at the mRNA level as seen in cultured DRG neurons. We found that the cells do indeed express mouse (but not rat) TLR4, as well as proteins involved in the receptor complex and its signaling (mouse TICAM1, CD14 and Myd88; the primer for MD1 recognized both mouse and rat). Given the expression of TLR4, our expectation was that LPS treatment would produce robust changes in downstream cytokines like TNF-α and IL-6, and an induction of COX2 but not of COX1. However, we found that LPS treatment of the cells produced at best modest changes in the inflammatory mediators measured, primarily in the undifferentiated cells. The most pronounced change was for rat IL-6, where 2 h of LPS treatment gave a 2.7-fold increase in mRNA expression for the undifferentiated cells, but we were unable to see robust changes in rat IL-6 levels, albeit in preliminary experiments using a longer LPS incubation time to allow for IL-6 synthesis. mCOX2 mRNA expression, if anything, was reduced rather than increased by the treatment. This contrasts with the situation in cultured DRG cells, where 2 h treatment with LPS increases COX2 expression ∼4-8 fold. 8 It is unclear whether this difference between F11 cells and DRG cells reflects a poor functionality of the mouse LPS signaling proteins in the former, or whether LPS stimulates IL-6 production in the DRG cells by a different pathway, one that is not expressed in the F11 cells. Whatever the explanation, the present data would argue against F11 cells being a useful model for the study of LPS-induced changes in nociceptive signaling in DRG neurons, in contrast to its usefulness in the study of the nociceptive signaling components per se, which we were able to demonstrate in the cells.
A final comment concerns the expression and source of some of the proteins seen in the cells. In most cases, the detected mRNA was from mouse, rather than rat, bradykinin B2 receptors, COX1 and COX2 and IL-6 (both species) being the exceptions. With respect to TRPV1, we did not observe a functional response in the undifferentiated cells that responded to bradykinin, but this presumably reflects the low level of expression of the protein in our cells, confirming the transcriptome study (see Table 2). 21 Differentiation induced a pronounced increase in TRPV1 expression, and Ambrosino et al. 20 have reported a robust calcium response to TRPV1 activation in cells differentiated by exposure to a lower FBS concentration + retinoic acid for ≥ 3 d. In contrast, Vetter and Lewis did not see any calcium signal in response to capsaicin in F11 cells differentiated by the same protocol as used in the present study (reduced FBS, NGF and db-cAMP). 18 Culture conditions have been shown to affect responses of DRGs: the ability of gabapentin to reduce calcium currents in cultured DRGs was dependent upon the serum content and NGF concentration, 35 and a similar situation may be occurring here.
Whilst the key results of the study were negative, there was one positive outcome unrelated to the primary aims of the study, namely the data with FAAH and NAAA. Fan et al. 19 demonstrated that both CB receptors were expressed (of murine origin) by F11 cells and were functionally active. Yin et al. 21 also reported that the murine N-acylethanolamine hydrolytic enzymes FAAH and NAAA are expressed at the mRNA level (see Table 2), and we have extended this to demonstrate that they are functional. The expression of FAAH well matches the known location of FAAH in the DRG in vivo. 36 Since AEA can be metabolized by both FAAH, NAAA (to a lesser extent) and by COX2, 37 F11 cells may be a useful model for the study, at the level of the DRG, of compounds targeting endocannabinoid metabolism by these pathways.
Footnotes
Declaration of Conflicting Interests
The author(s) declared no potential conflicts of interest with respect to the research, authorship, and/or publication of this article.
Funding
The author(s) disclosed receipt of the following financial support for the research, authorship, and/or publication of this article: This work was supported by grants from the Swedish Science Research Council (Grant no. 12158, medicine, to CJF) and the Research Funds of Umeå University Medical Faculty (to CJF).