
Abstract
Understanding innate immune intercellular communication following microbial infection remains a key biological issue. Using live cell imaging, we demonstrate that mast cells actively extend cellular projections to sample the macrophage periphery during Francisella tularensis LVS infection. Mast cell MHCIIhi expression was elevated from less than 1% to 13% during LVS infection. Direct contact during co-culture with macrophages further increased mast cell MHCIIhi expression to approximately 87%. Confocal analyses of the cellular perimeter revealed mast cell caspase-1 was localized in close proximity with FcɛRI in uninfected mast cells, and repositioned to clustered regions upon LVS infection. Importantly, mast cell FcɛRI-encompassed vesicles are transferred to macrophages by trogocytosis, and macrophage caspase-1 expression is further up-regulated upon direct contact with mast cells. Our study reveals direct cellular interactions between innate cells that may impact the function of caspase-1, a known sensor of microbial danger and requirement for innate defense against many pathogenic microbes including F. tularensis.
Introduction
Mast cells are highly pleiotropic1–3 and express several surface receptors, including TLRs, cKit, FcɛRI and Ox40L.4–7 For example, TLR2 is important for recognition of bacterial products, including lipoproteins,8–10 and the Kit protein, cKit (CD117), relays signals for cell migration, 6 survival 11 and proliferation. 12 Studies of FcɛRI have shown that subsequent downstream signaling events result in calcium influx, cytokine production and degranulation. 13 Moreover, mast cell OX40L may interact with T cells to participate in regulation of inflammation.14,15 Hence, the activation of mast cells and subsequent affects are dependent on multiple environmental cues, including infection.
In this study, we sought to further examine inter-cell communications between mast cells and macrophages during Francisella tularensis infection. F. tularensis is a Gram-negative coccobacillus with high infectivity rate via pulmonary exposure. 16 Previously, our laboratory has shown mast cells and macrophages migrate to the lungs following intranasal F. tularensis challenge. 17 Macrophages have been shown to be highly permissive to the infection, and escape lysosomal acidification and killing.18–20 In contrast, mast cells are resistant to F. tularensis and promote intra-macrophage killing of the pathogen via secreted IL-4, 19 and up-regulation of macrophage ATP production with resultant phago-lysosomal acidification. 19 To date, our studies have shown that mast cell-secreted products enhance macrophage bacterial killing. However, an improved understanding of mast cell–macrophage cellular interaction may provide additional insight into the influence of mast cells on innate immunity and host defense.
In this report, we show that mast cells co-cultured with macrophages alter protein expression of both cell types, and that mast cells transfer FcɛRI-encompassed cellular regions directly to macrophages. Furthermore, mast cells up-regulate FcɛRI and OX40L surface expression, and actively interrogate the macrophage periphery during F. tularensis infection, as revealed by live imaging analysis. Additionally, mast cell activation of macrophages promotes increased caspase-1 expression. Collectively, these results suggest that direct contact of mast cells with macrophages plays a significant role in cellular communication and innate antibacterial immunity.
Material and methods
Generation of primary cells and infection
Mast cells and macrophages were generated from C57BL/6 bone marrow as previously described. 17 Cells were tested for purity using FcɛRI (clone: Mar-1) and cKit (clone: 2B8) for mast cells, and CD11b for macrophages. On the day of assay, cells were collected, counted and plated in 24-well plates for a 4-h rest period in the absence of cytokines. The cells were infected for 2 h with F. tularensis LVS at a multiplicity of infection (MOI) of 100, treated with gentamicin, washed, and incubated at 37℃.
Flow cytometry
For evaluation of co-cultures, cells were infected and collected at 24 h post-LVS inoculation, and washed with cold PBS containing 1% (v/v) FBS. Samples were blocked with CD16/32 or 10% rat serum at 4℃, washed and surfaced stained on ice for 30 min, washed a second time, fixed with Cytofix for 20 min at room temperature and subsequently washed to remove excess Cytofix reagent. Cells were then labeled with fluorescent Abs, including cKit Alexa 488, FcɛRI PE, OX40L PE, CD11b PE and MHCII allophycocyanin (clone M5/114; BD Biosciences, San Jose, CA, USA), or isotype control and subjected to flow cytometry (FACSCalibur; BD Biosciences) analyses as previously reported. 19 For comparison of surface caspase-1 and FcɛRI between cell populations, mast cells and macrophages were blocked with CD16/32, incubated with a goat polyclonal anti-cleaved mouse caspase-1 (P10, portion of the active tetramer p20/p10) Ab (m315; Santa Cruz Biotechnology, Santa Cruz, CA, USA) at 4℃ for 1 h and followed by reaction with Alexa 488-conjugated donkey anti-goat Ab (Abcam, Cambridge, UK) plus allophycocyanin-conjugated hamster anti-mouse FcɛRI Ab (MAR-1; eBioscience, San Diego, CA, USA) at 4℃ for 30 min. Cells were then subjected to flow cytometry and geometric mean of fluorescent intensity (GeoMFI) for caspase-1 and FcɛRI was determined using FlowJo software (Tree Star, Ashland, OR, USA).
Microscopy
For confocal microscopy, cells were plated on coverslips and stained as described above. Following fixation, the cells were washed with 1× PermWash and incubated overnight with anti-caspase-1 in 1 × PermWash, washed three times, and stained with secondary Ab (donkey anti-goat Alexa488) for 1 h and washed. DAPI was added for nuclear staining. Images were acquired with a Zeiss 710 meta (Carl Zeiss, Jena, Germany) confocal microscope. Lasers and settings for fluorophore detection included 405 for DAPI (BP 420–480), 488 for Alexa Fluor® 488 (BP 505–530) and 633 for allophycocyanin (LP 650). Images were analyzed with Imaris software. Samples stained with goat polyclonal anti-glucose transporter 1 (sc-1605; Santa Cruz Biotechnology) plus secondary Ab (Alexa 488) or secondary Ab alone were used for an imaging control, which exhibited minimal fluorescent stain. For scanning electron microscopy imaging, cells were fixed in 1% glutaraldehyde, post-fixed with 1% osmium followed by an ethanol series treatment, critical point drying and sputter coating with gold, and imaging with ultra-high resolution field.
Live imaging
For live imaging, mast cells and macrophages were plated, treated with an acidification probe (LysoTracker Red DND-99; Invitrogen, Carlsbad, CA, USA) and imaged with the personal DeltaVision fluorescent deconvolution microscope with a 60× objective.
Results
Mast cells actively sample the periphery of macrophages
Previously, we have shown that mast cells co-cultured with macrophages significantly improve macrophage killing of F. tularensis, and cell survival via secreted IL-4.17,19 To further examine intercellular interaction(s), we utilized live cell imaging during a 24-h period of F. tularensis infection. As shown by mast cell–macrophage imaging (Figure 1), mast cells were highly motile with cells expressing red acidified regions clustered in the direction of movement (Figure 1a, yellow arrow). The mast cells periodically interrogated the macrophage perimeter extending projections directed toward the macrophages (Figure 1a yellow arrows; Figure 1b; and Supplementary movie). Macrophages exhibited slower but progressive extensions. Co-cultures examined further by scanning electron microscopy (SEM) showed dendritic-like progressions from macrophages extending to mast cells, and mast cell extensions connecting with macrophages. Macrophages were identified by the larger ruffled regions (Figure 1c, d, thick white arrows) compared with the fine mast cell ruffled regions (Figure 1c, d, small, thin white arrow). The close proximity of the cell membrane extensions (Figure 1c, white arrow heads) from mast cells and macrophages suggests that the contact may promote direct cellular communication and activation.
Mast cells (MC) actively sample the periphery of macrophages. Co-cultures were infected with LVS (MOI = 100) and subjected to live imaging or SEM. (a) Two representative live imaging frames (Delta Vision fluorescent microscopy; see Supplementary movie clip for whole frames) of MC–macrophage (Mac) interactions with acidification probe (red; yellow arrow in the right panel). (b) Representative live imaging frames of MC–Mac interactions (red circle) with MC movement and projections (yellow arrow) toward Mac. (c). SEM of co-cultures showing mast cell extensions (white arrow head) projecting to Mac, and Mac with dendrite-like projections (white arrow head) extending to MCs; (3500×); (d) Mac shown with large ruffles (thick white arrow), and MC shown with fine ruffles (thin white arrow).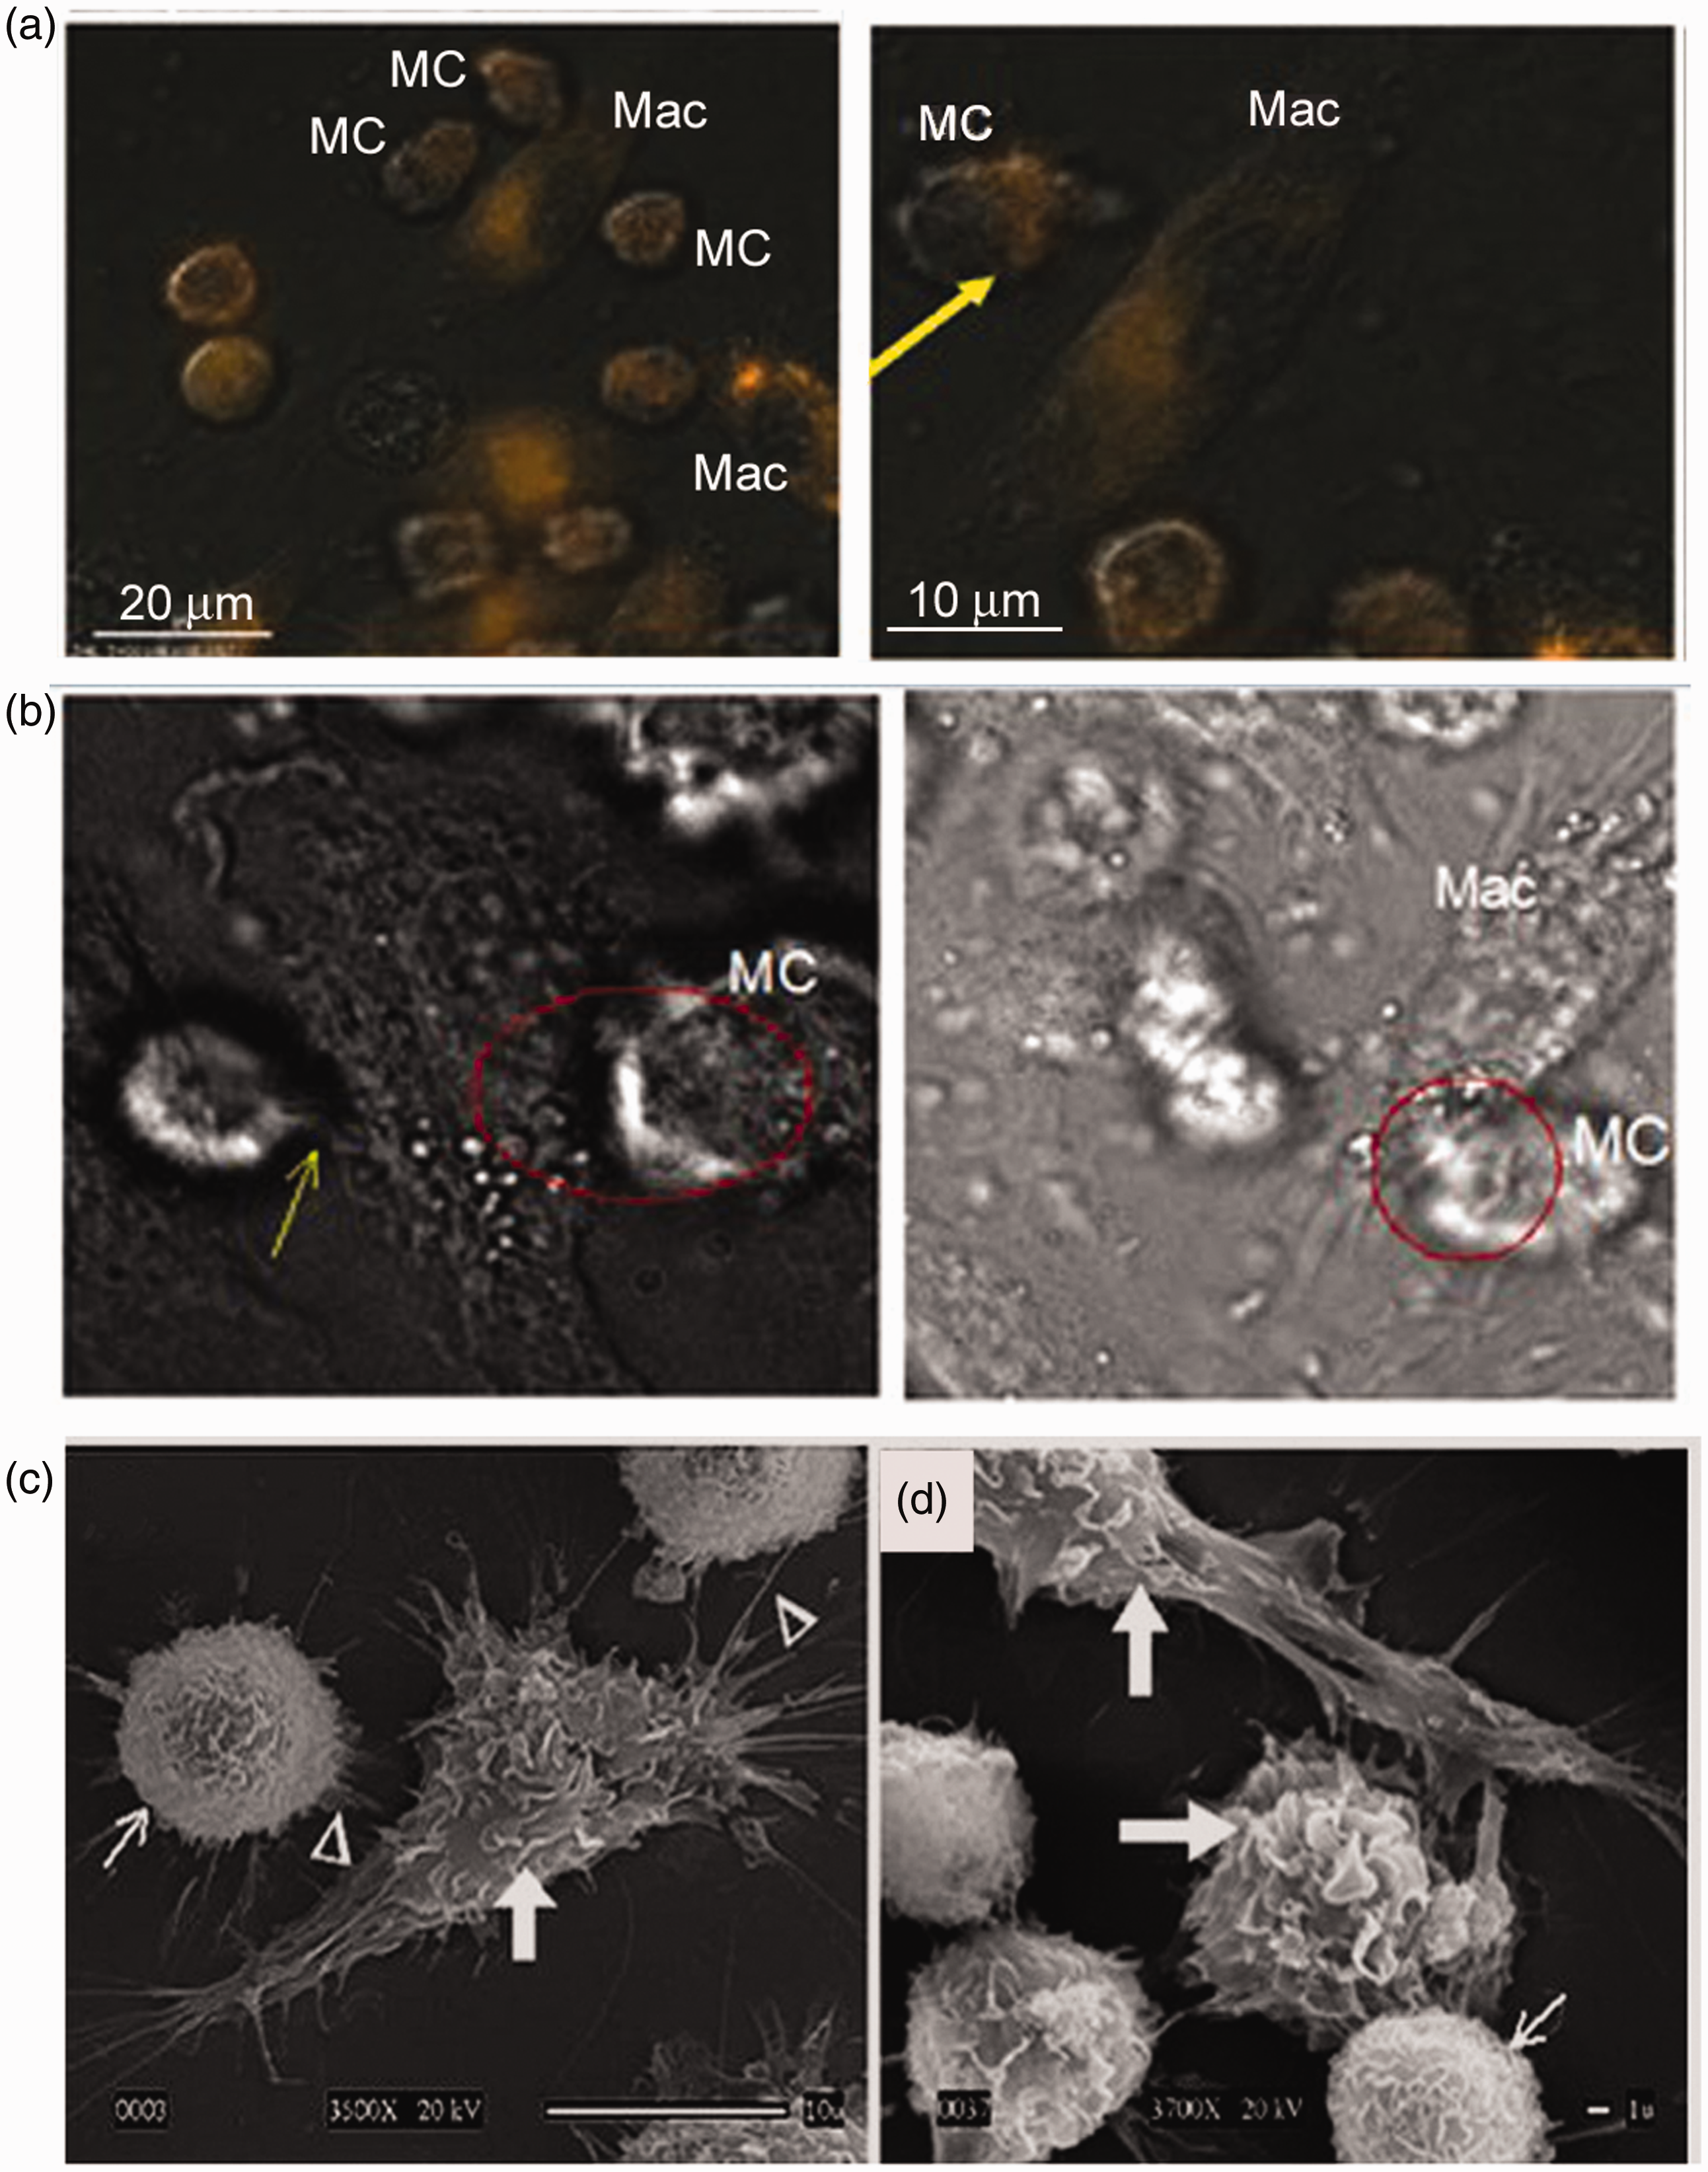
Mast cell and macrophage interactions alter surface protein expression
Flow cytometry was used to examine cellular activation. Control (mock-infected) and LVS infected cells were collected at 24 h post-infection. Mast cells were analyzed within the cKit gate, while macrophages were analyzed within the CD11b gate (Figure 2a, scatter plots). As shown in Figure 2 (b, c), mast cells from mock (uninfected) wells exhibited overall low expression of FcɛRI, cKit, OX40L and MHCII, with approximately 1% of the cells expressing FcɛRIhi, cKithi, OX40Lhi and MHCIIhi. In contrast, infected cultures showed mast cells with >60% expression of FcɛRIhi, and cKithi, and >85% expression of OX40Lhi and MHCIIhi. Macrophages (Figure 2d) exhibited low expression of MHCII in control (mock-infected) cultures (<0.5%); increased expression (6%) upon infection; and a shift to moderate (approximately 22%) MHCIIhi expression in infected co-cultures. Spent supernatants obtained from infected macrophage cultures enhanced mast cell MHCIIhi expression to approximately 41% (Figure 2c), whereas, spent supernatant from infected mast cells enhanced macrophage expression from <0.5% to 3% MHCIIhi (Figure 2d). These findings further support that mast cell–macrophage interaction during F. tularensis infection augments cellular activation of both cell types.
Mast cell and macrophage (Mac) interactions alter surface protein expression upon LVS infection. The difference in expression of selected markers on mast cell and Mac surface was analyzed by flow cytometry from single cell type or co-culture at 24 h without (PBS mock) or with LVS infection (100 MOI). (a) CD11b and cKit gates were used to define Mac and mast cell populations, respectively, for surface marker analyses; (b) evaluation of mast cells within c-Kit gate for FcɛRI, c-Kit and OX40L expression; evaluation of (c) mast cells and (d) Macs for MHCII surface expression: (c) mast cell alone, co-cultured mast cells and mast cells stimulated with macrophage spent supernatant, (d) Mac alone, co-cultured Macs and Mac stimulated with mast cell spent supernatant.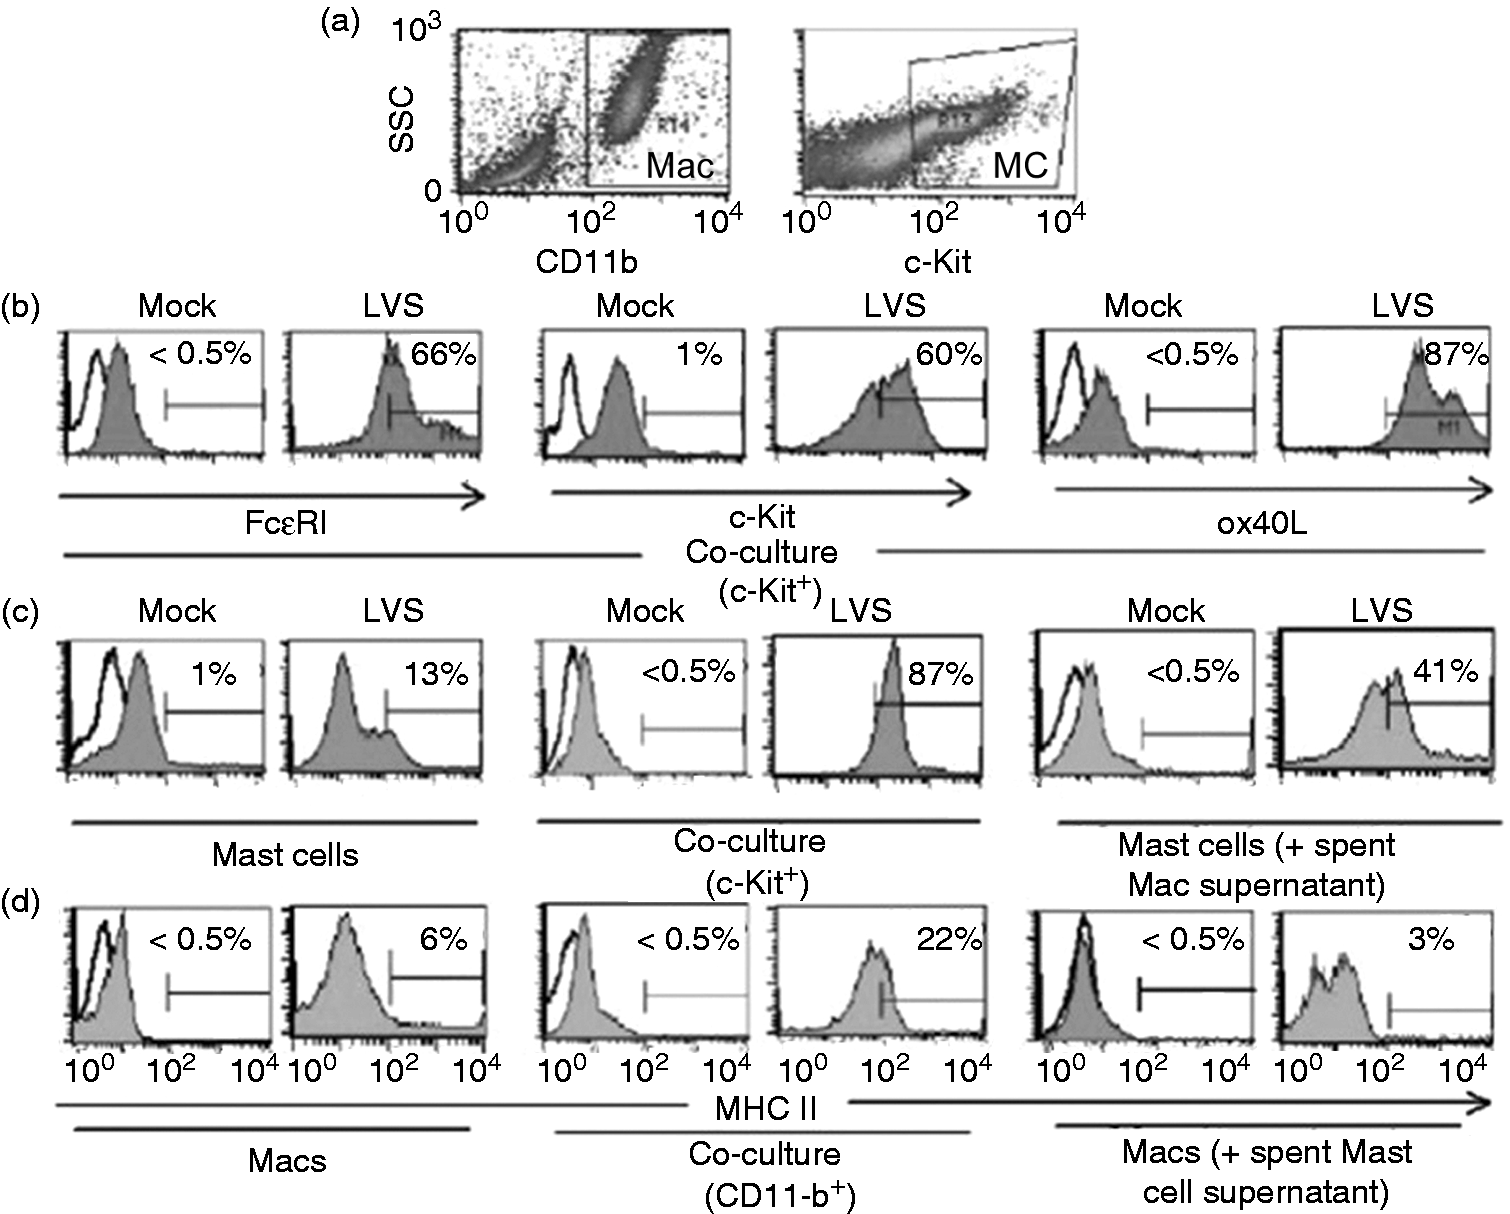
Transfer of FcɛRI-encompassed cellular products from mast cells to macrophages
F. tularensis has been shown to actively suppress host immune response,
21
including inhibition of the acute pro-inflammatory cytokine IL-1β, one of the key cytokines initiating innate defense against this highly virulent bacterium.
22
Dotson et al.
23
demonstrated that LVS infection in macrophages suppressed TLR-2-dependent inflammasome activation, which is essential for caspase-1 activation, and the subsequent cleavage and secretion of active IL-1β. Furthermore, utilizing gene knockout mice and their derived macrophages, Mariathasan et al.
24
revealed the critical role of caspase-1 in host innate defense against F. tularensis infection. Recently, we observed a significant increase of caspase-1 level in mast cells infected with Chlamydia pneumoniae, which is also an intracellular bacterium.
25
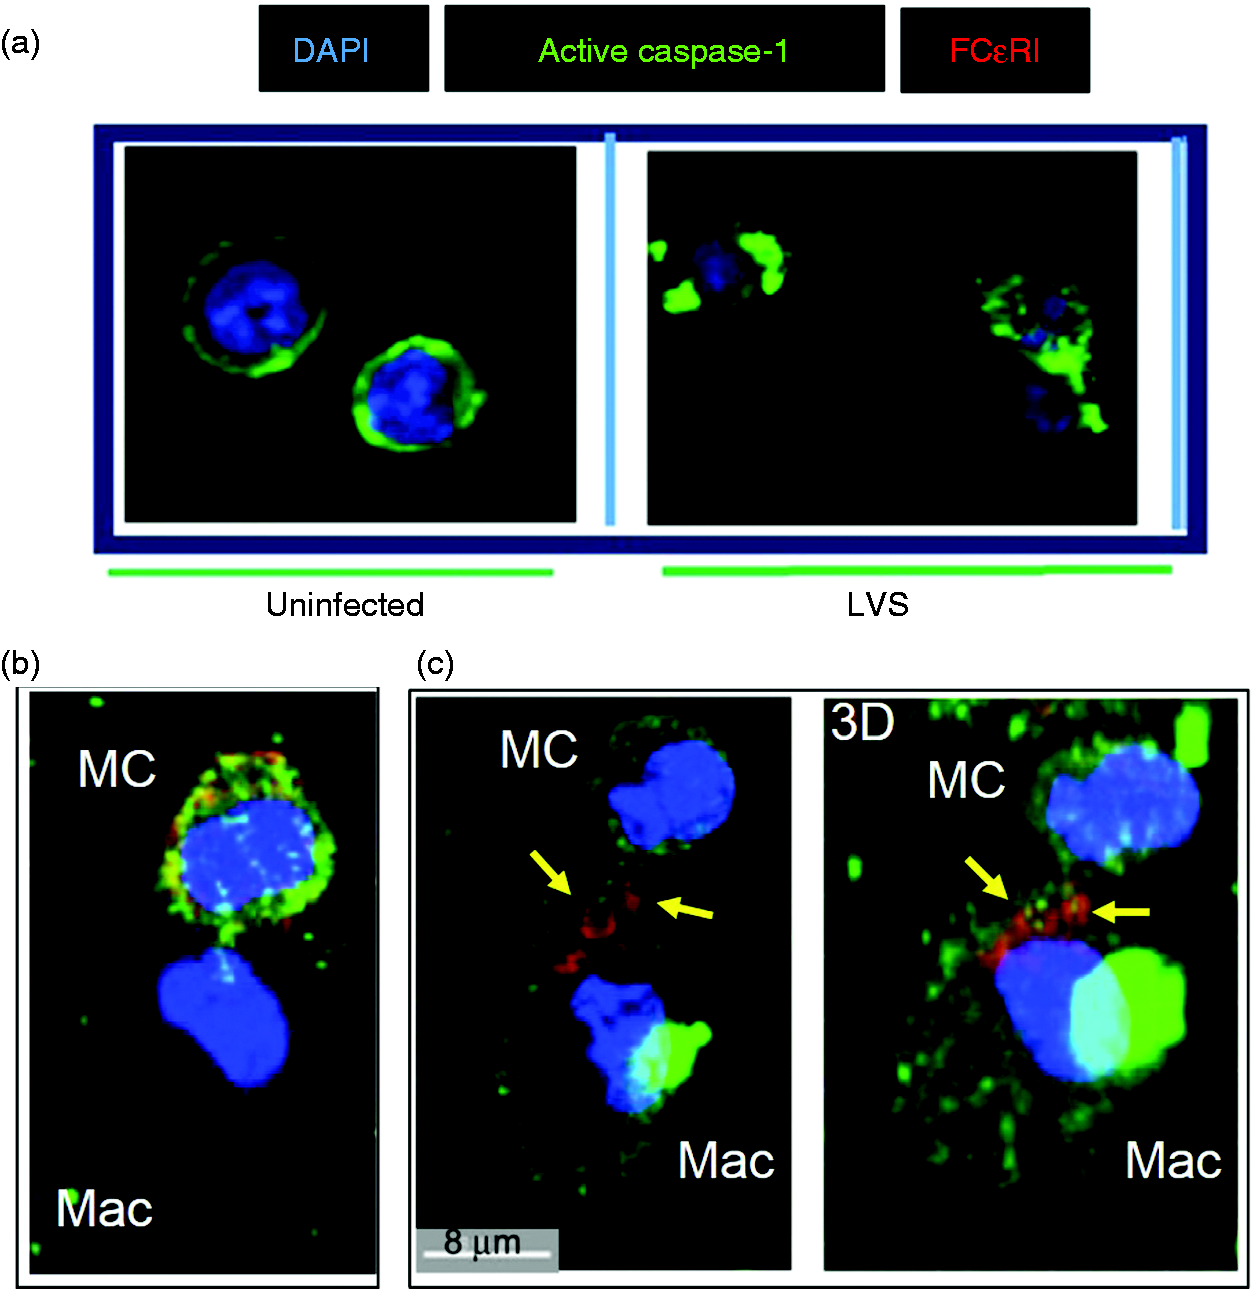
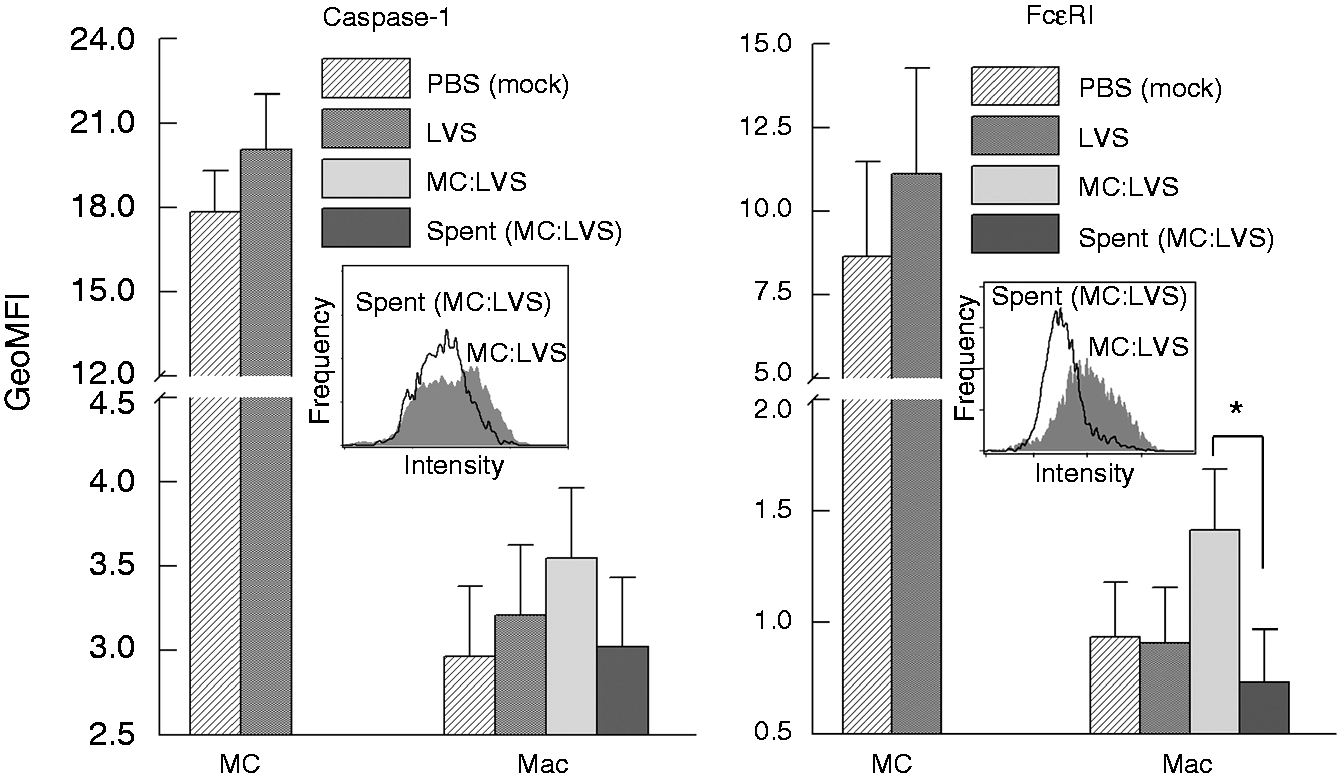
Collectively, these data prompted our investigation of whether LVS infection enhanced caspase-1 activation in mast cells, and subsequent transfer to macrophages by cell–cell contact to control LVS replication. Decrease of LVS growth in the mast cell–macrophage co-culture has been well documented.17,19,26,27 First, mast cells and macrophages were separately infected with LVS for 12 h (a time point previously shown to have significant presence of active capase-123,28), and caspase-1 expression visualized by confocal microscopy. While mast cells exhibited increased levels of caspase-1 throughout cells (Figure 3a), macrophages expressed minimal caspase-1 (Figure 3b). We then assessed caspase-1 expression in cell co-culture, and observed that most macrophages (CD11b+ cells; Figure 3c, d) co-cultured with mast cells during F. tularensis infection exhibited enhanced expression of caspase-1 (green fluorescence in Figure 3d). Mast cell–macrophage interaction and contact are illustrated inside the yellow circle and white square of Figure 3. High caspase-1 expression was evident in both macrophage [Figure 3d: the upper cell in the circle and the lower cell in the square, corresponding with CD11b expression (red fluorescence) shown in Figure 3c] and mast cells. As intercellular interactions were observed in Figure 1 and the Supplementary movie clip, we further investigated the possible direct transfer of casapase-1 from mast cells to macrophages. The peripherally distributed caspase-1 on mast cells (Figure 4a, left panel) started to cluster upon LVS infection (Figure 4a, right panel) and localized in close proximity to FcɛRI-positive regions (Figure 4b). Moreover, following intercellular contacts, the FcɛRI-encompassed regions (Figure 4c, yellow arrows in left two-dimension and right three-dimension panels) were transited from mast cells to macrophages. Although we cannot rule out other mechanisms that may participate in the activation of caspase-1 in these co-cultures, the data presented here suggest that caspase-1 can be transferred from mast cells to macrophages via transit of FcɛRI-encompassed membrane. We further compared the difference in overall cell surface localized FcɛRI and caspase-1 between LVS infected and uninfected cells by flow cytometry. As shown in Figure 5, an increase of FcɛRI and caspase-1 was observed in mast cells after 12 h LVS infection. This increased caspase-1 expression in the LVS infected mast cells is consistent with the confocal imaging analysis (Figures 3a, 4a). Furthermore, uninfected macrophages in contact (1 h) with LVS-infected mast cells exhibited overall higher levels of surface FcɛRI (P < 0.05) and caspase-1 (although not significant at the 95% confidence level) staining than those incubated with infected mast cell spent supernatants (Figure 5), suggesting both immune molecules may be transferred from mast cells as shown in Figure 4c.
Mast cells promote macrophage (Mac) caspase-1 expression. Expression of caspase-1 in mast cells and Macs was analyzed by confocal microscopy at 12 h post-LVS infection. (a) Mast cell culture alone, (b) Mac culture alone, (c) co-cultures labeled with anti-CD11b Ab (red, Mac) and DAPI (blue, nuclear stain) and image merged with caspase-1 (green) expression (d). Mast cell–Mac contacts are indicated within the yellow circle and white square. Transfer of FcɛRI-encompassed cellular products from mast cells (MC) to macrophages (Mac). (a) Uninfected MC showed active caspase-1 at the cell periphery, and LVS-infected MC (MOI = 100) exhibited cellular redistribution of active caspase-1 to clustered regions. (b) Active caspase-1 was co-localized with FcɛRI in LVS-infected MC in contact with Mac. (c) FcɛRI-encompassed vesicles (red, arrows) with active caspase-1 were transferred from MC to MAc (left panel two-dimensional image). The corresponding three-dimensional image (right panel) shows interlaced (arrows) active caspase-1 (green) and FcɛRI (red). Increase of caspase-1 and FcɛRI in macrophages (Mac) co-cultured with LVS-infected mast cells. Mast cells (MC) and Mac were cultured alone and infected with LVS (MOI = 100) or mock treated with PBS for 12 h. Additionally, uninfected macrophages were incubated with the LVS-infected MC or spent supernatants for 1 h, and washed to remove MC (non-adherent). Cells were collected for assessing the presence of surface caspase-1 and FcɛRI by flow analysis. GeoMFI of each cell population was calculated for protein expression comparison. Inserts are representative histogram overlays showing differences in protein expression intensity between samples. *P < 0.05, one-way ANOVA.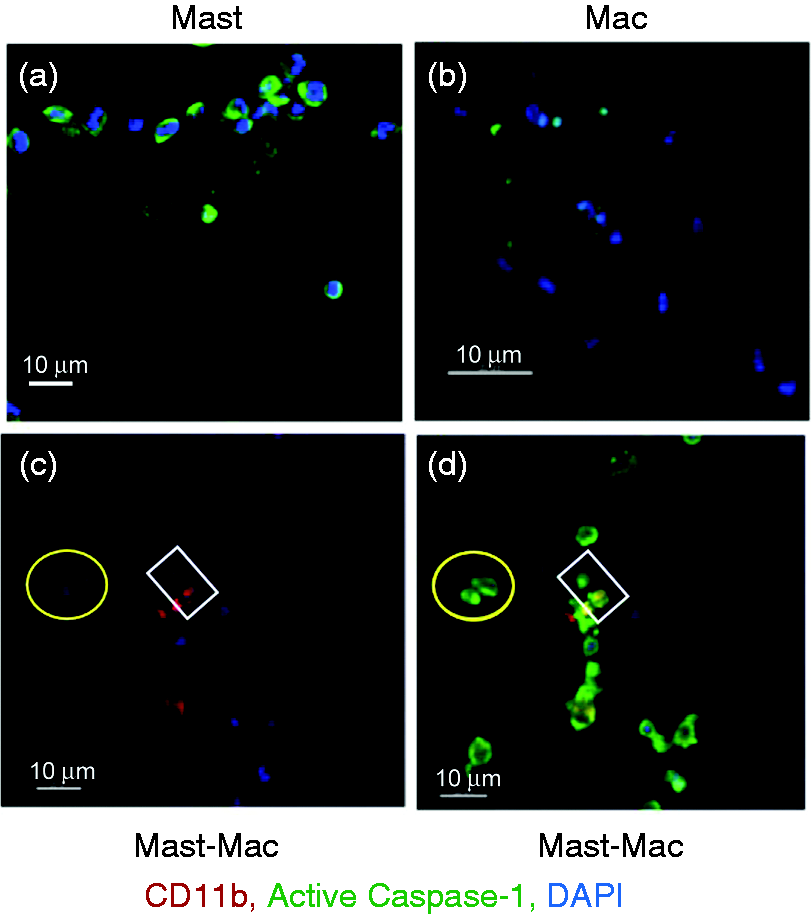
Discussion
Mast cell control of bacterial infection is now recognized as an important innate immune defense mechanism.27,29–32 Using a bone marrow-derived co-culture system, we have previously shown that mast cell IL-4 production induces macrophage bacterial killing via increased ATP expression and phagosomal acidification. 19 In this regard, lysosomes have been shown to traffic along microtubules, and their cellular distribution regulated by the acidic environment.33,34 This is particularly relevant as mast cell proteins cKit, LAMP and MHCII are clustered along the cell periphery within acidified regions during F. tularensis infection.
In this study, we have further shown that mast cell activity and activation status are altered during interaction with macrophages upon F. tularensis infection. Flow cytometry analyses revealed that FcɛRI, cKit, MHCII, and OX40L expression are up-regulated upon LVS infection and co-culture with macrophages. While spent supernatant from infected macrophages increased mast cell MHCII expression (from < 0.5% to 41%), co-culture and direct contact resulted in the highest (87%) MHCII expression by mast cells. In contrast, macrophage MHCIIhigh expression was 6% during LVS infection vs. 3% with mast cell spent supernatant. We have previously shown that mast cells influence intra-macrophage LVS replication by both contact-dependent and contact-independent mechanisms such as the secretion of IL-4. The lack of enhancement of MHCII expression in macrophages by mast cell spent supernatants could be owing to a number of factors, including short half-life of mediators. However, macrophage surface MHCII expression in direct co-culture with mast cells was the highest observed (22%).
Rapid transfer of membranes and membrane-associated proteins are quite common between immune cells. 35 For example, T cells actively capture membrane-associated Ags from antigen presenting cells.36,37 Hudrisier and Joly 38 have referred to this ‘nibble’ of membrane patches by T cells as ‘trogocytosis’. However, trogocytosis has since been used in a more general manner to describe the transfer of plasma membrane fragments and their containing molecules between one donor and one acceptor/acquirer cell. Several trogocytosis mechanisms have been proposed, for example proteins are transported through small membrane bridges across immune synapses, membrane nanotubes or enclosed membrane vesicles. 35 Here we report the first form of trogocytosis between mast cells and macrophages. To this end, using live cell imaging, mast cells are shown to continually sample macrophages upon F. tularensis infection. This is particularly evident at the periphery of mast cells: FcɛRI localized with caspase-1 and FcɛRI-encompassed vesicles transferred from mast cells to macrophages. The translocation and localization is especially relevant to further understand the activity and function of caspase-1 and inflammation. While additional evaluation is needed to determine the specific targets of active-caspase-1 in mast cell–macrophage co-cultures, active caspase-1 targets multiple proteins promoting unconventional protein secretion independent of the ER Golgi pathway. 39 Proteins that have been identified as caspase-1 targets include exocytosis and membrane protein mobility molecules such as synaptotagmin and annexins. 39 Most importantly, active caspase-1 is essential for inflammasome-mediated IL-1β secretion 40 required for innate immune response to bacterial infection, including F. tularensis. However, direct intercellular transfer via FcɛRI-encompassed vesicles has not been described and may be a novel means of intercellular communication between the mast cell and other immune cells. Interestingly, Hammad et al. 41 reported that a population of FcɛRI+ DC were recruited to mediastinal lymph nodes of mice sensitized intranasally with house dust mite extracts. These FcɛRI+ DC stimulated strong Ag-specific T-cell proliferation comparable with conventional FcɛRI- DC, but induced a more robust Th2 cytokine (IL-10 and IL-13) production. Whether transfer of mast cell FcɛRI to other antigen presenting cells via trogocytosis plays a role in fine-tune/shaping immune responses against pathogens and allergens remains to be elucidated. Considering the influx of mast cells and macrophages early during pulmonary infection, the findings described here reveal cross-communication and transfer of proteins and cellular constituents which influence anti-bacterial innate immune responses.
Footnotes
Acknowledgements
We thank Dr. Chiung-Yu Hung and Mr. Richard P. Doelger for assistance with flow cytometry experiments.
Declaration of Conflicting Interests
The authors declared no potential conflicts of interest with respect to the research, authorship, and/or publication of this article.
Funding
The author(s) disclosed receipt of the following financial support for the research, authorship, and/or publication of this article: This work was supported by funding from the UTSA Center for Excellence in Infection Genomics training grant (DOD #W911NF-11-1-0136 for BPA); and support from the Immune Defense Core, the Computational System Biology Core, and the Biophotonics Core, National Institute on Minority Health and Health Disparities (G12MD007591) from the National Institutes of Health. Partial support of this study was from the Jane and Roland Blumberg Professorship in Biology for BPA.