
Abstract
Macrophages (Mφs) play a critical role in the defense against pathogens, orchestrating the inflammatory response during injury and maintaining tissue homeostasis. During these processes, macrophages encounter a variety of environmental conditions that are likely to change their gene expression pattern, which modulates their function. In this study, we found that murine Mφs displayed two different subpopulations characterized by differences in morphologies, expression of surface markers and phagocytic capacity under non-stimulated conditions. These two subpopulations could be recapitulated by changes in the culture conditions. Thus, Mφs grown in suspension in the presence of serum were highly phagocytic, whereas subtraction of serum resulted in rapid attachment and reduced phagocytic activity. The difference in phagocytosis between these subpopulations was correlated with the expression levels of FcγR. These two cell subpopulations also differed in their responses to LPS and the expression of surface markers, including CD14, CD86, scavenger receptor A1, TLR4 and low-density lipoprotein receptor. Moreover, we found that the lipid/cholesterol content in the culture medium mediated the differences between these two cell subpopulations. Thus, we described a mechanism that modulates Mφ function depending on the exposure to lipids within their surrounding microenvironment.
Introduction
Macrophages (Mφs) play a key role in immunity as APCs, modulating the inflammatory response after injury and infection, eliminating pathogens, clearing cellular debris after necrosis and up-taking apoptotic cells. Moreover, Mφs also participate in tissue remodeling during wound healing. 1 All of these functions are critical to maintain tissue and systemic homeostasis. Mφ surface receptors are critical for their function. Thus, Mφs recognize and clear foreign particles via specific surface molecules, such as Fc receptors,2–4 and pathogen components by pattern recognition receptors (PRR), such as the Toll-like receptors (TLR). 5 Mφs populate various organs displaying specific characteristics, such as Kupffer cells in the liver and alveolar Mφs in the lung. These tissue-resident Mφs act as sentinels of the immune system and strive to maintain homeostasis in their respective organs. For example, Kupffer cells in the liver uptake toxins and pathogens; alveolar Mφs in the lung clear dust, allergens and various microorganisms; and osteoclasts in the bone participate in bone resorption. 6 Even within a specific tissue population, Mφs display a large range of plasticity displayed as their ability to functionally change during various pathogenic conditions, which is often referred to as polarization. 7 Two initial polarization stages have been described, including classically activated (M1) and alternatively activated (M2) Mφs. These two Mφ stages have been defined based on their response to specific exogenous ligands. Thus, M1 Mφs are developed in response to LPS and IFN-γ, while M2 Mφs are established in the presence of IL-4 and IL-13. 8 M1 and M2 Mφs have been found to elicit pro- or anti-inflammatory phenotypes, respectively. M1 Mφs act more as scavenging cells while M2 Mφs take part in injury resolution and tissue repair,9,10 displaying a higher rate of cell debris clearance.11,12 Recently, it has been shown that M2 and M1 Mφs represent only extreme conditions of polarization, with many more states residing within a large spectrum of plasticity. For instance, tumor-associated Mφs are now thought to be a unique polarization stage aside from M1 and M2 classification. 13 Mφ plasticity is likely due to the exposure to various microenvironments, which has been found to be reversible. 14 Moreover, the tissue environment plays a role in defining functionally different subpopulations of Mφs within the same organ. For example, the release of retinoic acid from the tissue environment resulted in the establishment of functionally different subpopulations of Mφs from an apparently homogeneous initial population. 15 These changes in Mφ subpopulations occurred at the transcriptome level, which is modulated by enhancers and secondary transcription factors. 16
Mφ plasticity is particularly important in the defense against invading pathogens.17,18 Thus, bacterial infections such as those seen in sepsis resulted in the polarization of Mφs towards a pro-inflammatory state, which can eventually lead to tissue damage and organ failure if Mφs do not revert to a non-inflammatory condition.19,20 The understanding of the mechanism that modulates the changes in Mφ function during pathological conditions may lead to crucial strategies for the prevention of sepsis, injury, and other inflammatory diseases. In the present study, we showed that murine Mφs present two functionally different subpopulations during growth in culture conditions in the presence of FBS. These two subpopulations could be experimentally recapitulated by changes in the lipid/cholesterol content of the environment.
Materials and methods
Cell culture
J774A.1 cells (J774) from reticulum sarcoma of BALB/cN mice (ATCC, Manassas, VA, USA) were cultured in RPMI 1640 medium with
Bone marrow-derived Mφs
Bone marrow (BM) cells were isolated from femur and tibia of male CD-1 mice (6–8 wk old). After removing tissue/muscle, BM was flushed out with cold PBS supplemented with 2% heat-inactivated FBS using a 22-gauge needle. Single-cell suspensions were obtained after passing through a 22-gauge needle 4–6 times to dissociate cell clumps. Cells were then passed through a 70-µm cell strainer to remove residual clumps and centrifuged at 500 g for 5 min at 4℃. Cells were treated with red blood cell lysis buffer (eBioscience, San Diego, CA, USA), washed and centrifuged as described above. Isolated BM cells were re-suspended (2 × 10⁶ cells/ml) in RPMI 1640 with
Immunostaining
Mφs were seeded at 1 × 10⁵ cells/well on eight-chamber Lab-Tek II slides (Nunc, Roskilde, Denmark) for 2 h at 37℃, 5% CO2 in either CM or serum-free (SF) RPMI 1640 medium. Cells were washed with FACS staining buffer (FSB, 0.5% BSA in DPBS without Ca2+ and Mg2+) and stained with 2 µg FITC-conjugated anti-FcγR (CD16/CD32) Abs (eBioscience, San Diego, CA, USA) for 1 h at 4℃. Cells were then washed with FSB, fixed for 20 min with 4% paraformaldehyde followed by another wash with FSB and mounted with vectashield (Vector Laboratories, Burlingame, CA, USA) containing DAPI. Slides were analyzed using a Nikon Eclipse TE300 fluorescent microscope equipped with Axio Cam HRm (Zeiss, Jena, Germany). For phase contrast microscopy analysis, Mφs were seeded (5 x 10⁴) on TC-treated 96-well plates for 16 h at 37℃, 5% CO2 and visualized as previously described.
Measurement of mRNA levels using quantitative RT-PCR
RNA isolation was performed with TRIzol Reagent (Life Technologies, Grand Island, NY, USA) according to manufacturer instructions, followed by DNase treatment (DNase Treatment and Removal Kit; Life Technologies) and reverse transcription to cDNA (High Capacity cDNA Reverse Transcription Kit; Life Technologies). Quantitative RT-PCR (qRT-PCR) was performed using the standard curve method and Sybr Green chemistry (Qiagen, Valencia, CA, USA), and mRNA quantification was normalized using GAPDH as a housekeeping gene. Pre-validated primer sets were obtained from Qiagen and included TNF-α (QT00104006), IL-10 (QT00106169), IL-6 (QT00098875) and IFN-β (QT00249662).
Flow cytometry analysis
Flow cytometry was performed using a FACSCanto II flow cytometer with FACSDiva software (BD Biosciences, San Jose, CA, USA). Data were analyzed using FlowJo software v. 7.6.4 (Tree Star, Ashland, OR, USA). Mφs (5 × 10⁵ cells/tube) were fixed and permeabilized with Cytoperm/Cytofix (BD Biosciences) for 20 min at 4℃. Cells were then blocked for 15 min with 20% goat serum with or without 0.5 µg FcγR blocking Abs (Fc block; BD Biosciences) followed by primary Ab staining for 30 min in the dark at 4℃. Primary Abs were added at 0.5 µg/tube and included FITC-conjugated anti-CD204 (GeneTex, San Antonio, TX, USA), APC-conjugated anti-TLR4 (eBioscience), FITC-conjugated anti-CD14 (clone: Sa2-8; eBioscience), FITC-conjugated anti-FcγR (CD16/CD32; eBioscience). Low-density lipoprotein receptor (LDLr) staining was performed using 0.5 µg rabbit-anti LDLr Ab (Abcam, Cambridge, UK) followed by 0.25 µg FITC-conjugated, goat-anti-rabbit Ab (Molecular Probes, Eugene, OR, USA) for 30 min in the dark at 4℃. Surface protein marker expression was expressed as the geometric mean fluorescent intensity (MFI).
Phagocytosis analysis
The phagocytosis assay was performed by incubating Mφs (5 × 10⁵ cells) with opsonized Escherichia coli particles labeled with pHRodo (Life Technologies) at 20:1 ratio of particles to cells for 1 h at both 4℃ (negative control) and 37℃. The phagocytosis levels were expressed as the geometric MFI.
Stimulation with LPS
LPS (1 ng/ml) was pre-incubated in 50 µl RPMI 1640 medium supplemented with 10% FBS for 30 min at 37℃ to allow LPS/LPS binding protein interaction, and was added to J774 cells (5 × 10⁵ cells) grown in suspension or attached for 2 h at 37℃. Cells were then washed and lysed for total RNA preparation. Cytokine mRNA levels (TNF-α, IL-6, IL-10 and IFN-β) were measured by qRT-PCR using GAPDH mRNA levels to normalize the samples as described above.
Cell cycle analysis
Cell cycle analysis was performed by fixing Mφs (2 × 10⁶ cells) in 70% EtOH for 2 h at 4℃ followed by treatment with propidium iodide master mix [500 μl solution consisting of propidium iodide (Life Technologies), RNaseA (Sigma, St. Louis, MO, USA) and 0.1% Triton X-100 in DPBS without Ca2+ or Mg2+] for 15 min at 37℃. Samples were read by flow cytometry as listed above, and cell cycle data were analyzed using a Watson (Pragmatic) model with Flow Jo v. 7.6.4.
Liposome preparation
Phosphatidylserine (PS), phosphatidylcholine (PC) phospholipids and cholesterol in chloroform were all from Avanti (Alabaster, AL, USA). Liposomes were prepared by evaporating chloroform with nitrogen gas and re-suspending the dried lipid layer in 50 mM Tris pH 7.4 for 30 min by vortexing every 5 min. Liposomes were then extruded 15 times through 100-nm filters and centrifuged at 100,000 g for 40 min followed by re-suspension in SF RPMI before addition to Mφs.
Cell adhesion method
Suspension J774 cells were seeded at 5 × 10⁴ cells per well in non-TC-treated 96-well flat bottom plates in SF RPMI 1640 medium for 2 h with and without given treatments. Treatments included LDL, high-density lipoprotein (HDL), BSA, hemoglobin (all from Sigma), PS liposomes, PC liposomes, PC/cholesterol liposomes (1:1) and water-soluble cholesterol (Sigma). After 2 h incubation at 37℃, cells were washed once in 200 μl DPBS (without Ca2+ and Mg2+), and 0.5 mg/ml MTT solution (Sigma) was added in SF medium followed by 2 h incubation at 37℃. MTT solution was aspirated, and 100 μl DMSO was added to dissolve crystals followed by spectrophotometric analysis at 570 nm and 630 nm (background).
Statistics
Statistical analysis was performed using GraphPad Prism (San Diego, CA, USA). Significance was analyzed using two-tailed t-tests and one-way ANOVA. A P-value of < 0.05 was considered statistically significant. Each experiment was performed in triplicate and repeated at least three times.
Results
Macrophages display two distinct subpopulations under non-stimulated conditions
Two distinct morphological subpopulations were observed by phase contrast microscopy of BM-derived Mφs isolated from CD-1 mice after 5 d of culture/differentiation. One of these subpopulations appeared ‘spread’, while the second subpopulation was ‘round’ at low-density cultures (Figure 1a). Two subpopulations of different sizes were also observed on forward scattered light (FSC) analysis by flow cytometry (Figure 1b). These two subpopulations correspond to ‘smaller’ and ‘larger’ cells, which resembled the populations observed by phase contrast microscopy. These observations led us to investigate if there were phenotypic differences between these two subpopulations. The expression levels of several surface markers, including FcγR (CD16/CD32), CD14 and CD86, were elevated in the larger population of BM-derived Mφs in comparison with the smaller population (Figure 1c).
BM-derived macrophages present two morphologically different subpopulations. BM-derived Mφs 5 d after extraction from femur and tibia were grown on TC-treated plastic dishes in the presence of serum and recombinant M-CSF (10 ng/ml). (a) They were analyzed for morphological changes by phase contrast microscopy, presenting two subpopulations with different morphologies, round (white arrow) and spread (black arrow). (b) These two subpopulations were also observed by flow cytometry. (c) The expressions of FcγR, CD14, CD86, LDLr, TLR4 and SRA were determined by flow cytometry in the sub-populations. Statistical analysis was determined by two-tailed t-tests from three independent experiments, and significance was accepted as P < 0.05.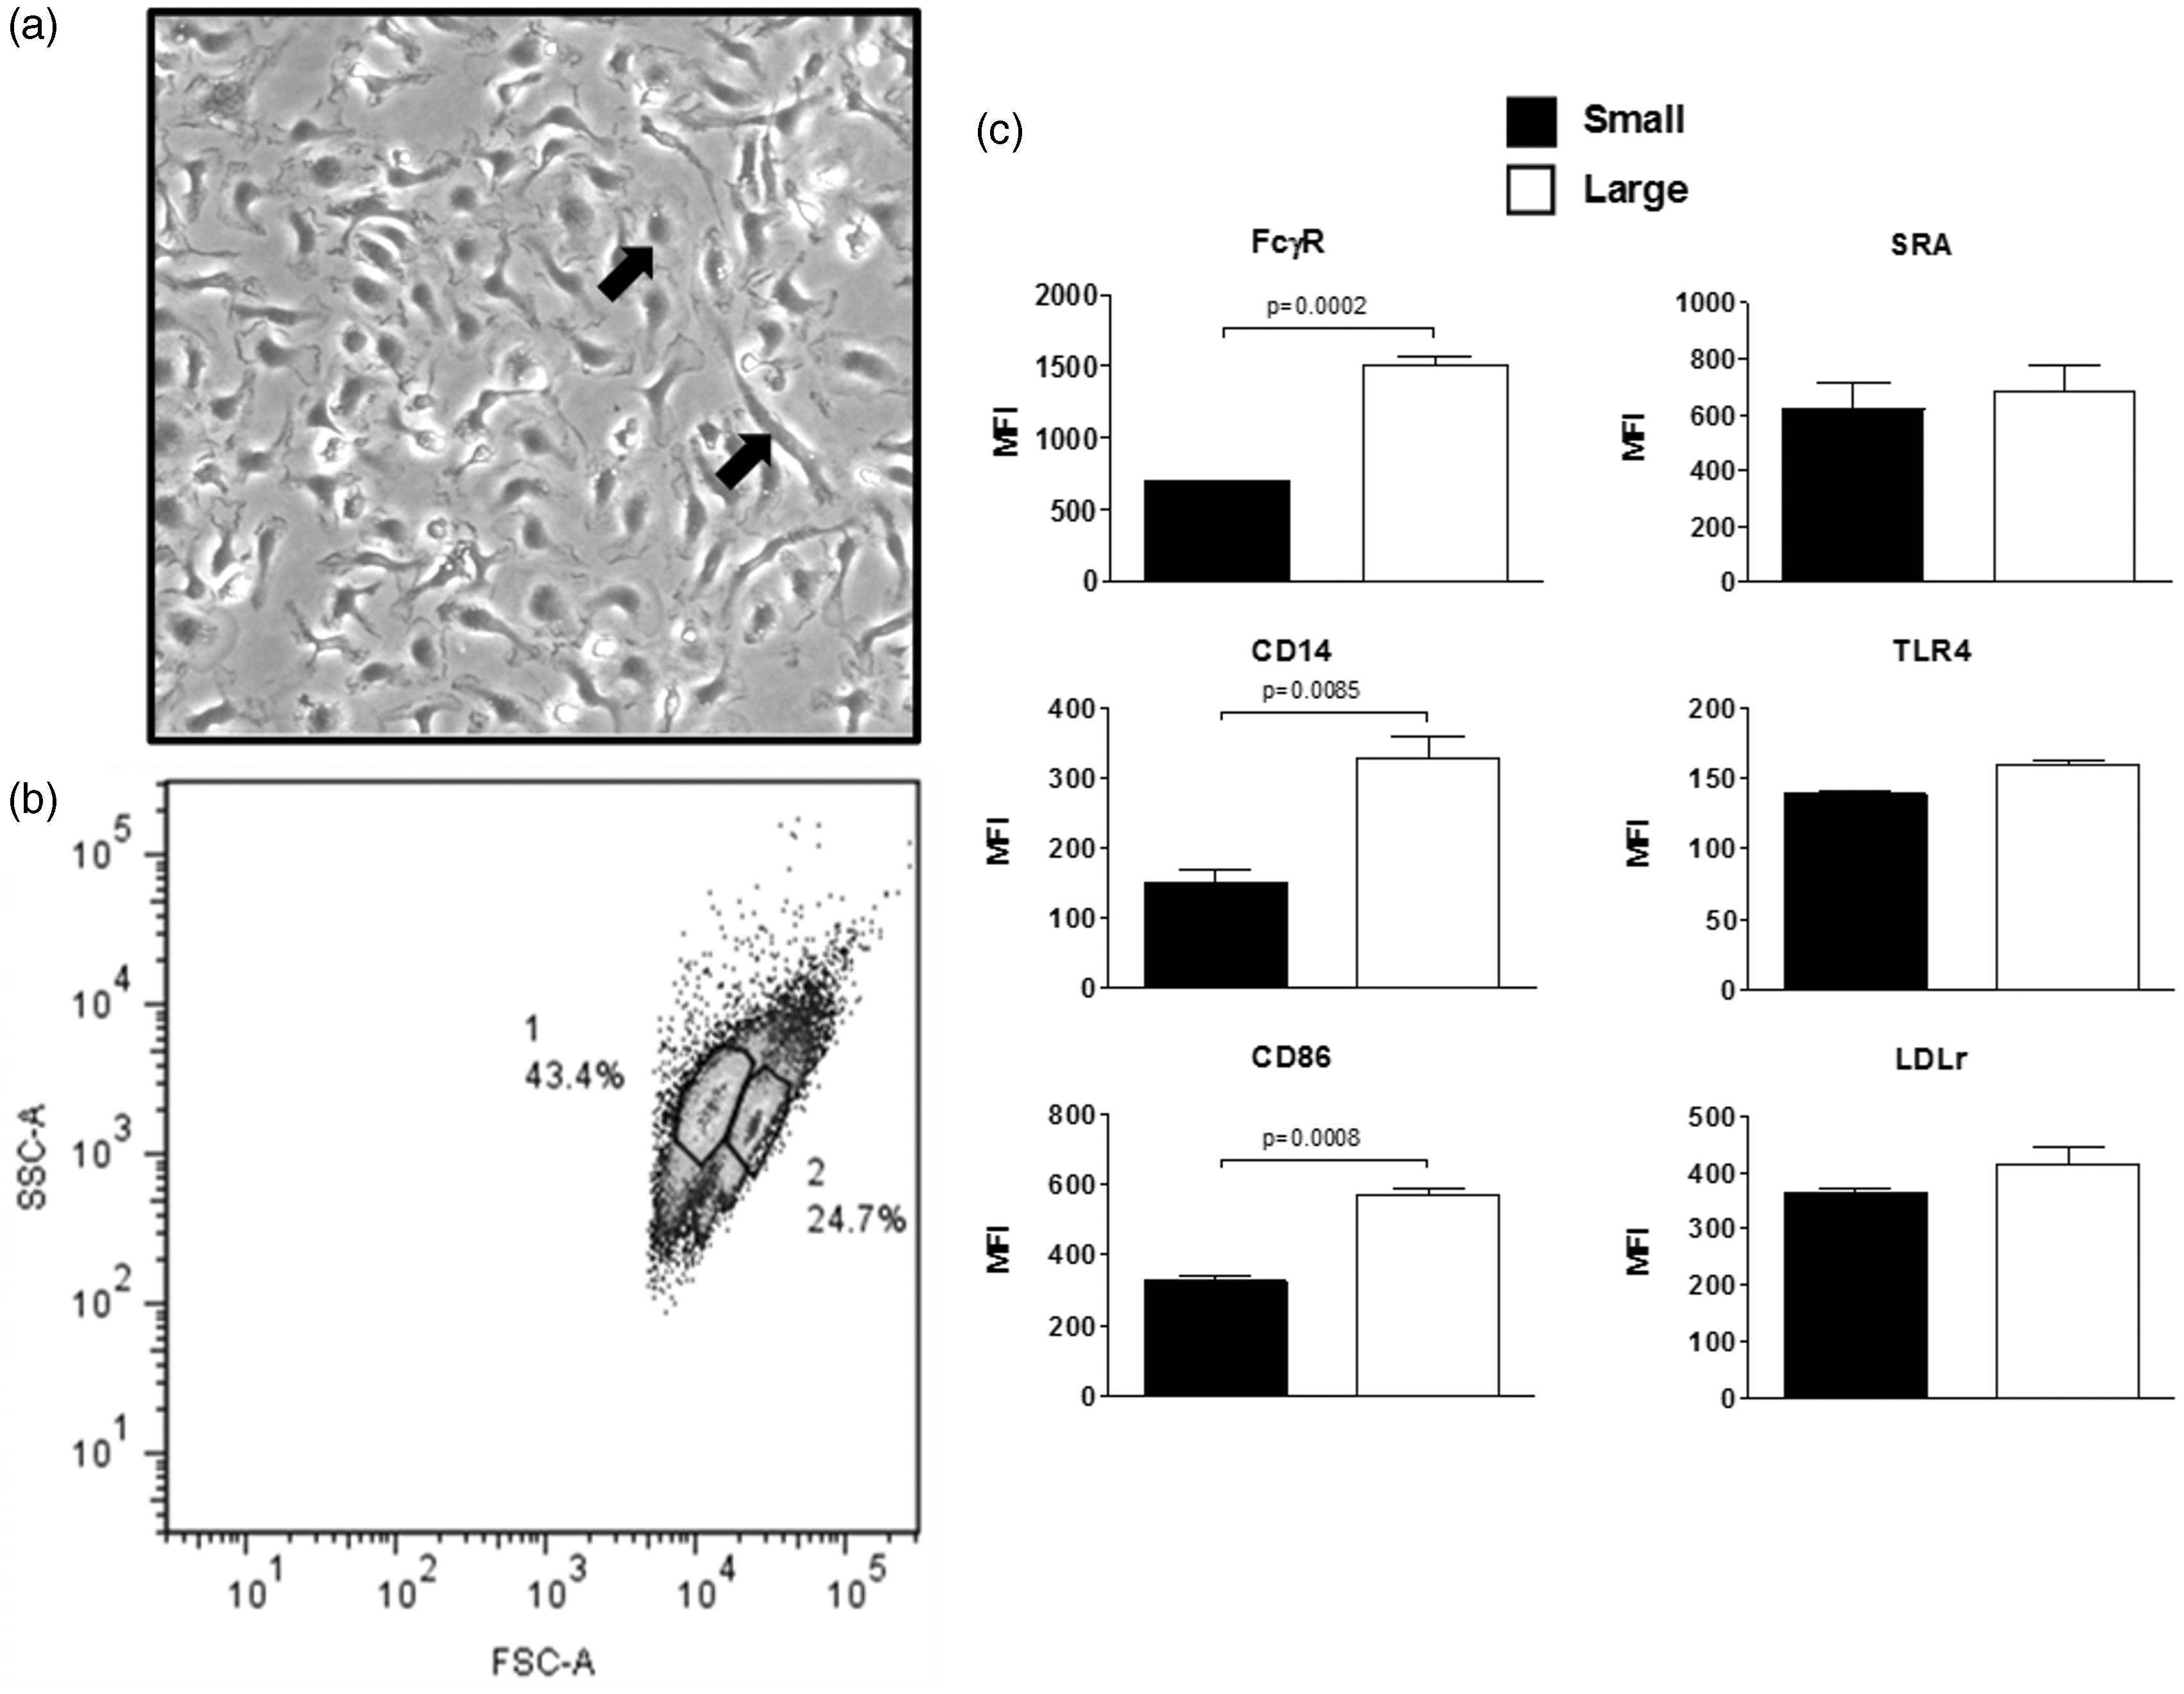
In contrast, TLR4, scavenger receptor A1 (Sra1 or Msr1) and LDLr surface levels were not different in larger and smaller BM-derived Mφs, as observed by flow cytometry (Figure 1c). Similar observations were made on J774 cells, which correspond to a murine Mφ line by phase contrast microscopy (Figure 2a) and flow cytometry (Figure 2b), resembling the small and large subpopulations observed in BM-derived Mφs. The appearance of these two subpopulations in J774 cells was not affected by the density of cells in the culture. In addition, these two subpopulations were not due to differences in the cell cycle (Figure 2c). A comparison of surface markers within the two subpopulation of J774 cells also display elevated levels of FcγR (CD16/CD32), CD14 and CD86 in the larger cell subpopulation as opposed to the smaller cells. In contrast, TLR4 was significantly higher on the smaller cells in comparison with the larger cells, as observed by flow cytometry. Other surface proteins, including Sra1 LDLr, showed no difference between the two subpopulations (Figure 2d).
Macrophages (J774 cells) in TC conditions displayed two distinct populations. (a) Mφs (J774 cells) were grown on TC-treated plastic dishes and analyzed by phase contrast microscopy, displaying two subpopulations with different morphologies, round (white arrow) and spread (black arrow) morphology. (b) Cells were then scraped and analyzed by flow cytometry, showing two subpopulations of different size (FSC). (c) Cell cycle analysis of the two subpopulations was detected by PI staining and flow cytometry. (d) The expressions of FcγR, CD14, CD86, LDLr, TLR4 and SRA were determined by flow cytometry in the subpopulations. Statistical analysis was determined by two-tailed t-tests from three independent experiments, and significance was accepted as P < 0.05.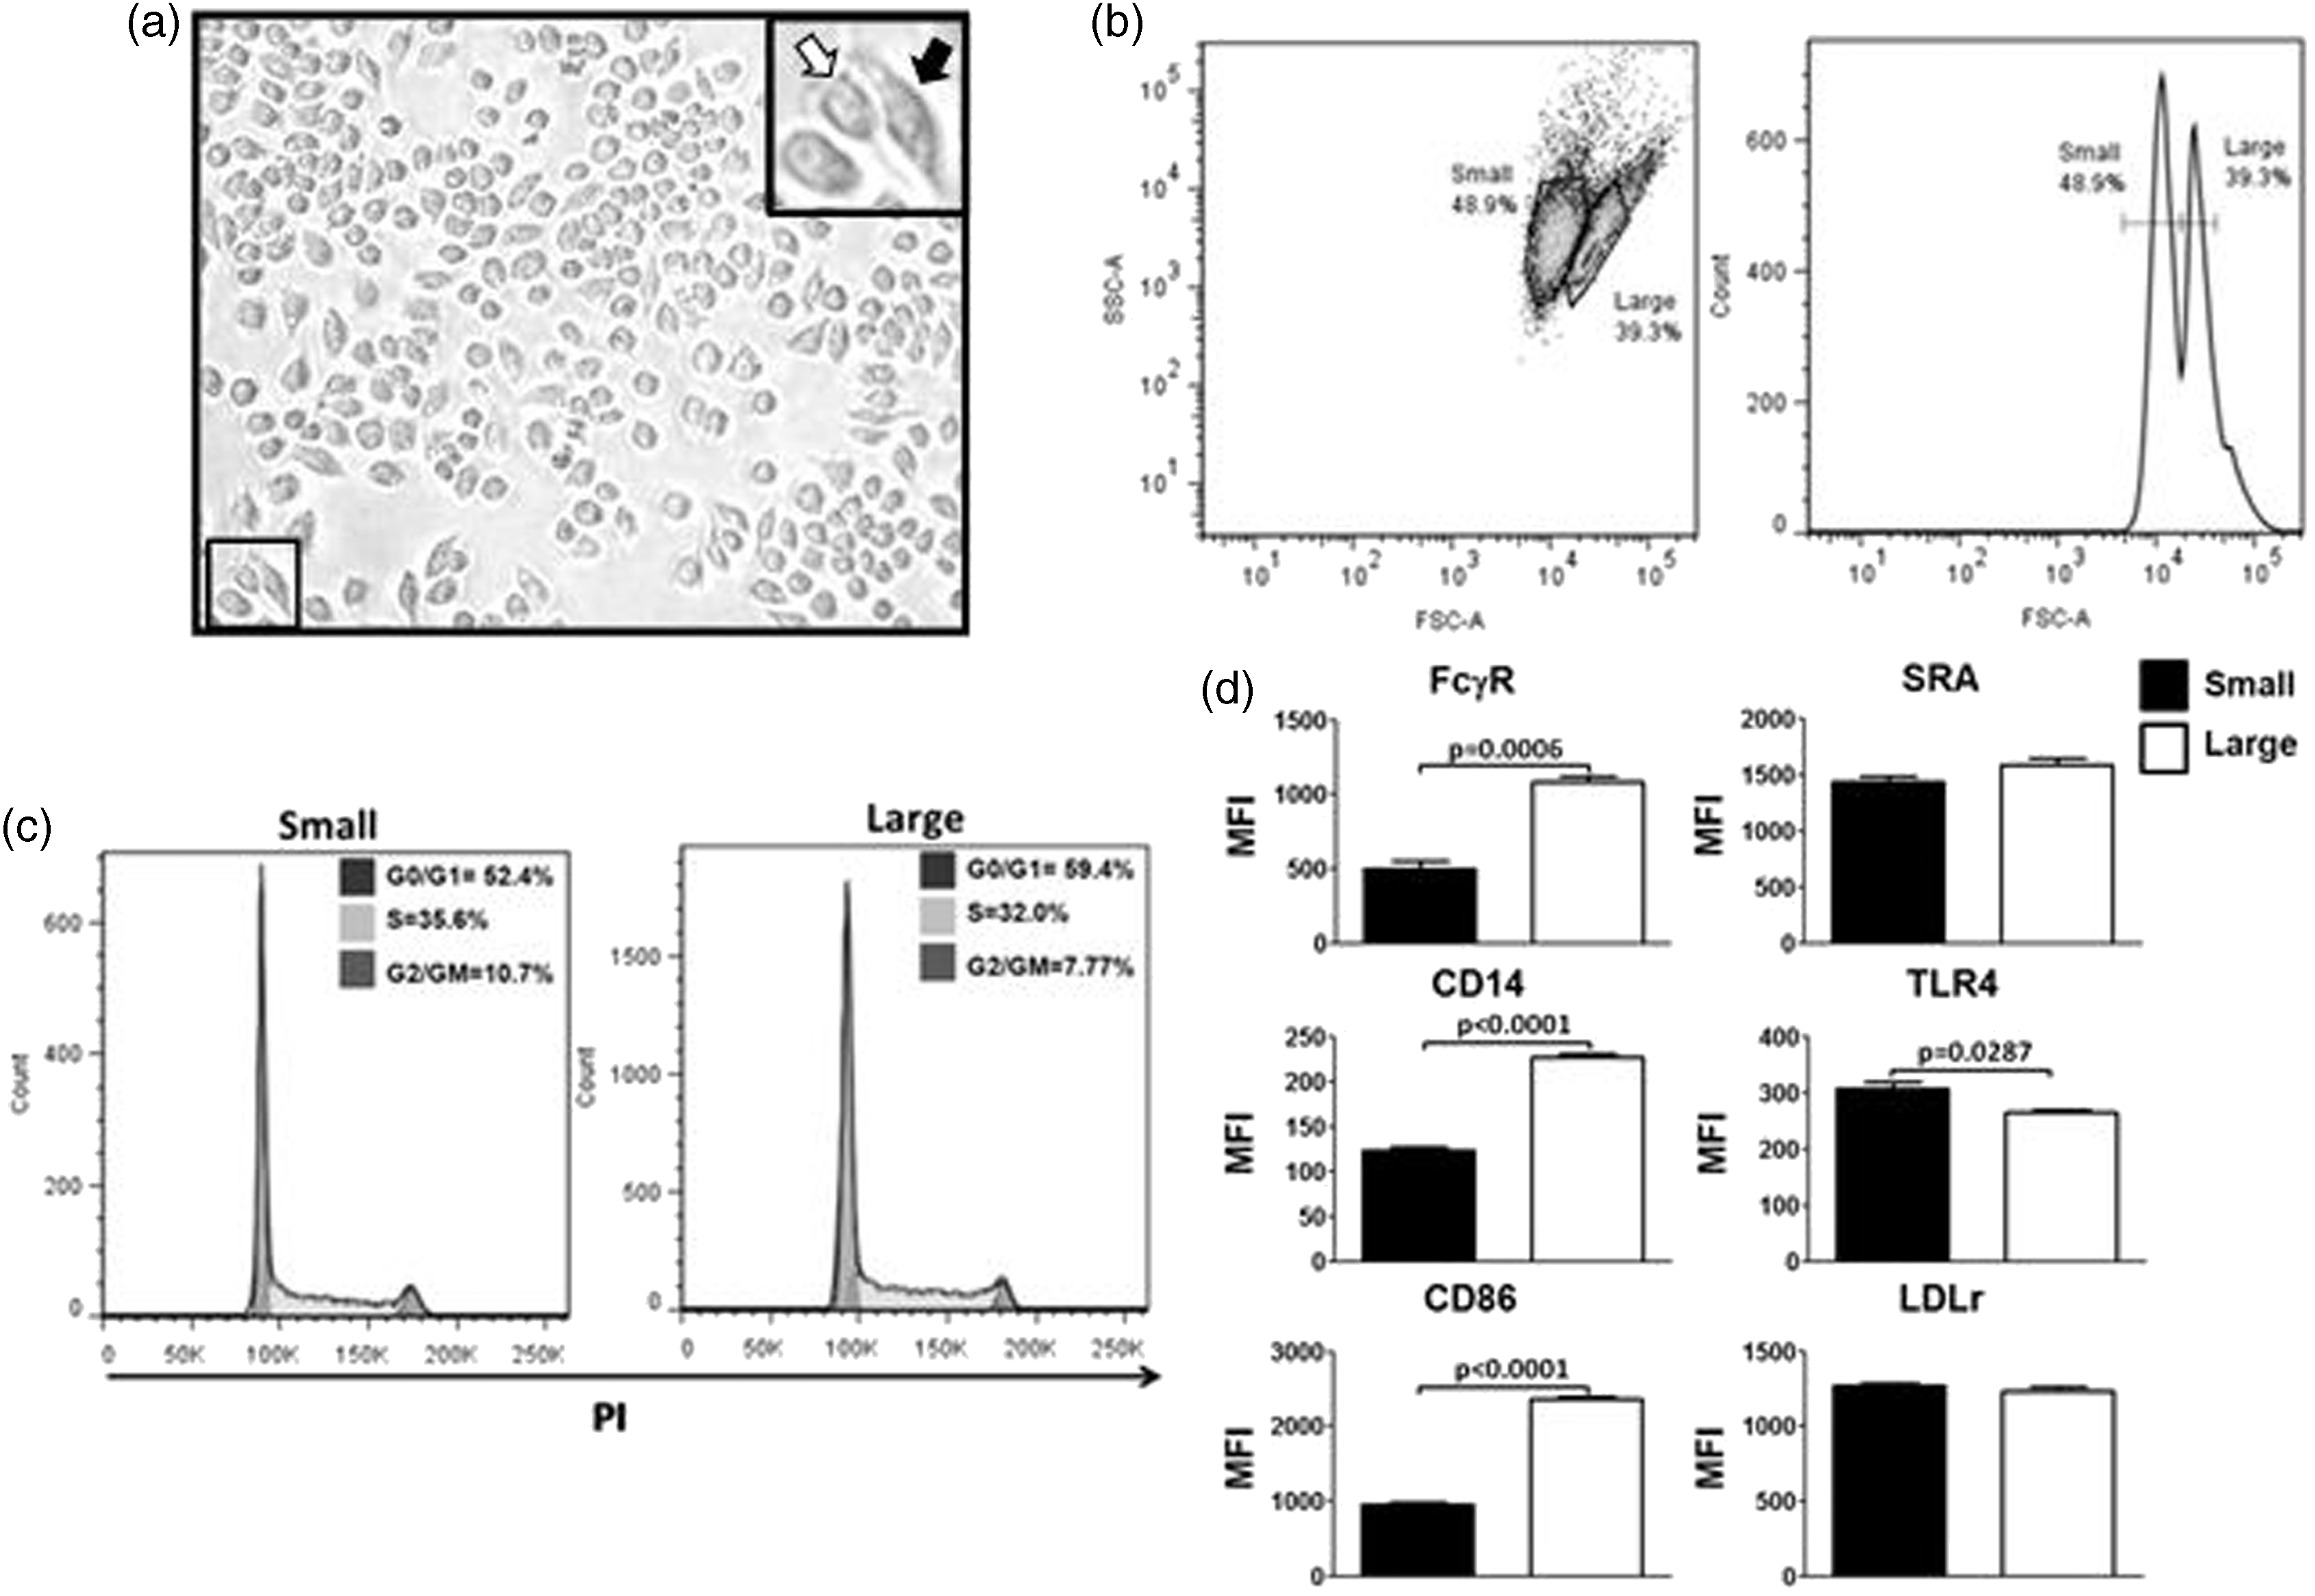
We also assessed whether these cell subpopulations displayed differences in function. As phagocytosis plays a major role in macrophage function and we have observed differences in FcγR levels, we investigated whether or not Fc-mediated phagocytosis was different between these two subpopulations. Indeed, phagocytosis of opsonized particles was significantly higher in the larger cell subpopulation of BM-derived Mφs compared with the smaller cells, as detected by flow cytometry (Figure 3a). These observations regarding differences in phagocytosis were also observed in J774 cells (Figure 3b).
Fc-mediated phagocytosis differs between the two morphologically different subpopulations. (a) BM-derived Mφs or (b) J774 cells were incubated (5 × 10⁵ cells) with IgG-opsonized E. coli particles labeled with pHRodo (Life Technologies) at a ratio of 20:1 particles to cells for 1 h at both 4℃ (negative control) and 37℃. The levels of phagocytosis were expressed as the geometric MFI. Experiments were performed in triplicate and repeated three times.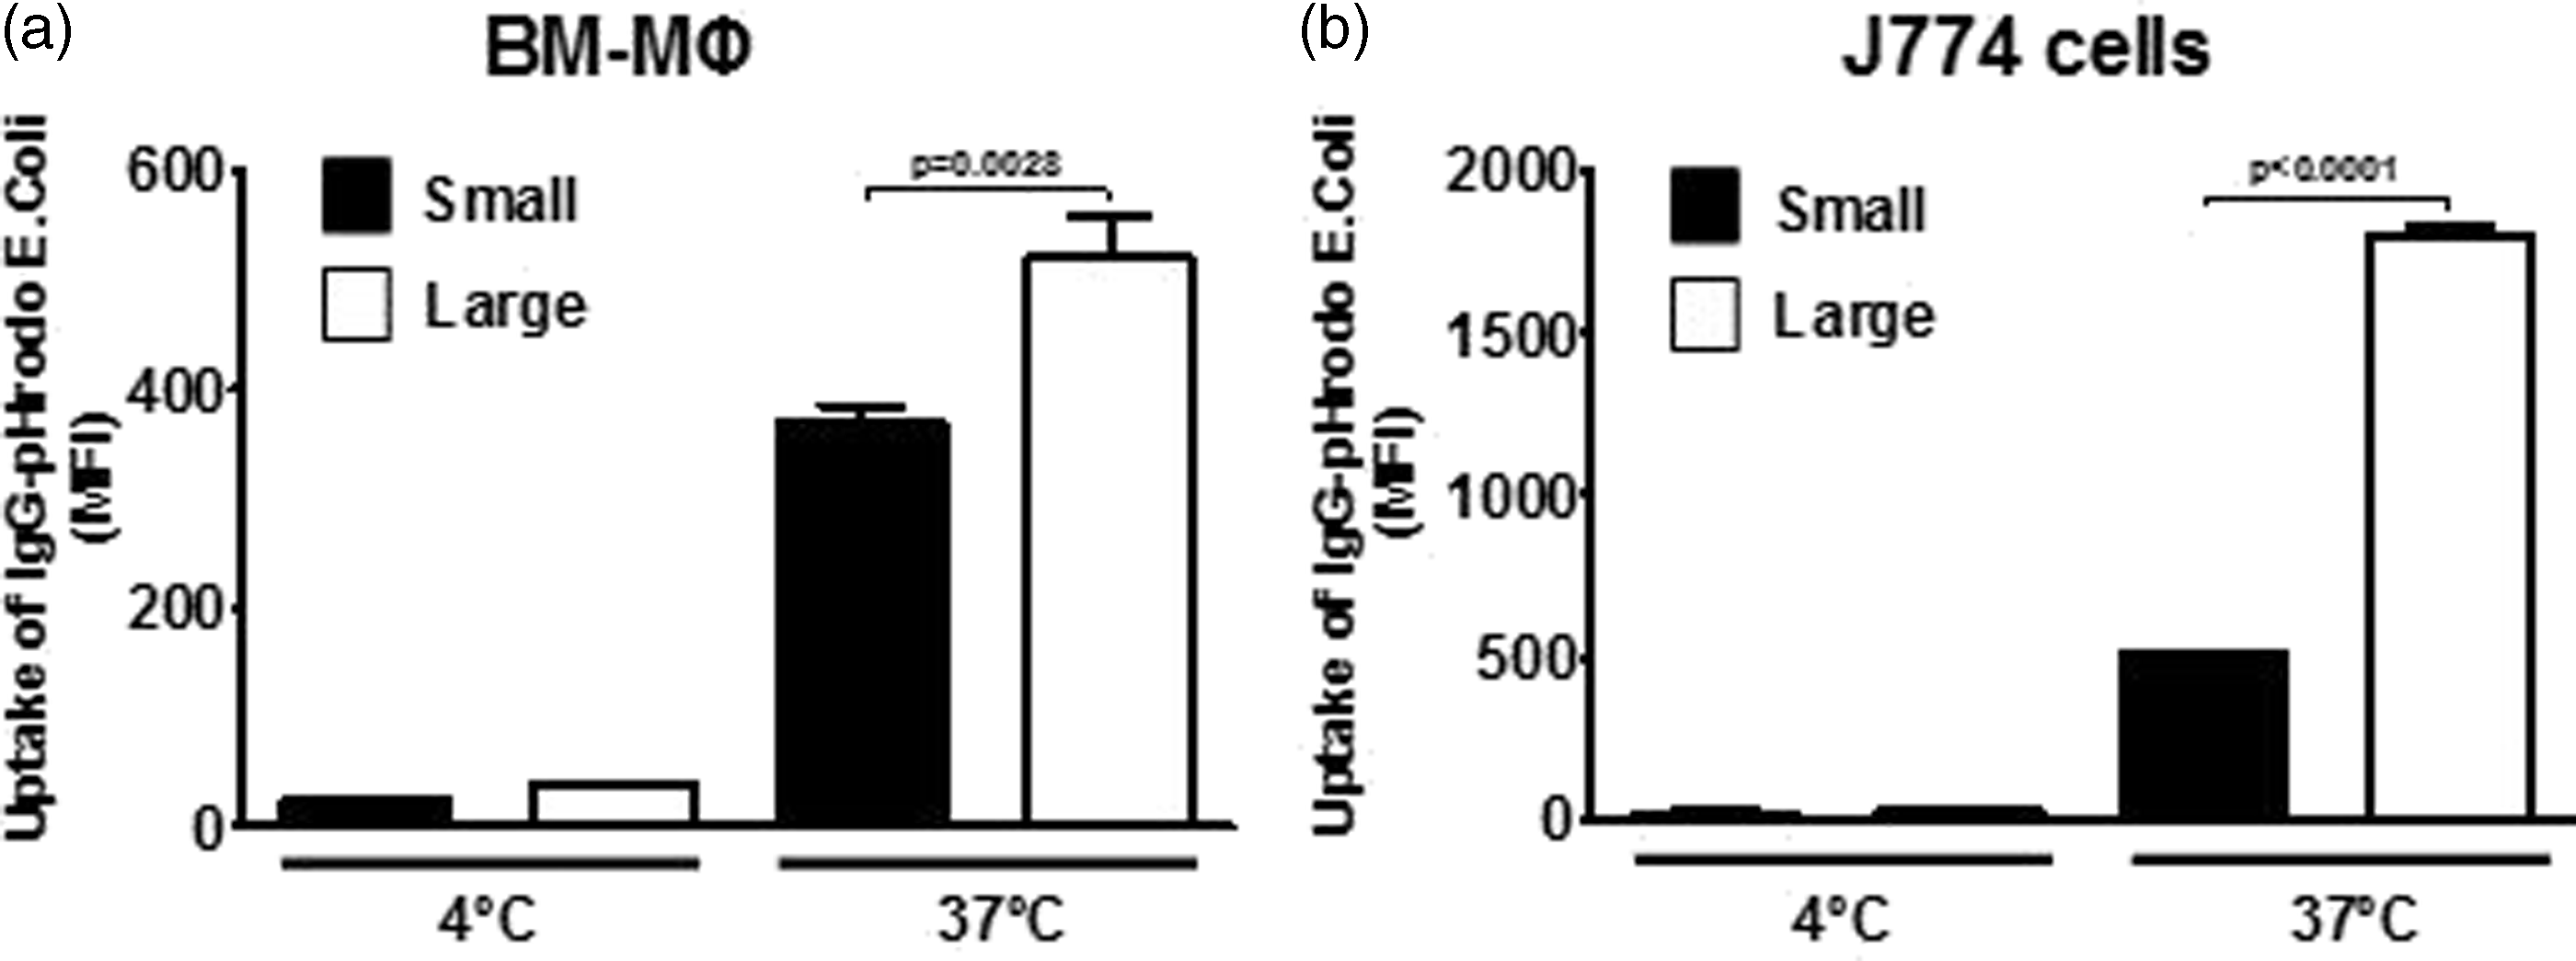
Macrophage subpopulations are recapitulated by changes in the growing environment
We observed that J774 Mφs could be grown in suspension on non-TC-treated plastic dishes, displaying a phenotype like the round/large cells observed in regular TC dishes (Figure 4a). Analysis of these cells in suspension by flow cytometry demonstrated that they grew as a homogenous population, and their size was similar to the subpopulation of round cells observed in TC dishes (Figure 4b). When suspension cells (S) were exposed to SF conditions for a very short time, they rapidly and firmly attached and spread onto non-TC dishes (Figure 4c). The attached cells (A) in serum-free conditions also resulted in a homogenous population as observed by flow cytometry (Figure 4d), resembling the size of the small population observed in the original TC conditions. In summary, cells in suspension correspond to the round and larger population whereas attached cells are spread and smaller. These observations also suggest that changing the culture environment alters Mφ phenotype.
Macrophage subpopulations were recapitulated by growing in different conditions. (a) Mφs (J774 cells) were grown in suspension on non-TC-treated plastic dishes in the presence of 10% FBS at 37℃, presenting a round morphology after staining with FITC-conjugated Ab against FcγR and visualized by fluorescent microscopy. (b) Removal of FBS (2 h, 37℃) resulted in rapid attachment of cells to the non-TC-treated plastic dishes, displaying a fibroblast-like morphology also visualized after staining with FITC-conjugated Ab against FcγR. The difference in size (FSC) between cells growing (c) in presence of serum or (d) in the absence of serum was documented by flow cytometry. For comparison, the shaded histograms (TC) correspond to the size of cells in TC dishes.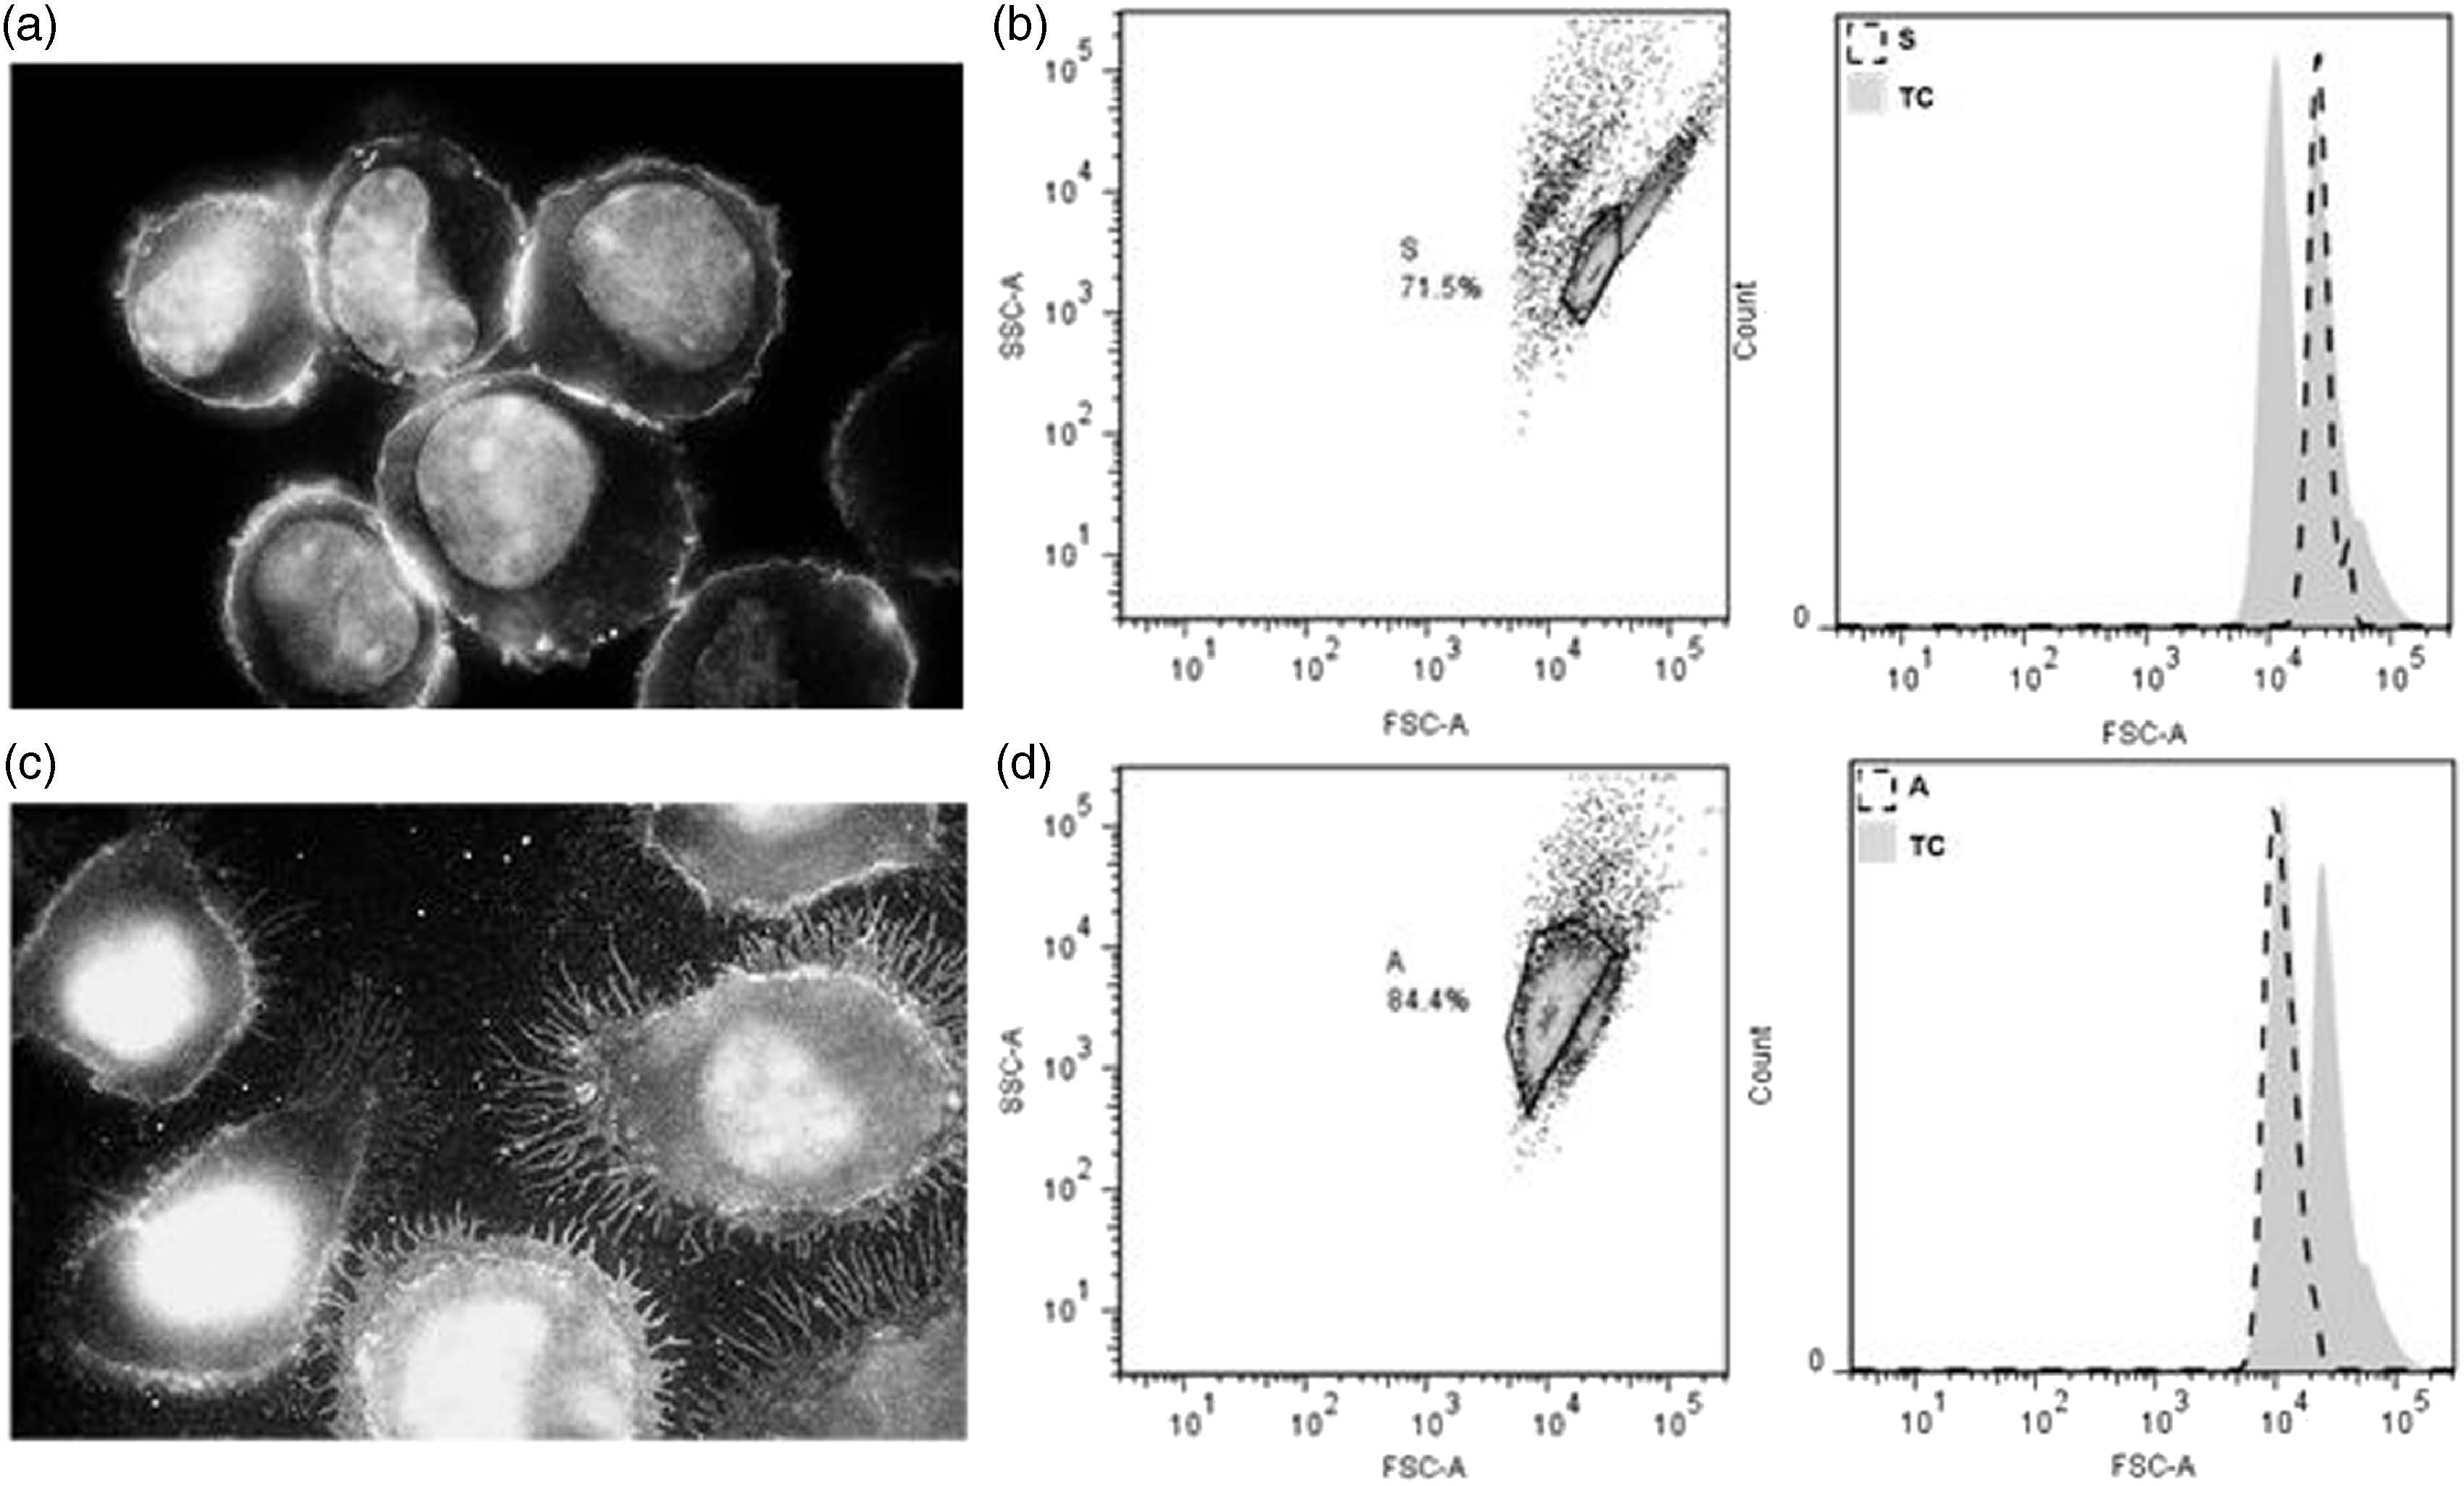
The attachment to non-TC dishes of suspension cells in absence of serum was observed to occur rapidly within 5 min after serum removal, reaching a plateau within 30 min (Figure 5a). The attachment percentage of suspension cells was inversely proportional to the concentrations of FBS added (Figure 5b). Next, we investigated the possible specific component in serum that could modulate the attachment. Addition of BSA to suspension cells in absence of FBS resulted in prevention of attachment onto non-TC plates (Figure 5c). Other proteins, such as hemoglobin (Hb), did not inhibit the attachment of S cells in serum-free conditions (Figure 5d). The addition of either LDL or HDL also significantly prevented attachment of cells to non-TC dishes (Figure 5e,f). As BSA is known to carry both fatty acids and cholesterol, and HDL and LDL contain both phospholipids and cholesterol,
21
we investigated the effect of specific lipids on cell attachment. Cells in suspension in FBS-free medium were incubated with either liposomes made of PS or PC phospholipids. Both PS and PC liposomes had no effect on macrophage attachment (Figure 5g). However, water-soluble cholesterol had a drastic effect on the attachment of macrophages, significantly decreasing their adherence to non-TC dishes (Figure 5h). To confirm the specific effect of cholesterol, we prepared PC liposomes with and without a physiological concentration of cholesterol and incubated with suspension cells in FBS-free conditions. We found that the attachment of suspension cells was also significantly reduced upon incubation with cholesterol PC-liposomes but not with PC-liposomes without cholesterol (Figure 5i). In summary, our results showed that Mφs adhere very rapidly to non-TC dishes in the absence of serum, and the lack of cholesterol may be responsible for this effect, although other factors within serum may be involved.
Macrophages in suspension attach to plastic surfaces depending on the presence or serum in the medium. (a) J744 cells in suspension (S) were incubated in FBS-free medium at 37℃ from 5 to 120 min, and the number of cells that attached to non-TC dishes was measured by the MTT method. S cells were incubated in the presence of various concentrations of (b) FBS, (c) BSA, (d) Hb, (e) LDL, (f) HDL, (g) PS liposomes, (h) PC liposomes and (i) water-soluble cholesterol. (i) Cells were also incubated with PC or cholesterol/PC-liposomes. The number of cells that attached to non-TC dishes was measured once again by the MTT method. Statistical analysis was determined from three independent experiments by both two-tailed t-tests and one-way ANOVA, and significance was accepted as P < 0.05.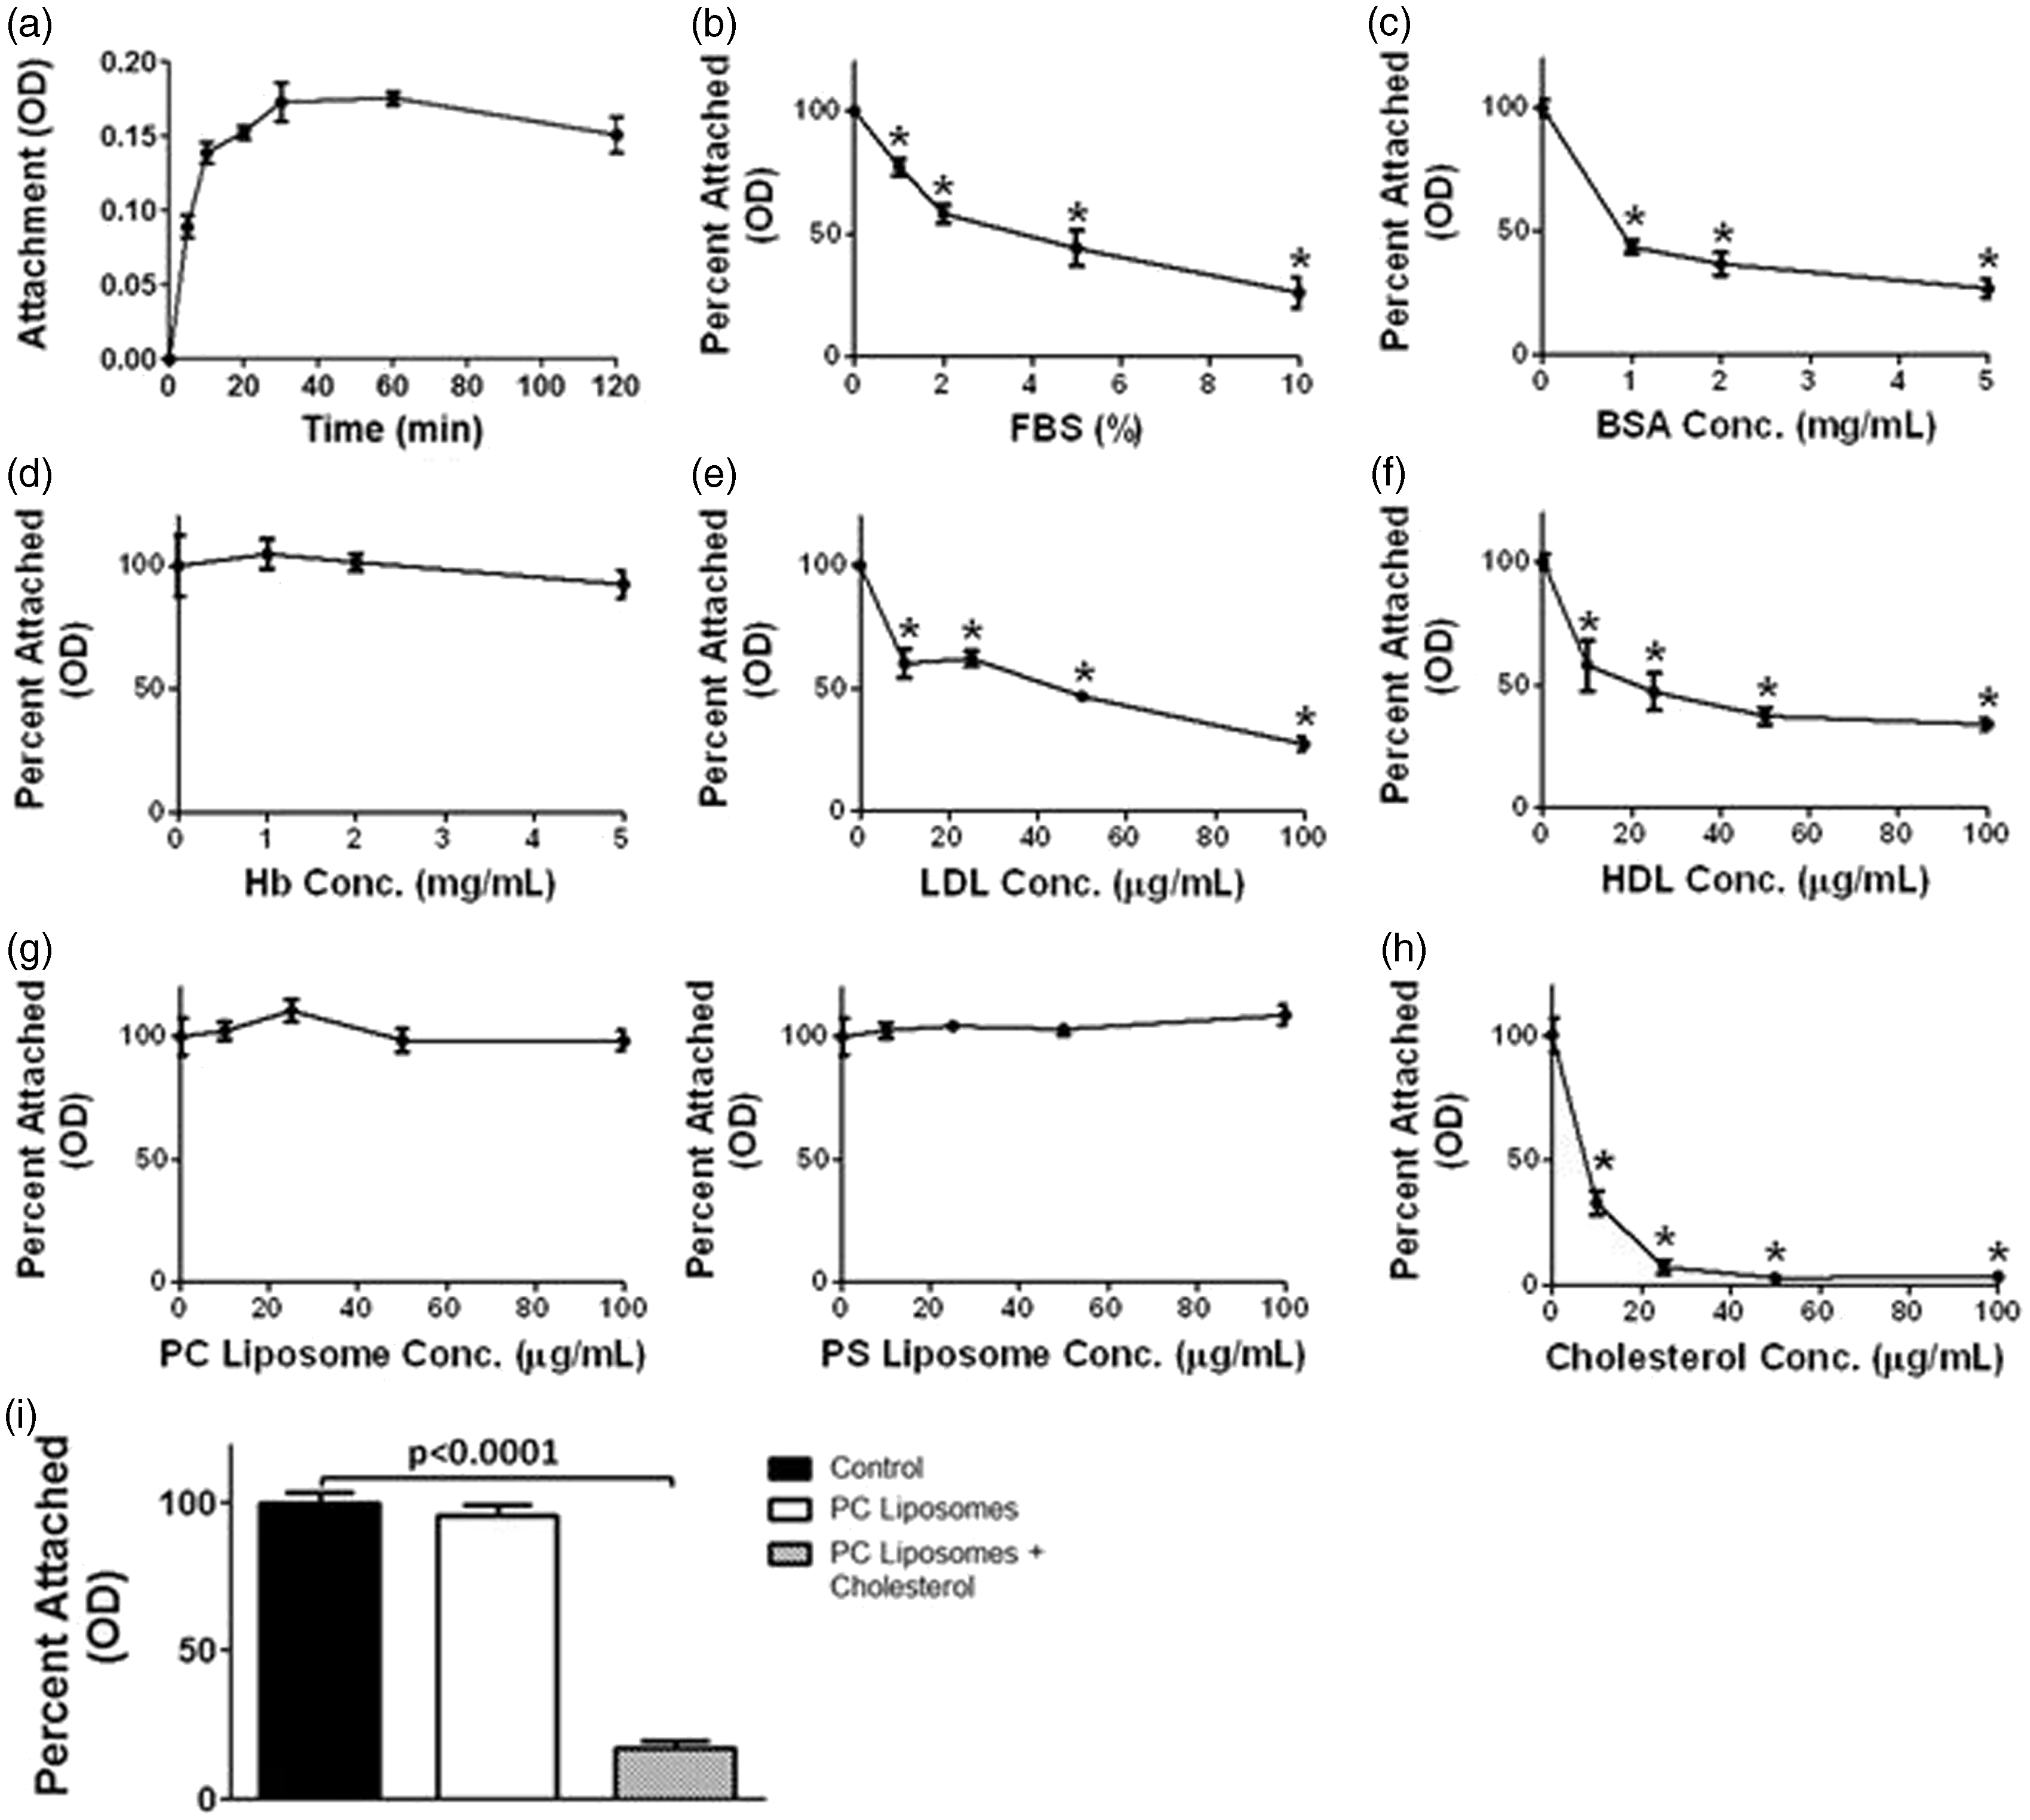
Suspension and attached macrophages have different phenotypes and functions
The subpopulations of Mφs with distinct sizes and morphologies were further analyzed for protein expression, phagocytic activity and response to LPS. Initially, we assessed whether S or A J774 cells showed any differences in the stages of their cell cycles as serum starvation has been shown to induce cell cycle arrest of cells into the G0/G1 phase.
22
We did not observe any differences in the cell cycle between S or A subpopulations, most likely due to the short length of serum-free conditions (Figure 6a). Expression of CD86, CD14, Sra1 and FcγR were significantly higher in suspension Mφs compared with attached cells, while TLR4 and LDLr were significantly higher in attached Mφs as opposed to suspension cells (Figure 6b). Typical markers of M1 and M2 Mφs, such as iNOS (M1) and Arg1 (M2), were also analyzed by qRT-PCR. The expression of iNOS mRNA was elevated in suspension cells as opposed to attached cells, whereas no differences were observed at the level of Arg1 mRNA levels (Figure 6c). Fc-mediated phagocytosis was also significantly higher in suspension Mφs compared with attached cells (Figure 6d). Finally, each population of Mφs reacted differently to LPS treatment. Both populations were incubated with LPS (1 ng/ml) for 2 h in the presence of serum, and the expression of several cytokines was measured by qRT-PCR. The mRNA levels of TNF-α, IL-6 and IFN-β were significantly higher in A Mφs compared with S cells. On the contrary, IL-10 mRNA expression levels were significantly increased in suspension Mφs as opposed to attached cells (Figure 6e). The difference in LPS response between the two populations revealed that attached cells have a pro-inflammatory phenotype as opposed to the anti-inflammatory phenotype of suspension cells. This observation demonstrates another distinct functional difference between the two populations.
Suspension or attached A macrophages displayed different phenotype and function. (a) J744 cells in suspension (S) or attached (A) Mφs were analyzed for their differences in cell cycle, (b) expression of FcγR, CD14, Cd86, SRA, TLR4 and LDLr by flow cytometry, (c) mRNA expression of iNOS and Arg1 measured by qRT-PCR using GAPDH mRNA levels as housekeeping gene, (d) Fc-mediated phagocytosis and the response to LPS (1 ng/ml LPS for 2 h at 37℃). (e) Cytokine mRNA levels (TNF-α, IL-6, IL-10 and IFN-β) were measured by qRT-PCR using GAPDH mRNA levels to normalize the samples. Statistical analysis was determined by two-tailed t-tests from three independent experiments, and significance was accepted as P < 0.05. CTL: control.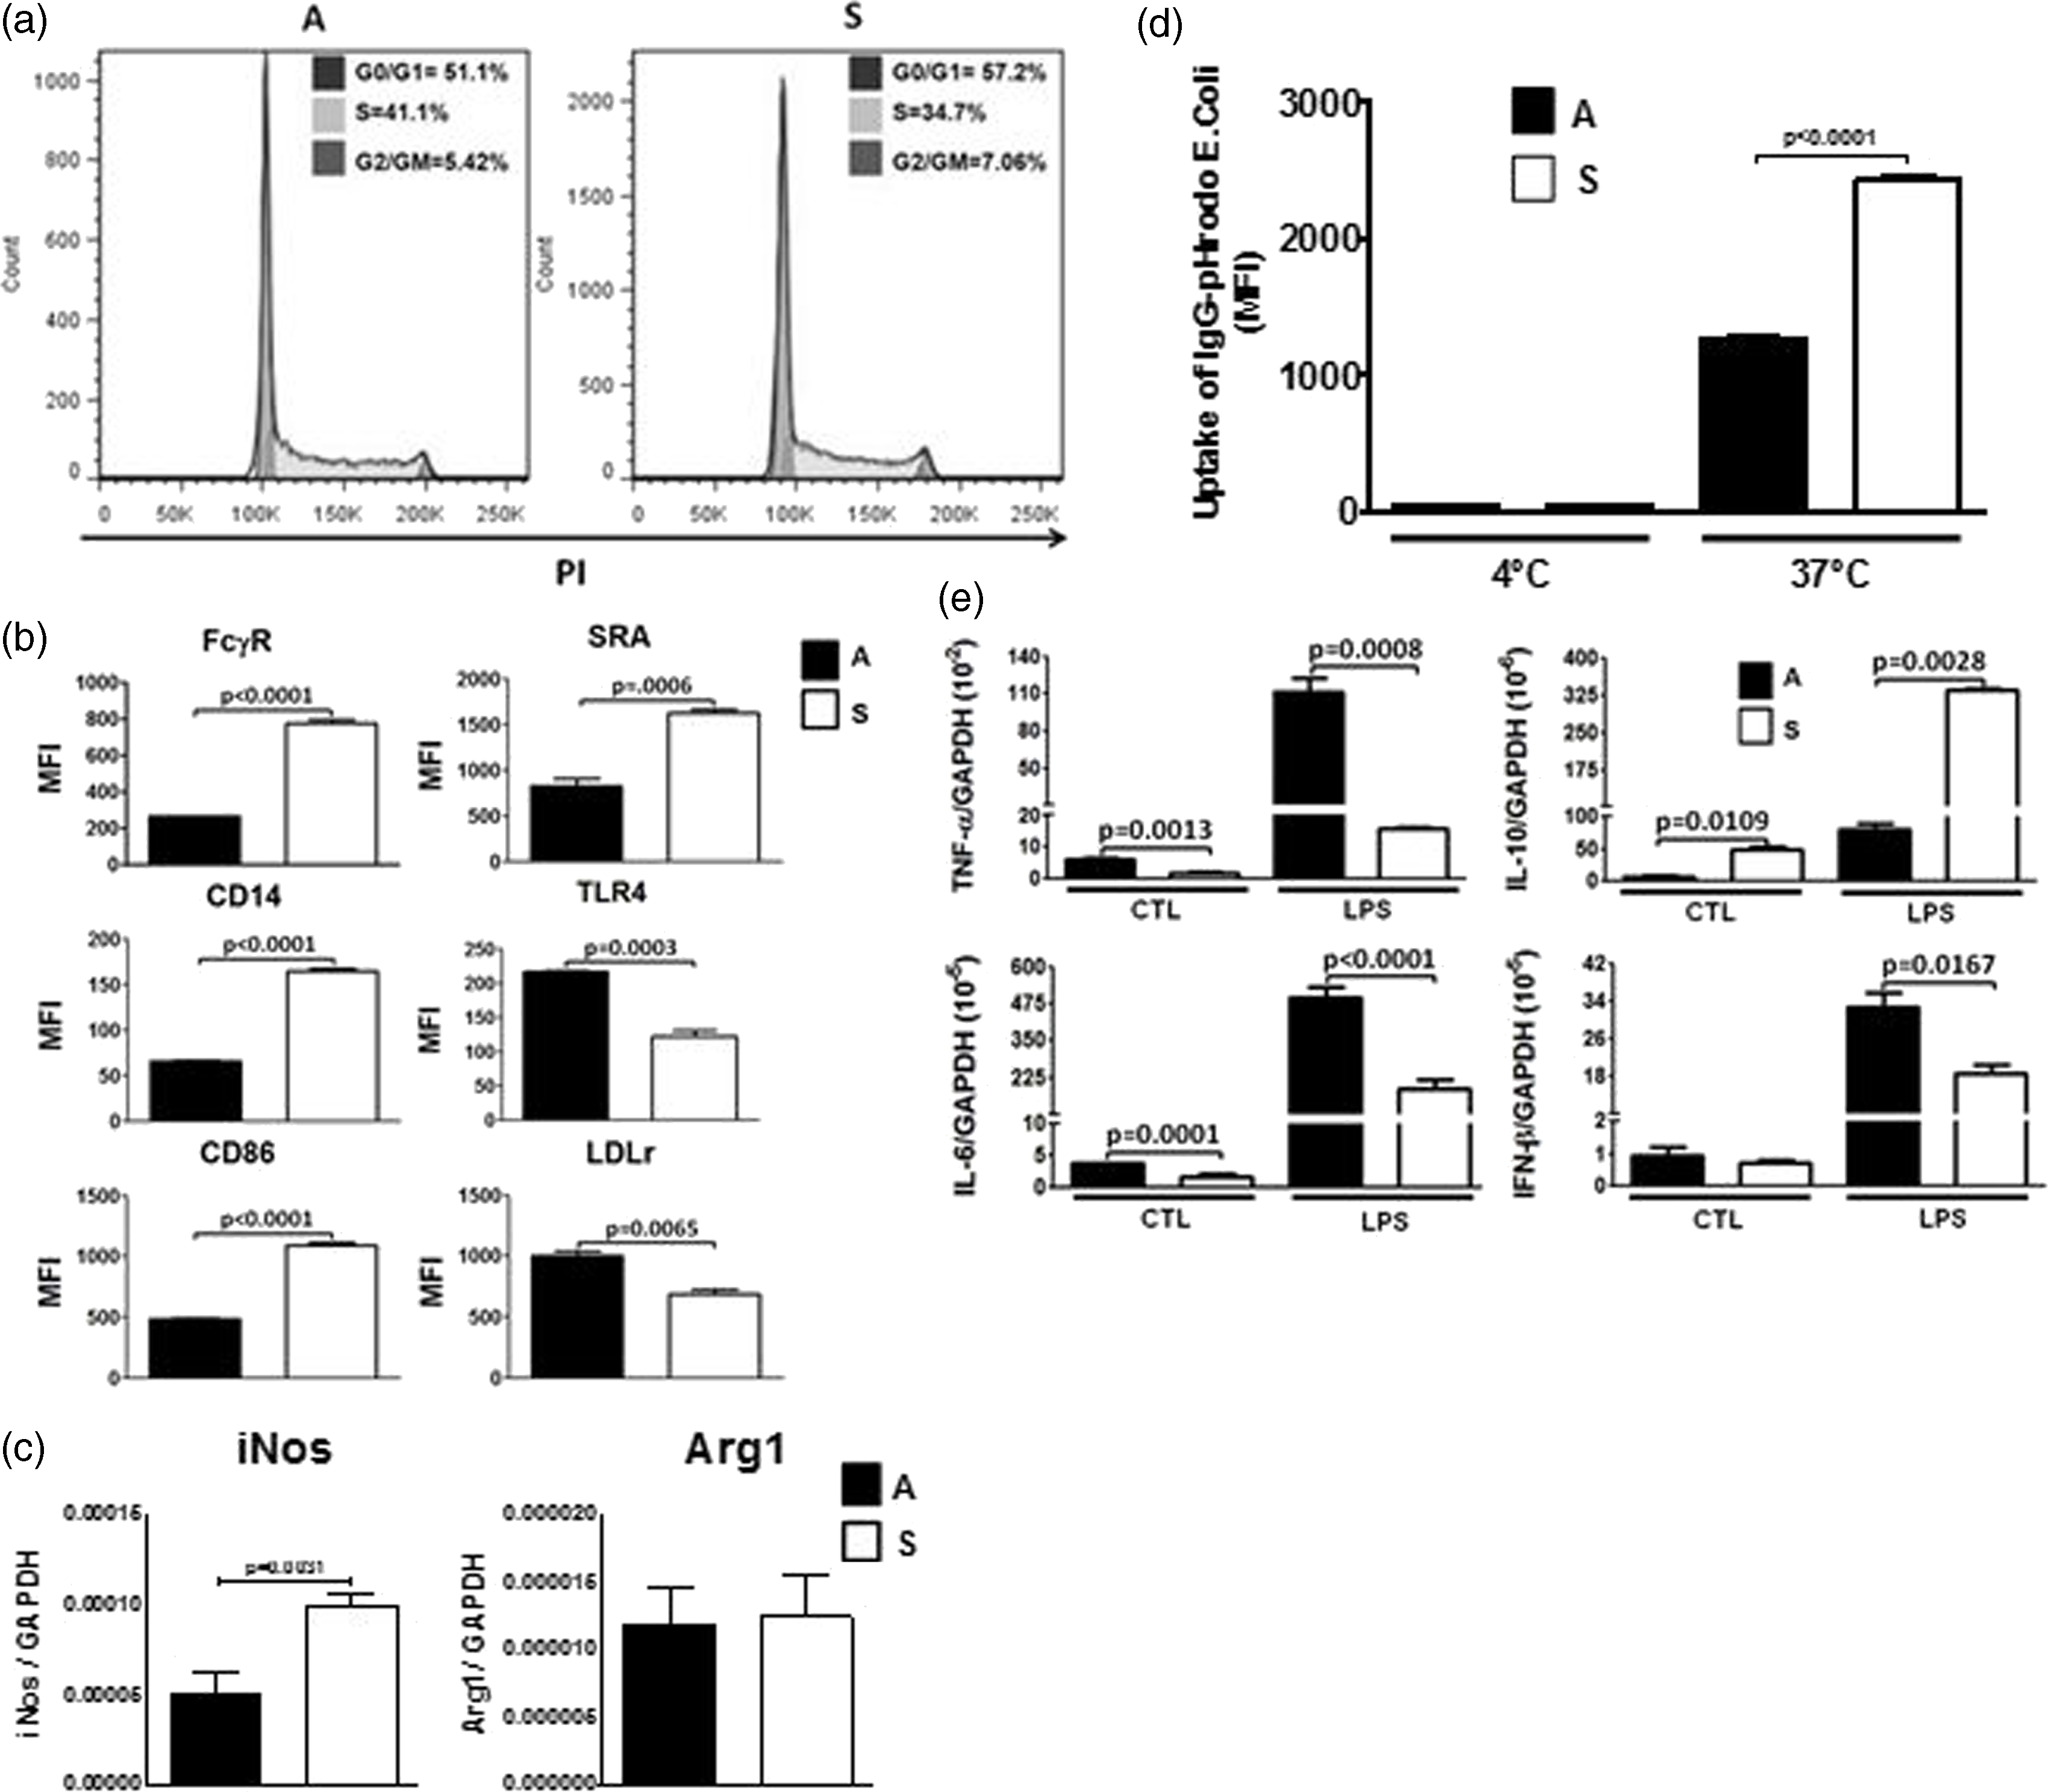
Discussion
Mφs are key players in both innate and adaptive immune responses. These cells clear pathogens, cell debris produced after necrosis and apoptotic cells. In addition, Mφs release molecules necessary for the inflammatory response. Mφs also participate in the adaptive immune response by acting as APCs. Mφs are distributed among different organs to participate in all of these processes, and they have the ability to migrate into sites of injury, contributing to tissue recovery and remodeling. During these processes, Mφs encounter different physiological and nutritional environments, resulting in functional changes that are often referred to as polarization,7,14 which is likely the product of changes in gene expression. 16 In the present study, we showed that murine Mφs presented two distinct subpopulations under normal conditions, each with unique morphologies and displaying differences in function. The two subpopulations of Mφs observed in this study differ in size and shape, large/round and small/spread, and the presence of specific surface markers, such as CD14 and CD86, which did not depend on the cell confluency. These observations echo prior reports describing two distinct subpopulations of peritoneal Mφs isolated from naïve BALB/c mice. 23 However, further studies are needed to investigate whether or not subpopulations of Mφs observed in vivo displayed functional differences, such as phagocytosis.
The characteristics of these two subpopulations, large/round and small/spread, could be recapitulated by the environmental conditions, in particular by the cholesterol concentration within the medium. Indeed, specific homogenous populations that displayed different protein markers and functions could be obtained by changes in the culture conditions and cholesterol concentration within medium. Thus, Mφs grown in suspension in the presence of serum displayed a round morphology, a robust phagocytic activity and higher expression of anti-inflammatory cytokines after stimulation with LPS. When these cells in suspension were exposed to serum-free conditions, they became very adherent to non-TC dishes and presented a ‘fibroblast-like’ shape with reduced phagocytic capacity and an up-regulation of pro-inflammatory cytokines after incubation with LPS. Prior studies have shown that the external environment modulates Mφ function. Mφs exposed to an external acidic environment, similar to that encountered during infection, resulted in an increase of the phagocytic capacity of Mφs. 24 The effect of an acidic microenvironment on Mφ function was also described at the level of LPS-induced cytokine production in culture conditions, 25 as well as in in vivo conditions. 26 Retinoic acid derived from the peritoneal omentum induced changes in gene expression in specific subpopulations of Mφs. 15 The effect of the environment in Mφ function is modulated at the level of the transcriptome, by enhancers and secondary transcription factors. 16 Similarly, the expression pattern of Mφ populations is associated to their bioenergetics profile. 27 Finally, the tumor environment has been shown to modulate the plasticity of local Mφs. 13
The natural subpopulations of Mφs observed in our study could be recapped by exposure to different concentrations of lipoproteins and cholesterol in the medium. Thus, cells became less adherent when exposed to BSA, which has a great capacity to bind lipids but not to other proteins such as Hb. HDL and LDL, which contained both phospholipids and cholesterol, also affected Mφ attachment. Finally, cholesterol, water soluble or associated with phospholipids, appeared responsible for decreasing adherence. Therefore, we proposed that the presence of cholesterol in the environment plays a significant role in Mφ plasticity. The effect of cholesterol on Mφ function has been often associated with their role in the development of atherosclerosis. In this regard, Mφs become foam cells as the product of an excessive influx of cholesterol into the cell via modified LDL, such as oxidized LDL, or through the uptake of large amounts of native LDL by pinocytosis.28,29 This uptake of cholesterol in excess gives Mφs a distinct phenotype related to the presence of ‘lipid droplets’ within the cytosol. 30 We found that when treating Mφs in suspension with various concentrations of LDL and water-soluble cholesterol, they did not display the presence of cytosolic ‘lipid droplets’. Therefore, we do not believe that we are dealing with foam cell formation, probably because the concentration of native LDL used in our studies was much lower, less that 100 µg/ml, than the concentration used to differentiate the cells in culture, which is in the order of 2–4 mg/ml. 31
We also observed an effect on the response to LPS and cytokine production after changing the cholesterol microenvironment of Mφs. Thus, cells grown in suspension in the presence of serum showed high expression levels of IL-10 and reduced levels of TNF-α and IL-6, which is the opposite observed in attached cells under serum-free conditions, when both cell populations were stimulated with LPS serum under identical conditions. This difference in LPS response was correlated to changes in protein expression. Thus, Mφs in suspension displayed high levels of CD14, CD86 and Sra1. CD14 is up-regulated by exposure to IL-10, 32 LPS and statins in the surrounding microenvironment. 33 Sra1 is often up-regulated in Mφs that are taking part in the resolution of infection and clearance of apoptotic cells. 34 In contrast, attached cells presented elevated levels of TLR4, which is involved in the recognition of pathogen-associated molecular patterns (PAMP), triggering a robust inflammatory response. LDLr levels were also elevated in attached cells probably due to the reduction of external cholesterol levels. 35 In addition, iNOS mRNA levels were different between attached and suspension cells, which is a typical M1 marker. In contrast, no differences were observed at the level of Arg1, which is considered a marker of M2. Based on these observations, as well as differences in CD86 and TLR4, it is irrelevant that the two cell populations observed in this study reflect differences between M1 and M2 cells. Perhaps, they correspond to intermediary stages of polarization, as has been proposed by Mosser and Edwards. 7
An important difference between the two Mφ subpopulations described in this study is their ability to clear opsonized bacteria, which is correlated with the level of cholesterol in the medium. Thus, Mφs in suspension in the presence of cholesterol-containing molecules had a significantly higher rate of phagocytosis than that of attached cells in cholesterol-free conditions. In this regard, prior studies have shown that treatment of Mφs with inhibitors of the cholesterol biosynthetic pathway, such as the statin Lovastatin, resulted in a decrease of Fc-mediated phagocytosis along with a direct link to the role of LDL in this process.36,37 Moreover, we have recently found that incubation of Mφs with itraconazole, another inhibitor of cholesterol synthesis, affected phagocytosis. 38 The differences in phagocytic function between suspension and attached Mφs were proportional to the levels of Fc receptors in these cells. The mechanism for the modulation of FcγR expression by cholesterol is unknown. Our recent observations also indicated that FcγR expression levels were altered by inhibition of cholesterol biosynthesis. 38 The promoter region of this gene did not display any lipid-driving element that could predict a regulation at the transcriptional level, although we cannot discount the involvement of transcription enhancers. Additionally, changes in mRNA stability may be involved in regulating changes in FcγR expression levels after exposure to different cholesterol contents.
We also observed marked differences in morphology between the two Mφ populations exposed to various microenvironmental conditions, which has been shown to be important in the function of these cells. 39 Indeed, a study has shown the importance of cell elasticity on specific functions of macrophages such as phagocytosis and LPS response. 40 Based on our observation, it is possible to correlate round-shape morphology of Mφs with cells participating in inflammation resolution and tissue repair, while spread Mφs are more likely to contribute to pathogen detection and clearance. Differences in Mφ morphology are also characteristic of cellular mobility, 41 which could be modulated by the presence of inflammatory agents, such as LPS. 42 Disease conditions such as sepsis and burn injury have been shown to modulate Mφ function that may be critical for injury resolution.43,44
In summary, we found that a change in the external milieu of macrophages, in particular at the level of lipid content, resulted in a change of Mφ function. Thus, Mφs may encounter a different environment within a tissue where the extracellular lipid content may be different than from cells in circulation, which is likely to modify their function toward clearance and resolution. Our observations might also shed light onto the mechanisms by which Mφs recruited from the blood stream become more adherent once they enter the tissue with reduced serum levels.
Footnotes
Declaration of Conflicting Interests
The author(s) declared no potential conflicts of interest with respect to the research, authorship, and/or publication of this article.
Funding
The author(s) disclosed receipt of the following financial support for the research, authorship, and/or publication of this article: This work was supported by National Institutes of Health grant numbers GM114473 and GM083275.