
Abstract
The presence of subclinical levels of LPS from Gram-negative bacteria, also referred to as endotoxin, in the circulation may induce a pro-inflammatory immune response that leads to the development of obesity and insulin resistance. Recent data indicate that high-fat meals may elevate circulating levels of LPS. However, it is currently unclear how the LPS transits from the gut lumen to the general circulation. We determined whether aspirin-induced damage of the small intestinal mucosa, evidenced by an increase in the paracellular permeability, allows greater transit of LPS into the systemic circulation. The 3-h cumulative excretion of lactulose was significantly increased after the consumption of aspirin solution relative to that after the consumption of an equal volume of water in 15 healthy women (median after aspirin 0.09% of dose vs. median after water 0.03% of dose; P = 0.004). Dosage with aspirin also significantly increased the lactulose : mannitol ratio (median after aspirin 0.014 vs. median after water 0.005; P = 0.017). However, serum LPS levels after the consumption of the aspirin solution were not significantly different from those after consumption of the control (plain water). Further, there was no correlation between body fat content and circulating levels of LPS.
Introduction
A number of publications suggest that chronically elevated levels of circulating endotoxin, also referred to as LPS, may be responsible for the pro-inflammatory status associated with obesity and insulin resistance in mice and humans.1–3 Endotoxin is the immunoadjuvant fraction of the outer cell membrane of Gram-negative bacteria that is released on their lysis in the intestinal lumen. Plasma endotoxin levels are reported to increase post-prandially after the consumption of a high-fat (HF) meal in both healthy and morbidly obese humans.4–8 As in a mouse model, low levels of exogenous LPS are reported to have a similar effect in promoting the development of obesity, diabetes and insulin resistance as a HF diet, it has been assumed that elevated levels of circulating LPS are the link between diet-induced inflammation and the development of metabolic syndrome. 1 Hence, it seems that the rate of translocation of bacterial endotoxin from the gut lumen into the circulation may be influenced by diet. However, the mechanism by which a HF meal could facilitate the transit of endotoxin across the intestinal barrier is unclear. One hypothesis is that the ingestion of a HF meal induces oxidative stress in mucosal cells, which leads to local inflammation and subsequent reduction in the integrity of the mucosal barrier, allowing greater quantities of endotoxin to traverse paracellular junctions.6,9 Published data showing that both oxidative stress and the expression of pro-inflammatory cytokines are increased in circulating monocytes after the ingestion of a HF meal and that both of these effects are accompanied by elevations in the levels of plasma endotoxin support such a hypothesis.5,6 Further, the observation that the consumption of orange juice with a HF meal mitigates the cellular oxidative stress, the rise in pro-inflammatory cytokine expression and the rise in plasma endotoxin level, suggests that the immune response may be influenced by the relative proportions of macronutrients. 9 A similar effect is reported in humans when HF meals are supplemented with a mixture of resveratrol and other polyphenols, 10 suggesting that secondary plant metabolites may be instrumental in this mitigation.
An alternative hypothesis for the transit of endotoxin is that either free or micelle-bound luminal endotoxins are able to cross the mucosal barrier as a result of dietary absorption by enterocytes. The transiting endotoxin may then be incorporated into chylomicrons and released from the basolateral site of enterocytes into the systemic circulation or solubilised and released into the portal venous system. The former hypothesis is supported by evidence indicating that concentrations of endotoxin in the fatty (chylomicron) fraction of plasma from humans are higher than those in the aqueous phase.7,8,11 This mechanism is further supported by the finding that blocking the formation of chylomicrons in a mouse model prevents the dietary fat-induced increase of circulating endotoxin. 11 Note, it is also conceivable that the accumulation of chylomicrons at the basolateral membrane could subsequently increase paracellular permeability, as it is thought to influence tight junction integrity, 12 and thus could lead to LPS entry via the aqueous and not the fatty phase.
Given that the circulating component that carries the endotoxin varies according to the route by which it is absorbed, fat associated endotoxin that is absorbed transcellulary would be found in the chylomicron fraction whereas water-soluble endotoxin that is absorbed via the paracellular route would be found in the aqueous phase of the serum.
A further hypothesis, based on findings in obese mice, is that the consumption of a HF diet leads to shifts in the composition of the enteral microbiota and a change in the characteristics of the ‘cross talk’ between microbiota and mucosa that leads, in turn, to a reduction in tight junction integrity with consequent augmentation of paracellular absorption of endotoxin. 13 However, it seems unlikely that a single HF meal would promptly alter the composition of intestinal microbiota.
The aim of the current study was to investigate whether an augmentation in paracellular permeability is accompanied by an increase in the translocation of LPS from the lumen of the gut into aqueous components of serum of healthy subjects. The increased permeability of the gut to larger probes, i.e. lactulose (a molecule with a hydrated molecular volume of 0.262 nm3) 14 following a single 600-mg dose of aspirin is well described in healthy female subjects.15,16 This may result from disruption of the mechanical integrity of the enterocyte apex.17–19 We therefore examined, using a human LPS-specific ELISA, whether, in healthy female subjects, the consumption of this dose of aspirin augmented circulating levels of LPS in the serum from systemic venous blood. This LPS ELISA, rather than the Limulus amoebocyte lysate (LAL) assay for endotoxin, was used as the LAL assay may be inconsistent, i.e. dose equivalence between LPS (pg/ml) and endotoxin (endotoxin units/ml) may vary between bacterial species, 20 and hence not consistently reflect the total quantity of circulating LPS. We also examined whether there was any correlation between percentage body fat and LPS levels in the systemic circulation.
Materials and methods
Subjects
Fifteen healthy female non-smokers of mixed ethnicity, aged between 20 and 37 yr (median age 28 yr), with body heights between 1.58 and 1.73 m, and body masses between 55 and 75 kg, were recruited from a fit and healthy population of female postgraduate students and university staff in Palmerston North, New Zealand. Female subjects were used so as to avoid confounding of the result by variation of gastric emptying times and body fat content with gender that could influence the recoveries of lactulose and mannitol.21,22
Given prior work linking obesity determined by waist and abdominal circumference and intestinal permeability to lactulose, 23 particular attention was paid to eliminating obese subjects and quantifying any effect from variations in percentage body fat. Hence, subjects with a body mass index (BMI) >30 were excluded from the study. The percentage of body fat of each subject was determined by whole-body densiometry using air displacement plethysmography in a Bod Pod. 24 Further, each subject completed a health screening questionnaire and underwent a clinical interview to exclude those with a family or personal history of gastrointestinal disorders; any endocrine or metabolic disorders, including diabetes; and hepatic disorders or with a history of recent abdominal pain, nausea, vomiting, diarrhoea or of passage of blood and mucus in stool. Subjects who had a history of current urinary tract infections, vaginal discharge, history of aspirin sensitivity or who had recently consumed pre- or probiotic products, and who consumed more than one alcoholic drink per day, were also excluded from the study.
Study protocol and design
Participants were instructed to refrain from consuming any antibiotics for at least 2 wk and from any non-steroidal anti-inflammatory drugs for at least 1 wk prior to each experimental session. In addition, participants were instructed not to consume any alcohol for at least 3 d prior to each experimental session nor to eat any fried or fatty food, and to avoid exercise on the day prior to attending each experimental session. Participants attended the Human Nutrition Lab at Massey University Palmerston North campus after an overnight fast. On arrival, participants were instructed to empty their bladder into a container; subsequently, a 6-ml sample of venous blood was drawn for baseline measurements. Each participant then ingested either 100 ml of water (negative control) or a single dose of 600 mg soluble aspirin (Dispirin; Reckitt Benkinser Healthcare, Slough, UK) dissolved in 100 ml water.
Each of the two treatments were administered to each subject in randomised order with a 1-wk interval between treatments. One h after each treatment had been administered, each participant consumed a drink containing 10 g lactulose (duphalac; Abbott, Hoofddorp, the Netherlands) and 5 g mannitol (Sigma-Aldrich, St. Louis, MO, USA) dissolved in 100 ml water followed immediately by a further 300 ml of water. Subjects were instructed to urinate into a single container during the subsequent 3-h period so as to bulk their urine over this period. At 3 h after the administration of the lactulose–mannitol solution, each subject was instructed to empty their bladder into the same container. A further venous blood sample was then drawn. The study protocol was approved by the Massey University Human Ethics Committee (Southern A 13/31).
Determination of urinary lactulose and mannitol
The volume of the initial urine sample and the total 3-h volume of urine were determined for each subject. A 15-ml aliquot of each sample was centrifuged at 3500 g at 4℃ for 10 min, and the supernatant stored at –80℃ pending HPLC analysis.
A 1-ml aliquot of each urine sample was diluted with an equal volume of MilliQ filtered water and desalted with 1 g Amberlite resin (Amberlite IRA-410 chloride form and Amberlite IR120 hydrogen form; Fluka Analytical, Sigma Aldrich, St. Louis, MO, USA) in a proportion of 1:1 (w/w). The mixture was then vortexed for 15 s and the supernatant filtered through a 0.2-µm (pore size) cellulose acetate filter (Micro-Analytix Pty Ltd, Auckland, New Zealand) into a 2-ml HPLC vial (Thermo Scientific, Thermo Fisher Scientific, Hemel Hempstead, UK). HPLC analysis was performed in a Shimadzu HPLC system (Shimadzu, Kyoto, Japan) equipped with Degasser Model DGU-20 A, a Pump Model LC-20AT Prominence, an Autosampler Model SIL-20AC, a Column Oven CTO-20 A, a 250 × 4.0-mm cation exchange column (Aminex HPX87C; Bio-Rad Laboratories, Richmond, CA, USA) protected by a Micro Guard Cartridge pre-column (Bio-Rad Laboratories) on a 20-µl aliquot of filtrate from each sample. 15 Filtered MilliQ water was used as the mobile phase at a flow rate of 0.3 ml/min at 590 psi and at 60℃ over 20 min for each standard of lactulose and mannitol with a concentration range from 62.5 to 500 µg/ml and over 40 min for each sample filtrate, respectively. The component sugars in each standard and each filtrate were detected with a Refractive Index Detector (Shimadzu RID-10 A).
The concentrations (µg/ml) of lactulose and mannitol in each filtrate were calculated from the areas under the curve relative to those of a series of concurrently run standards. The total quantity of each sugar (mg/ml) excreted in 3 h was then determined by multiplication of the total 3-h urine volume with the dilution factor of the subsample. The quantities of lactulose and mannitol excreted by each subject and each treatment were expressed as a percentage recovery of the administered dose (10 g and 5 g respectively). The lactulose: mannitol ratios (LMR) were determined from the percentages lactulose and mannitol excreted.
Calibration curves for the two sugars were linear up to 500 µg/ml. The accuracy of the quantification of these sugars in our laboratory by HPLC analysis has been previously described. 16 The intra-assay coefficient of variation was in the range of 0.2–7.7% for lactulose and 0.1–4.6% for mannitol.
Determination of LPS
Venous blood was collected into BD vacutainer® serum (6.0 ml; Becton Dickinson and Company, Oxford, UK) and allowed to clot at room temperature over a period of 2 h before centrifuging for 15 min at 3500 g at 4℃. The serum was decanted into endotoxin-free micro-centrifuge tubes (Biopur® Safe-Lock micro test tubes; Eppendorf, Hamburg, Germany). Serum samples were further centrifuged at 13,201 g at 10℃ for up to 4 h. Aliquots of each sample were stored at −20℃ pending LPS analysis.
Serum LPS concentrations were determined by LPS ELISA (Human LPS ELISA kit; Cusabio Biotech Co., Ltd, Wuhan, P.R. China) according to the manufacturer’s instructions. We used only endotoxin-free certified tubes (Biopur® Safe-Lock micro test tubes; Eppendorf) and pipette tips (Endosafe tips; Charles River, Chatillon-sur-Chalaronne, France) for the performance of the LPS ELISA. The assay was reported to have a detection range from 6.25 to 400 pg/ml. Standard curves with known concentrations of LPS between 6.25 and 400 pg/ml were run concurrently with the samples. The results were plotted in CurveExpert Professional version 2.02. The LPS concentration in each sample was determined by comparison with the standard curve. Serum samples spiked with known concentrations of LPS were also assayed using the same procedure to determine whether the presence of serum proteins influenced the detection of LPS.
The LPS standard curve up to 400 pg/ml was a second-order polynomial. The intra- and inter-assay precisions for the LPS ELISA determined in our laboratories were <10%.
As part of the evaluation of the test prior to its use in this study, a series of 26 serum samples from similar healthy volunteers were each spiked with a known dose of LPS. Analysis of these samples gave values that corresponded to between 85% and 126% (median 97%) recovery of the spiked dose of LPS, indicating that no constituents in the serum sample appeared to inhibit or enhance the assay. In addition, two ‘control’ serum samples taken from subjects in the current study were each spiked 1:10 (v/v) with 100 pg/ml LPS. The recoveries from these samples both lay within the range of those in the preliminary evaluation.
Statistical analysis
Statistical analyses were performed in the SYSTAT version 13 (Systat Software Inc., Chicago, IL, USA). Differences between treatments in baseline LPS levels were assessed by a paired Student’s t-test. Differences between baseline and post-treatment levels of LPS after the consumption of water (negative control) and after the consumption of aspirin were also each assessed by a paired Student’s t-test. Differences between baseline and post-treatment levels of LPS with the negative control and with the treatment with aspirin were assessed by doubly repeated measures ANOVA. The effects of aspirin and the negative control on the excretion of lactulose and mannitol, and on LMR were each compared with a paired Student’s t-test. Differences were considered significant at the P < 0.05 level.
The correlation between the baseline LPS levels taken prior to the control and those before treatment with aspirin was assessed by linear regression and Pearson correlation coefficient and the Bartlett χ2statistic. Correlations between baseline LPS levels and the excretions of lactulose following treatment with water and following aspirin, respectively, were similarly assessed by linear regression, Pearson correlation coefficient and Bartlett χ2statistic. Correlation was considered as significant with a P-value <0.05.
Bland–Altman plots of LPS levels at baseline and post-treatment following the consumption of water and following the consumption of the solution of aspirin were each assessed for correlation. Bland–Altman plots depict the variations in differences in values obtained with two treatments with the mean of the values obtained with the two treatments and hence are considered to better indicate the consistency of correlation between two parameters than does simple linear regression. 25
Results
Body composition of subjects
The 15 female subjects were of similar body height (median 1.66 m; range 1.58–1.73 m) but their body mass (median 62.6 kg; range 59.8–74.4 kg), quantity of body fat (median 17.5 kg; range 8.3–27.8 kg), percentage of body fat (median 28.1%; range 13.5–40.7%) and BMI (median 23.1; range 21.1–27.5) varied considerably.
Variations in serum baseline LPS levels in healthy human subjects
The serum LPS concentrations required Asinh conversion by Johnson Transformation in Minitab version 16 to render them amenable to parametric statistical analysis.
The baseline levels of serum LPS varied widely between subjects. There were no significant differences on paired Student’s t-test in the baseline levels of LPS taken prior to the two treatments. There was a significant linear regression (df = 1, 13; F = 19.920; P = 0.001) and the correlation coefficient between the two was significant (df = 1; Bartlett χ2 = 10.420; P = 0.001; r2 = 0.752) (Figure 1). Hence, baseline LPS levels were relatively invariant within subjects.
Correlation between successive serum baseline LPS levels from 15 subjects. There was a strong correlation between the two baseline LPS levels within subjects (r = 0.752; P = 0.001; confidence ellipse of P = 0.6827).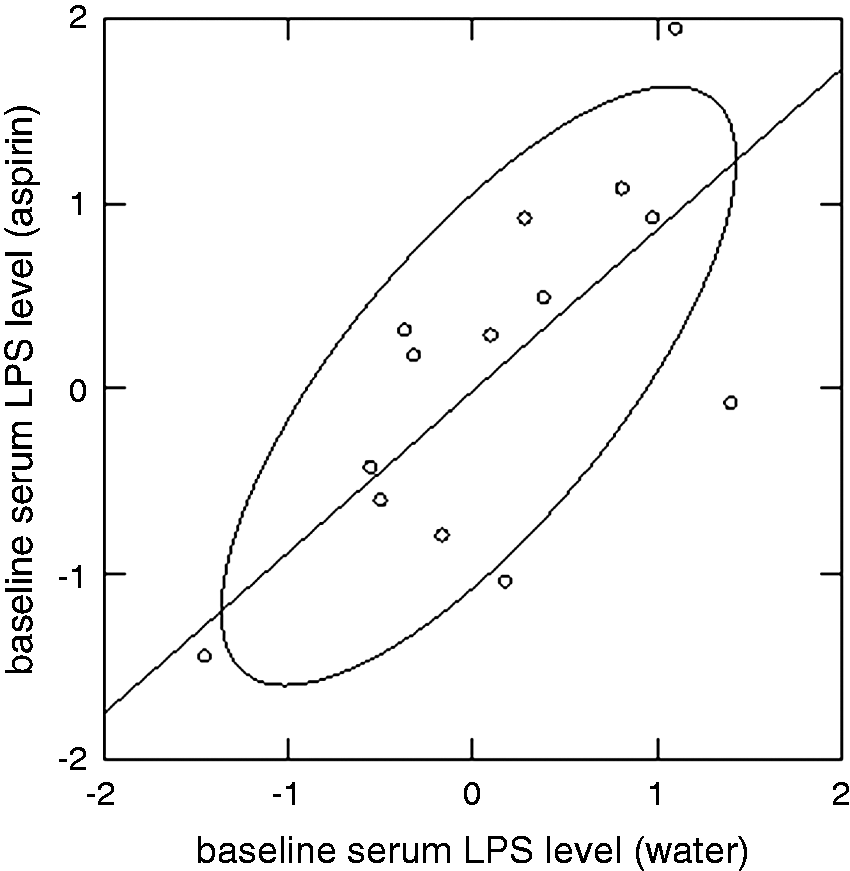
LPS levels at baseline and 4 h after taking water or aspirin solution.
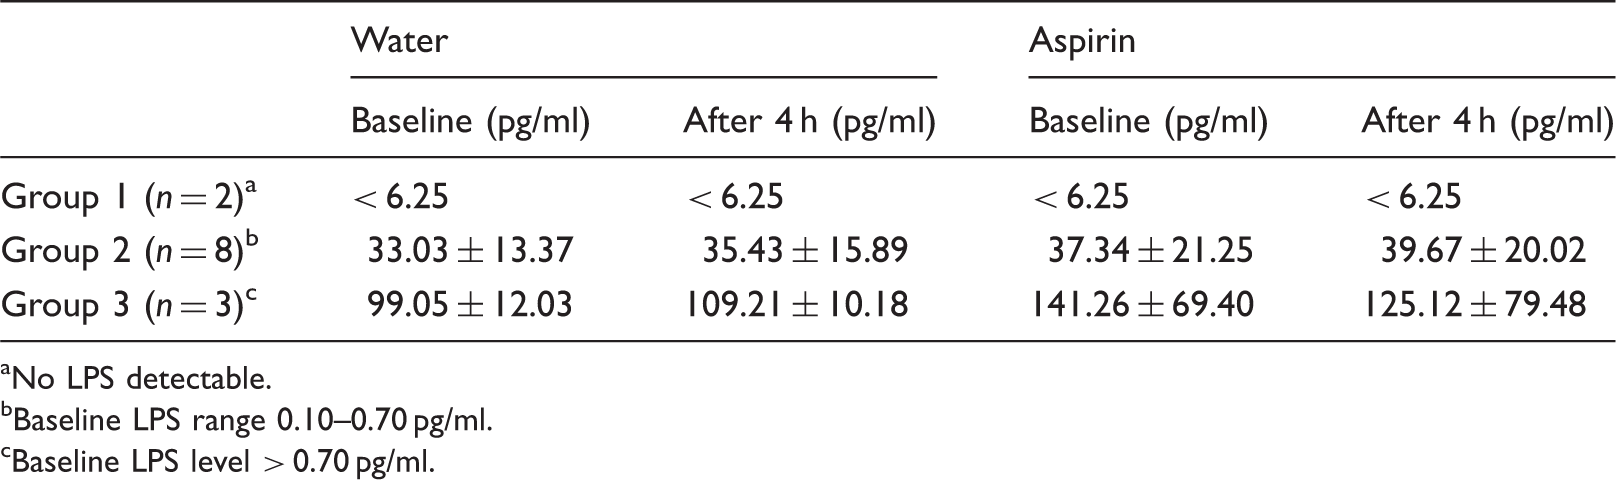
aNo LPS detectable.
bBaseline LPS range 0.10–0.70 pg/ml.
cBaseline LPS level > 0.70 pg/ml.
The baseline serum LPS levels were not significantly correlated, either with body mass (kg), body fat (kg and %) or BMI (data not shown). Similarly, control LMRs were not correlated with either percentage of body fat or BMI (data not shown).
Six of 15 subjects reported that they did not consume any alcohol, seven of 15 subjects drank less than three alcoholic drinks/wk and two of 15 subjects drank between three and seven alcoholic drinks/wk. However, there were no significant differences in LPS levels and LMRs between these three groups of subjects (data not shown). No lipid fraction was detectable after centrifugation of serum samples taken from any of the subjects with either of the two treatments. Hence, the quantity of LPS contained within it could not be quantified.
Effect of aspirin on serum LPS levels
There were no significant differences on paired Student’s t-test between pooled baseline and post-treatment LPS levels after dosage with water. Similarly there were no significant differences between pooled baseline and post-treatment LPS levels after dosage with aspirin solution. Again, there were no significant differences between the three groups in the change in LPS levels from baseline values to those after consumption of water or in the change in LPS levels from baseline values to those after consumption of aspirin solution (Table 1). Similarly, there were no significant differences between treatments on doubly repeated ANOVA of baseline levels of LPS and post-treatment levels of LPS after consumption of water and after the consumption of aspirin solution. Neither were there differences when baseline values were subtracted from the corresponding post-treatment level for aspirin and water treatment and compared by one-way ANOVA (data not shown).
Bland–Altman plots of baseline LPS levels and those after the consumption of water showed that there were no consistent differences between the two sets of readings (Figure 2A). There was also no consistent relationship between the magnitude of the results and the difference between them. Hence, with the exception of the two very high readings, the water treatment (negative control) had no discernible effect on LPS levels.
Bland–Altman plots of LPS levels after consumption of (A) water and of (B) aspirin solution treatment. Neither plot shows a significant tend or shift from the mean with increase in magnitude of the mean. Larger (central) dashed line shows mean; smaller dashed lines are at 1 SD from the mean.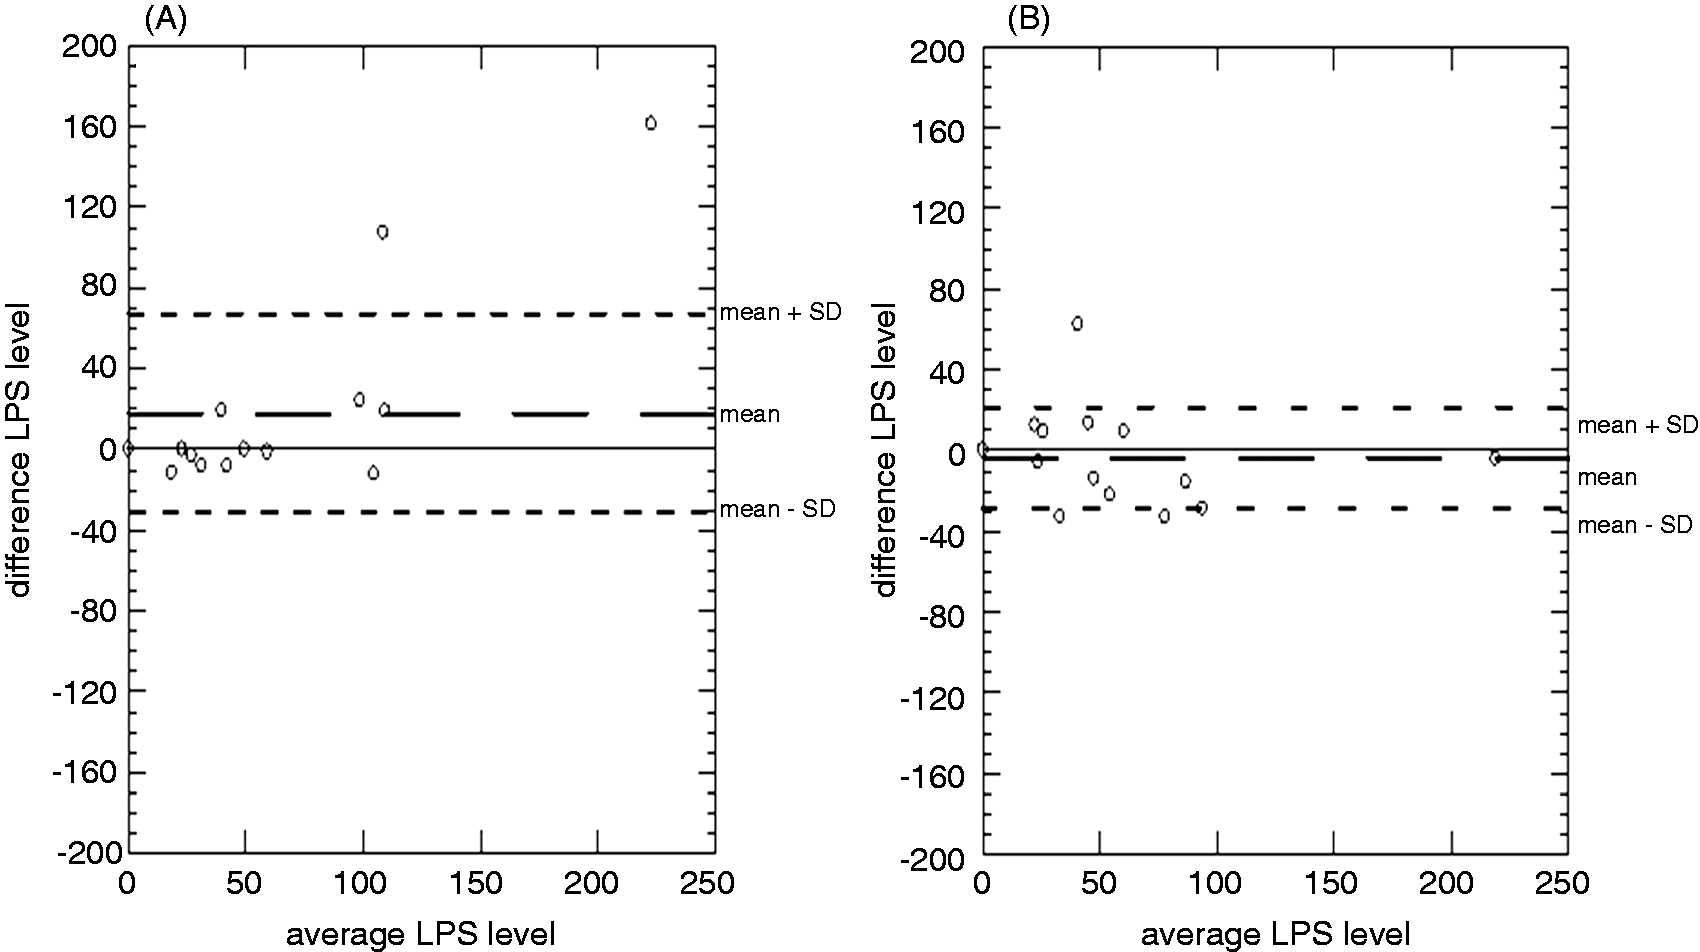
Similarly Bland–Altman plots of baseline LPS levels and those after the consumption of aspirin solution showed no consistent differences between the two readings (Figure 2B). Again, scatters of the differences between baseline LPS levels and those after treatment did not differ in any consistent manner between the water and the aspirin treatment.
The effect of aspirin on the excretion of lactulose and mannitol
The percentage of recoveries of the administered dose of mannitol were normally distributed whereas these for lactulose and the LMR required Asinh and logarithmic transformation respectively (Johnson Transformation in Minitab version 16) to render them amenable to parametric statistical analysis.
The 3-h excretion of lactulose was significantly increased after the consumption of aspirin on paired Student’s t-test (df = 14; t = −3.454; P = 0.004) compared with that after the consumption of water [median aspirin 0.090% of dose, 25–75% interquartile range (IQR) 0.065–0.135% of dose vs. median water 0.030% of dose, 25–75% IQR 0.010–0.045% of dose] (Figure 3A). Conversely, the 3-h excretion of mannitol was not significantly different after the consumption of aspirin from that after the consumption of water (median aspirin 6.294% of dose, 25–75% IQR 5.178–7.385% of dose vs. median water 6.229% of dose, 25–75% IQR 4.553–10.036% of dose) (Figure 3B). Concomitantly, the 3-h LMR was significantly greater (df = 14; t = −2.716; P = 0.017) after the consumption of aspirin treatment compared with that after the consumption of water (median aspirin 0.014, 25–75% IQR 0.009–0.037 vs. median water 0.005, 25–75% IQR 0.002–0.009) (Figure 3C). The elevated LMR of one subject in the water treatment group was due to a greatly reduced excretion of mannitol.
Box plots of percentage 3-h recovery of total dose of (A) lactulose and of (B) mannitol, and (C) change in LMR after consumption of water or of aspirin solution. The excretion of lactulose significantly increased (P = 0.004) after the consumption of the aspirin treatment. The excretion of mannitol after the consumption of water did not differ significantly from that after the consumption of aspirin. The LMR was significantly lower (P = 0.017) after consumption of aspirin compared with that after the consumption of water. * – value above 1 SD. ° – value above 2 SD.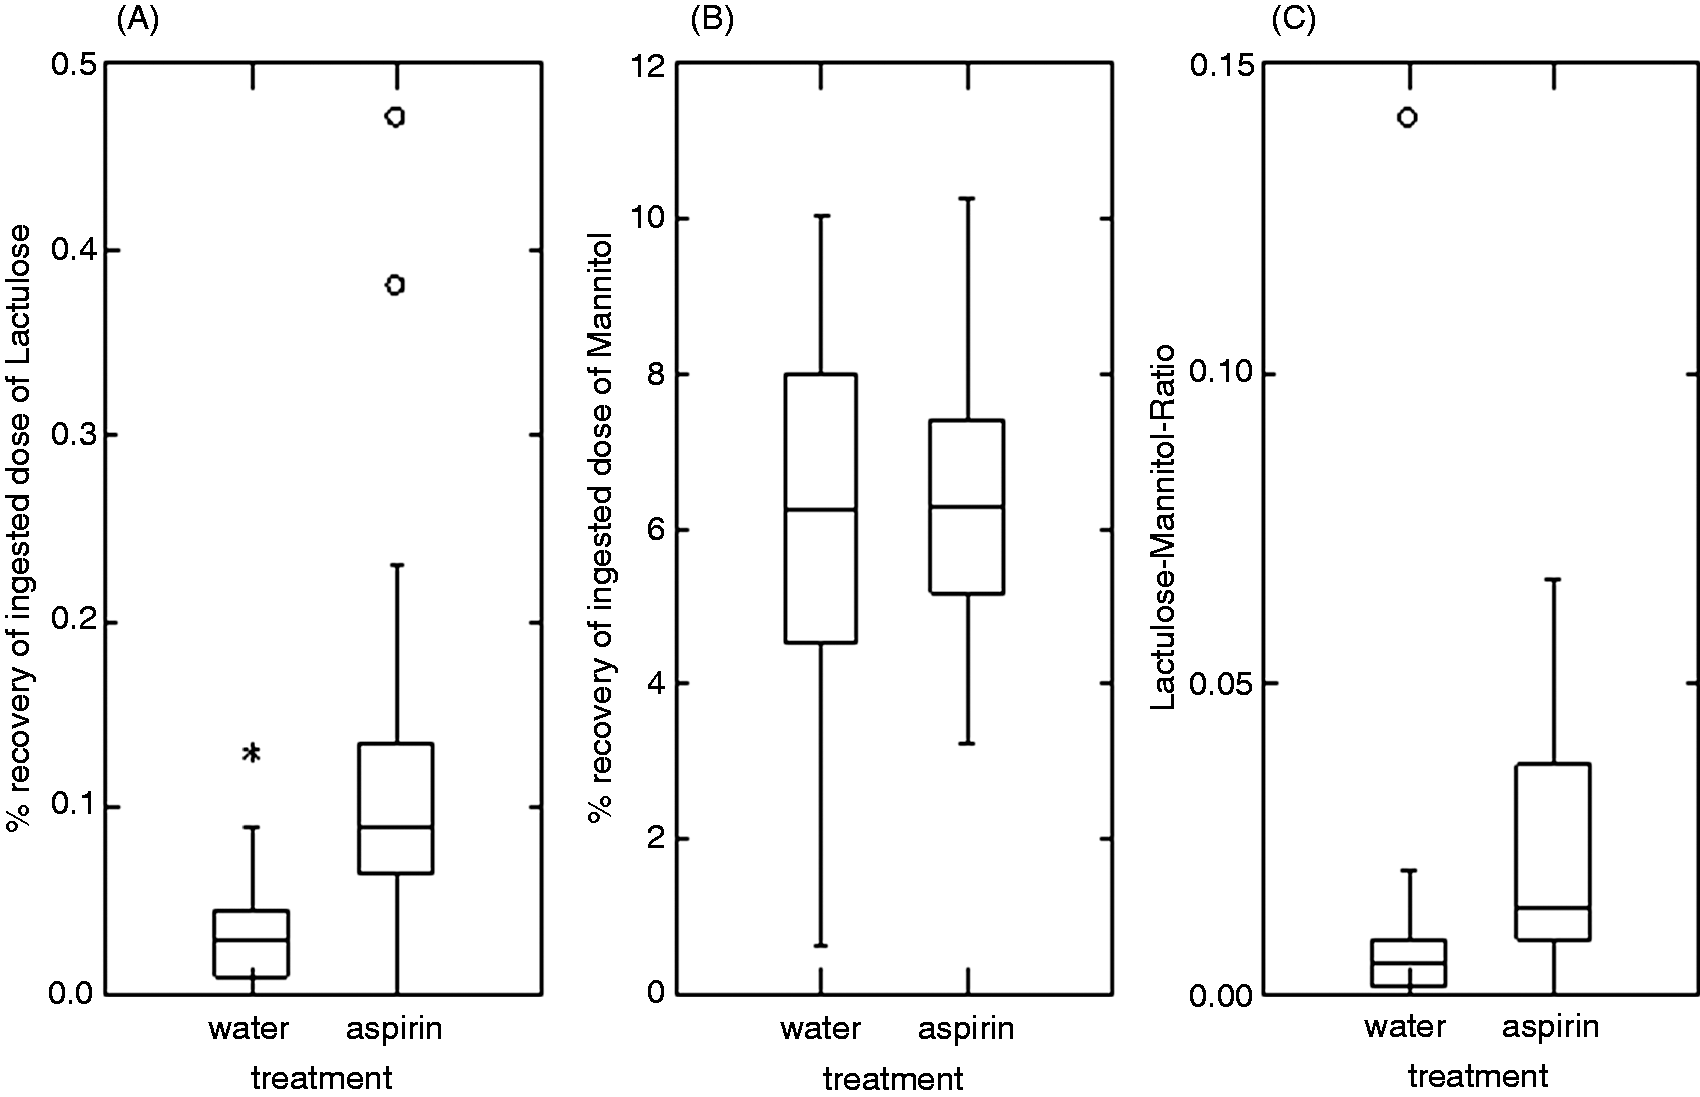
Correlation between lactulose excretion and serum LPS concentration
There was no significant correlation within subjects between baseline serum LPS levels and the percentage of lactulose excretion after consumption of water or after consumption of aspirin solution (data not shown). There was no significant correlation between the differences between baseline and post-treatment levels of LPS with those of lactulose excretion either after consumption of water or after consumption of aspirin solution (Figure 4A). There was also no significant correlation between baseline and post-treatment values for LMR and those of LPS (Figure 4B). Whilst there were three subjects with elevated recovery of lactulose after the consumption of water, the same subject did not have elevated baseline levels of LPS (above 70 µg/ml) before the consumption of water (although three other subject did). Together these results indicate that serum baseline LPS levels were not influenced by paracellular permeability in the small intestine.
Correlations between percentage recovery of (A) lactulose or (B) LMR value with differences in LPS levels prior to and after the consumption of aspirin solution (a) or water (w). There was no correlation between the recovery of lactulose and the difference in LPS level over the two treatments. Similarly, the LMR did not correlate with the difference in LPS level over the two treatment (confidence ellipse of P = 0.6827).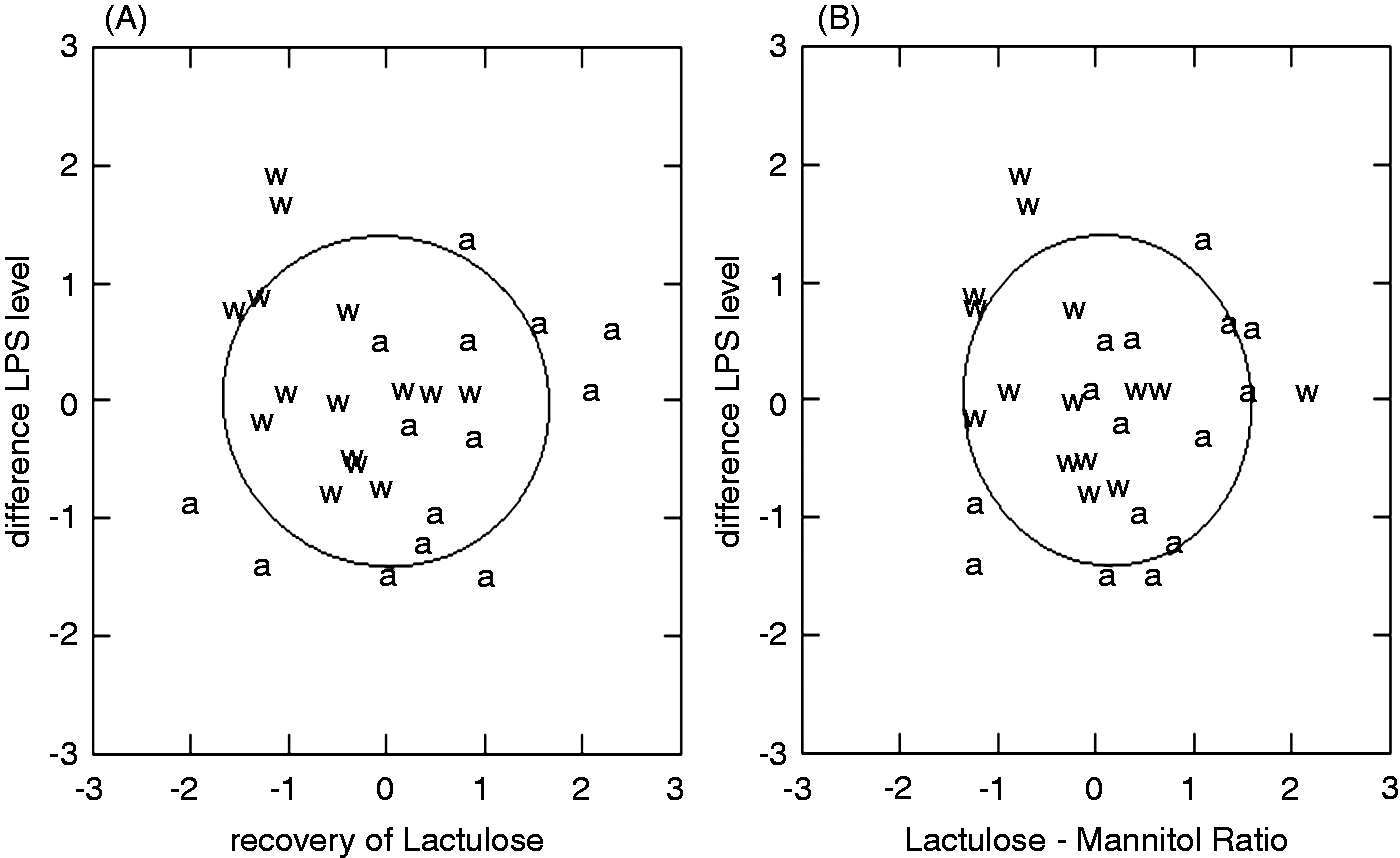
Discussion
This is the first study to determine the relationship between paracellular intestinal permeability, as measured by lactulose permeability, and circulating levels of LPS. As the levels of serum LPS that were determined after the consumption of plain water did not differ from those determined prior to the consumption of water it is evident that the consumption of the lactulose and mannitol solution had no effect on circulating levels of LPS. This result is similar to that reported with actively absorbed sugars such as Glucose. 6 Hence, our method is suitable for the evaluation of any correlation between the levels of LPS in the systemic circulation and the permeability of the gut wall.
The high degree of variation in the baseline levels of serum LPS in our sample of 15 apparently healthy female subjects fits with reports of similar levels of variation in plasma endotoxin in 201 men between the ages of 45 and 64 yr. 26 Our results, showing no correlations of serum LPS levels with either percentage of body fat or BMI, are in agreement with those of other studies.26,27 However it is noteworthy, that the range of percentage of body fat in our subjects (13.5–40.7%) did not include morbidly obese subjects, i.e. these with BMIs >30, while other studies investigating endotoxin levels have included morbidly obese subjects with a BMIs >30. 8
The finding that the consumption of 600 mg aspirin increases gut permeability, as determined by elevation of the urinary excretion of lactulose, is in line with previous reports.15,16 Hence, local, aspirin-induced inflammation of the intestinal mucosa is thought to increase mucosal paracellular permeability.15–17,19,28 However, the fact that the levels of LPS in the systemic circulation were not significantly elevated after consumption of aspirin indicates that such mucosal damage does not influence the ability of LPS to transit from the lumen to the systemic circulation. It is conceivable that an aspirin-induced increase in paracellular permeability did allow greater amounts of LPS to enter the portal circulation via the paracellular route but that this LPS was removed by the liver and hence did not enter the systemic circulation. The latter hypothesis is supported by the finding that significant levels of endotoxin were found in the portal venous blood but not in the systemic blood of human subjects at laparotomy, 29 and similarly by the finding that the levels of endotoxin in portal venous blood were elevated in genetically obese mice with increased intestinal permeability. 30 The systemic venous blood of human subjects with hepatic cirrhosis contains significant levels of endotoxin, 31 while that of subjects with a healthy liver does not. 29 In addition, the concentration of endotoxin in systemic venous blood is reported to be significantly correlated with the level of liver damage in human subjects with non-alcoholic liver disease. 32 Therefore, it seems likely that, in healthy subjects, any LPS in the portal venous blood will be detoxified or removed in the liver before it enters the systemic circulation.29,30
It is also possible that LPS is absorbed transcellularly from the gut lumen within fat micelles and incorporated into the chylomicrons.7,11 Hence, LPS may transit with the chylomicron fraction, via the lymphatic system, to the systemic circulation and avoid detoxification in the liver.33,34 As our subjects had been fasted overnight their venous blood did not contain a significant chylomicron fraction. Hence, further work is required to determine whether the paracellular transit of lipid associated LPS into the lymphatic and systemic circulation is elevated after the consumption of aspirin.
It is noteworthy that this study was conducted on non-smoking young healthy females and the results may not necessarily apply to males or to persons with BMIs >30. Hence, for example, the magnitude of the effect of a single dose of aspirin may differ in smokers and gut permeability may change in early pregnancy. 35 Again as the level of body fat differs in males the relation of this with LPS and with LMR may differ.
Footnotes
Funding
This research received no specific grant from any funding agency in the public, commercial or not-for-profit sectors. Anne Gnauck is a recipient of the DAAD (German Academic Exchange Services) scholarship and the Massey University Vice Chancellor scholarship.
Acknowledegments
We would like to thank Chris Booth for her technical expertise in Bod Pod and for her help during the human trial of the study, and Michelle McGrath and Ivana Sequeira for their technical expertise in HPLC.