
Abstract
This study examined the effects of increasing energy availability from both dextrose and lipid treatments on the pro-inflammatory response to LPS in Holstein steers. Steers were randomly assigned to one of three groups: saline at 0.5 ml/kg body weight (Control) or 50% dextrose [0.5 ml/kg body weight (Dextrose) to mimic calm cattle’s response to LPS] administered immediately prior to LPS (0.5 µg/kg body weight at 0 h) or continuous lipid emulsion infusion from −1 to 6 h [Intralipid 20% (Baxter, Deerfield, IL USA); 0.5 ml/kg/hr (Lipid) to mimic temperamental cattle]. Concentrations of non-esterified fatty acids (NEFA) were greater in Lipid compared with Control and Dextrose steers. A greater decrease in the change in rectal temperature, relative to baseline, was observed in response to LPS in Dextrose in comparison to control and Lipid steers. Cortisol was greater in Lipid than Dextrose and Control steers from −0.5 to 0 h, yet decreased from 0.5 to 5.5 h relative to LPS challenge. Concentrations of IL-6 were decreased in Lipid steers compared with Dextrose and Control steers, and were decreased in Dextrose compared with Control steers post-LPS challenge. These data suggest that increasing circulating NEFA using an exogenous Lipid emulsion may modulate the pro-inflammatory response in steers.
Introduction
In order to provide the necessary energy required for an activated and functional immune system, energy requirements of the body are shifted through changes in metabolism and energy redistribution. Specifically, Kluger and Rothenburg reported that a 10–13% increase in metabolizable energy is required to increase body temperature 1℃. 1 This increased energy requirement does not account for the energy necessary for other actions of the immune system, including antibody and acute phase protein production. Therefore, the immune response is very energy demanding, which can lead to the down-regulation of non-essential systems that are not as essential for the immediate survival of the animal, such as reproduction or growth. This redistribution of energy to the immune response and away from reproduction and growth can ultimately influence production efficiency and thus production costs.
Natural variations, such as sex, breed and temperament, can influence metabolic responses in cattle. In particular, temperamental cattle naturally may require more energy for normal maintenance due to their ‘high strung’ nature, perhaps due to alterations in glucose uptake and utilization, and gluconeogenesis. We previously reported differences in the metabolic response to a LPS (endotoxin) challenge in calm versus temperamental beef bulls. 2 Specifically, cattle classified as temperamental maintained elevated (≥ 0.40 mmol/l) non-esterified fatty acid (NEFA) concentrations prior to and throughout the LPS challenge period compared with calm bulls. 2 The increased NEFA concentrations suggest that the temperamental cattle are in a negative energy balance, which is inaccurate as cattle in this study were fed ad libitum. In contrast, calm bulls produced the greatest glucose response to the LPS challenge compared with temperamental bulls, while there was no increase in glucose concentrations post-LPS in temperamental bulls. These data suggest that the altered metabolic parameters observed between calm and temperamental bulls may have influenced the differences in the physiological and innate immune responses (i.e. decreased rectal temperature, sickness behavior and stress hormone responses) to LPS observed in these same bulls. 3 Moreover, we hypothesize that metabolic alterations that result in greater energy availability may provide an immunostimulatory or immunoprotective function while providing an energy-dense source to be accessible to the immune system upon pathogen exposure and immune system activation.
Preliminary unpublished data from our laboratory have demonstrated that a continuous infusion of a Lipid emulsion (Intralipid 20%; Baxter, Deerfield, IL USA) can increase serum NEFA concentrations in dairy steers fed ad libitum to values similar to those observed in temperamental beef bulls (i.e. ≥ 0.4 mmol/l). Based on previously observed changes in the metabolic and innate immune responses in temperamental bulls, the objective of this study was to determine if increasing energy availability through either a continuous Intralipid infusion (to mimic temperamental bulls) or through a bolus injection of Dextrose (to mimic calm bulls response to LPS) would alter the innate immune response following a LPS challenge.
Materials and methods
Experimental design
All experimental procedures were carried out in compliance with the Guide for the Care and Use of Agricultural Animals in Research and Teaching and approved by the Institutional Animal Care and Use Committee at Mississippi State University.
Holstein steers (n = 21; 165 ± 5 kg body weight) were acquired from a local dairy farm and transported to the Mississippi State University Beef Center. Upon arrival, steers were randomly assigned to one of three treatments (n = 7 per treatment): (1) administered 0.5 ml/kg body weight saline immediately prior to LPS challenge at 0 h (Control); (2) administered 0.5 ml/kg body weight 50% dextrose solution immediately prior to LPS challenge at 0 h (Dextrose); or (3) continuous infusion of a Lipid emulsion (Intralipid 20%; Baxter) at a rate of 0.5 ml/kg/hr from −1 to 6 h relative to LPS challenge at 0 h (Lipid). The doses of dextrose and Intralipid were selected to increase peak post-LPS glucose concentration, and pre- and post-LPS NEFA concentrations to values similar to those previously reported for calm and temperamental bulls pre- and post-LPS. 2
On d 1, steers were fitted with indwelling jugular vein cannulas and indwelling rectal temperature (RT) probes that recorded RT at 1-min intervals throughout the duration of the study.2,4 Folldue these procedures steers were placed in tie stalls for the remainder of the study. On d 0, blood samples (9 ml) were collected into Sarstedt tubes (Sarstedt Inc., Newton, NC, USA) containing no additive every 30 min beginning at −2 h and continuing to 8 h after administration of LPS at 0 h (0.5 µg/kg body weight LPS from Escherichia coli O111:B4; Sigma Aldrich, St. Louis, MO, USA). Blood samples were allowed to clot for 30 min at room temperature and were then centrifuged at 1500 g for 20 min at 4℃. Isolated serum was stored at −80℃ until analyzed for NEFA, glucose, cortisol and cytokine concentrations.
Serum analysis
All serum analyses were performed in duplicate. Concentrations of NEFA were determined by modification of the enzymatic HR Series NEFA-HR (2) assay (Wako Diagnostics, Richmond, VA, USA) to fit a 96-well format. Briefly, 200 µl of prepared Color Reagent A were added to 5 µl of serum or prepared standards in a 96-well plate. Plates were incubated at 37℃ for 5 min and the absorbance read using a spectrophotometer at 505 nm (Powerwave 340; BioTek, Winooski, VT, USA). Next, 100 µl of prepared Color Reagent B was added to all wells on the 96-well plate. Plates were incubated for an additional 5 min and read for a second time using a plate reader at 505 nm. Concentrations of NEFA were determined by comparing unknown samples to at standard curve of known NEFA concentrations. The minimum detectable concentration was 0.0014 mmol/l, and the intra- and inter-assay coefficients of variation were 6.7% and 9.2%, respectively. Data are presented as the concentration in mmol/l.
Glucose concentrations were determined by modification of the enzymatic Autokit Glucose (Wako Diagnostics) to fit a 96-well format. Briefly, 300 µl of prepared working solution was added to 2 µl of serum or prepared standards in a 96-well plate. Plates were incubated at 37℃ for 5 min and then read using a plate reader at 505 nm. The concentration of glucose was determined by comparing unknown samples with a standard curve of known glucose concentrations. The minimum detectable concentration was 3.8 mg/dl, and the intra- and inter-assay coefficients of variation were 7.7% and 10.8%, respectively. Data are presented as the concentration in mg/dl.
Serum concentrations of cortisol were determined by enzyme immunoassay using a commercially available kit according to the manufacturer’s instructions (Arbor Assays, Ann Arbor, MI, USA). Serum concentrations of cortisol were determined by comparison with a standard curve of known cortisol concentrations. The minimum detectable concentration was 45.4 pg/ml, and intra- and inter-assay coefficients of variation were 9.1% and 20.1%, respectively. Data are presented as the concentration in ng/ml.
Serum cytokine concentrations (TNF-α, IFN-γ and IL-6) were determined by a custom bovine 3-plex sandwich-based chemiluminescence ELISA kit (Searchlight-Aushon BioSystems Inc., Billerica, MA, USA). The minimum detectable concentrations were 0.5, 0.1 and 3.3 pg/ml for TNF-α, IFN-γ and IL-6, respectively. All intra-assay coefficients of variation were < 11% and all inter-assay coefficients of variation were < 22% for all assays. Data are presented as the concentration in pg/ml.
Statistical analysis
Prior to analysis, RT data were averaged into 5-min intervals. Data were tested for normality of the residuals by evaluating the Shapiro-Wilk statistic using the UNIVARIATE procedure in SAS (SAS Institute, Cary, NC, USA). Data were analyzed by the MIXED procedure of SAS specific for repeated measures. Treatment, time and the treatment × time interaction were included as fixed effects, with steer within treatment included as the experimental unit. If treatment or the treatment × time interaction were significant (P ≤ 0.05), data were further analyzed separately in three different time periods: Baseline—time period prior to application of treatments (−3 h to −1 h); Infusion—time period prior to the LPS challenge when Lipid steers began receiving Intralipid (−1 h to 0 h); and LPS Challenge—time period following administration of LPS (0–8 h). Due to differences in baseline, RT data were analyzed as the change in RT relative to baseline (−3 h to −1 h) values, with average baseline RT values included as a covariate. When main effects were significant, specific treatment comparisons were made using the PDIFF option in SAS, with P ≤ 0.05 considered significant and 0.05 < P ≤ 0.10 considered a tendency. All data are presented as the least squares mean (LSM) ± SEM.
Results
Serum NEFA concentrations
There was a treatment (P < 0.01), time (P < 0.01) and a treatment × time interaction (P < 0.01) for serum NEFA concentrations (Figure 1). Concentrations of NEFA increased (P = 0.01) in the Lipid steers at −0.5 h pre-LPS challenge and remained elevated through the duration of the study (8 h; P < 0.01) compared with baseline. These concentrations were also greater (P ≤ 0.02) than Control and Dextrose steers from −0.5 h pre-challenge through 6 h (P < 0.01) post-challenge, which coincided with the infusion of Intralipid (from −1 h to 6 h). Due to the significant treatment and treatment × time interaction, the data were further analyzed in time periods.
Effect of saline (0.5 ml/kg; Control) or Dextrose bolus injection (0.5 ml/kg; Dextrose) immediately prior to LPS (0.5 µg/kg body weight at 0 h) administration, or continuous infusion of a Lipid emulsion (Intralipid 20%, 0.5 ml/kg/hr; Lipid) from −1 h to 6 h on serum concentrations of NEFA (Control n = 7, Dextrose n = 7, Lipid n = 7). Data are presented as the LSM ± SEM. *P < 0.01 Lipid differs from Control and Dextrose steers.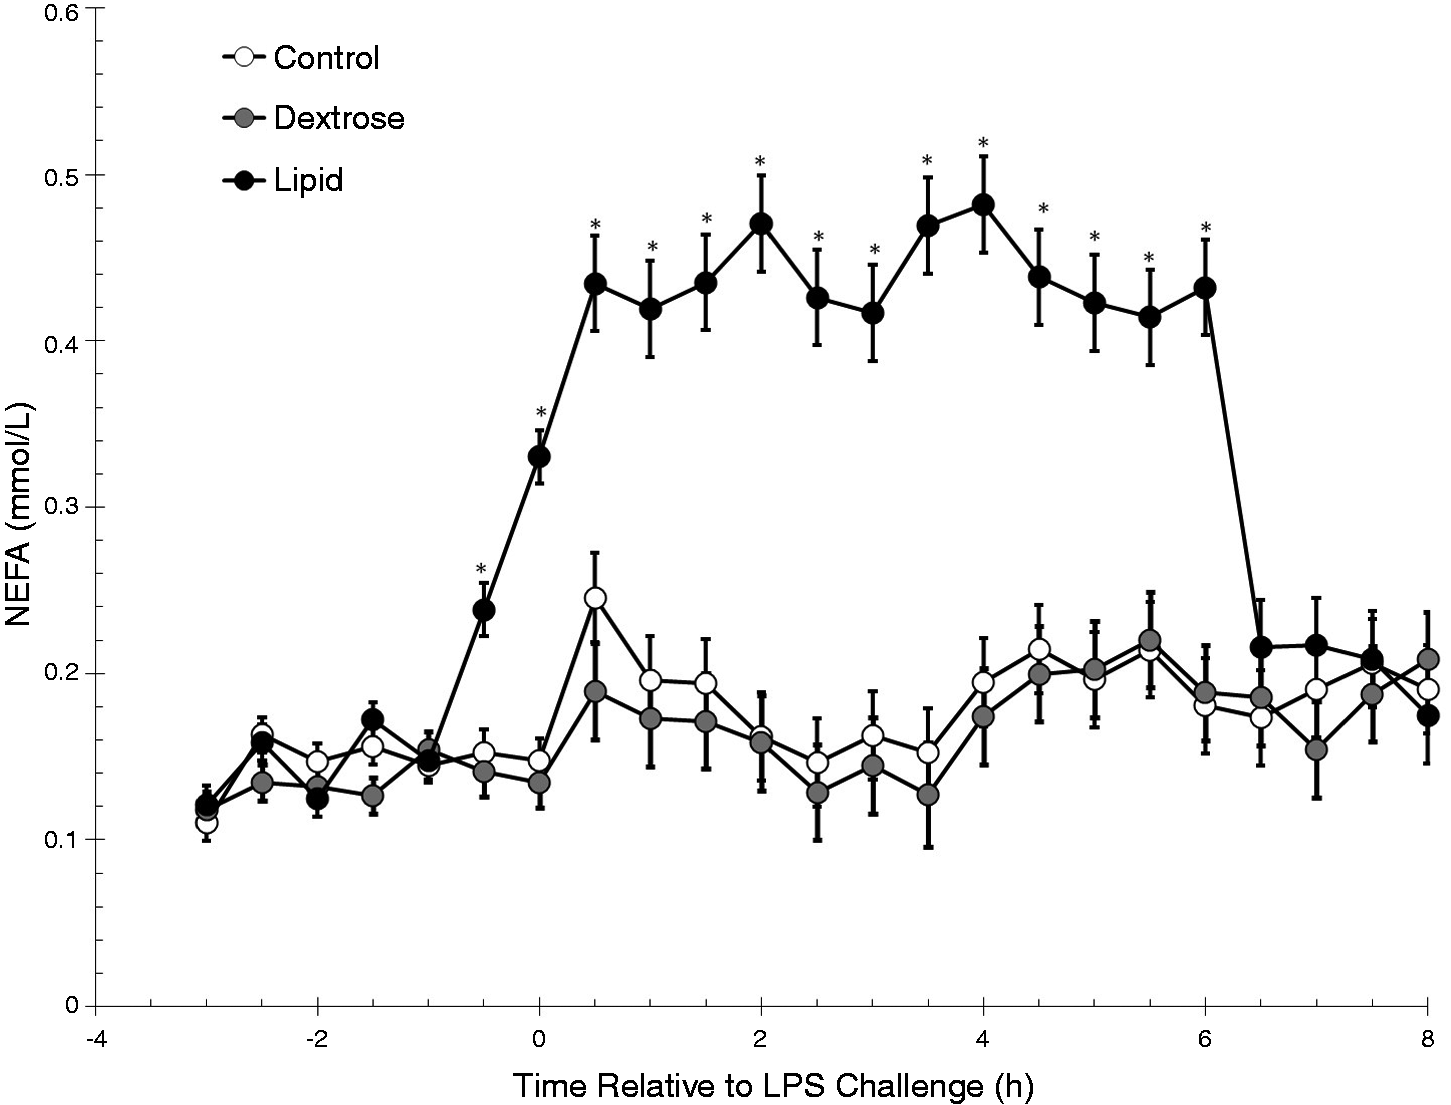
Prior to infusion of the Intralipid there was no difference between the three groups (treatment: P = 0.16; treatment × time interaction: P = 0.11) for serum NEFA concentrations. However, NEFA concentrations increased (P < 0.01) over time in all three groups. A treatment × time interaction was observed during the Infusion period (P < 0.01). Specifically, NEFA concentrations were greater (P < 0.01) in Lipid steers compared with Control and Dextrose steers from ‐0.5 h to 0 h during the Infusion period. In response to LPS administration at time 0 h, a treatment × time interaction (P < 0.01) for NEFA concentrations was observed. Similar to the Infusion period, NEFA concentrations were greater (P < 0.01) in Lipid steers than Control and Dextrose steers from 0 h to 6 h post-challenge.
Serum Glucose concentrations
There was no treatment effect (P = 0.30) or treatment × time interaction (P = 0.50) for serum glucose concentrations (Figure 2). There was a time effect (P < 0.01), with glucose concentrations increasing (P < 0.01) at 0.5 h (compared with 0 h) and remaining elevated through 5 h post-challenge (P ≤ 0.04 compared with 0 h). At 6 h post-challenge, Glucose concentrations decreased below 0-hr values and remained suppressed for the remainder of the study (P ≤ 0.05).
Effect of saline (0.5 ml/kg; Control) or Dextrose bolus injection (0.5 ml/kg; Dextrose) immediately prior to LPS (0.5 µg/kg body weight at 0 h) administration, or continuous infusion of a lipid emulsion (Intralipid 20%, 0.5 ml/kg/hr; Lipid) from −1 h to 6 h on serum concentrations of glucose (Control n = 7, Dextrose n = 7, Lipid n = 7). Data are presented as the LSM ± SEM.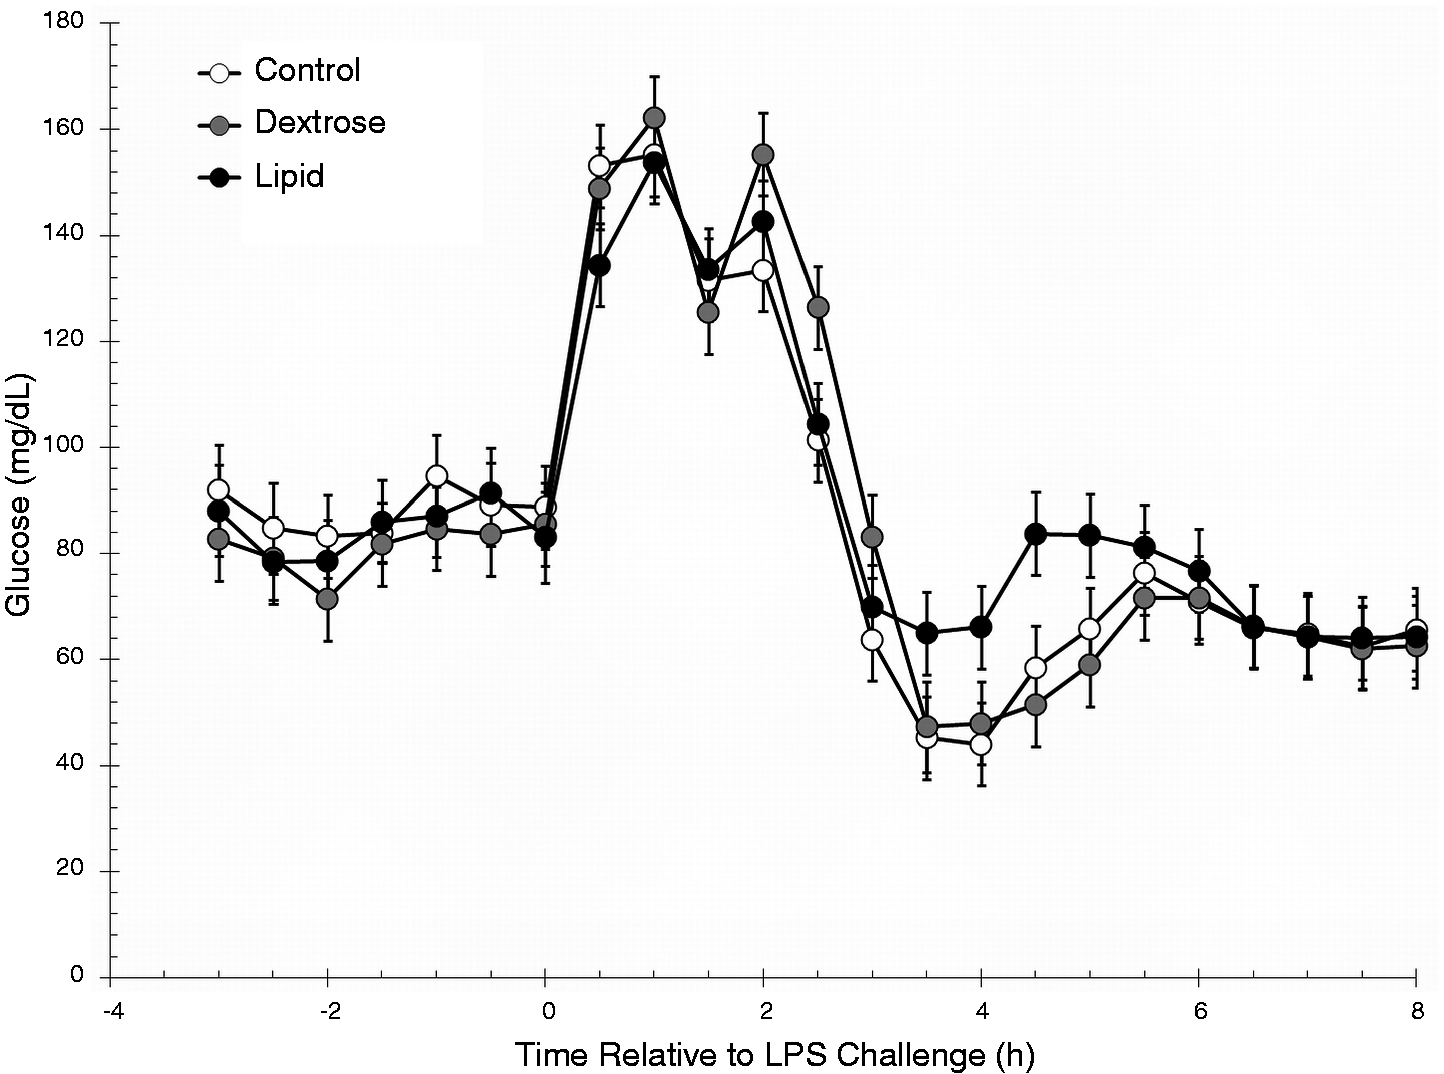
Rectal temperature
During the Baseline period (−180 to −60 min) there were effects of treatment (P < 0.01) and time (P < 0.01), but no treatment × time interaction (P = 1.00) for RT. Lipid steers (39.30 ± 0.01℃) had greater (P < 0.01) Baseline RT than Dextrose (39.20 ± 0.01℃) and Control steers (39.18 ± 0.01℃). Additionally, Dextrose steers had greater Baseline RT than Control steers (P < 0.01).
Due to the treatment differences in RT values during the Baseline period, the Infusion and LPS Challenge periods were analyzed as the change in RT relative to average Baseline RT values (Figure 3). During the Infusion period, there was no effect of treatment (P = 0.23), time (P = 0.35) or a treatment × time interaction (P = 1.00) for the change in RT relative to Baseline values (Figure 3). However, Baseline values, included as a covariate, did account for a significant amount of variation in the model (P = 0.02).
Effect of saline (0.5 ml/kg; Control) or Dextrose bolus injection (0.5 ml/kg; Dextrose) immediately prior to LPS (0.5 µg/kg body weight at 0 h) administration, or continuous infusion of a lipid emulsion (Intralipid 20%, 0.5 ml/kg/hr; Lipid) from −1 h to 6 h on the change in RT relative to baseline values (−3 h to −1 h; Control n = 7, Dextrose n = 7, Lipid n = 7). Data are presented as the LSM ± SEM.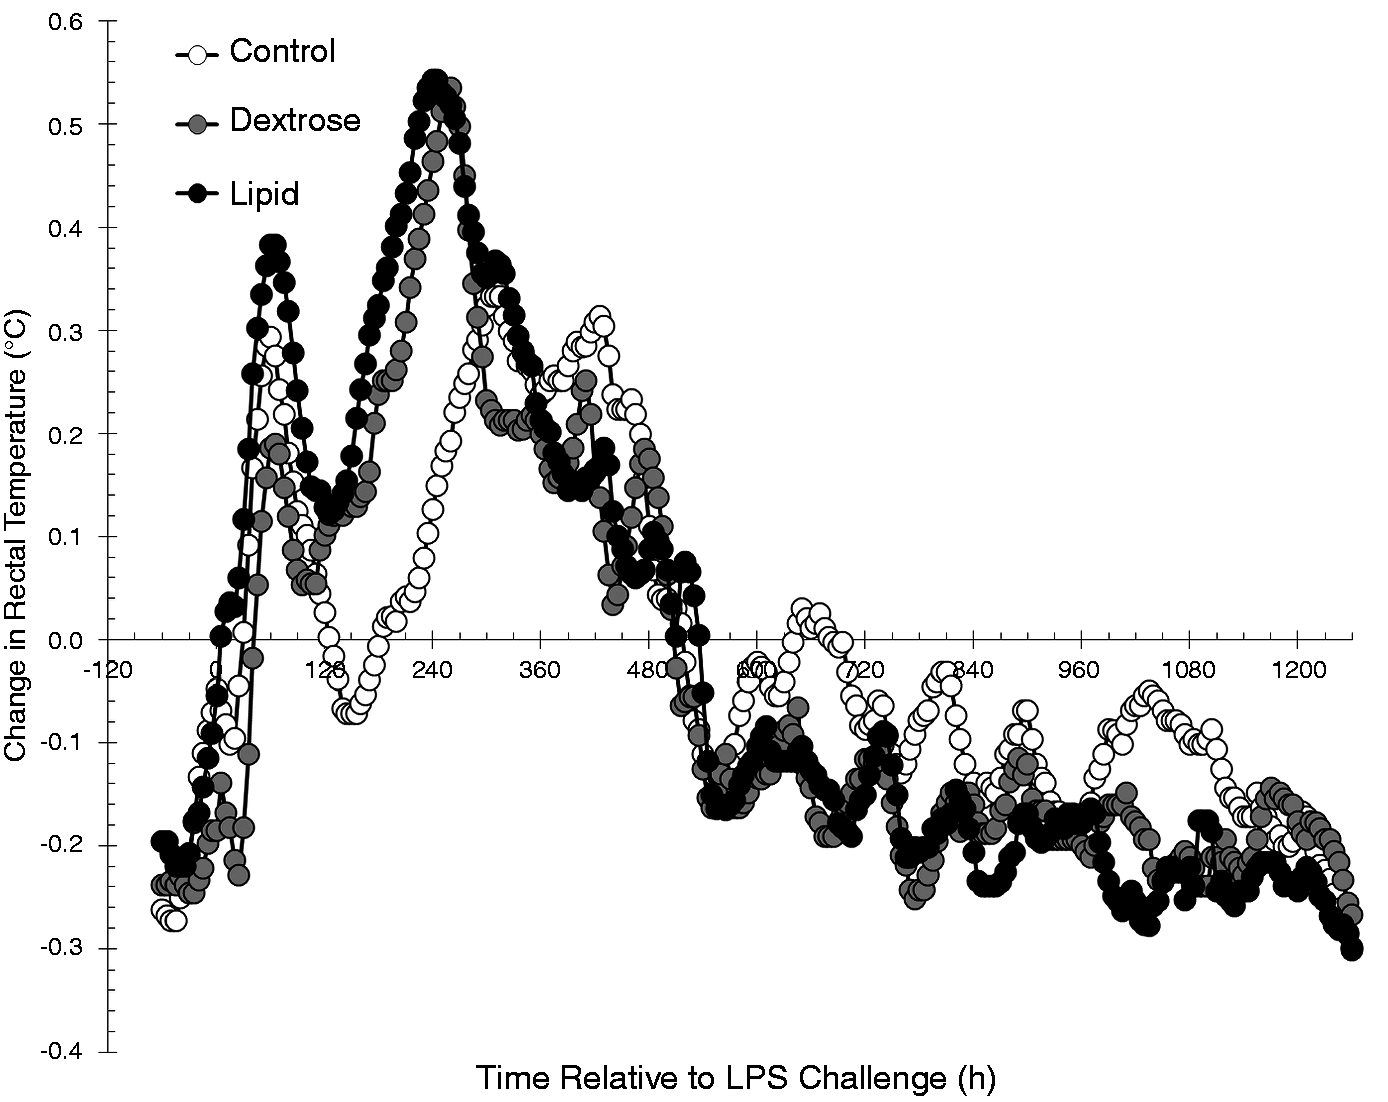
In response to the LPS challenge, there were effects of treatment (P = 0.01) and time (P < 0.01), but no treatment × time interaction (P = 1.00) on the change in RT relative to Baseline values. Dextrose steers (−0.031 ± 0.007℃) had a greater (P ≤ 0.02) decrease in RT post-LPS compared with Lipid (−0.007 ± 0.007℃) and Control steers (−0.003 ± 0.007℃). There was no difference in the change in RT following LPS challenge between Control and Lipid steers (P = 0.68). Additionally, Baseline RT values, included as a covariate, accounted for a significant amount of variation in the model following LPS administration (P < 0.01).
Serum cortisol concentrations
Treatment (P = 0.03) and time (P < 0.01) effects and a treatment × time interaction (P < 0.01) were observed for serum cortisol concentrations; therefore, the data were further analyzed by time periods. Baseline serum cortisol concentrations were similar between the three treatment groups (P = 0.54) and were not affected by a treatment × time interaction (P = 0.41), but were affected by time (P = 0.02; Figure 4). During the Infusion period, there was an effect of treatment (P = 0.01), and a tendency (P = 0.06) for a treatment × time interaction, but there was no effect of time (P = 0.13). Specifically, concentrations of cortisol were greater in Lipid steers than Control and Dextrose steers (P ≤ 0.03) at −0.5 h and 0 h. In the LPS challenge period, there was a treatment × time interaction (P < 0.01) for serum cortisol concentrations. Cortisol concentrations were decreased (P ≤ 0.04) in Lipid steers compared with Control and Dextrose steers from 4.5 h to 5.5 h, and Lipid steers had decreased (P = 0.03) cortisol compared with Dextrose steers at 6.5 h after LPS administration.
Effect of saline (0.5 ml/kg; Control) or Dextrose bolus injection (0.5 ml/kg; Dextrose) immediately prior to LPS (0.5 µg/kg body weight at 0 h) administration, or continuous infusion of a lipid emulsion (Intralipid 20%, 0.5 ml/kg/hr; Lipid) from −1 h to 6 h on serum concentrations of cortisol (Control n = 7, Dextrose n = 7, Lipid n = 7). Data are presented as the LSM ± SEM. **P ≤ 0.04 Lipid differs from Control and Dextrose steers; *P = 0.03 Lipid differs from Dextrose steers.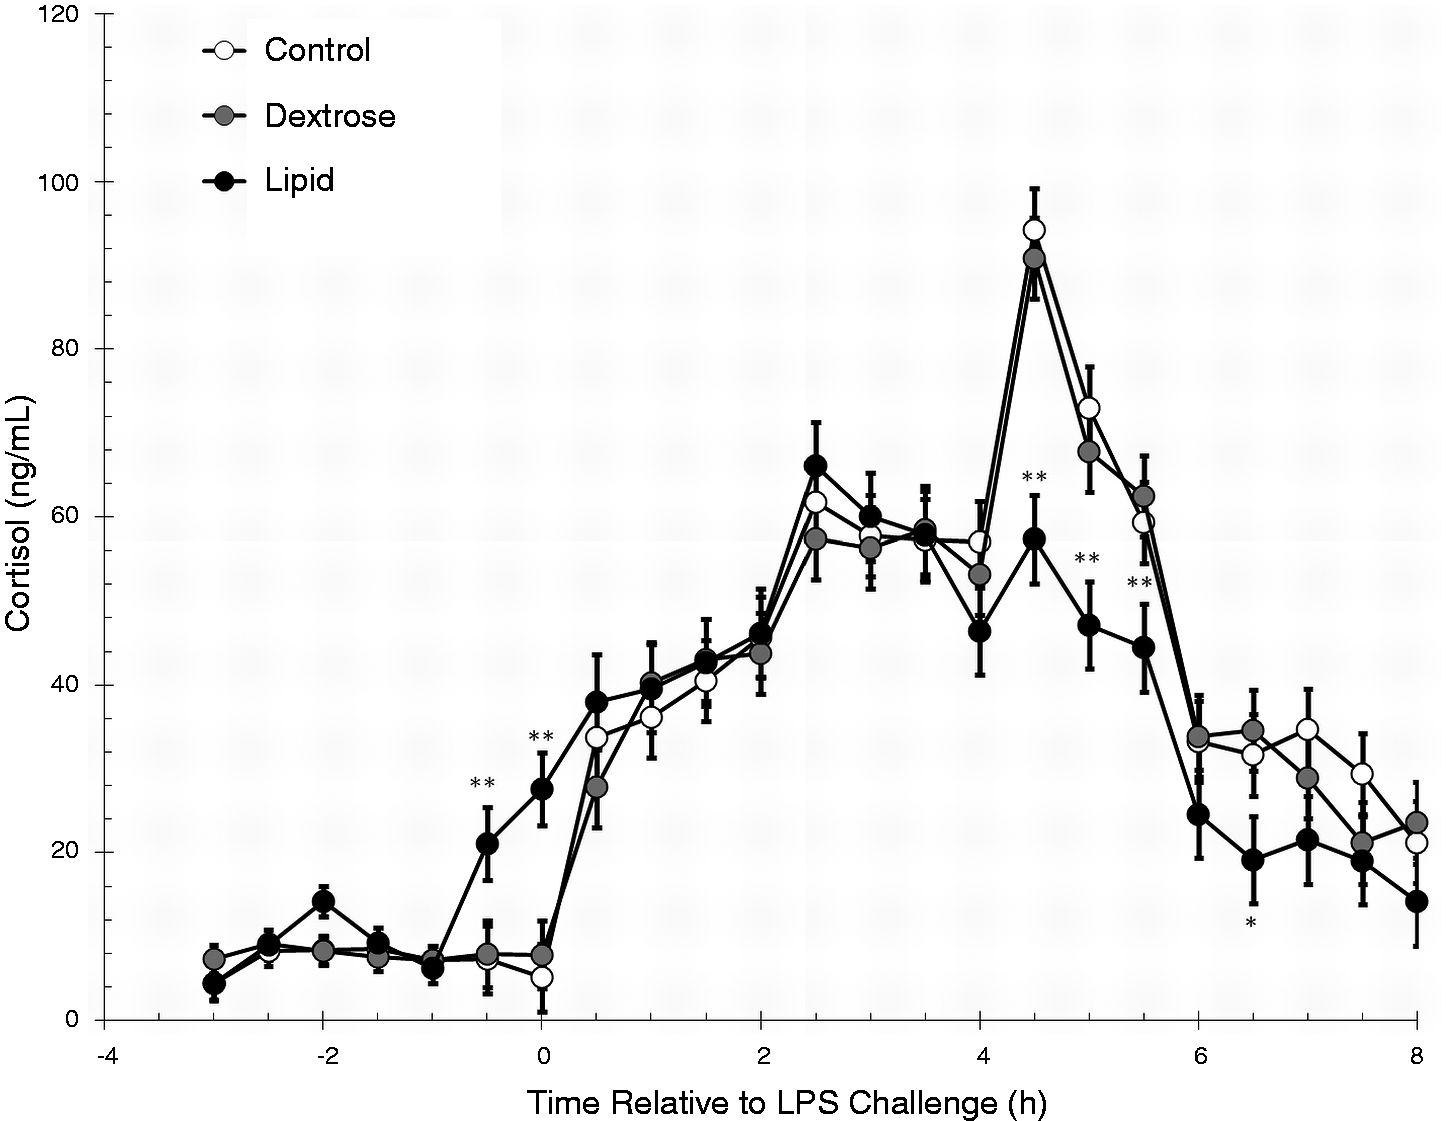
Serum cytokine concentrations
Serum concentrations of TNF-α were not affected by treatment (P = 0.24) or by a treatment × time interaction (P = 0.99), but were affected by time (P < 0.01; Figure 5A). Specifically, concentrations of TNF-α increased (P < 0.01) 1 h after LPS administration compared with time 0 h values, and remained elevated through 2.5 h post-challenge (P = 0.01) before returning to Baseline values.
Effect of saline (0.5 ml/kg; Control) or dextrose bolus injection (0.5 ml/kg; Dextrose) immediately prior to LPS (0.5 µg/kg body weight at 0 h) administration, or continuous infusion of a lipid emulsion (Intralipid 20%, 0.5 ml/kg/hr; Lipid) from −1 h to 6 h on serum concentrations of cytokines. (A) TNF-α; (B) IFN-γ; (C) IL-6 (Control n = 7, Dextrose n = 7, Lipid n = 7). Data are presented as the LSM ± SEM. ***P ≤ 0.05 all three treatment groups differ; **P ≤ 0.05 Control differs from Dextrose and Lipid treatments; *P ≤ 0.03 Control and Dextrose treatments differ from Lipid; 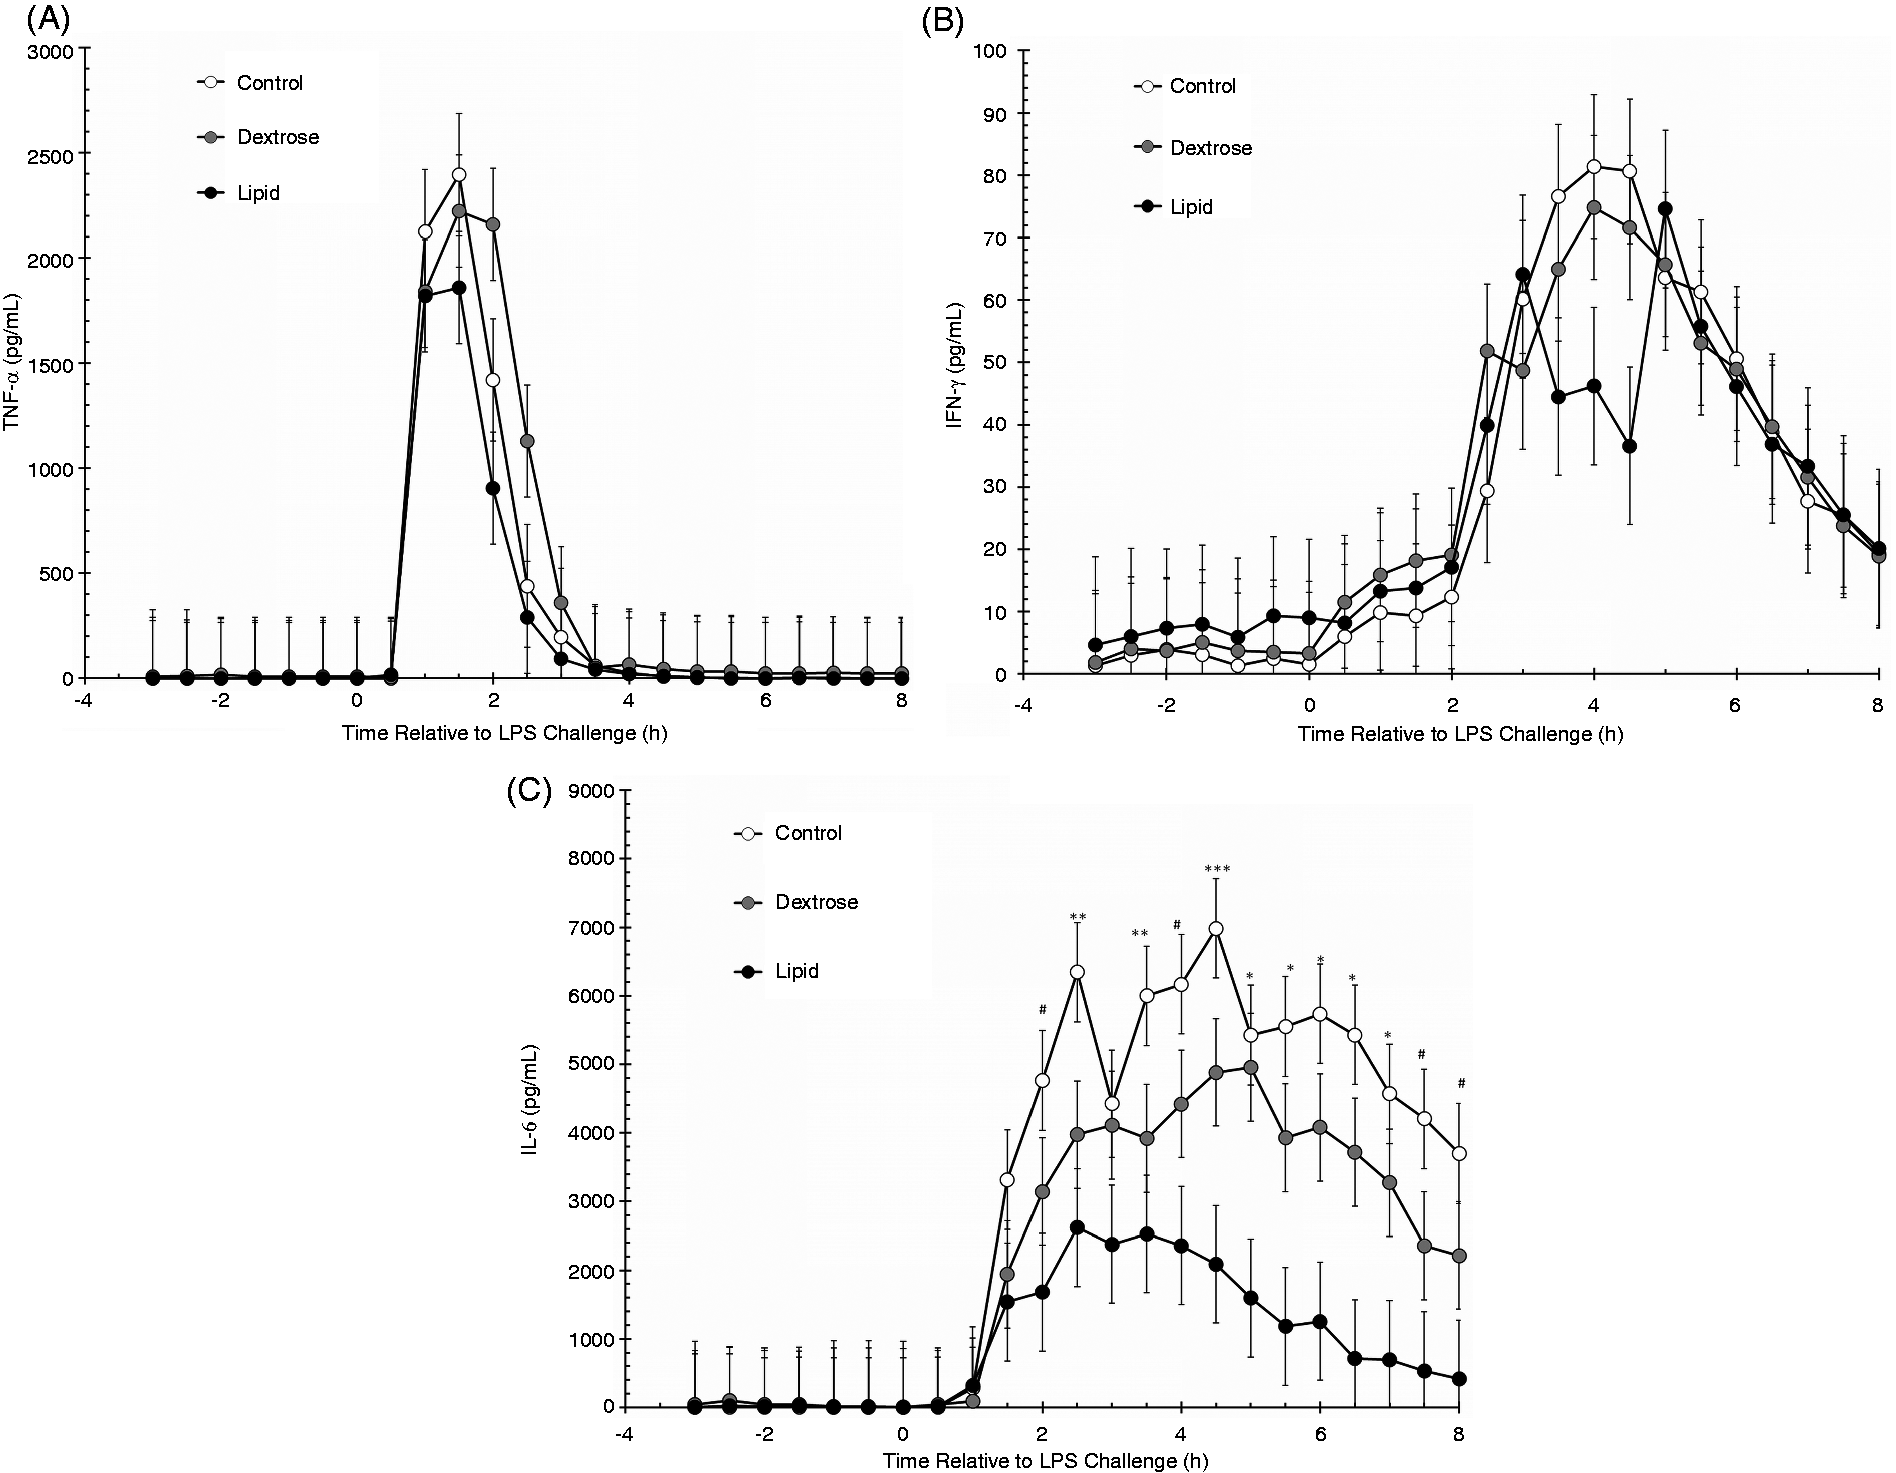
Similar to TNF-α, there was a main effect of time (P < 0.01), but there was no effect of treatment (P = 0.78) or a treatment × time interaction (P = 0.99) for serum IFN-γ concentrations (Figure 5B). Concentrations of IFN-γ increased (P < 0.01) beginning at 3 h post-challenge (compared with 0 h) and remained elevated through 7.5 h post-challenge (P = 0.04).
A treatment × time interaction was observed for serum concentrations of IL-6 (P = 0.02). Specifically, all three treatment groups differed (P ≤ 0.05) from each other at 4.5 h. Control steers had greater (P ≤ 0.05) IL-6 concentrations than Dextrose and Lipid steers at 2.5 h and 3.5 h, Control steers had greater IL-6 concentrations than Dextrose steers from 5 h to 7 h, and Control steers had greater IL-6 than Lipid steers at 2.0, 4.0, 7.5 and 8 h relative to LPS administration at 0 h (Figure 5C). Due to the significant treatment × time interaction, the data were further analyzed by time periods. Baseline serum concentrations of IL-6 were affected by treatment (P = 0.01), but not time (P = 0.23) or treatment × time (P = 0.47). Concentrations of IL-6 were greater (P < 0.01) in Dextrose (48.0 ± 8.2 pg/ml) compared with Control (1.7 ± 7.5 pg/ml) and Lipid steers (12.7 ± 8.8 pg/ml). There was no difference in Baseline IL-6 concentrations between Control and Lipid steers (P = 0.34). Due to the very low Baseline IL-6 concentrations during the Baseline period and very high post-LPS concentrations of IL-6, absolute values of IL-6 were used for the IL-6 analyses for the Infusion and LPS Challenge periods despite a significant treatment effect on IL-6 concentrations during the Baseline period. During the Infusion period, IL-6 concentrations were not affected by time (P = 0.51) or by a treatment × time interaction (P = 0.68), but there was a tendency (P = 0.08) for a treatment effect. Specifically, IL-6 concentrations were greater in Dextrose steers (9.9 ± 2.8 pg/ml) than Control steers (2.2 ± 2.1 pg/ml; P = 0.03). There was no difference in IL-6 concentrations between Control and Lipid steers (6.8 ± 2.3 pg/ml; P = 0.13) or between Dextrose and Lipid steers (P = 0.41) during the Infusion period. In response to LPS administration, IL-6 concentrations were affected by treatment (P < 0.01) and time (P < 0.01), but there was no treatment × time interaction (P = 0.39). Concentrations of IL-6 increased (P = 0.01) at 1.5 h post-LPS administration, and remained elevated for the remainder of the study. Post-LPS concentrations of IL-6 were greater (P ≤ 0.03) in Control steers (4289 ± 197 pg/ml) than Dextrose (2762 ± 197 pg/ml) and Lipid steers (1214 ± 212 pg/ml). Additionally, Dextrose steers had greater IL-6 concentrations post-LPS than Lipid steers (P < 0.01).
Discussion
The distribution and utilization of energy stores during an immune response can greatly affect the outcome and subsequent recovery of an animal from an immune challenge. We have hypothesized that increasing available energy for use by the immune system before and/or during an immune challenge may enhance recovery (i.e. post-challenge feed intake and weight gain). The present study tested the hypothesis that increasing available energy through a continuous Lipid emulsion (Intralipid) or a Dextrose bolus would influence the immune response to an LPS challenge. Results from this study indicate that increasing available energy prior to an immune challenge can alter aspects of both the physiological and acute-phase responses to LPS, which may influence post-challenge recovery and performance.
An increase in NEFA concentrations, as a result of adipose tissue breakdown, is typical in response to an immune challenge. Increasing concentrations of both NEFA and protein are needed to supply fuel for gluconeogenesis once glycogen stores in the liver and muscle are depleted. Catabolism of adipose and muscle tissue is stimulated by catabolic hormones such as cortisol, as well as pro-inflammatory cytokines. Non-esterified fatty acids (NEFA) released from adipose tissue can be used as a direct energy source by tissues through the β-oxidation process, and can also be used as a substrate to produce more glucose through gluconeogenesis.
Infusion of Intralipid was able to increase NEFA concentrations comparable with those previously observed in temperamental beef bulls. 2 Greater circulating NEFA concentrations observed in temperamental bulls have been suggested to alter the pro-inflammatory response to endotoxemia.2,3 In the present study, concentrations of NEFA remained elevated in Lipid steers and did not appear to be influenced by LPS administration at 0 h as compared with Dextrose and Control steers. This is one of the first studies to demonstrate that infusion of Intralipid can increase serum concentrations of NEFAs in dairy steers. It is important to stress that these steers were fed ad libitum and therefore were in a positive energy balance, as NEFA concentrations attained in this study are typical in cattle in a negative energy balance. Administration of a glucose bolus prior to administration of LPS did not appear to influence post-LPS NEFA concentrations, as NEFA concentrations were similar between Control and Dextrose steers.
Infusion of Intralipid did not alter glucose concentrations prior to LPS administration. Interestingly, administration of a Dextrose bolus prior to administration of LPS did not influence peak glucose concentrations following LPS administration. Therefore, the difference in glucose concentrations due to temperament observed previously between calm and temperamental bulls was not replicated in the current study by direct infusion of a Dextrose bolus immediately prior to LPS administration. 2 It is possible that the bolus dose of Dextrose administered to Dextrose steers prevented or inhibited any additional release of glucose from glycogen stores in the liver and muscle, thus preventing a greater peak in glucose concentrations post-LPS.
Other parameters (i.e. body temperature, stress hormones and cytokines) increase rapidly in response to endotoxin challenge, including components of the pro-inflammatory immune response. The measurement of body temperature is typically used to verify that animals are ill. However, various management techniques, as well as an animal’s temperament, can increase rectal and vaginal temperature in the absence of an infection. 3 In the current study, Baseline RT was greater in Lipid compared to Dextrose and Control steers. This difference could be due to previous handling, animal temperament or to randomization without stratification of previous RT measurements; however, it is impossible to determine the exact cause for the difference as Baseline RT was measured for only a short period of time (2 h) prior to the initiation of Intralipid infusion. Folldue administration of LPS, the change in RT was decreased in Dextrose compared with Control and Lipid steers. This is in contrast to what was observed in calm bulls, which had greater RT responses compared with Baseline values. 3 In humans, an increase in glucose has been linked to decreased core body temperature;5,6 however, no similar data in cattle are available. Additionally, the aforementioned studies were performed in the absence of an inflammatory stimulus as in the current study. Therefore, additional research is necessary in cattle to determine if there is a link between glucose concentrations and the RT response to a LPS challenge.
Changes in stress hormones and cytokines define the early pro-inflammatory response to a pathogen. An increase in cortisol is one of the first endocrine changes observed in response to LPS challenge, occurring prior to detectable increases in cytokines. 7 In this manner, the early release of cortisol serves to prime and stimulate the pro-inflammatory response, while the extended elevation of cortisol over time leads to the down-regulation of the pro-inflammatory response (i.e. pro-inflammatory cytokines TNF-α, IFN-γ and IL-6) and stimulation of the production of anti-inflammatory cytokines (i.e. IL-2, IL-4 and IL-10). 8 Therefore, cortisol is a critical component in the regulation of the pro-inflammatory response such that it prevents a hyper-inflammatory state, which can be detrimental to the health and recovery of the animal. infusion of Intralipid prior to administration of LPS increased cortisol concentrations in comparison with Dextrose and Control steers. This is interesting due to the fact that temperamental cattle have been observed to have greater basal cortisol concentrations.3,9 Therefore, this suggests a strong relationship between cortisol and NEFA concentrations. This response was expected, as cortisol increases lipolysis and circulating NEFA concentrations. However, in the current study the roles were reversed, with increases in cortisol observed in response to an increase in NEFA concentrations. There are very few studies in which cortisol was measured during an Intralipid infusion, with no studies found using cattle models. Studies in humans have suggested that infusion of Intralipid either had no effect or decreased cortisol concentrations.10–12 However, many of these studies were performed under systems that maintained insulin and/or glucose concentrations at predetermined concentrations. Yet, Intralipid infusion in humans did not appear to influence whole-body cortisol metabolism, but did increase conversion of cortisone to cortisol in subcutaneous adipose tissue. 13 In contrast to the studies in humans, studies in rodents have observed increases in both adrenocorticotropic hormone (ACTH), as well as corticosterone following administration of Intralipid, supporting the results observed in the current study in cattle.14,15 However, the rodent studies also found increases in glucose in response to Intralipid infusion, which is contrary to what was observed in the current study. 15 The current study is the first study in cattle to demonstrate a relationship between elevated NEFA concentrations due to a continuous Intralipid infusion and cortisol concentrations, and demonstrates the need for further research on the relationship between Intralipid-induced increases in NEFA concentrations and cortisol in cattle.
The cortisol response following LPS administration was decreased in the Lipid treatment compared with Control and Dextrose treatments. This suggests that the greater cortisol concentrations prior to administration of LPS blunted the LPS-stimulated cortisol response. This is similar to what has been observed in temperamental bulls, where greater basal cortisol concentrations resulted in a decreased cortisol response to LPS. 2 Additionally, Curley et al. observed a blunted cortisol response to both corticotropin releasing hormone and ACTH challenges in temperamental beef heifers, 16 which had greater cortisol concentrations prior to administration of the challenges.
The release of cytokines, stimulated by pathogen-activated immune cells and cortisol, stimulates cells of the innate immune response and subsequently results in acute-phase protein production and adaptive immune system activation. Concentrations of cytokines remained low during the Baseline and Infusion periods prior to LPS administration. While there was no influence of treatment on post-LPS concentrations of TNF-α or IFN-γ, infusion of Intralipid or administration of a Dextrose bolus prior to LPS administration did decrease post-LPS concentrations of IL-6. This suggests that an increase in energy availability was able to reduce the IL-6 response to LPS. While no literature is available in cattle, a study in humans observed that administration of IL-6 increased circulating glucose concentrations. 17 Additionally, Helge et al. reported a relationship between IL-6 concentrations and glucose homeostasis in humans during exercise. 18 These studies suggest that a relationship exists between glucose and IL-6 concentrations such that IL-6 may serve as a catabolic agent that increases available glucose. It is possible that the administration of the Dextrose bolus increased energy availability, or increased the sum of energy available, thus alleviating the need for the steers to break down additional energy stores, resulting in a decrease in IL-6 concentrations. However, further research is warranted in order to fully understand the relationship between energy stores and IL-6 concentrations in cattle.
Greater concentrations of cortisol prior to the LPS challenge in the Lipid steers may explain, in part, the decreased post-LPS concentrations of IL-6, as cortisol can negatively influence pro-inflammatory cytokines. However, cortisol concentrations were not different between Control and Dextrose steers; therefore, cortisol alone does not explain the decreased IL-6 response to LPS in the Dextrose-treated steers. This suggests that differences in energy availability may have had a greater influence on the cytokine response to LPS than cortisol or other factors. Additionally, a decreased inflammatory response may be beneficial, as it can allow for a quicker return to homeostasis; whereas an extended and prolonged inflammatory response can cause more damage to healthy tissues, delaying recovery. While it is not completely clear from the current study whether or not the decreased pro-inflammatory cytokine response observed in Dextrose and Lipid steers is beneficial to the overall health and recovery of the steers, it does warrant further investigation.
Fatty acids are considered important modulators of inflammation. As discussed above, NEFAs can be used as an energy source, and can be readily available for use by tissues within the body. 19 Additionally, the incorporation of different fatty acids into the plasma membrane can result in various effects on cellular function, including modulation of gene expression through altering receptor binding, intracellular signaling and transcription factors, 20 thus influencing how cells respond to a pathogen challenge. Binding of fatty acids to peroxisome proliferator-activated receptor-γ, specifically polyunsaturated fatty acids, can result in down-regulation or suppression of inflammation. 20 As the fatty acid composition of Intralipid is mainly polyunsaturated fatty acids, the results from the current study support previous data regarding the potential anti-inflammatory effect of NEFAs on the pro-inflammatory response.
There are numerous studies describing the effects of elevated concentrations of free fatty acids on components of the immune response in cattle, mainly in periparturient dairy cows, which display similar metabolic profiles as temperamental cattle. Peripheral blood mononuclear cells isolated from pregnant dairy cows and incubated with various concentrations of NEFA (0.25–2.00 mmol/l) found a decrease in the production of IgM, as well as IFN-γ, 21 demonstrating that NEFA can influence in vitro lymphocyte function. Similarly, production of IFN-γ by isolated leukocytes was decreased in dairy cows classified to have fat mobilization syndrome. 22 Ster et al. reported a decrease in the production of IFN-γ by isolated dairy cow peripheral blood mononuclear cells when incubated with high concentrations of NEFA. 23 These data suggest that greater concentrations of NEFA negatively affect the adaptive immune response, as IFN-γ is known to stimulate the adaptive immune response. Specifically, IFN-γ is responsible for driving differentiation of T cells during leukocyte antigen presentation. In the current study, there were no differences in IFN-γ concentrations between treatments; however, the lack of significant differences may be due to animal-to-animal variation between steers. Additionally, the studies by Lacetera et al. and Ster et al. only measured IFN-γ.21,23 Therefore, it is unclear whether there were differences in other cytokines, such as TNF-α and IL-6.
There are data in cattle on the effect of endogenous NEFAs on the pro-inflammatory response, yet fewer data on the use of exogenously administered Lipid emulsions on the pro-inflammatory response. A study in humans demonstrated that Intralipid decreased ex vivo cytokine production induced by endotoxin in human whole blood, but failed to alter in vivo cytokine production when endotoxin was administered in the middle of a 4-h Intralipid infusion. 24 Yet another study by Krogh-Madsen et al. reported an increase in pro-inflammatory cytokines in response to endotoxin challenge in Intralipid-infused humans. 25 However, studies in rodents have observed that increases in triglycerides and lipoproteins can improve survival when challenged with endotoxin. 26 Therefore, there are apparent differences in the effects of exogenously-administered Lipids on the inflammatory responses across mammalian species which emphasizes the need for further investigation in this area.
Conclusion
This study demonstrated that infusion of an exogenous Lipid emulsion (i.e. Intralipid) can increase circulating NEFA and Baseline cortisol concentrations of Holstein steers to values similar to what has been observed in temperamental beef bulls. Additionally, administration of Dextrose immediately prior to LPS administration decreased the RT response to LPS challenge. Furthermore, infusion of Intralipid decreased the IL-6 and cortisol responses to LPS challenge. To our knowledge, these are the first data to: 1) suggest that exogenous administration of a Lipid emulsion can increase circulating NEFA concentrations that may modulate the innate immune response in cattle, and 2) suggest that greater circulating NEFA concentrations observed in temperamental cattle may be responsible for the altered pro-inflammatory response reported following an LPS challenge. Further research is necessary in order to understand the mechanisms behind the altered pro-inflammatory response to LPS challenge in the presence of greater circulating NEFA concentrations, and if the observed differences stemming from Lipid infusion would expedite the return to homeostasis.
Footnotes
Funding
This research received no specific grant from any funding agency in the public, commercial or not-for-profit sectors.
Conflicts of interest
The authors do not have any potential conflicts of interest to declare.
Acknowledgements
Mention of trade names or commercial products in this article is solely for the purpose of providing specific information and does not imply recommendation or endorsement by the U.S. Department of Agriculture. The U.S. Department of Agriculture (USDA) prohibits discrimination in all its programs and activities on the basis of race, color, national origin, age, disability, and where applicable, sex, marital status, familial status, parental status, religion, sexual orientation, genetic information, political beliefs, reprisal, or because all or part of an individual's income is derived from any public assistance program. (Not all prohibited bases apply to all programs.) Persons with disabilities who require alternative means for communication of program information (Braille, large print, audiotape, etc.) should contact USDA's TARGET Center at (202) 720-2600 (voice and TDD). To file a complaint of discrimination, write to USDA, Director, Office of Civil Rights, 1400 Independence Avenue, S.W., Washington, D.C. 20250-9410, or call (800) 795-3272 (voice) or (202) 720-6382 (TDD). USDA is an equal opportunity provider and employer. The authors would like to acknowledge the technical support of JW Dailey, JR Carroll, and C Wu (USDA-ARS).