
Abstract
The aim of this study was to investigate the prevalence of endotoxemia in critically ill Japanese patients using the endotoxin activity assay, a newly developed rapid assay of endotoxin. The endotoxin levels (EA levels) in the blood of 314 patients admitted to our university hospital’s intensive care unit (ICU) were measured within 24 h of admission, and its correlation with disease severity and outcome examined. In addition, the EA levels in 61 samples from healthy volunteers were measured. EA level was 0.39 ± 0.25 (mean ± SD) in patients admitted to the ICU and 0.10 ± 0.09 in healthy controls. There was less overlap of EA level distribution between patients and controls compared with previous reports measuring EA level in mainly Caucasian populations. Our patients’ EA levels were significantly correlated with disease severity criteria and 28-d mortality. When EA and procalcitonin levels were used concomitantly, disease severity could be assessed more precisely than when either marker was used alone. These results suggest that EA level is a useful marker for disease severity assessment and outcome prediction in critically ill patients.
Introduction
Endotoxin is a membrane component of Gram-negative bacteria and plays a key role in the pathogenesis of sepsis.1,2 It is a marker of bacterial infection and gut translocation, as well as a target molecule of sepsis treatment. Measurement of endotoxin levels in patient blood is important for early diagnosis and appropriate determination of treatment strategy for sepsis. Currently, the most widely used method for endotoxin measurement is the limulus amebocyte lysate (LAL) assay. 3 The LAL assay is a sensitive and reliable method for the measurement of endotoxin in water. However, for the measurement of blood or plasma samples, plasma components such as LPS-binding protein, soluble and cell-bound CD14, TLR and lipoproteins interfere with the assay by binding to endotoxin in a complex manner. Despite efforts to establish various pretreatment procedures, the utility of the LAL assay for plasma endotoxin measurement is limited.
Recently, a new method for measuring endotoxin levels in whole-blood samples, the endotoxin activity assay (EAA), was developed, and its usefulness has been reported in several studies.4–6 The EAA is an immunoassay that uses anti-lipid A monoclonal Ab. Endotoxin in the blood sample binds with the Ab and this Ag–Ab complex stimulates and causes the respiratory burst of neutrophils. Reactive oxygen species produced by neutrophils are measured by the luminol chemiluminescence reaction. The Ab recognizes lipid A, an active part of the endotoxin molecule; therefore, the amount of Ag–Ab complex reflects the activity of endotoxin in the blood. Basal (without Ab) and maximally stimulated (with excess amount of spiked entodoxin) samples are measured in parallel as negative and positive controls, and endotoxin activity in the sample is expressed as a relative value (EA level).
The EA levels of critically ill patients admitted to intensive care units (ICUs) have been examined in several studies. The largest study reported so far is the MEDIC study, a multi-center study that measured the EA levels of 857 patients following ICU admission. 6 Eighty-four percent of the patients in that study were Caucasian. The results showed that 57% of ICU patients had EA levels > 0.40 on the day of admission. The authors also measured 97 healthy volunteers and reported that their median EA level was 0.26, with 7% of the healthy controls having EA levels ≥ 0.40. Therefore, there was some overlap between ICU patients and healthy controls.
In this study, we measured the EA levels of critically ill patients admitted to ICU and those of healthy controls in Japan, and examined the distribution of EA levels and correlation with pathological conditions.
Materials and methods
Study population
The study was a single-center retrospective analysis of critically ill patients admitted to our university hospital’s ICU from November 2006 to March 2012. All patients whose EA level was measured and severity criteria of disease recorded were enrolled. Three hundred and fourteen patients were analyzed in total. In addition, the EA levels of 61 healthy volunteers were measured. This study was conducted with the approved by the institutional review board of Tokyo Medical University.
Definitions of disease severity
Systemic inflammatory response syndrome (SIRS) was diagnosed based on the definition of the American College of Chest Physicians/Society of Critical Care Medicine consensus conference. 7 Sepsis was defined as documented or suspected infection plus SIRS conditions. Severe sepsis was defined as organ dysfunction caused by sepsis, and septic shock was defined as acute circulatory failure characterized by persistent arterial hypotension despite adequate fluid resuscitation.
Endotoxin activity assay
Endotoxin in whole blood was measured using the EAA according to the assay protocol recommended by the manufacturer (Spectral Diagnostics, Toronto, Canada). EDTA anticoagulated blood was taken from the patients and incubated for 10 min at 37℃. Forty microliters of each sample was incubated in duplicate with saturating concentrations (2.6 µg/ml) of endotoxin-specific anti-lipid A Ab (IgM monoclonal Ab) in 1 ml of Hank’s balanced salt solution buffer containing heparin. An endotoxin–anti-endotoxin Ab complex is formed and complement proteins opsonize this complex. The opsonized immune complex primes neutrophils in the blood to enhance their respiratory burst in response to zymosan in the assay reagent, yielding oxidants that react with luminol in the reaction mixture to emit chemiluminescence. Chemiluminescence was detected in a photon-counting luminometer (Berthold Detection Systems, Pforzheim, Germany). A basal activity in the absence of Ab (negative control tube) and the maximum respiratory burst activity in the presence of excess (4600 pg/ml) exogenous endotoxin spiked into the blood sample (positive control tube) were measured in parallel. The EA level was calculated by the following equation:

The assay was conducted within 30 min of collection of the blood samples.
Procalcitonin assays
Plasma procalcitonin (PCT) levels were measured using an enzyme immune assay kit (Elecsys BRAHMS PCT, BRAHMS, Berlin, Germany) according to the assay protocol recommended by the manufacturer. Values under the detection limit (0.1 ng/ml) were recorded as 0.1 for the correlation analysis.
Statistical analysis
Variables between two groups were compared using Student’s t-test and χ2 test for continuous variables and categorical variables, respectively. Correlations were analyzed using Spearman’s rank test. Statistical significance was assumed for P-values < 0.05.
Results
EA level distribution in healthy volunteers and ICU-admitted patients
Characteristics of the study population.
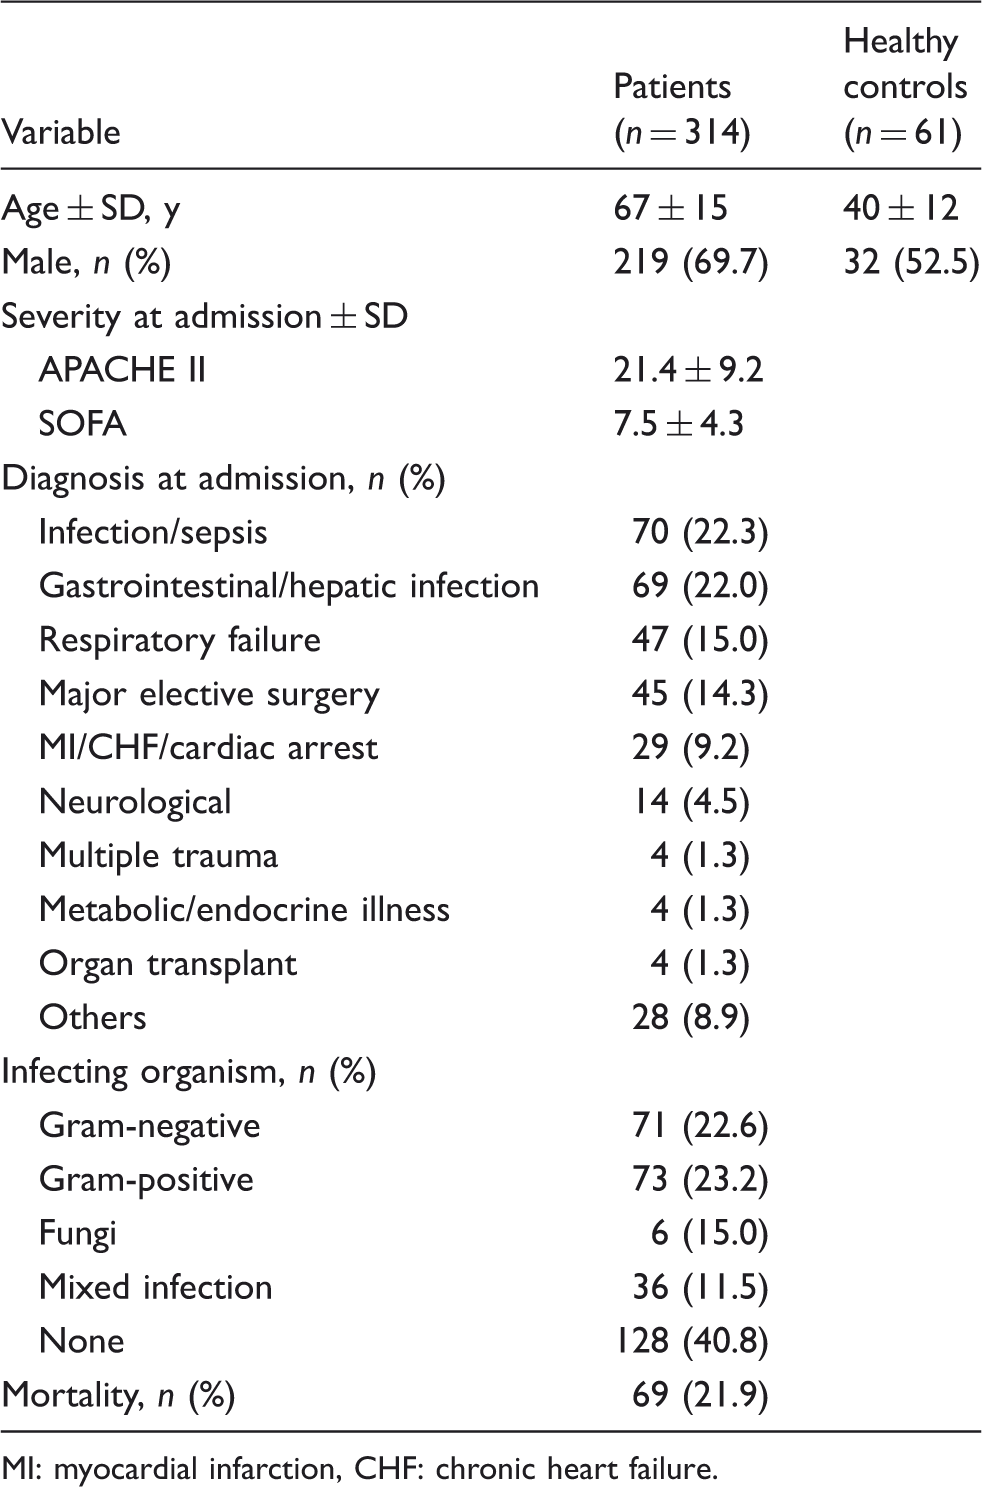
MI: myocardial infarction, CHF: chronic heart failure.
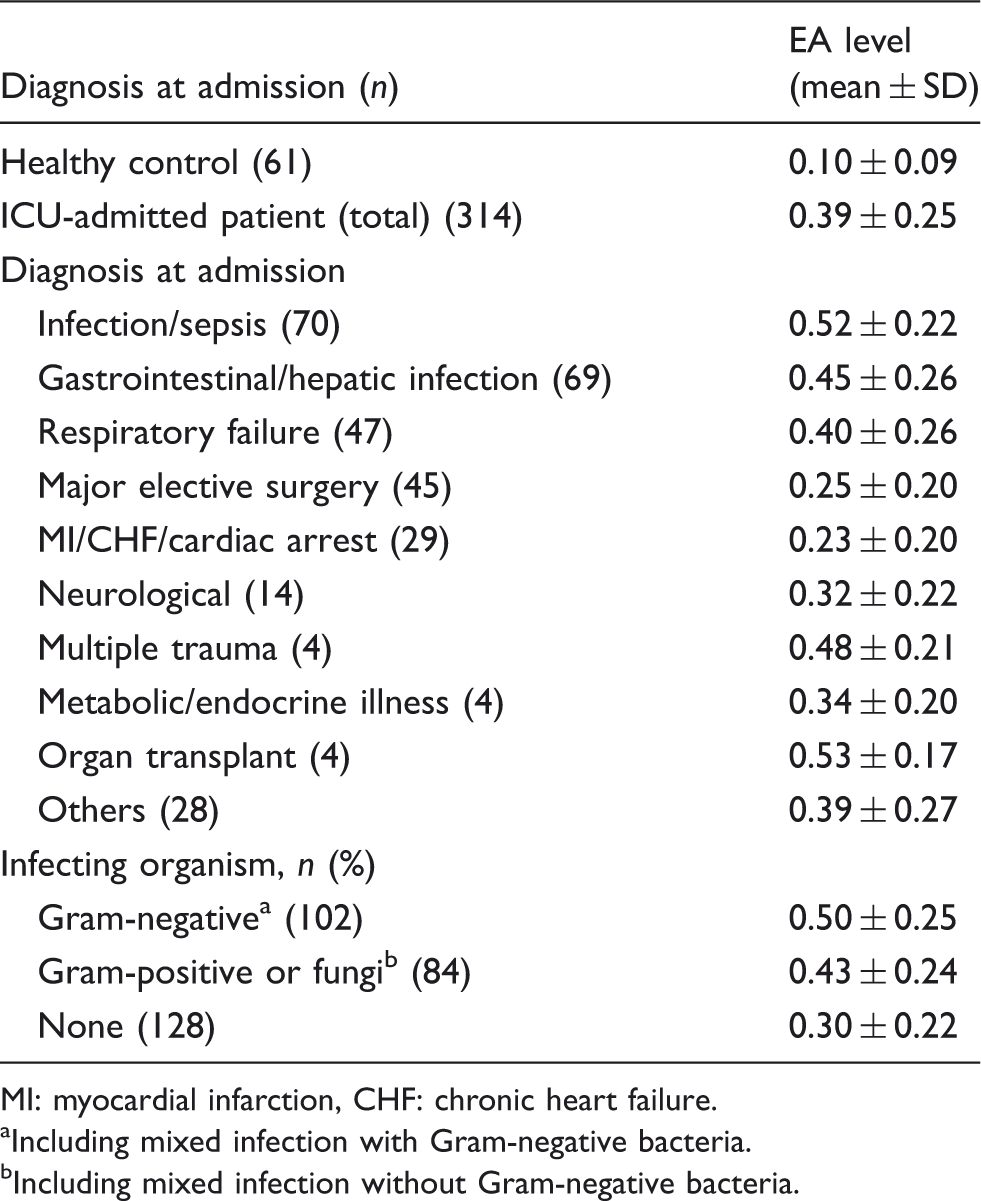
Figure 1 shows the distribution of the EA levels of all ICU-admitted patients and healthy controls. The EA levels of ICU-admitted patients distributed throughout range from < 0.1 to > 0.9. In contrast, most of the EA levels of healthy volunteers were < 0.2, with 72% < 0.1 and 16% between 0.1 and 0.2. Table 2 shows the mean (±SD) EA levels of ICU-admitted patients of each diagnosis category. The mean ± SD of all ICU-admitted patients (n = 314) was 0.39 ± 0.25, and that of healthy volunteers (n = 61) was 0.10 ± 0.09.
Distribution of EA levels of ICU-admitted patients and healthy controls. (A) EA levels obtained from all ICU-admitted patients (n = 314). (B) EA levels of healthy controls (n = 61). EA level at ICU admission. MI: myocardial infarction, CHF: chronic heart failure. Including mixed infection with Gram-negative bacteria. Including mixed infection without Gram-negative bacteria.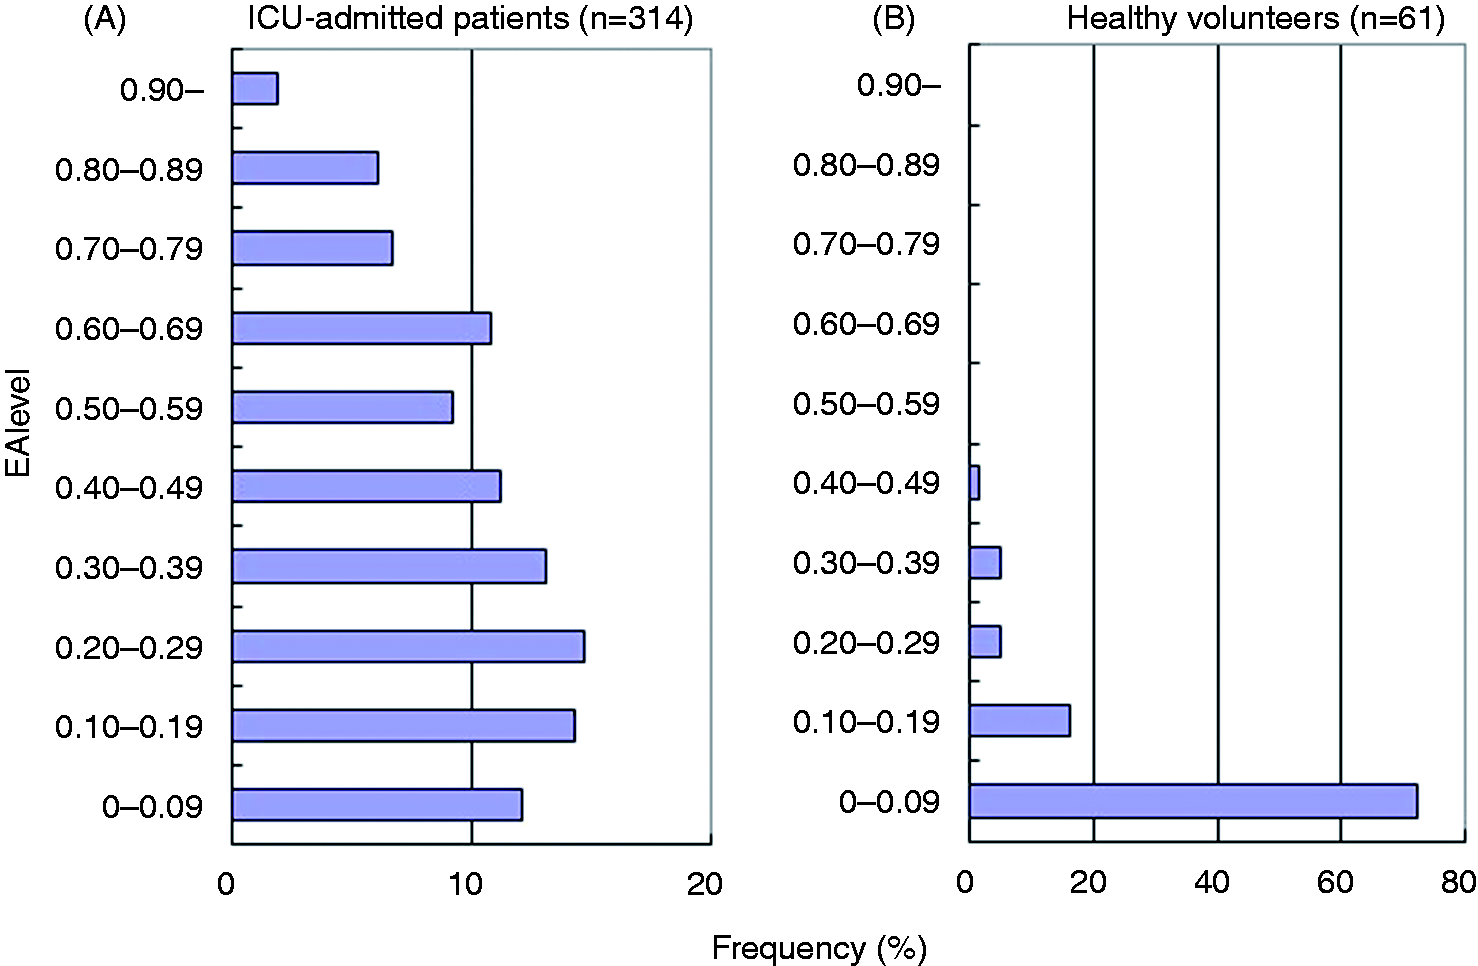
Correlation between EA levels and severity of disease
Figure 2A shows the correlation between EA levels and severity of the disease. The mean APACHE II score at admission increased in parallel with increased EA levels. The mean (± SD) APACHE II score in the ‘very low’ group of patients (EA < 0.2) was 17.3 ± 8.9, while that in the ‘low’ group (0.2 ≦ EA < 0.4) was 20.6 ± 9.2; it was 22.6 ± 8.1 in the ‘intermediate’ group (0.4 ≦ EA < 0.6) and 25.3 ± 8.5 in the ‘high’ group (0.6 ≦ EA). The difference between the groups was statistically significant. Figure 2B shows the distribution of the severity in each EA group. The percentages of patients diagnosed as severe sepsis or septic shock were 19.3%, 34.5%, 50.0% and 81.3% in the ‘very low’, 'low’, ‘intermediate’ and ‘high’ groups, respectively.
Correlation between EA levels and severity of disease. (A) APACHE II score stratified by EA levels. (B) Distribution of disease severity stratified by EA levels. Definition of severity criteria is described in the ‘Materials and methods’.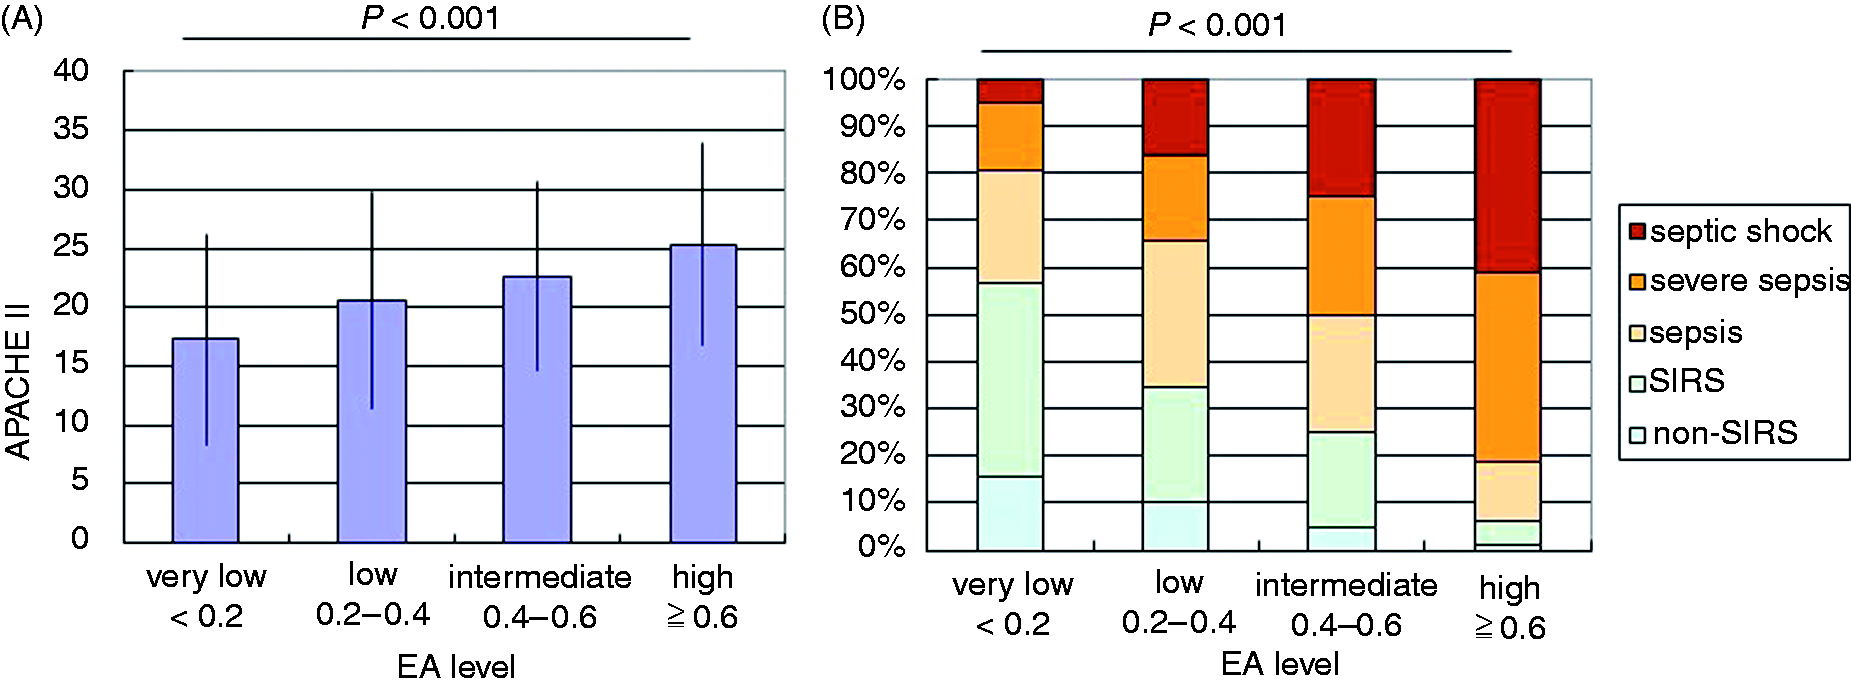
Correlation between EA levels and mortality
Figure 3 shows the 28-d mortality stratified by EA levels. Mortality was highly correlated with EA levels. The 28-d mortalities of the ‘very low’, ‘low’, ‘intermediate’ and ‘high’ groups were 12.0%, 16.1%, 31.3% and 31.3%, respectively.
Correlation between EA levels and mortality. Twenty-eight-day mortality of the patients stratified by EA level is shown.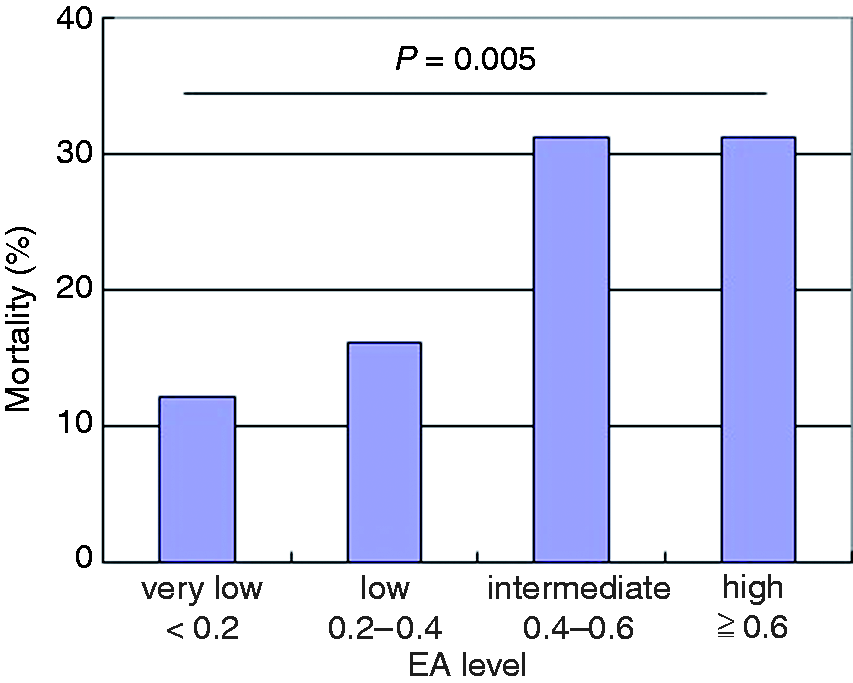
Receiver–operator curve analysis
We measured PCT levels and C-reactive protein (CRP) levels at admission to ICU and compared their ability to discriminate the severity of disease (presence of severe sepsis or septic shock) with EA levels using receiver–operating characteristic (ROC) curves. ROC curve for APACHE II score was also analyzed for comparison. Among the four markers, PCT showed the highest ability for the prediction of severe sepsis of septic shock with an area under the curve (AUC) value of 0.871. EA level also showed high ability in the prediction of disease severity (AUC = 0.786), which was higher than that of CRP (AUC = 0.706).
Correlation between EA levels and plasma PCT levels
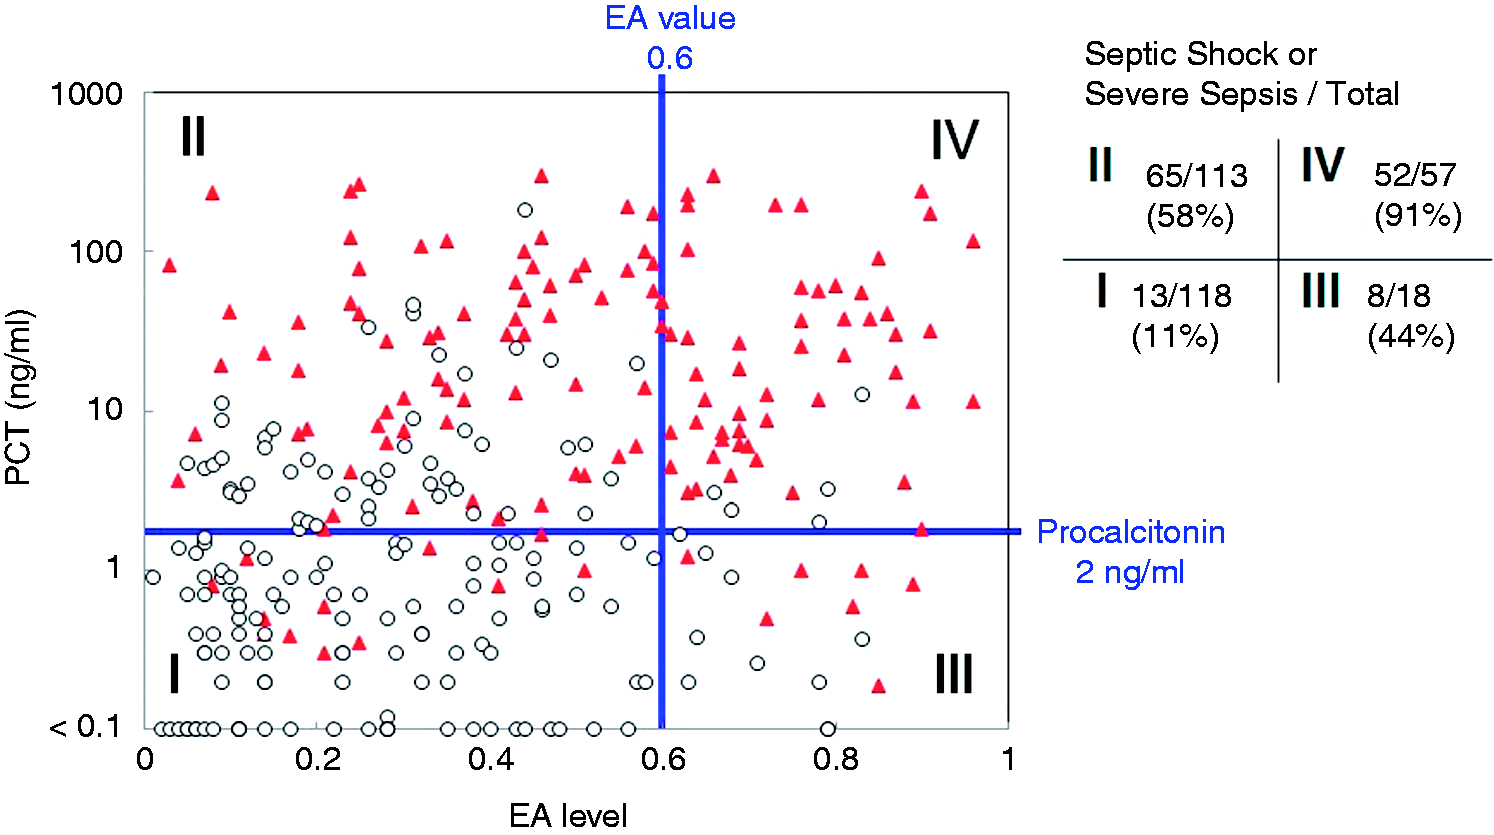
We next analyzed the usefulness of the combination of EA and PCT levels for the prediction of the severity of the disease. As shown in Figure 4, PCT level was positively correlated with EA level, with a correlation coefficient (r) of 0.35. We divided the patients into four groups according to the levels of EA and PCT (zones I–IV), as shown in Figure 4, and examined the correlation with disease severity. The percentage of patients diagnosed as having severe sepsis or being in septic shock was 11% (13/118) in zone I (PCT < 2 ng/ml and EA level < 0.6), 58% (65/113) in zone II (PCT ≧ 2 ng/ml and EA level < 0.6), 44% (8/18) in zone III (PCT < 2 ng/ml and EA level ≧ 0.6) and 91% (52/57) in zone IV (PCT ≧ 2 ng/ml and EA level ≧ 0.6). The ratio of severe sepsis or septic shock patients among each zone was statistically significant (P < 0.01), except for the comparison between zones II and III (Figure 5).
ROC curves for predicting the severity of disease. ROC curves for the discrimination of patients with severe sepsis or septic shock are presented for (A) EA level, (B) PCT level, (C) CRP level and (D) APACHE II score. Correlation between EA levels and plasma PCT level. Open circles represents patients diagnosed as non-SIRS, SIRS or sepsis excluding severe sepsis and septic shock; closed triangles represent patients diagnosed as severe sepsis or septic shock. For the PCT assay, the results under the detection limit (< 0.1 ng/ml) are plotted on the bottom line. The right-hand table show the numbers of the patients of ‘severe sepsis or septic shock’/‘non-SIRS, SIRS or sepsis excluding severe sepsis and septic shock’ in each zone, and the percentage means the ratio of ‘severe sepsis or septic shock’ among the total number of patients in each zone.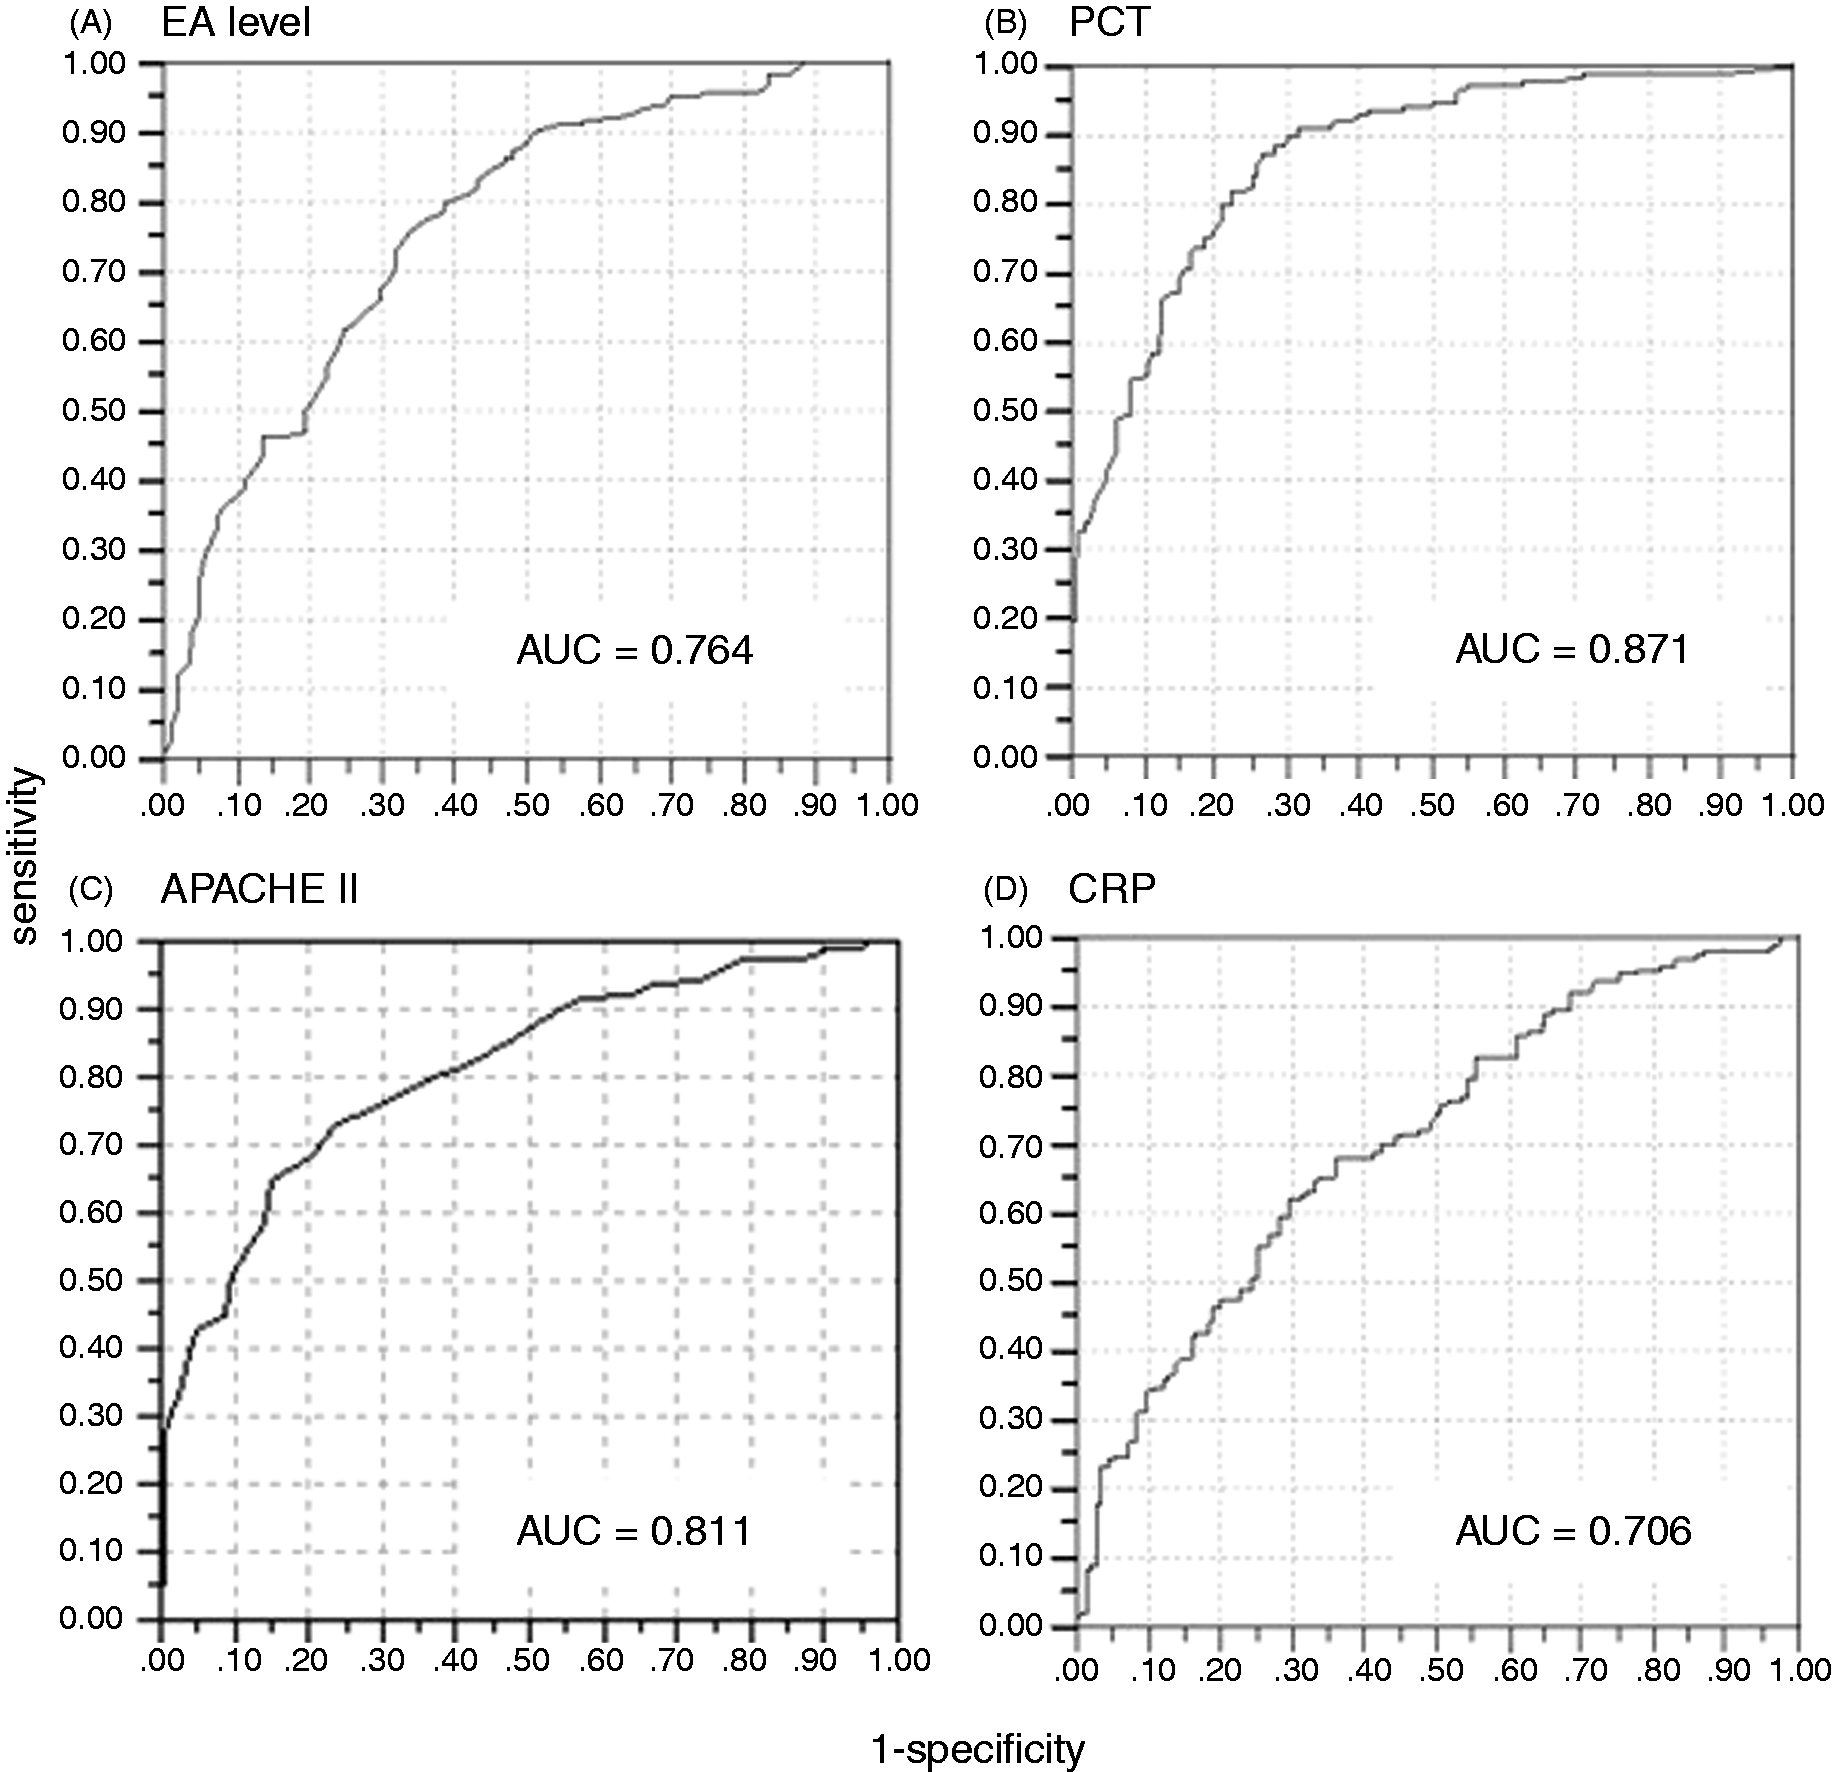
Discussion
The EA levels of critically ill patients have been reported in several studies. Among them, the largest clinical study measuring EA levels of patients admitted to ICU is the 2004 MEDIC study, which was conducted in 10 hospitals in Canada, the USA, Belgium and England. 6 In that multi-center study, the authors classified the patients into three groups based on their EA levels: low (< 0.40); intermediate (0.40–0.60); and high (≧ 0.60). The study showed that patients with higher EA levels had higher severity indices, such as APACHE II score. In the present study, in which we measured the EA levels in critically ill Japanese patients, we confirmed the results of the MEDIC study, showing that patients with a greater severity of disease had higher EA levels. Furthermore, when we divided the patients with low EA levels into two groups (the ‘very low’ group, with EA levels < 0.20; and the ‘low’ group, with EA levels of 0.20–0.40), we found a clear difference in disease severity between these groups. For example, the mean APACHE II score of the ‘low’ group (20.6 ± 9.2) was significantly higher than that of ‘very low’ group (17.3 ± 8.9). In addition, the number of patients with septic shock was approximately threefold higher in the ‘low’ group (16.1%) compared with the ‘very low’ group (4.8%).
The distribution of EA levels in the 61 healthy participants in our study was unexpectedly low compared with previous reports. The median EA level was 0.06 and the mean ± SD was 0.10 ± 0.09. Among these healthy controls, only one sample (1.6%) was ≥ 0.4. In the MEDIC study, the median level was 0.26, which is approximately fourfold higher than our results, and 7.2% (7/97) of the healthy controls showed an EA level ≥ 0.4. Although the reason for this discrepancy is not clear, we speculate that differences in the race of the patients; environmental factors, such as diet and smoking; or small differences in assay conditions are possible explanations. However, there was no significant difference in the distribution of EA levels of ICU-admitted patients between our study and those in the MEDIC study. Therefore, our results could distinguish critically ill patients from healthy participants more clearly than the MEDIC study.
Plasma PCT level is reported to correlate with the severity of disease in critical care patients, 8 and is widely used as a biomarker of bacterial infection in critically ill patients. In our study, we measured plasma PCT levels in addition to EA levels, and compared the results. Both EA and plasma PCT levels correlated with disease severity, and EA and PCT levels were positively correlated with statistical significance. However, the correlation coefficient was relatively low (r = 0.35), suggesting these two markers have different clinical meanings. When these two markers were combined, they could assess the disease severity more efficiently. For example, the ratio of patients diagnosed as having severe sepsis or being in septic shock among all patients was 91% (52/57) in those with both high EA and high PCT levels (EA ≧ 0.6 and PCT ≧ 2 ng/ml), while the ratio was only 11% (13/118) when both EA and PCT level were not high (EA < 0.6, PCT < 2 ng/ml). The effectiveness of combining EA and PCT levels was also reported for differentiating the presence of Gram-negative infection. 9 Another recent study also measured EA and PCT levels in patients with severe sepsis who underwent open heart surgery, and a moderate positive correlation between EA and PCT levels was reported. 10 The clinical utility of combining more than one biomarker should be evaluated in more detail in the future.
Endotoxin is an important molecule not only for the sepsis diagnosis but also as the therapeutic target. Endotoxin removal using polymyxin B-immobilized fiber cartridge (PMX) is reported to be effective for patients with septic shock.11,12 Measurement of endotoxin level in the bloodstream is important for the selection of appropriate target patients and for the appropriate timing of treatment initiation. EAA is a suitable method because of its rapid nature as a whole-blood assay. Currently, a large-scale randomized double-blind clinical trial of PMX, named the EUPHRATES trial, is ongoing in North America. In this study, EAA is being used as an entry criteria; patients with an EA level of ≥ 0.6 are being included in the study. However, our results showed that patients with EA levels between 0.2 and 0.6 are also at high risk of severe sepsis and septic shock, and could be a target for endotoxin removal therapy. The appropriate target range of EA level for endotoxin removal therapy should be evaluated in further studies.
Our study had several limitations. It was a single-site, retrospective, observational study. Information about infectious microorganisms was not complete, so we did not evaluate the correlation between EA levels and causative microbes. Nevertheless, with large numbers of samples, we could clearly show the usefulness of EAA for severity assessment and outcome prediction. Further investigation with various different study populations (underlying disease, severities, infectious pathogens, patient ethnicity, etc.) would provide more information about the potential of EAA for sepsis diagnosis and as a selection biomarker for endotoxin-targeted therapies.
Conclusion
In this study, which measured EA levels in Japanese patients admitted to our ICU, we found a significant correlation between EA levels and disease severity, confirming previous reports. Furthermore, we found that the combination of EAA and PCT assays could assess the disease severity more precisely compared with a single-marker assay. EA levels in healthy volunteers were lower than previous reports measuring mainly Caucasian populations, and our results showed a clearer difference in the distribution of EA levels between ICU-admitted patients and healthy controls. We expect that further investigation of EA levels in various patient populations would provide more information about the potential of EAA for sepsis diagnosis and as a selection biomarker for endotoxin-targeted therapies.
Footnotes
Funding
This research received no specific grant from any funding agency in the public, commercial or not-for-profit sectors.
Acknowledgements
We would like to thank Mr. Asaumi and Mr. Mochizuki for their help with the EAA measurements.