
Abstract
MicroRNAs (miRNAs) are a class of small, noncoding RNAs that regulate post-transcriptional expression of their respective target genes and are responsive to various stimuli, including LPS. Here we examined the early (4 h) miRNA responses of THP1-differentiated macrophages challenged with LPS derived from the periodontal pathogens, Aggregatibacter actinomycetemcomitans, Porphyromonas gingivalis or environmentally-modified LPS obtained from P. gingivalis grown in cigarette smoke extract. Predicted miRNA-gene target interactions for LPS-responsive miR-29b and let-7f were confirmed using dual-luciferase assays and by transfection experiments using miRNA mimics and inhibitors. Convergent and divergent miRNA profiles were observed in treated samples where differences in miRNA levels related to the type, concentration and incubation times of LPS challenge. Dual-luciferase experiments revealed miR-29b targeting of interleukin-6 receptorα (IL-6Rα) and IFN-γ inducible protein 30 and let-7f targeting of suppressor of cytokine signaling 4 and thrombospondin-1. Transfection experiments confirmed miR-29b and let-7f modulation of IL-6Rα and SOCS4 protein expression levels, respectively. Thus, we have demonstrated convergent/divergent miRNA responses to wild type LPS and its environmentally-modified LPS, and demonstrate miRNA targeting of key genes linked to inflammation and immunity. Our data indicate that these LPS-responsive miRNAs may play a key role in fine-tuning the host response to periodontal pathogens.
Introduction
MicroRNAs (miRNAs) are small, single-stranded, noncoding RNAs transcribed as mono- or polycistronic transcripts by RNA polymerase II that post-transcriptionally regulate the expression of a number of genes.1,2 Functional miRNAs bind various mRNAs, primarily in the 3′ untranslated region (UTR) leading to translation suppression or degradation of target RNA. 1 miRNAs are known to regulate diverse biological processes, and recent studies have demonstrated their function as crucial components of innate immune responses.
Periodontal diseases are infectious, inflammatory disorders characterized by loss of the supporting structures of teeth. The Gram-negative anaerobes Porphyromonas gingivalis and Aggregatibacter actinomycetemcomitans have been strongly implicated in the pathogenesis of chronic and aggressive forms of periodontal disease, respectively.3,4 It has been proposed that an inefficient immune response to these bacterial species could be a decisive factor. 5 LPS is a key virulence factor that triggers inflammatory responses. These pathogen-derived LPS are recognized by TLRs that transduce signals to sensitize the host. While A. actinomycetemcomitans LPS is a TLR4 ligand, recognition of LPS from P. gingivalis is unusual in that it is believed to be mediated by TLR2, TLR4 or TLR7.6,7 LPS derived from P. gingivalis has been shown to differ from enterobacterial LPS (e.g. Escherichia coli) in structure and function; therefore, the TLRs and the intracellular inflammatory signaling pathways are, accordingly, different. 8 This is further supported by the observation that LPS derived from P. gingivalis and Capnocytophaga ochracea act as antagonists to the TLR4 receptor. 9
Cigarette smoking is considered a significant risk factor for the progression of periodontitis, and various reports have demonstrated altered production of inflammatory cytokines in smokers compared with non-smokers.10,11 It is also known that modifications to LPS structure occur in response to environmental pressures and stimuli, which may alter the host response.12–14 Clinically, a significant increase in the long-chain fatty acids associated with anaerobic bacterial periodontopathogens, particularly, in the i17:0(3-OH), and a decrease in the 12:0(3-OH) and 14:0(3-OH) were observed in salivary samples from smokers compared with their healthy counterparts. 15 Further, mass spectrometry of LPS isolated from P. gingivalis grown in cigarette smoke extract (CSE) revealed that the lipid A fatty acid profile differed from wild type (WT) LPS. 15 Lipid A is a highly conserved moiety and is the minimal component of LPS that engenders its inflammatory potential. Thus, altered production of the pro-inflammatory response in smokers could be a manifestation of altered LPS structure, which may prevent TLRs to precisely trigger downstream signaling.
Macrophages are multifunctional cells and key components of the innate immune response. They respond to LPS and activate several host defense functions through production of inflammatory mediators. We previously reported the presence of CD68+ macrophages in periodontally-involved human tissues, and their rapid and aggressive capacity to respond to P. gingivalis LPS in vitro, highlighting their involvement in host defense and disease progression.
16
Several lines of evidence indicate a role of miRNA in inflammatory responses, primarily by regulating the levels of TLR signaling components and immunomodulatory genes in macrophages.
17
For instance, LPS-inducible miR-146a down-regulates TNF receptor-associated factor 6, IL-1 receptor-associated kinase 1 and TNF-α, which renders cells refractive to further stimuli, while miR-21 regulates expression of programmed cell death 4, a pro-inflammatory protein that induces NF-κB and IL-6 production.17,18 However, miR-19 targets several negative regulators of NF-κB signaling, including TNF-α-induced protein 3 (TNFAIP3), lysine-specific demethylase 2a, zinc finger and BTB (
Here, we examined the extent of human macrophage miRNA responses to A. actinomycetemcomitans and P. gingivalis LPS. Moreover, to study the effect of altered LPS structure on global miRNA expression, LPS derived from P. gingivalis grown in CSE (Pg-CSE LPS) was included for comparison.
Materials and methods
LPS preparation
P. gingivalis strain W83 was grown in the presence or absence of CSE as previously described.13,14,20 Briefly, P. gingivalis cultures were grown to mid-to-late exponential phase (OD 600 nm = 1.0; ≈1 × 10⁹ cells/ml) in Gifu Anaerobe Medium (GAM; Nissui Pharmaceutical, Tokyo, Japan) or in GAM-CSE under anaerobic conditions (80% N2, 10% H2, 10% CO2) at 37℃ in a Coy Laboratories anaerobic chamber (Coy Laboratory Products, Grass Lake, MI, USA). For Pg-CSE cultures, GAM was conditioned using standard reference cigarettes (Kentucky Tobacco Research and Development Center, Lexington, KY, USA) and diluted to 4000 ng/ml nicotine equivalents prior to use.21–24 LPS was extracted using an LPS extraction kit (iNtron Biotechnology, Kyunggi-do, Korea) according to the manufacturer’s instructions. LPS from A. actinomycetemcomitans strain Y4 (serotype B) was extracted and purified as previously described.25–27 LPS was found to contain <0.001% nucleic acid and 0.7% protein by spectrophotometry and bicinchoninic acid protein assay, respectively.
Cell culture and differentiation
The THP1 cell line was procured from the UNC Lineberger Comprehensive Cancer Center Tissue Culture Facility (UNC at Chapel Hill, Chapel Hill, NC, USA) and maintained at 2 × 10⁵ cells/ml in RPMI 1640 medium supplemented with 10% FCS and 2 mmol/l
Total RNA isolation
Total RNA was isolated using the miRNeasy kit (Qiagen, Germantown, MD, USA) following the manufacturer’s protocol. The RNA was quantified using the NanoDrop (Thermo Scientific, Wilmington, DE, USA) and integrity assessed using the 2100 Bioanalyzer (Agilent, Foster City, CA, USA).
NanoString nCounter miRNA assay
To examine the early (4 h) miRNA responses of differentiated macrophages to LPS challenge, global miRNA profiling was performed using the Nanostring nCounter technology, a multiplexed, color-coded probe assay. One hundred nanograms of total RNA was used to generate cDNA libraries according to the manufacturer’s instructions. Ligation reactions, purification and dilution of probes were performed according to the manufacturer’s instructions (www.nanostring.com). Hybridization reactions were performed, according to the manufacturer’s instructions, with 5 ml of the fivefold diluted sample preparation reaction. All hybridization reactions were incubated at 65℃ for a minimum of 18 h. Hybridized probes were purified and counted, following the manufacturer’s instructions, on the nCounter Prep Station and Digital Analyzer (NanoString Technologies, Seattle, WA, USA) at the Lineberger Comprehensive Cancer Center. For each assay, a high-density scan (600 fields of view) was performed.
NanoString nCounter miRNA data analysis
Data normalization was performed according to manufacturer’s instructions. Briefly, NanoString nCounter miRNA raw data was normalized for lane-to-lane variation with a dilution series of six spike-in positive controls. The sum of the positive controls for a given lane was divided by the average sum across lanes to yield a normalization factor, which was then multiplied by the raw counts in each lane to give normalized values. The sum of five different endogenous controls was then averaged and normalized across the samples. The values obtained were averaged for LPS treated and untreated samples. Fold change was calculated as the ratio of LPS treated versus untreated control sample. For each treatment miRNAs with fold changes ≥1.45 or ≤ 0.6 were categorized as deregulated. The data have been deposited in the Gene Expression Omnibus (GEO) public database under the accession number GSE43411.
Quantitative real-time PCR
For primary miRNA (pri-miRNA) quantification, 1 µg total RNA was reverse transcribed using the Superscript RT-II kit (Life Technologies, Grand Island, NY, USA). A 20-µl reaction mix was prepared using 2× EvaGreen Master Mix (Biotium, Hayward, CA, USA), 1-2 µl of cDNA, and 10 pmol of each forward and reverse primer (Supplementary Table S1). Real-time PCR was carried out in a StepOne 7500 thermocycler (Applied Biosystems, Carlsbad CA, USA). GAPDH served as an internal control, and all reactions were run in triplicate. For mature miRNA quantification, miScript primers and miScript II RT Kit were purchased from Qiagen. One hundred ng of total RNA was reverse transcribed according to manufacturer’s instructions. The reactions were run using miRNA-specific primers and universal primer in the PCR mix buffer. RNU6B was used as endogenous control. The Ct values of replicates were analyzed to calculate relative fold change using the ΔΔCt method. 28
ELISA
The concentrations of IL-6 in the culture medium were quantified by specific human IL-6 ELISA (Invitrogen, Carlsbad, CA, USA) as per the manufacturer’s instructions. The absorbance was measured at 450 nm on SpectraMax M2 (Molecular Devices, Sunnyvale, CA, USA).
Bioinformatic miRNA target predictions and seed match analyses
miRWalk (http://www.umm.uni-heidelberg.de/apps/zmf/mirwalk/mirnatargetpub.html) 29 was used to predict the miRNA binding sites of a candidate gene’s 3′UTR using the eight established miRNA-target prediction algorithms. Genes that were highlighted in at least five of the eight algorithms were selected for further study. For screening, miRNA binding sites on seven different 3′UTRs (three genes for let-7f and four genes for miR-29 b) linked to immunity/inflammation by gene ontology (GO) biological terms (http://www.geneontology.org/) were selected.
Luciferase reporter constructs and dual luciferase reporter assays
Genomic DNA was isolated from freshly prepared PBMCs using QIAamp DNA mini kit (Qiagen) according to the manufacturer’s instructions. The 3′UTRs of predicted miRNA target genes were PCR amplified using PhusionTaq polymerase (NEB, Ipswich, MA, USA). The sequence of primers and expected amplicon size is listed in Supplementary Table S2. The amplified products were digested with XhoI and NotI, and ligated downstream to the luciferase reporter gene in psiCHECK-2 vector (Promega, Madison, WI, USA). The colonies were screened by restriction digestion and three positive clones for each gene were verified by DNA sequencing. Dual experiments were carried out in a 48-well format. In brief, HEK293 cells were seeded at a density of 3×10⁴ in DMEM supplemented with 10% FBS. All the transfections were performed in quadruplicate using 0.5 µl Lipofectamine 2000 (Invitrogen, Grand Island, NY, USA), 120 ng dual luciferase reporter plasmids, and a final concentration of 1 pmol, 5 pmol or 10 pmol of synthetic miRNA mimics (Thermo Fisher Scientific, Lafayette, CO, USA). As negative controls we used (1) empty vectors + miRNA mimics and (2) reporter constructs + miRIDIAN microRNA Mimic Negative Control #1 (Thermo Fisher Scientific). After 36 h post-transfection, cells were lysed in passive lysis buffer (Promega) and dual luciferase assays (Promega) were performed using the Lumat (Turner BioSystems, Sunnyvale, CA, USA) luminometer. For each reporter 3′UTR construct, the Rluc/Fluc value obtained was normalized to the value obtained for psiCHECK-2 no-insert control (EV) co-transfected with the same miRNA mimic. The values obtained were plotted as histograms, where EV was set at 1.
MTS assay
Cell viability was determined using the CellTiter 96 AQueous Cell Proliferation Assay Kit (Promega) according to manufacturer’s instructions. THP1-differentiated macrophages were transfected with miRNA mimics or inhibitors at concentrations of 40 nM. A total of 20 µl of MTS reagent was added to each well and incubated for 2 h. Absorbance at 490 nm was monitored using the SpectraMax M2 (Molecular Devices) plate reader.
Transfection of THP1-differentiated macrophages with miRNA mimics and inhibitors
THP1 cells were cultured as described above. Differentiated macrophages were transfected with miRNA mimics or miRNA inhibitor using HiPerfect reagent (Qiagen) according to manufacturer’s instructions. Briefly, 1 × 10⁶ cells were seeded in six-well plates and transfected with miRNA mimics or inhibitor at indicated concentrations. After 36 h, cells were harvested for protein detection or RNA isolation. The transfection efficiency of miRNAs was determined by miScript primer assay for miR-29b as described above.
Western blotting
Differentiated macrophages transfected with miRNA mimics/inhibitors or controls were lysed using passive lysis buffer (Promega) supplemented with protease inhibitor cocktail (Roche, Indianapolis, IN, USA). The blots were incubated with IL-6Rα (rabbit polyclonal), SOCS4 (mouse polyclonal) and GAPDH (rabbit polyclonal) primary Abs (Abcam, Cambridge, MA, USA) at 1:1000 dilution. Images were captured on the Odyssey Two-Color Infrared Imaging System (LI-COR Biotechnology, Lincoln, NE, USA) following the manufacturer’s instructions. ImageJ software (http://rsbweb.nih.gov/ij/) was used to quantify the results. The values for each lane were normalized with respect to endogenous control GAPDH and compared with the negative control mimic transfection.
Statistics
Data were analyzed using GraphPad Prism (GraphPad Software, La Jolla, CA, USA). Mean values, error bars (SD), and Student’s t-test (two-tailed) were calculated from three independent experiments. A P-value of <0.05 was considered significant.
Results
LPS of periodontal pathogens induces convergent and divergent miRNA profiles
We profiled 664 different miRNAs using Nanostring assay, of which expression of ∼ 200 (30%) miRNAs were detected across all samples. These were categorized as no change, or up- or down-regulated compared with untreated controls (Figure 1A). While the majority of miRNAs were constitutively expressed and did not exhibit change in expression levels compared with untreated controls, a subset of miRNAs was LPS-responsive and differentially expressed (17.3–29%). Compared with A. actinomycetemcomitans LPS (11.2%), challenge with P. gingivalis LPS or Pg-CSE LPS resulted in a higher percentage of down-regulated miRNAs (22.2% and 18.6%, respectively). Figure 1B shows the distribution of overlapping and unique miRNAs responsive to each LPS. It can be noted that 24 miRNAs were differentially expressed across all three LPS species forming what may appear to be a ‘core’ miRNA response, the majority of which were down-regulated. Nonetheless, LPS-specific miRNA responses were also evident. Quantitative PCR data corroborated with Nanostring miRNA profiling data in that let-7f, miR-29b, miR-32 and miR-891a were down-regulated (P < 0.05) upon LPS challenge, while miR-16 levels did not change (data not shown). The levels of miR-146a were induced in all LPS treatments and although a similar trend was noted, only A. actinomycetemcomitans LPS demonstrated increased levels of miR-146a in the Nanostring profiling.
Differential expression of miRNAs in response to LPS treatment. (A) Total RNA from differentiated THP1 cells treated with A. actinomycetemcomitans (Aa) LPS, P. gingivalis (Pg) LPS and Pg-CSE-LPS was profiled for miRNAs using Nanostring technology. The miRNAs detected in each sample were categorized as up- or down-regulated, or no change with respect to untreated sample. (B) Venn diagram showing the distribution of unique and overlapping up- or down-regulated miRNAs in response to individual LPS treatment.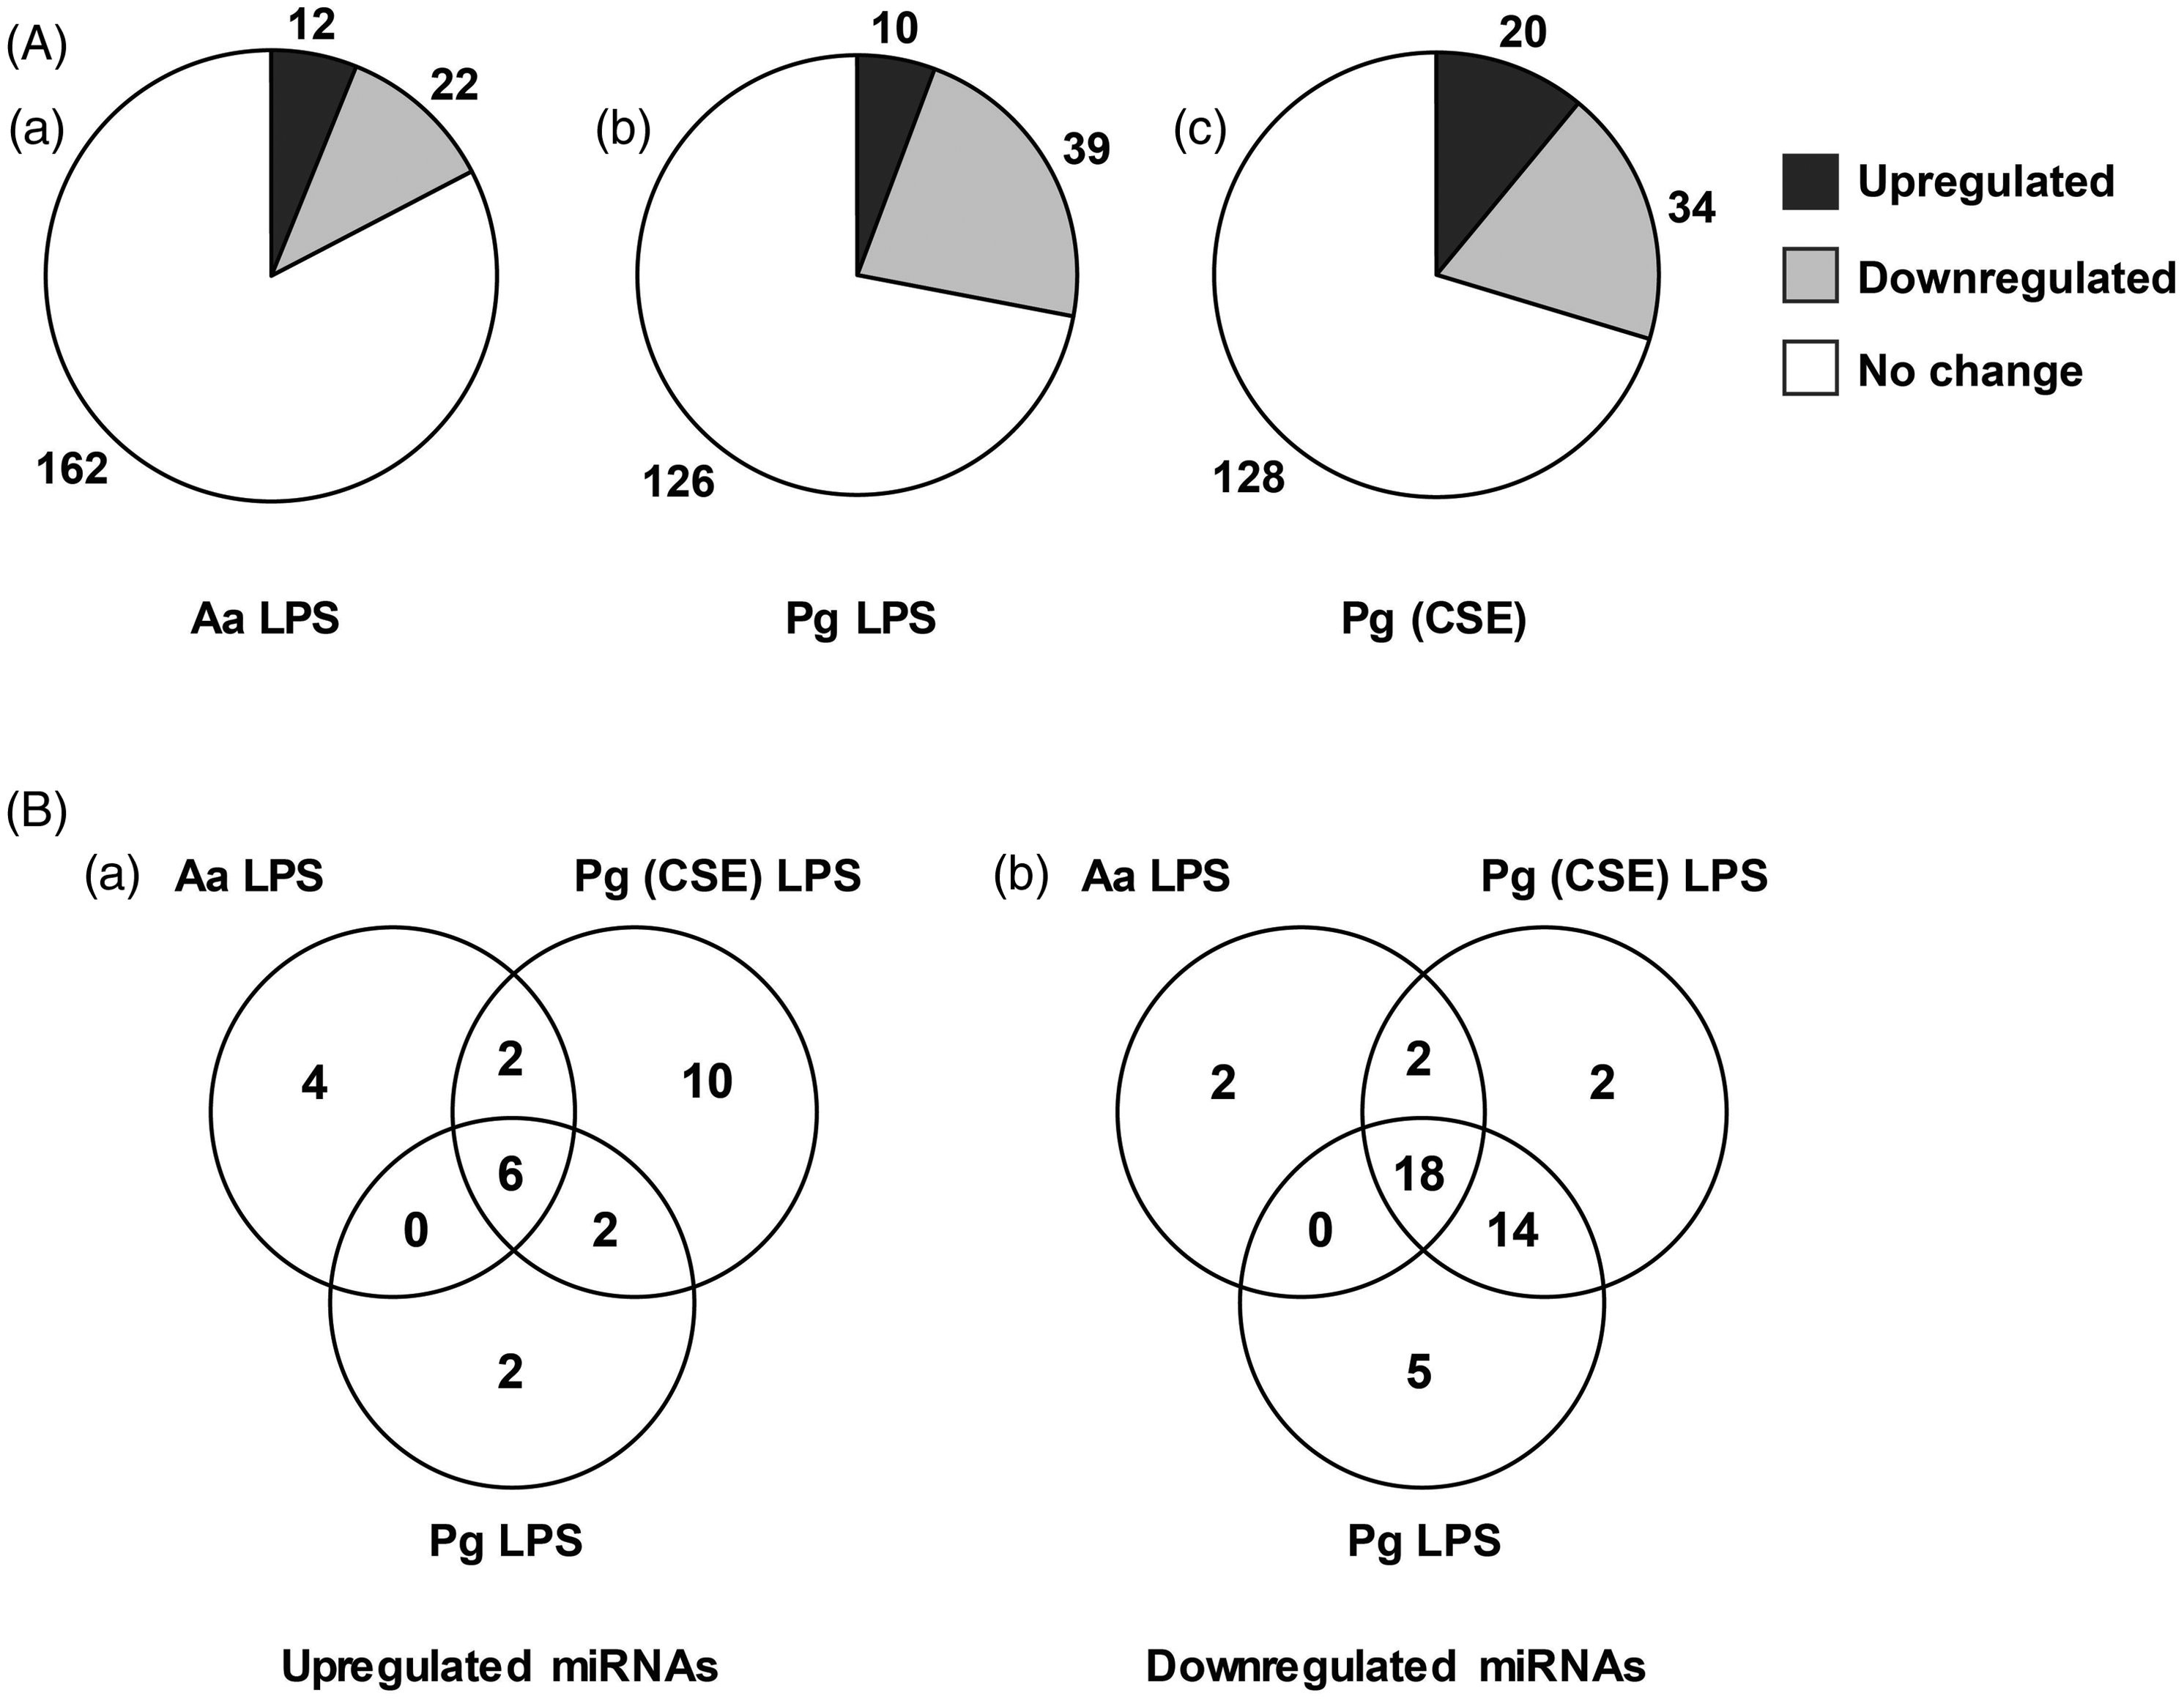
To investigate if the observed changes in mature miRNA levels corresponded to the precursor transcript expression, pri-miRNA levels of four representative miRNAs [miR-146a (up), let-7f, miR-32 (down) and miR-16 (no change)] were analyzed. Pri-miR-16, pri-miR-32 and pri-miR-146a levels corroborate with their respective mature miRNAs (P < 0.05, data not shown), indicating that the response of these miRNAs to LPS is a transcriptional event. However, the pri-let-7f levels were increased in response to LPS, while the corresponding mature miRNA levels were reduced (P < 0.05, data not shown). Similarly, a significant change in pri-miR-16 levels in A. actinomycetemcomitans LPS and Pg-CSE-LPS treatment was evident, while mature miR-16 expression was not affected by any of the LPS treatments.
An in silico search identified various cytokines and transcription factors as validated targets for miRNAs induced specifically by Pg-CSE-LPS (Supplementary Table S3). Of note, IL-6 levels have been reported to negatively correlate with miR-99a levels, 30 an miRNA specifically induced (∼ 1.6-fold) by Pg-CSE LPS in our study. In agreement with this, supernatant levels of IL-6 were three times lower in Pg-CSE-LPS-treated macrophages compared with P. gingivalis LPS-treated macrophages (P < 0.001; Supplementary Figure S1).
miRNAs respond to LPS challenge dose and incubation time
To study the expression kinetics of selected LPS-responsive miRNAs [miR-29b, miR-32 and miR-891 (down-regulated) and miR-146a (up-regulated)], we monitored their levels after 1, 4 and 24 h of LPS stimulation. Expression changes in the levels of miR-29b, miR-32 and miR-891 were observed at 1 h, suggesting that these are among the immediately responsive miRNAs (Figure 2a). While the levels of miR-29b and miR-32 decreased over time, a greater reduction in miR-29b levels was noted in P. gingivalis- CSE-treated samples. miR-891 expression did not change significantly over the course of 24 h. The expression of miR-146a was significantly induced at 4 h, the levels of which increased remarkably at 24 h, particularly in P. gingivalis-CSE-treated samples.
miRNA expression kinetics in response to different incubation time and concentration of LPS. Changes in expression of miRNAs were monitored in THP1-differentiated macrophages over time (a) and (b) challenge dose of LPS. The levels of miR-29b, miR-32 and miR-891 (down) and miR-146a (up) were evaluated by quantitative RT-PCR. RNU6B was used as an endogenous control. The expression levels in untreated cells were set at 1. The results shown here are the mean ± SD for three independent experiments. P-values were calculated using Student's t-test. *P < 0.05 compared with control. Aa: A. actinomycetemcomitans; Pg: P. gingivalis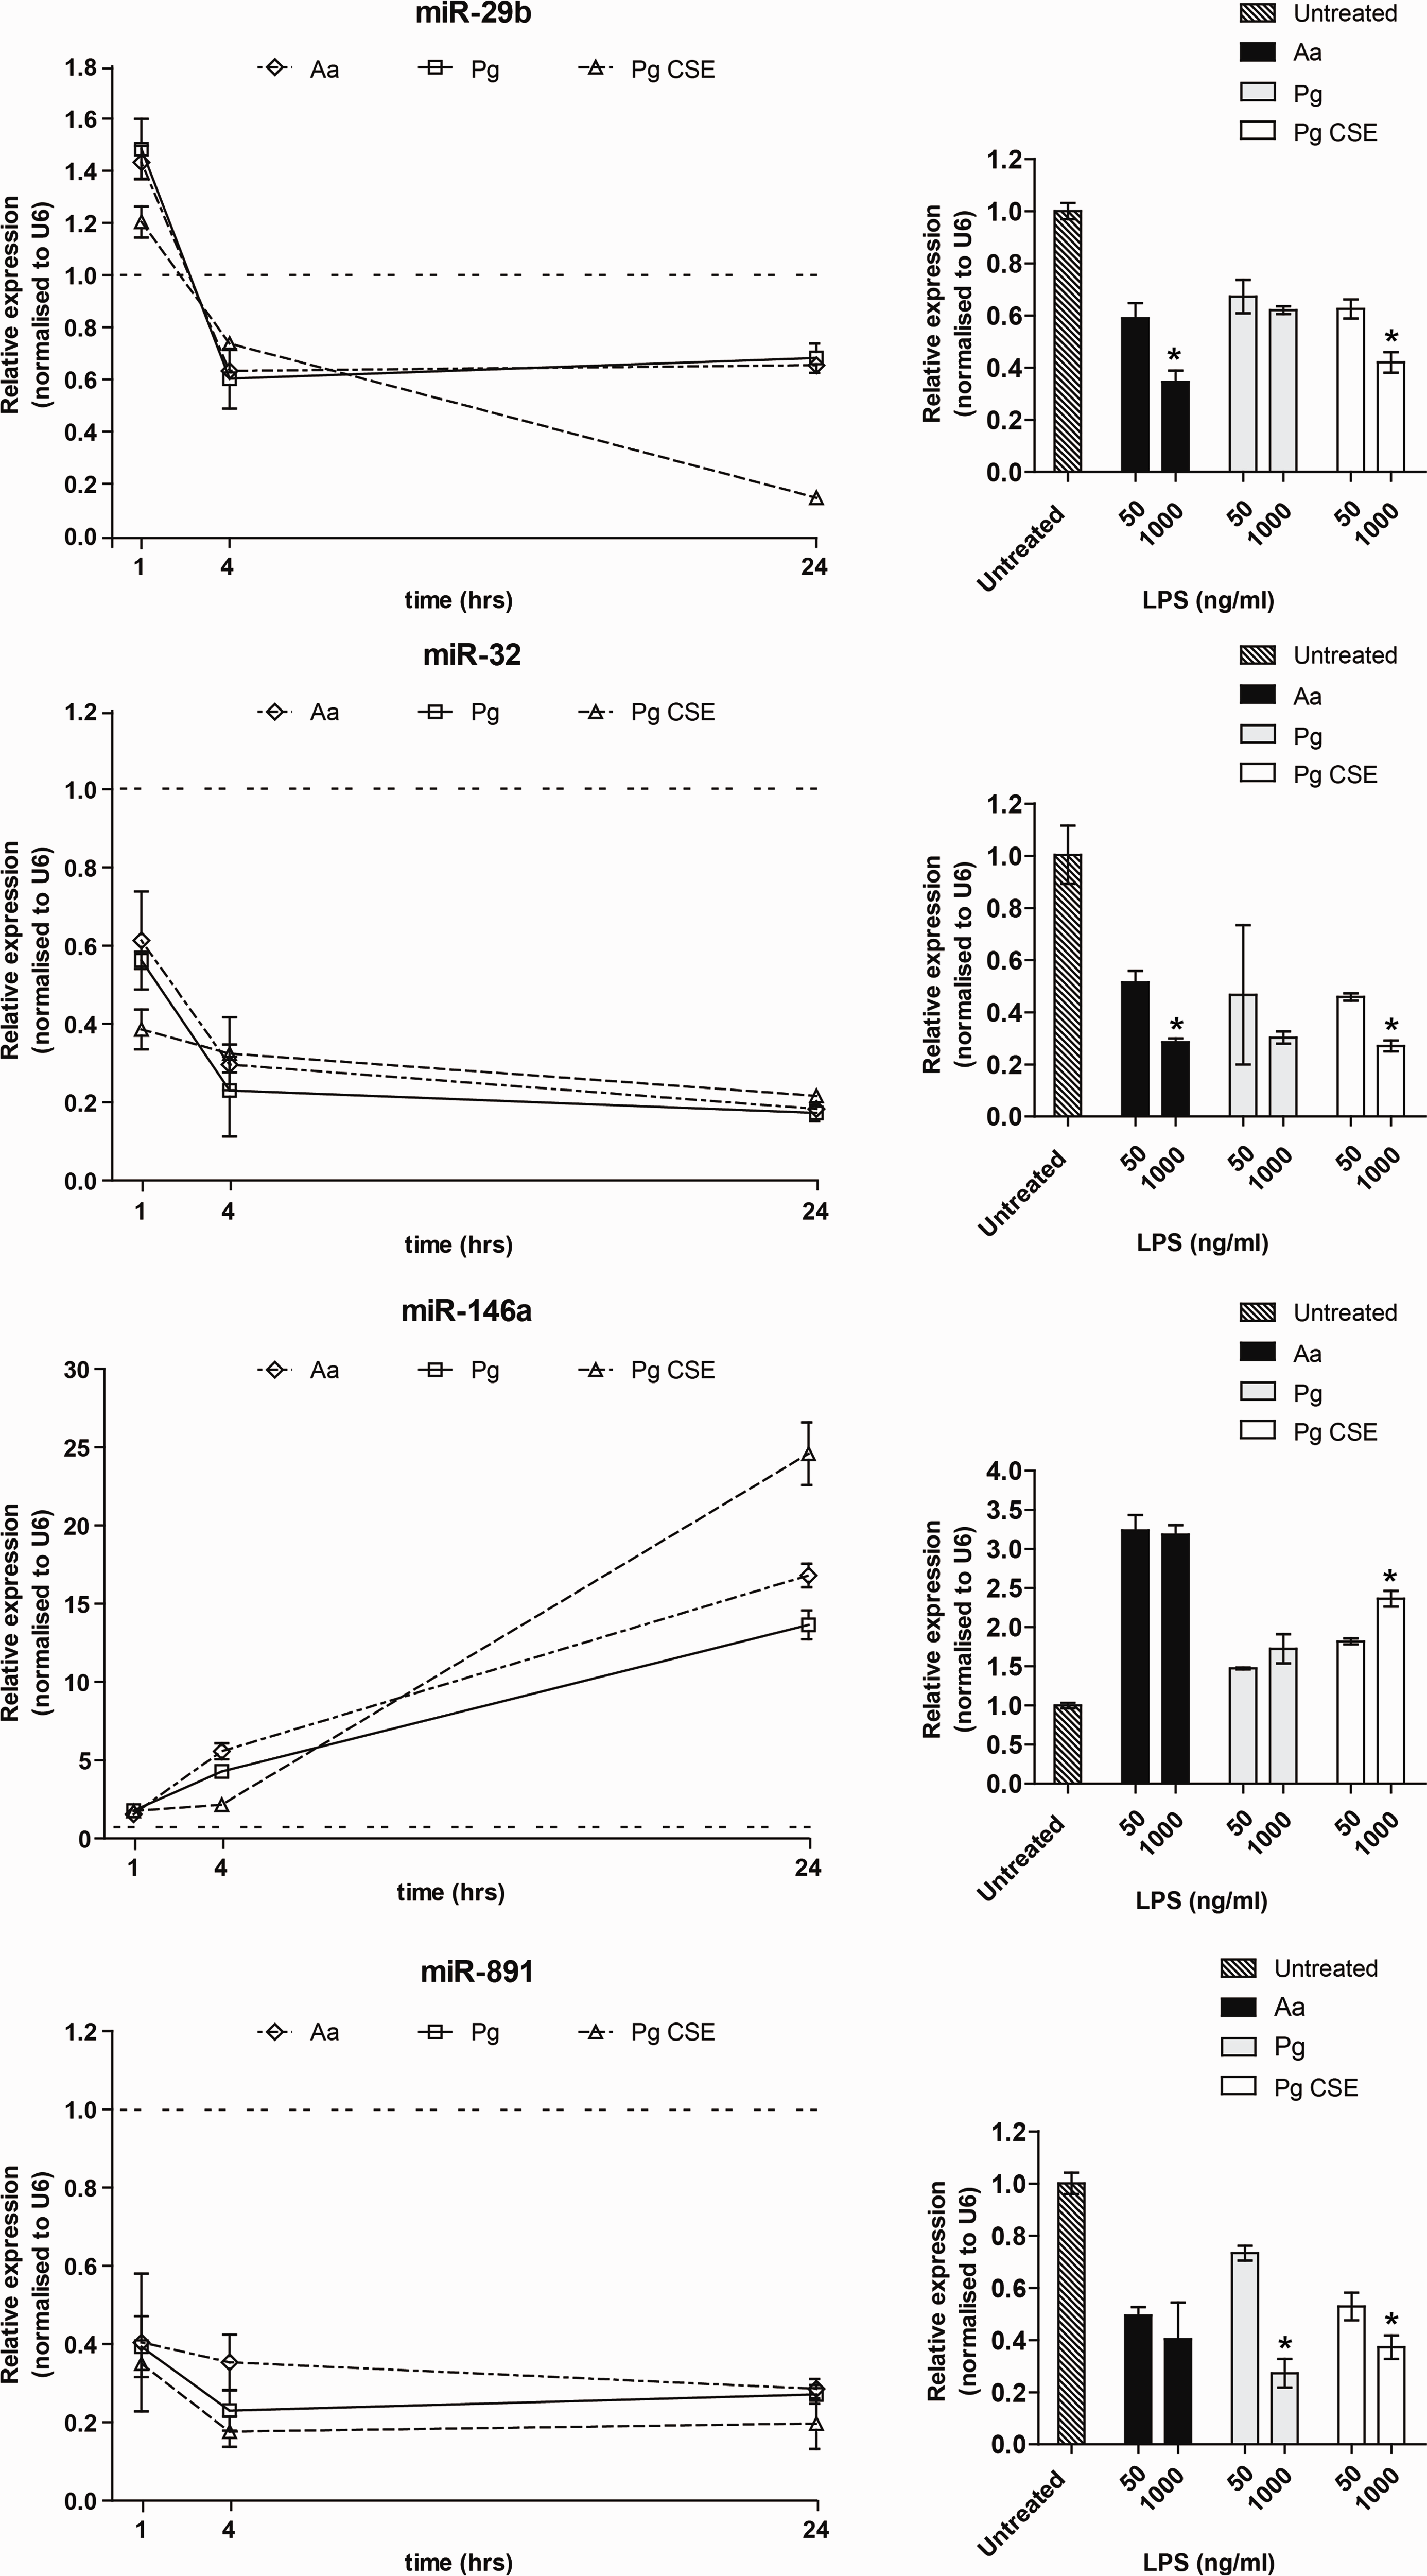
To investigate the possibility that these miRNAs were also responsive to the LPS dose, miRNA levels were analyzed after 4 h of treatment with either 50 ng/ml or 1000 ng/ml of LPS. We noted miRNA–specific effects based on the challenge dose (Figure 2B). For instance, miR-29b and miR-32 were maximally down-regulated at the higher dose compared with the lower dose of A. actinomycetemcomitans LPS (P < 0.05). No significant changes were observed for either miR-146a or miR-891 (P > 0.05), although a similar downward trend was noted for miR-891 at the higher dose of A. actinomycetemcomitans LPS. Except for miR-146a, challenge with P. gingivalis and P. gingivalis-CSE also resulted in down regulation of miR-29b, miR-32 and miR-891. Conversely, the higher dose of P. gingivalis and Pg-CSE-LPS, but not A. actinomycetemcomitans LPS, up-regulated levels of miR-146a. Interestingly, Pg-CSE-LPS elevated miRNA-146a levels to a higher degree than did P. gingivalis-LPS (P < 0.01), further indicating that macrophages respond differently to environmentally-modified LPS. Overall, our results demonstrate a convergent/divergent miRNA profile based on the type of LPS challenge, the intensity of which varied both with time and concentration.
LPS challenge down-regulates miRNAs targeting genes involved in immunoregulation
As discussed above, LPS challenge primarily down-regulated miRNA expression (Figure 1). To examine the functional aspect of this event, an in silico approach was employed to identify target genes of miR-29b and let-7f. Importantly, all of the selected 3′UTRs examined had only one miRNA binding site to be tested. Figure 3 shows pair-wise alignment of miRNAs with their predicted gene targets. The luciferase assays demonstrate that of the seven in silico interactions examined, four showed significant reduction (∼ 30--60%, P < 0.01) in luciferase activity. These include let-7f targeting of thrombospondin-1 (TSP-1) and suppressor of cytokine signaling 4 (SOCS4) 3′UTR (Figure 3a–d), and miR-29b targeting of IL-6Rα and IFN-γ inducible protein (IFI30) (Figure 3e–h). Further, increasing miRNA mimic concentrations to 5 pmol maximally reduced the luciferase activity of SOCS4 and IL-6Rα transfectants; however, increasing miRNA mimic concentration to 10 pmol had no significant effect on luciferase activity (Figure 3d, f, bars 3–5). Co-transfection with negative control miRNA mimic had no effect on the luciferase activity, confirming the miRNA sequence specificity in targeting the 3′UTRs. Finally, transfection of miRNA mimics or negative control miRNA had no effect on the viability of HEK293 cells as observed from MTS assay (data not shown).
Dual luciferase reporter assays validate miRNA targets. (a, c, e, g) Luciferase reporter constructs were generated by cloning the 3′UTR of THBS1, SOCS4, IL-6Rα or IFI30 downstream of the Renilla luciferase gene. The cloned region of each 3′UTR is highlighted (rectangular box) and sequence alignment of the predicted miRNA binding site is also shown. (b, d, f, h) HEK293 cells were transiently co-transfected with reporter construct and either miRNA or negative control mimics. Constitutively-expressed firefly luciferase readings were used for normalization. (1) Empty vector (EV) and miRNA mimic; (2) reporter construct with negative control mimic; (3--5) reporter construct and miRNA mimic at 1, 5 or 10 pmol. Error bars represent mean ± SD from three biological replicates. P-Values were calculated using Student’s t-test. *P < 0.0001 compared with control; #P < 0.05 compared with 1 pmol (bar 3).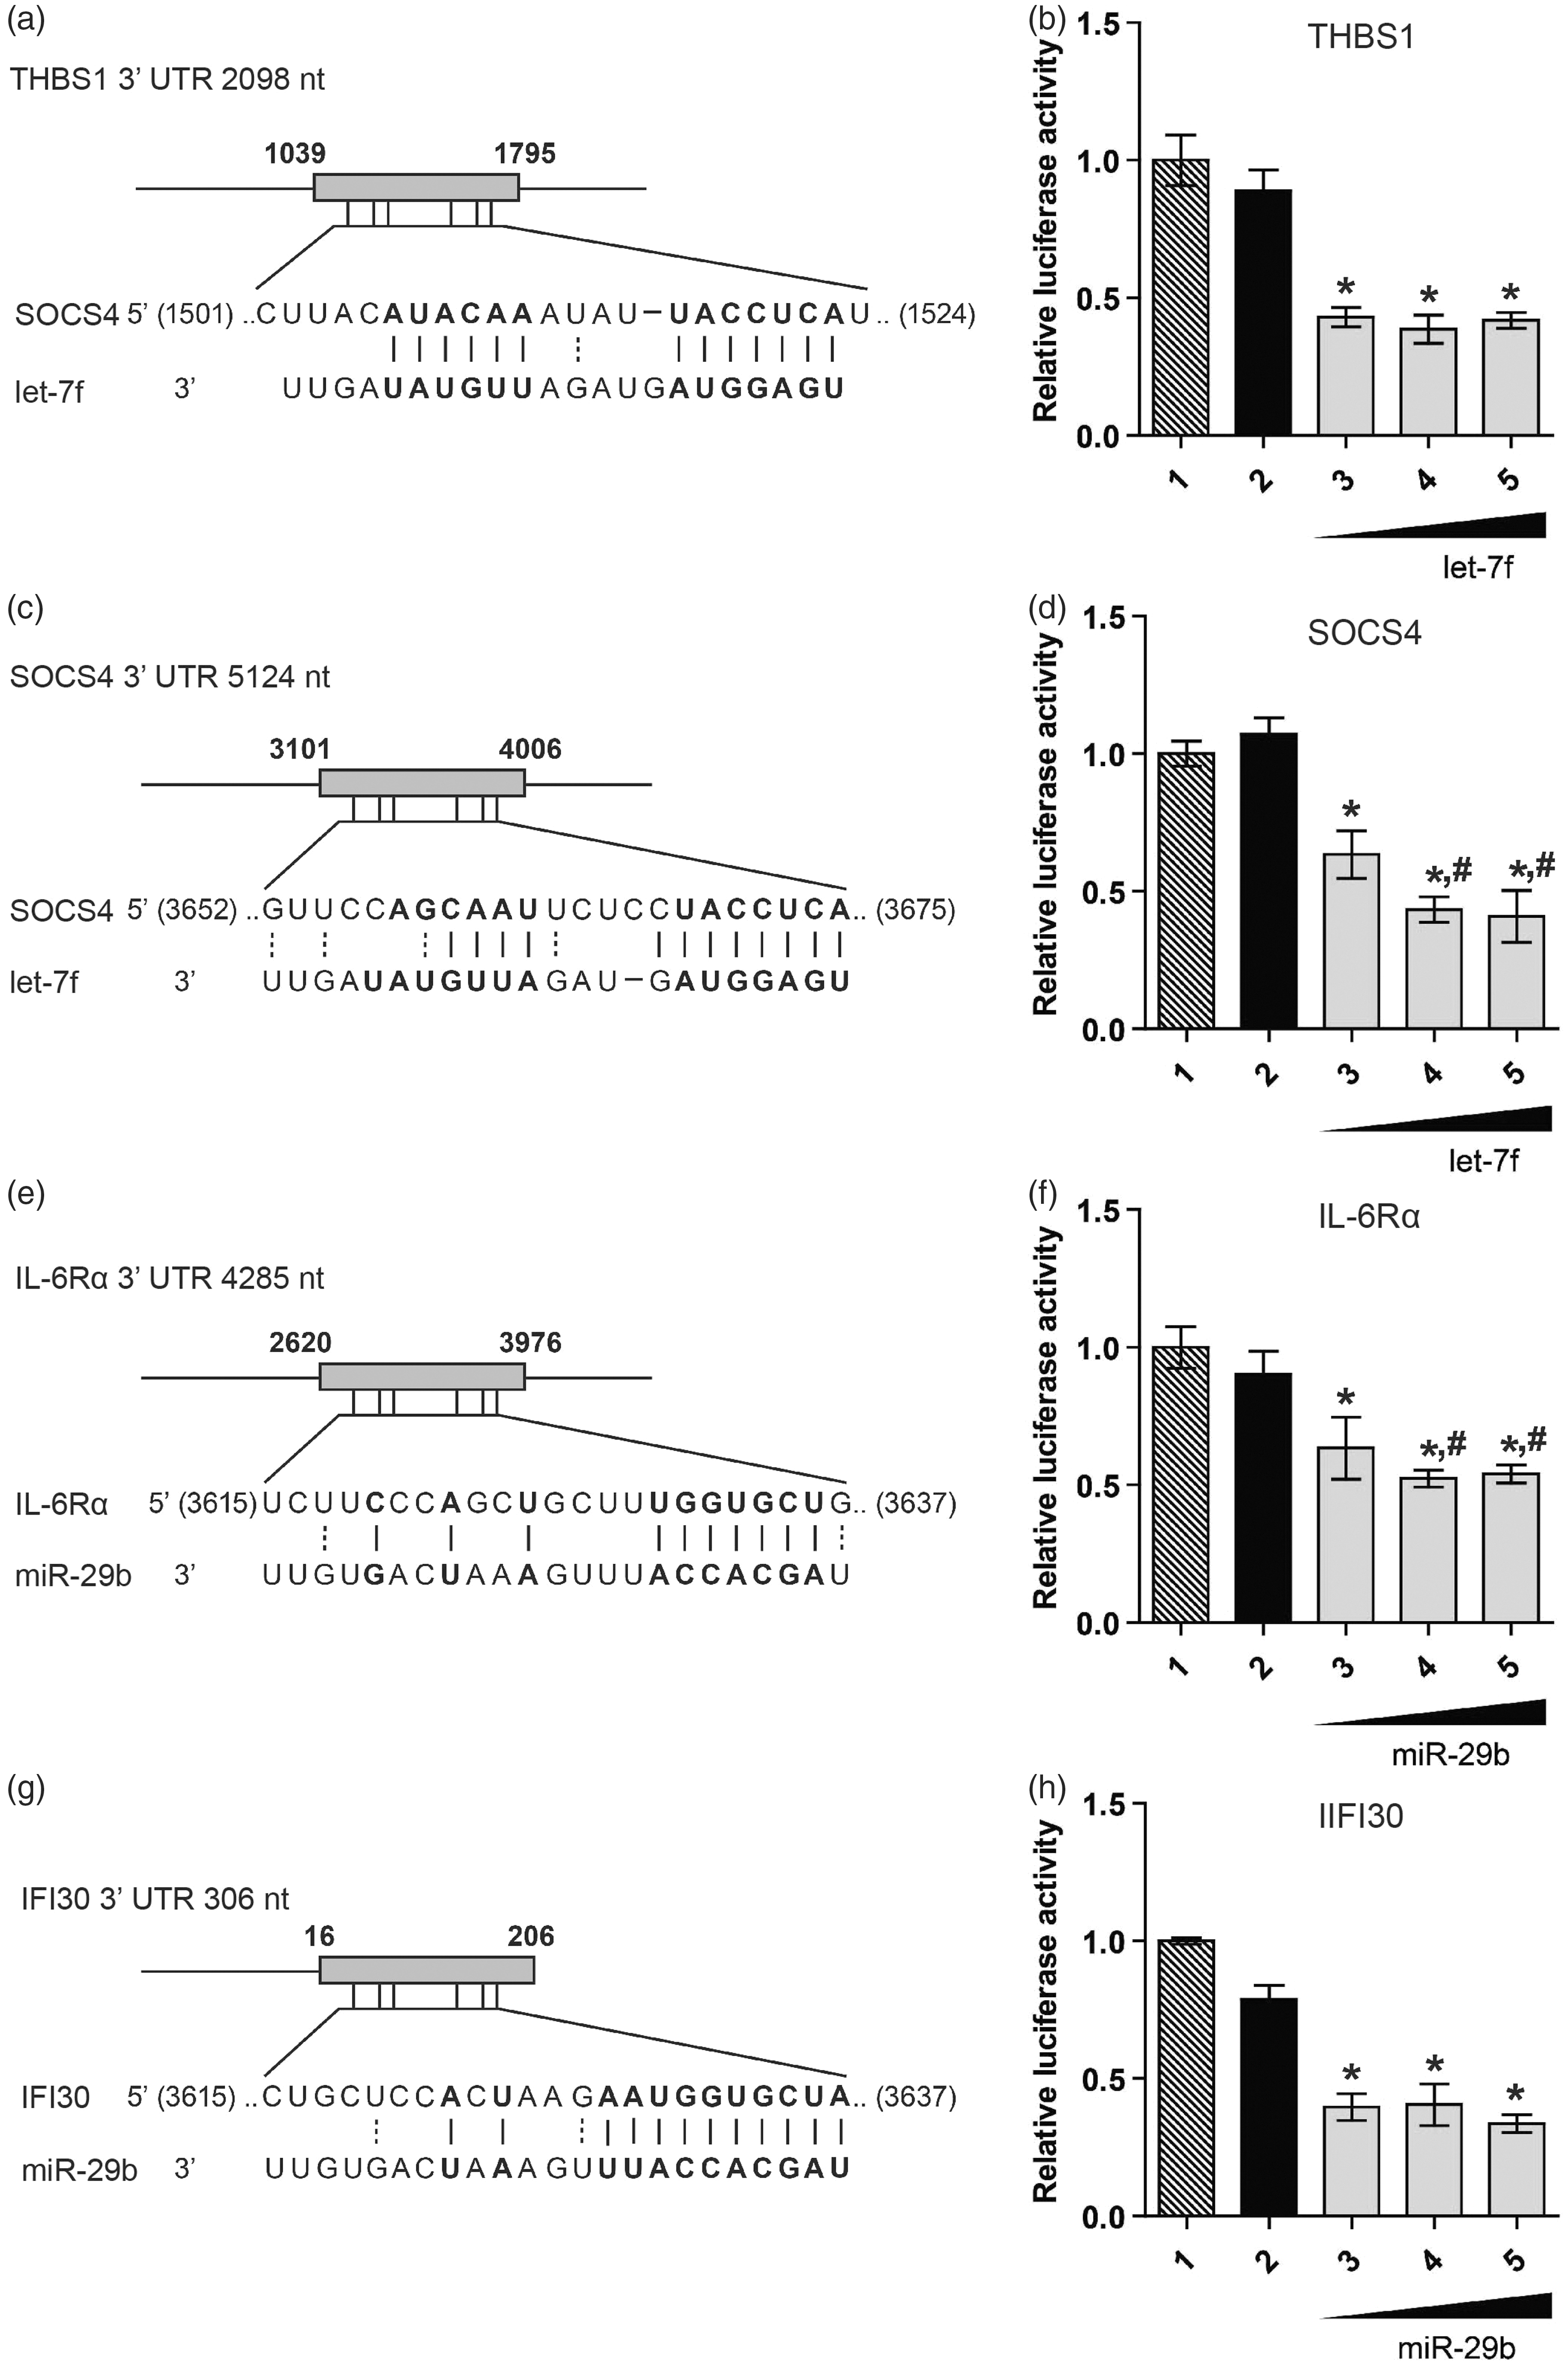
miRNA mimics modulate expression of target proteins linked to the immune response
To confirm that LPS-responsive miRNAs can modulate protein levels of target genes, differentiated macrophage cultures were transfected with mimic miRNAs or their specific inhibitors, and levels of target proteins monitored. We observed ∼ 14-fold increase in miR-29b levels compared with untransfected control (data not shown). Figure 4a shows a significant reduction in IL-6Rα protein in cells transfected with miR-29b mimic in a dose-dependent manner. Co-transfection with miRNA inhibitor rescued miR-29b regulation of IL-6Rα, as noted by the higher protein levels compared with mimic-only transfection, but comparable with negative miRNA mimic transfection. Similarly, transfection of let-7f mimics reduced SOCS4 protein levels two-fold, but not in the presence of miRNA inhibitors (Figure 4b). The transfection with mimics or inhibitors had no apparent effect on the viability of the cells, as observed by MTS assay (Supplementary Figure S2). These results confirm that IL-6Rα and SOCS4 are direct targets of miR-29b and let-7f, respectively.
MiR-29b and let-7f targets genes involved in immune responses. THP1-differentiated macrophages were transfected with miR-29b and let-7f mimics, inhibitors and a negative control miRNA mimic at the final concentrations indicated. After 36 h, cellular levels of (a) IL-6Rα and (b) SOCS4 were analyzed by immunoblotting. GAPDH was used as the internal control. Normalized levels of target proteins are shown graphically. The data are representative of three independent experiments.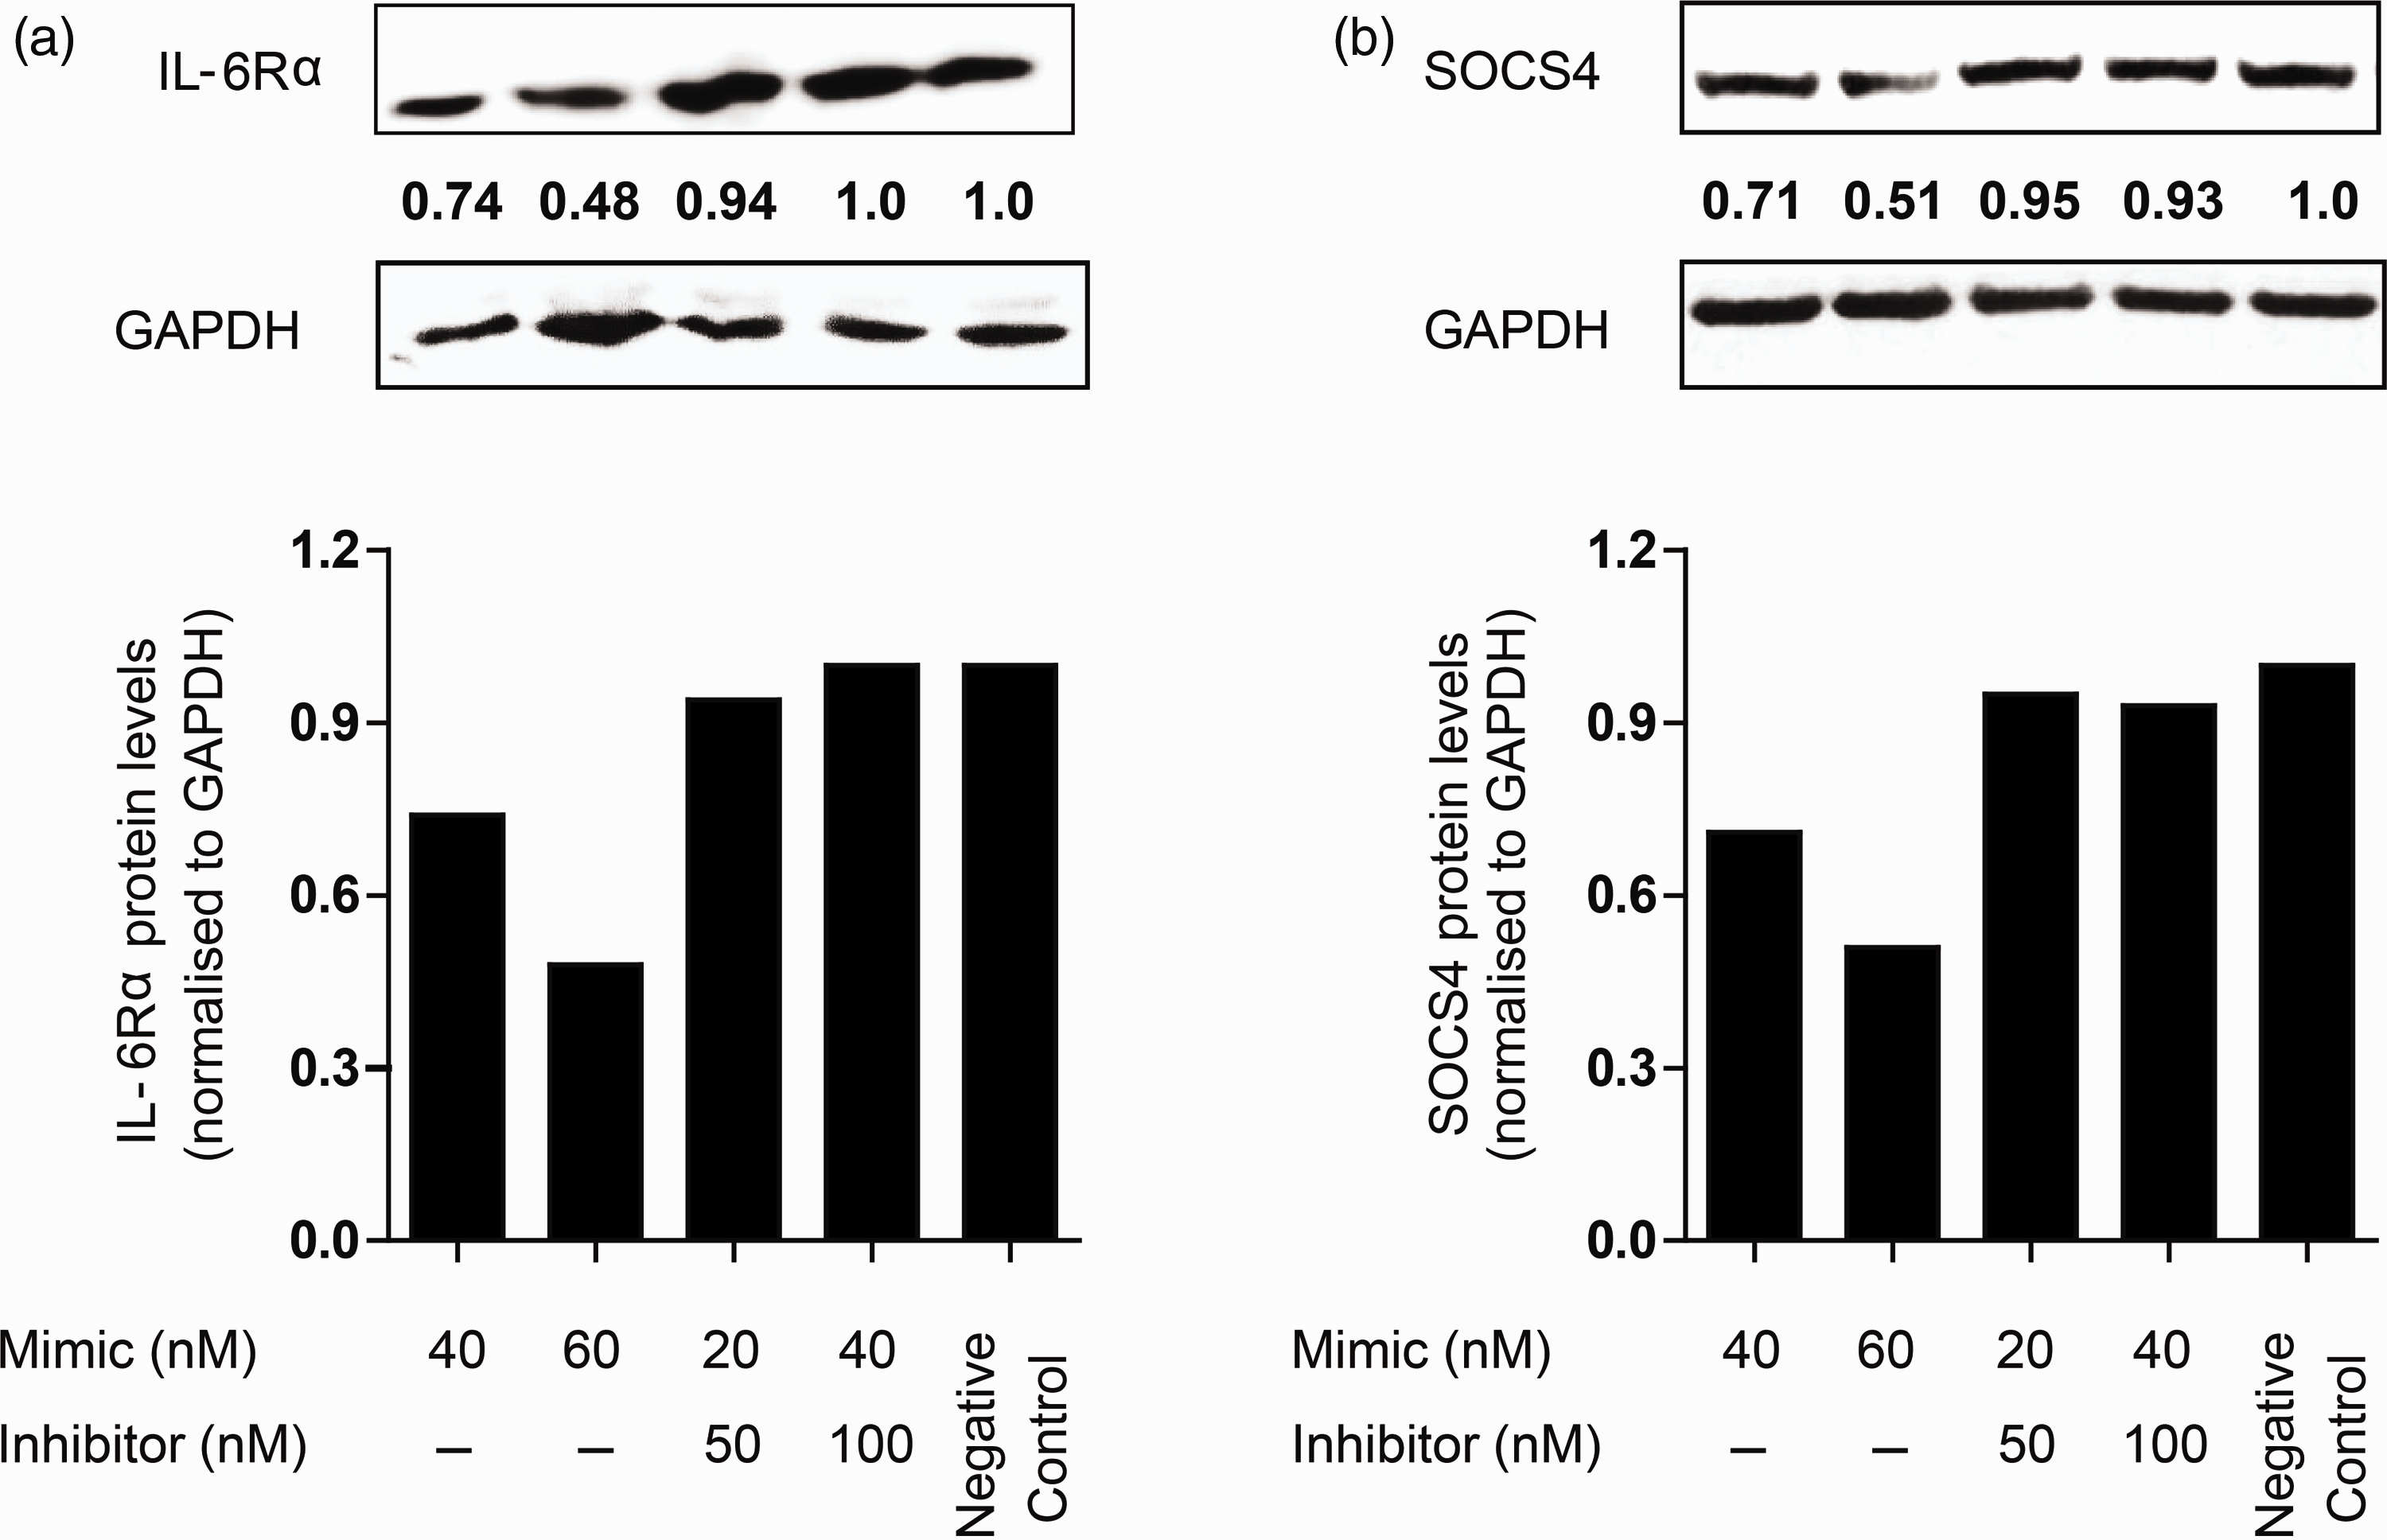
Discussion
The binding of LPS to TLRs initiates signaling cascades that trigger the host response against invading pathogens. Numerous studies on TLR4 ligands have revealed the mechanistic aspect of this interaction and only recently has the miRNA response begun to be characterized.17,18,31 Currently, very little is known about these responses to periodontal pathogens. Given the fact that activation of different TLRs may affect downstream signaling, we sought to compare the extent to which miRNA profiles are affected by differences in TLR ligands and to examine the regulation of predicted gene targets by LPS-responsive miRNAs. Further, environmentally-induced alterations in LPS structure may modify TLR signaling and thus miRNA levels, which prompted us to include Pg-CSE LPS, an LPS derived from P. gingivalis grown in CSE. 13 Of note, CSE has been reported to alter gene expression patterns of P. gingivalis.13,14 In salivary samples derived from smokers, Buduneli et al. 15 reported a significant increase in the long-chain fatty acids associated with anaerobic bacterial periodontopathogens, 15 However, the degree to which CSE alters LPS structure is not completely understood and is the subject of ongoing investigation (DA Scott, personal communication).
This study identified IL-6Rα as a novel target of miR-29b. LPS treatment leads to a reduction in miR-29b, which may limit post-transcriptional modulation of IL-6Rα expression. IL-6Rα is found as either membrane-bound or soluble (sIL-6R) forms, both of which can potentiate IL-6 signaling. LPS treatment of differentiated macrophages induces levels of otherwise undetectable IL-6, while sIL-6R is reported to increase in certain inflammatory conditions. 32 Importantly, IL-6R trans-signaling is required for the active recruitment of monocytes at the site of inflammation. 33 Unlike ubiquitously expressed gp130, IL-6Rα has restricted expression on myeloid cells, including monocytes and macrophages. Thus, IL-6Rα could play a decisive role in IL-6 signaling and our results suggest that down-regulation of miR-29b could contribute to this pathway. Moreover, a recent study has reported that miR-29b regulates transcript levels of TNFAIP3-encoded A20, a negative regulator of NF-κB signaling, 34 further indicating that reduced expression of miR-29b upon LPS stimulation is required for active pro-inflammatory NF-κB signaling. Together, these results show that miR-29b is an important component of the inflammatory response.
The SOCS family of proteins regulates cytokine signaling by dephosphorylation of JAKs and thus plays a key role in maintaining the homoeostasis of immunological responses. These proteins are induced upon LPS stimulation and various miRNAs have been shown to differentially regulate SOCS family transcripts.35–37 Recently, miR-98 and let-7 family members have been shown to modulate SOCS4 during Cryptosporidium parvum infection. 38 The let-7 family is down-regulated in response to C. parvum thereby inducing SOCS4 expression. Similarly, our data demonstrate that let-7f, which is down-regulated in response to LPS derived from oral pathogens, targets the 3′UTR of SOCS4. There are three known binding sites for the let-7 family located at the 1843–1850, 2820–2826 and 3668–3675 nucleotide positions of the SOCS4 3′UTR. Hu et al. 38 reported let-7f targeting of SOCS4 at the highly conserved 1843–1850 3′UTR position. We screened the let-7f interaction that encompasses only the 3668–3675 binding site and provide evidence for a novel functional binding site for let-7f on the SOCS4 3′UTR. In agreement, over-expression of let-7f in THP-1-differentiated macrophages leads to a reduction in SOCS4 protein levels, which was abolished in presence of let-7f inhibitors. Although our study did not specifically investigate the contribution of each let-7 binding to the target sites on SOCS4 3′UTR, it is known that miRNAs bind to multiple sites on target genes and act cooperatively to fine-tune protein levels. 1
Our results also demonstrate that let-7f regulates TSP-1, a matricellular protein expressed at sites of tissue damage and myeloid-cell influx in response to innate and inflammatory signaling. 39 It has been previously reported that TSP-1 and let-7f exhibit antagonistic expression levels,40,41 but our results provide evidence for direct let-7f modulation of TSP-1. TSP-1 is a regulator of inflammation that can be pro- or anti-inflammatory depending upon the context in which it is expressed. On the one hand, TSP-1 promotes the recruitment of monocytes and macrophages to sites of inflammation, while increasing T-cell retention, 42 and if these cells are pro-inflammatory in nature, i.e. comprise classically-activated macrophages or Th1 and Th17 cells, then TSP-1 can be considered to be part of the pro-inflammatory response. On the other hand, during catabasis these cells are either absent, suppressed or their phenotype is switched to being anti-inflammatory, and TSP-1 also contributes to these processes, partly owing to the importance of TSP-1 in activating latent TGF-β. 43
Macrophages present MHC class II antigens to stimulate CD4+ T-cells. The processing of endocytosed Ags occurs in lysosomes and is mediated by lysosomal thiolreductase or IFI30 via reduction of protein disulfide linkages. 44 LPS-induced cytokines are shown to stimulate IFI30 production. 45 Here, our data show direct regulation of IFI30 by miR29b. Ugalde et al. 46 previously reported this interaction in the mouse, which we now extend to human IFI30 3′UTR. Therefore, a decrease in miR-29b levels in response to LPS may lead to an increase in IFI30 levels that may facilitate antigen presentation, and may augment the host response against pathogens.
LPS from periodontal pathogens elicited TLR-mediated transcriptional changes in miRNA expression. Of note, similar changes in both mature and pri-miRNA levels for miR-32, miR-16 and miR-146a were identified. Induction of miR-146a levels and the concomitant secretion of TNF-α are considered hallmarks of LPS stimulation. 17 A actinomycetemcomitans LPS-treated samples released high amounts of TNF-α (data not shown), which correlated with elevated levels of both pri-miRNA and mature miR-146a. Interestingly, Pg-CSE-LPS surpassed WT P. gingivalis LPS in miR-146a induction. These results indicate that environmentally-induced changes in LPS structure alter the miRNA response relative to WT LPS. Our results also suggest that LPS-responsive miRNA is subject to additional regulatory mechanisms, as evident by differences in mature and precursor levels of let-7f and miR-16. Indeed, modulations in miRNA processing have been reported during the inflammatory response. For instance, inflammation-responsive p53 and TGF-β-induced SMAD interact with the Drosha-microprocessor complex to enhance pre-miRNA processing.47,48
This study has limitations. A comparison of P. gingivalis to Pg-CSE-LPS but not A. actinomycetemcomitans to A. actinomycetemcomitans-CSE-LPS was made. As smoking is recognized as a significant risk factor in the progression of periodontitis, additional studies incorporating CSE-modified LPS and other pathogen-associated molecular patterns will shed further light on the effect of environmental pressures on the host response. Moreover, owing to the lack of structural data, it is not possible to directly relate differences in miRNA expression to CSE-induced structural modifications to LPS. Elucidation of these modifications will likely help explain differences in expression profiles identified in our study. We also did not incorporate ‘ultrapure’ LPS in our study. Although LPS was carefully extracted to exclude protein and nucleic acid contaminants, it is possible that our results reflect macrophage responses to minute concentrations of these factors.
Finally, the dominant trend among the LPS-responsive miRNAs was a down-regulation of expression, the outcome of which will likely facilitate translation of mRNA transcripts generated as a part of immune response. Of these, an appreciable number of miRNAs commonly expressed among the three different groups are suggestive of an early miRNA ‘core’ response. Our data also revealed the down-regulation of 14 miRNAs unique to P. gingivalis and Pg-CSE-LPS. This may be attributed to their common origin and to differences in TLR specificity. Indeed, unlike A. actinomycetemcomitans LPS, which is a TLR4 agonist, P. gingivalis LPS can bind to and elicit TLR2, TLR4 and TLR7 signaling. 7 Conversely, there were 15 miRNAs induced specifically in response to P. gingivalis-CSE. Taken together, these results demonstrate convergent and divergent miRNA expression patterns as a function of LPS treatment. These miRNAs may constitute potential therapeutic candidates for the design of strategies aimed at mitigating or stimulating immune responses for various human diseases.
Conclusion
This study demonstrates that LPS derived from A. actinomycetemcomitans, P. gingivalis and P. gingivalis-CSE induces convergent/divergent miRNA responses in human macrophages. CSE-modified LPS alters the miRNA responses induced by its WT derivative and that LPS-responsive miR-29b and let-7f target IL-6Rα and SOCS4, respectively, two key genes linked to inflammation and immunity. Together, these observations highlight miRNAs as integral components in fine-tuning the innate response to periodontal pathogens. Further investigation regarding the immunomodulatory role of these miRNAs is indicated.
Footnotes
Acknowledgements
We would like to thank Drs Keith Kirkwood (University of South Carolina) and David A Scott, (University of Louisville) for their kind gifts of purified A. actinomycetemcomitans and P. gingivalis / Pg-CSE-LPS, respectively.
Funding
This study was supported by the National Institute of Dental & Craniofacial Research of the National Institutes of Health [R01DE021052].
Conflict of interest
The authors do not have any potential conflicts of interest to declare.
References
Supplementary Material
Please find the following supplemental material available below.
For Open Access articles published under a Creative Commons License, all supplemental material carries the same license as the article it is associated with.
For non-Open Access articles published, all supplemental material carries a non-exclusive license, and permission requests for re-use of supplemental material or any part of supplemental material shall be sent directly to the copyright owner as specified in the copyright notice associated with the article.