
Abstract
Many modern vaccines use defined adjuvants to stimulate the innate immune system and shape the adaptive immune response. The exact nature of these innate signals and whether immune differentiation can originate within the periphery is not known. Here we used an ovine lymphatic cannulation model to characterise the cellular and transcriptomic profile of the afferent lymph following injection of a liposomal vaccine formulation incorporating diphtheria toxoid and the innate stimulator poly(I:C) over a 78-h period. The response to this vaccine featured an early activation of broad pro-inflammatory pathways (e.g. TLR signalling and inflammasome pathways) and the transient recruitment of granulocytes into the lymph. At 24 h a more monocytic cellular profile arose coinciding with a transition to a specific antiviral response characterised by the up-regulation of genes associated with the receptors typical for the viral mimic, poly(I:C) (e.g. TLR3, RIG-I and MDA5). At the latest time points the up-regulation of IL-17A and IL-17F suggested that Th17 cells may participate in the earliest adaptive response to this vaccine. These data provide the most comprehensive picture of the cellular and molecular mechanisms that link the periphery to the draining lymph node following vaccination, and indicate that the immune response is capable of specialising within the periphery.
Introduction
Vaccines have made a major impact on the control of infectious diseases worldwide. Many of the most successful vaccines, such as the small pox vaccine, were developed before a true understanding of their mode of action. It has been relatively recently that advances in microbiology and immunology have provided a rational explanation of how vaccines confer protection.1–4 However, the control of several major diseases, including malaria, cancers, tuberculosis and HIV, are still urgently in need of effective or improved vaccines. It is generally thought that the successful development of vaccines against these ‘difficult’ diseases will require another major scientific breakthrough in vaccine research.2,3
Modern vaccines increasingly use defined adjuvants to boost the immune response and effectively induce desirable immune outcomes.3,4 Different innate stimulators have been shown to induce qualitatively different innate and adaptive responses, raising the possibility that their incorporation into adjuvant systems could be used to induce tailored responses to vaccination.3,5 There has been little investigation of exactly what components of this innate immune response can be transmitted from the injection site, or if immune specificity can originate within the periphery. A major limitation to studying this aspect of vaccine-induced immune responses is that the effect of the innate immune response on the developing adaptive response is transmitted by innate cells and signalling molecules from the peripheral injection site to the draining lymph node via the afferent lymph. 3 This afferent lymphatic compartment is virtually inaccessible in rodent models and, as such, most studies of the innate immune responses induced by vaccines are performed in vitro or in lymph node and peripheral blood compartments.
We have recently reported the use of an ovine cannulation model to characterise the in vivo cellular response to different vaccine formulations within afferent lymph draining the injection site.6,7 In the present study, we have measured and characterised the types and transcriptomic profile of the afferent lymph cells following injection of a modern, effective next generation vaccine delivery formulation incorporating antigen and the innate stimulator, poly(I:C). We show that this response is a dynamic event in which the signals derived from the periphery evolve from a pro-inflammatory phenotype into a more specific adjuvant driven antiviral response over time. These results indicate that the immune response is capable of specialising within the periphery and passing this information onto the lymph node. They also provide a rational explanation of how innate immune signals generated in the periphery are translated to the draining lymph node over time.
Materials and methods
Lymphatic cannulation and immunisations
Pseudoafferent lymphatic vessels were generated and cannulation was performed as in de Veer et al. 7 Merino sheep had both their prefemoral lymph nodes surgically removed at 1 yr of age. Approximately 1 yr later, a second surgery was performed to insert a 0.96 × 0.58-mm heparin-coated polyvinyl chloride cannula into the pseudoafferent (previously efferent) lymphatic duct of both sides. Three sheep sides (one side per sheep) with reliable flow of afferent lymph were injected with 1 ml of liposomes [12% soy bean lecithin:cholesterol (9 : 1); Lipoid, Ludwigshafen, Germany] containing 50 µg of poly (I:C) (Sigma) and 400 µg diphtheria toxoid (DT) as described previously. 8 Samples were injected subcutaneously in the area drained by the prefemoral lymph node. Handling of animals and experimental procedures were approved by the Monash University Animal Ethics Committee in accordance with the relevant licensing agreement.
Lymphatic collection, lymphocyte depletion and cell labeling
Lymph samples were collected and cell-type analysis by flow cytometry was performed according to the methods outlined in de Veer et al. 9 Afferent lymph was collected for a period of 3 h at 6, 28, 53 and 78 h post-vaccination. For depletion of lymphocytes samples were prepared for flow cytometry as in de Veer et al. 9 except that prior to staining 1 × 10⁸ lymph cells were incubated for 15 min on ice in 1 ml of depletion mix [anti-CD45R clone 20.96 (neat hybridoma supernatant), anti-CD4 clone 44.38 (1/100 hybridoma supernatant) and anti-γδ TCR clone 86D (1/25 hybridoma supernatant) (hybridoma supernatants were generated in-house using cell lines described previously 8 )], after which 9 ml of wash buffer was added and the cells centrifuged. The pellet was washed twice and resuspended at 2 × 10⁷ cells/ml. An equal volume of washed magnetic beads coupled with anti-mouse Ig (BioMag; Polysciences, Warrington, PA, USA) were added at five beads per cell, and the mixture gently rotated for 20 min at 4℃ before the tubes were placed beside a neodynium magnet until the solution cleared. The magnet step was repeated and the remaining cells were counted and 5 × 10⁵ cells were reserved for flow cytometry. The main cell pellet was resuspended in 350 µl of cell lysis buffer RLT (Qiagen, Valencia, CA, USA) for RNA extraction. Flow cytometric staining and cell type determination was carried out as in de Veer et al. 9 Samples were analysed on an LSR2 machine (Becton Dickinson, Franklin Lakes, NJ, USA).
RNA extraction, mRNA library preparation, cluster generation and next-generation sequencing
Total RNA was extracted from the main cell pellet using an RNeasy Micro Plus Kit (Qiagen) according to the manufacturer’s instructions. RNA quantity was measured using a Nanodrop (Nanodrop Technologies, Wilmington, DE, USA) and RNA quality was assessed using an Agilent Bioanalyzer (Agilent Technologies, Foster City, CA, USA). Three samples of RNA from each time point were sent for mRNA library preparation and next-generation sequencing at the Australian Genome Research Facility (Parkville, Australia; www.agrf.org.au). The mRNA libraries for each sample were prepared from total RNA using an Illumina mRNA-seq-8 sample preparation kit (Illumina, San Diego, CA, USA). Briefly, poly-A mRNA was purified from total RNA using poly-T-oligo attached magnetic beads. The RNA was then fragmented into small pieces using divalent cations under elevated temperature. First-strand cDNA synthesis was performed using reverse transcriptase and random primers, followed by second-strand synthesis with DNA polymerase I and RNaseH. End repair processing, polyadenylation and ligation of adaptors were then performed. The product was then purified and enriched by PCR.
Samples were hybridised to an eight-lane flow cell using an Illumina Cluster Station (Illumina, San Diego, CA, USA). Single end 100 bp next-generation sequencing was performed using the Illumina HiSeq2000 platform (Illumina). Base calling was performed using the HiSeq Sequencing Control Software (Illumina). Quality control and conversion to fastq format was performed using the Illumina Genome Analyzer pipeline (Illumina).
Analysis of next-generation sequencing data
As limited annotation data are available for ovine genes, the reads were aligned, using the SHRiMP read aligner, to mRNA sequences from the Bos taurus genome [National Center for Biotechnology Information (NCBI) build 5, version 2], as validated previously. 10 Read alignment counts per gene were analysed using edgeR, 11 and genes with fewer than 10 alignments in total were discarded. The dispersion was estimated using EdgeR's trend mode, that is dispersion was taken to be a smoothly varying function of the total count for each gene. A likelihood ratio test was performed and the data were filtered on the basis of P-value (P ≤ 0.05) to identify genes whose expression changed significantly over time. An arbitrary cut-off of ± twofold change in expression was applied to identify changes in gene expression that are more likely to be biologically significant. All gene expression data are publicly available via NCBI's Gene Expression Omnibus (Series Record GSE38533).
Hierarchical clustering
Hierarchical clustering was performed to identify common patterns of gene expression among genes that were significantly altered over time (P ≤ 0.05) and had at least a ± twofold change in expression at a minimum of one time point. Hierarchical clustering was performed using Cluster 3.0 (correlation centred similarity metric and centroid linkage) and the results visualised using Java Treeview. 12 Clusters were visually selected and gene lists associated with each of these clusters were extracted for further analysis.
Functional annotation
The Metacore knowledge database and software suite (Thomson Reuters, New York, NY, USA) was used to identify biological processes (gene ontologies), process networks and canonical signalling pathways over-represented by genes significantly altered at each time point and in each hierarchical cluster. Additionally, we used the ‘Analyse Networks’ algorithm to build signalling networks from the genes showing significantly altered expression at each time point. The biological processes, process networks, canonical pathways and custom built signalling networks are ranked based on the likelihood that the assembly of the genes within a given category occurred by random chance, which is displayed as a P-Value for the former three and as a Z-score (which considers the saturation of the network) for custom built signalling networks. For the visualisation of TLR and antiviral and IFN-α/β signalling pathways, expression data were overlayed on custom maps created in Pathway Map Creator (Thomson Reuters).
Real-time PCR validation of next-generation sequencing data
Real-time PCR was used to validate a subset of the next-generation sequencing results that were representative of the key findings and included genes that were both up- and down-regulated. cDNA was synthesised from RNA from each of the samples used for next generation sequencing using a Quantitect Reverse Transcription kit according to the manufacturer’s instructions (Qiagen). Primers were designed using Primer 3 software 13 on annotated ovine mRNA sequences or, when these were not available, sequences identified by alignment of bovine orthologues to the ovine genome (http://www.livestockgenomics.csiro.au/sheep/oar2.0.php OAR 2.0) (Supplementary Table S4). Real-time PCR was performed on individual samples in triplicate using SYBR Green master mix on an Eppendorf Realplex4 (Eppendorf, Hamburg, Germany). Expression was normalised to beta-actin, which was selected for stable gene expression as determined by next-generation sequencing. Eppendorf realplex software (Eppendorf) and Microsoft Office Excel were used to analyse the data. GraphPad Prism v. 5.00 (GraphPad Software, San Diego, CA, USA) was used for statistical analysis of real-time data (one-way ANOVA) and for correlation of real-time and sequencing data through the use of Spearman’s measure of correlation as described. 14
Results
Innate cell profile of afferent lymph
Previous studies have characterised the total cellular profile and antigen uptake in the afferent lymph following vaccination with the current liposomal formulation.
9
To concentrate on the major innate cells and APC, afferent lymph cells were enriched for APC by negative selection for lymphocyte markers. This procedure enriched neutrophils 4.2 times (± 0.82), monocytes 3.8 times (± 1.7) and dendritic cells (DCs) 2.3 (± 0.62), while lymphocytes were reduced by 51% (± 10.22%). In agreement with the previous study of whole lymph,
9
comparable and dramatic temporal changes were observed in the types of innate cells entering the afferent lymph following vaccination, with neutrophils the most common non-lymphoid cell type within afferent lymph at 6 h following vaccination (Figure 1). After 28 h this profile had shifted, with neutrophils declining and monocytes becoming more predominant. The proportion of DCs within the enriched populations dipped at 6–26 h owing to the large influx of neutrophils and monocytes; however, by 53–78 h most cell types had returned to baseline levels (Figure 1).
Vaccination induces temporal changes in cellular recruitment into afferent lymph. The percentage of neutrophils, monocytes and DCs in afferent lymph after lymphocyte depletion of cells collected for a period of 3 h before (pre) and at 6, 28, 53 and 78 h post-vaccination. All values are the mean ± SE of three cannulated sheep sides (one side per sheep). Significance was determined compared with pre levels using a one-way ANOVA, with a Bonferroni multiple comparison post-test. *P < 0.05, **P < 0.01.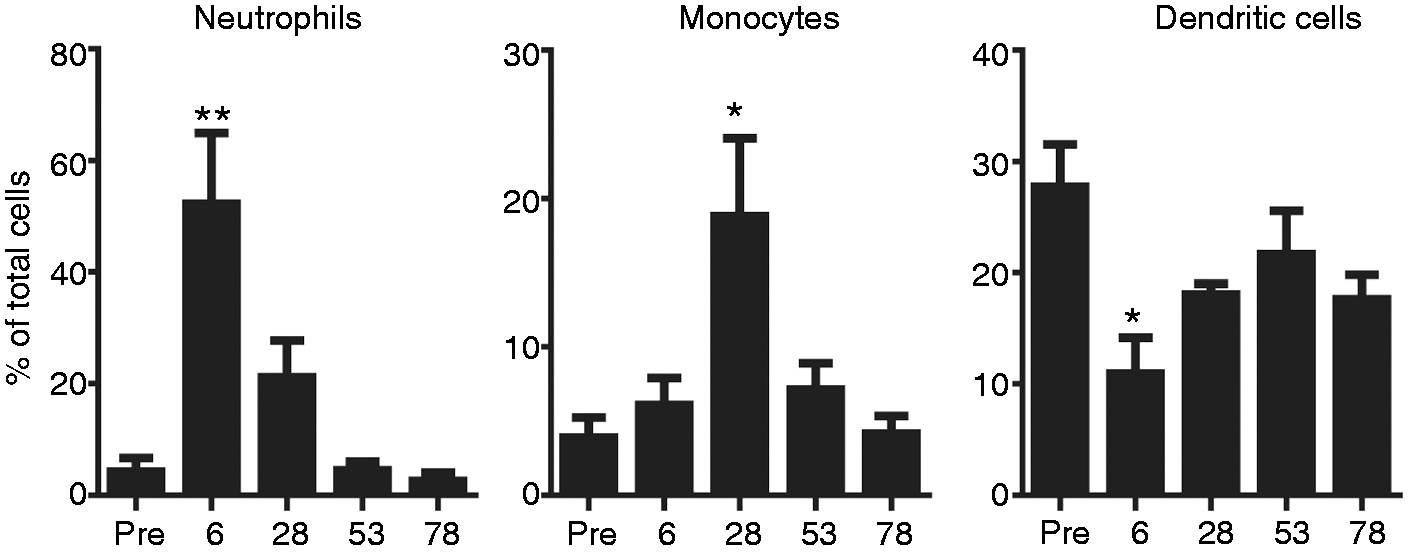
Transcriptome profile of afferent lymph cells over time after vaccination with DT- and poly(I:C)-containing liposomes
The lymphocyte-depleted fractions of afferent lymph cells collected at each time point were processed for next-generation sequencing. As limited annotation data are available for ovine genes, and given the close genetic relationship between cattle and sheep, raw sequencing reads were aligned to the bovine genome. It is possible that this approach overlooks some ovine-specific characteristics, such as poorly conserved genes or gene duplications; however, a similar approach has previously been validated
10
and is currently in use to improve the annotation of the ovine genome (http://www.livestockgenomics.csiro.au/sheep/oar2.0.php). By aligning our data to the bovine genome we identified 3068 genes, the expression of which changed significantly over time (P ≤ 0.05) with a fold-change of at least ± 2 at a minimum of one time point. Real-time PCR was performed on a subset of genes that were either up- or down-regulated, and showed a highly significant correlation between fold changes reported by real-time PCR and next-generation sequencing (see Figure 2) (Spearman’s correlation r = 0.7495, P < 0.0001).
Next-generation sequencing results are confirmed by real-time PCR. The next-generation sequencing data were validated by real-time PCR for subsets of genes that were up- or down-regulated during the response to the poly(I:C)-containing vaccine formulation (galectin-14, CCR9, TLR7, IRF7, IL-17F). There was good correlation between fold-changes reported by real-time PCR (line graphs) and next generation sequencing (colour bars) (Spearman’s correlation, r = 0.7495, P < 0.0001). Real-time PCR results are shown as mean fold-change relative to pre-vaccination controls ± SE. Next generation sequencing (NGS) results are shown in the colour bars where red, green and black colour bars represent up- and down-regulated, or unchanged expression, respectively.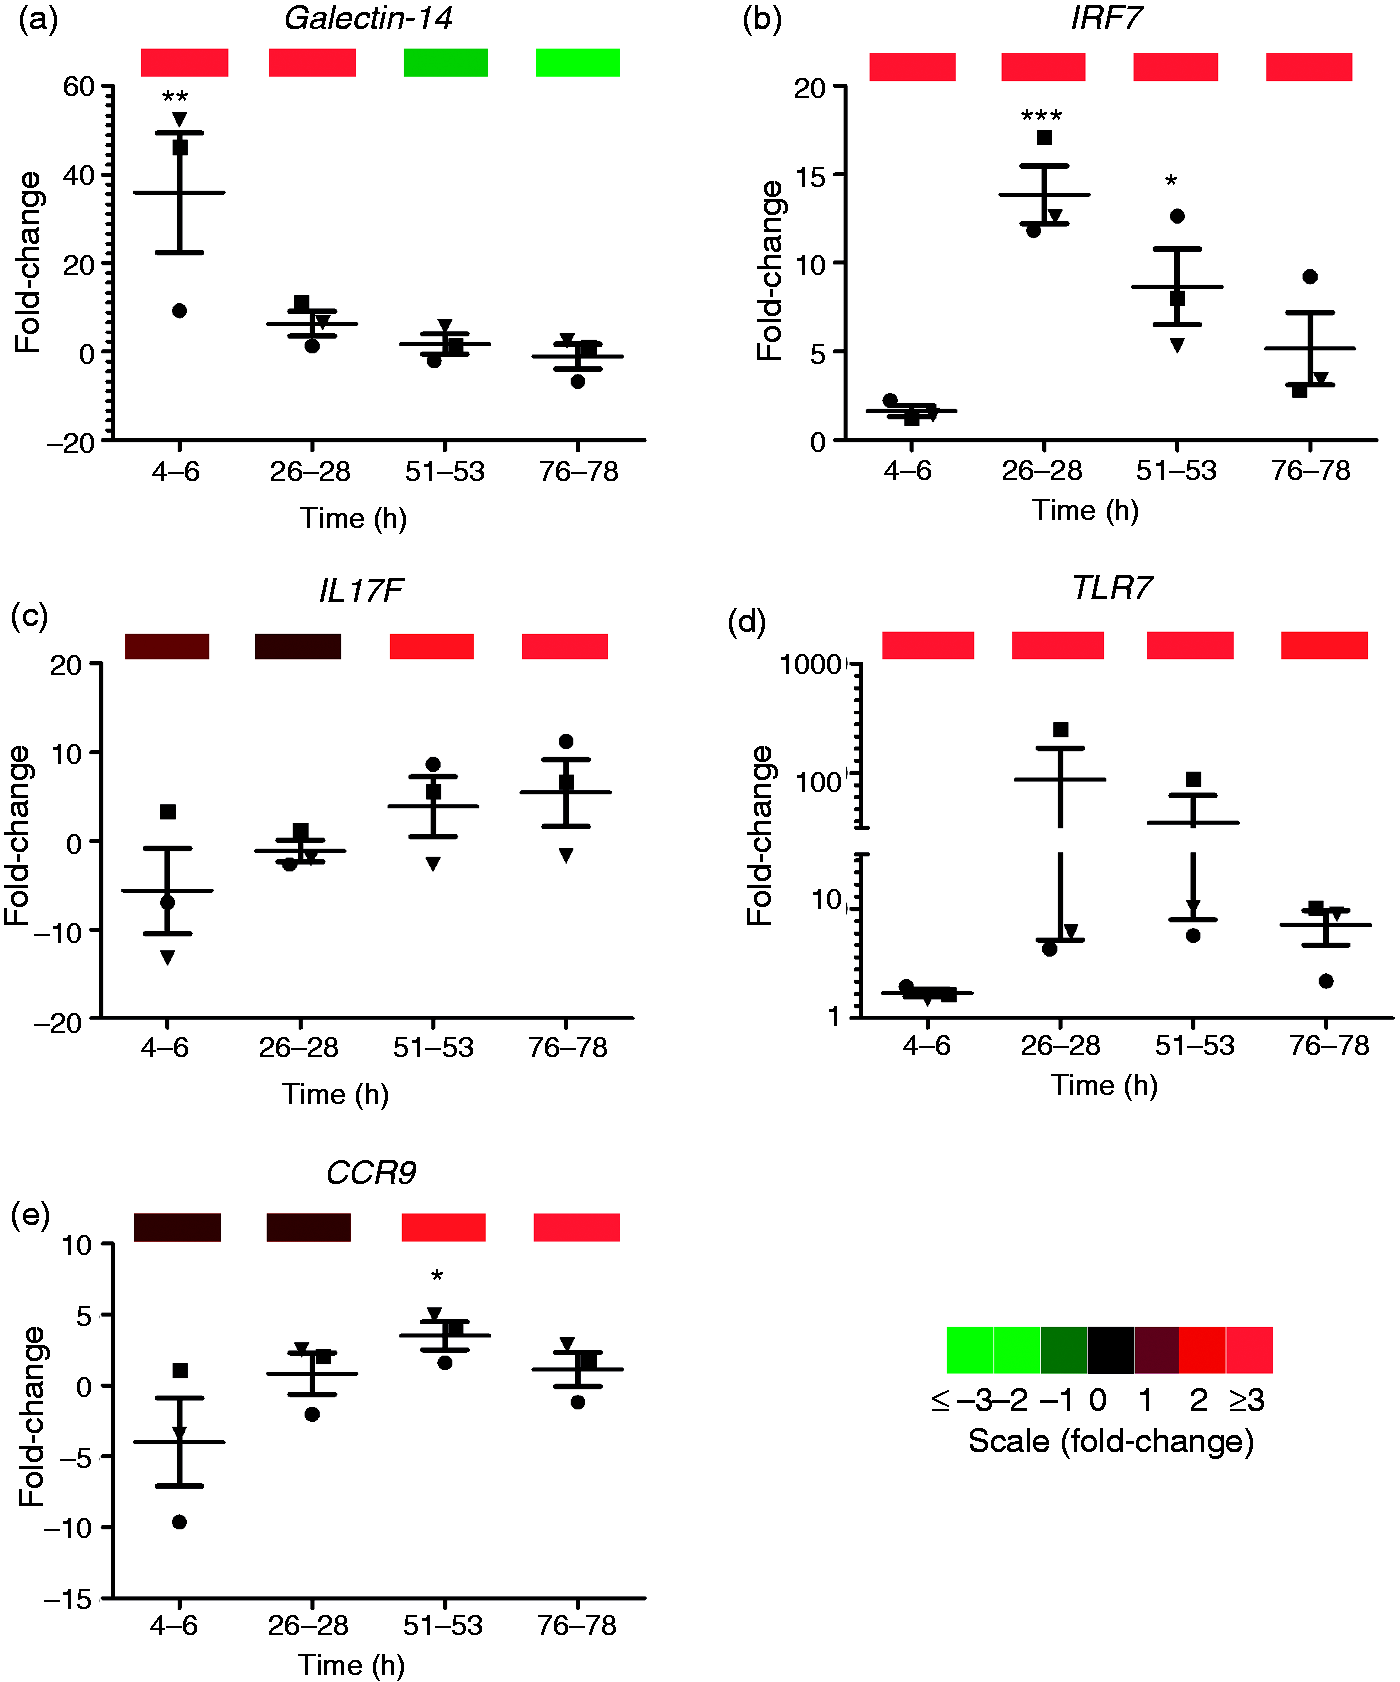
Key signalling pathways and regulatory genes activated over time after vaccination
As poly(I:C) is a known TLR ligand and a dsRNA virus mimic, we first examined whether the vaccine activated TLR and anti-viral signalling pathways. The earliest responses to vaccination were characterised by up-regulation of multiple TLRs (TLR1, 2, 4, 7, 8) and down-stream signalling and effector molecules with broad specificity (e.g. MyD88, IRF7, IRF3, NFĸB, IL-6, and IL8) (Figure 3). Of the up-regulated TLRs, the increased expression of those typically associated with responses to bacterial or fungal components (e.g. TLR2, TLR4) was confined to the first 24 h of the response (Figure 3). As the response progressed, the TLR profile became distinctly more antiviral and highlighted key roles for TLR3 and IRF7 in poly(I:C) gene induction, as both genes showed the most extensive connections over the time course within the TLR/antiviral pathway (Figure 3). Characteristic of the enrichment and persistence of antiviral pathways was the up-regulation of intracellular receptors for dsRNA (RIG-I, MDA5, LGP2), IFN regulatory factors (IRF7), TLR-3/IFN inducible chemokines (CXCL9, CXCL10, CXCL11), and interferon α/β-inducible genes [e.g. IRF1, IFIT2 (ISG54), IFI16, ISG15, PML], which showed peak expression at 28 h with sustained up-regulation to 78 h (Figure 3; Supplementary Figure S1). There was no change in the expression of IFN-α or IFN-β.
TLR signalling is a prominent feature of the early response to vaccination. Expression data for each of the time points were mapped to the custom TLR and viral signalling pathway using Metacore (Thomson Reuters, New York, NY, USA). Expression values are represented by thermometers, where up-regulated values are red and down-regulated values are blue. The time points are represented by the annotation 1 = 6 h; 2 = 28 h; 3 = 53 h and 4 = 78 h. If no thermometer is shown there was no significant change in expression. Green lines indicate positive interactions/activation; red lines indicate negative activation/inhibition; grey lines indicate unspecified interaction. B: binding; TR: transcription regulation; IE: influence on expression.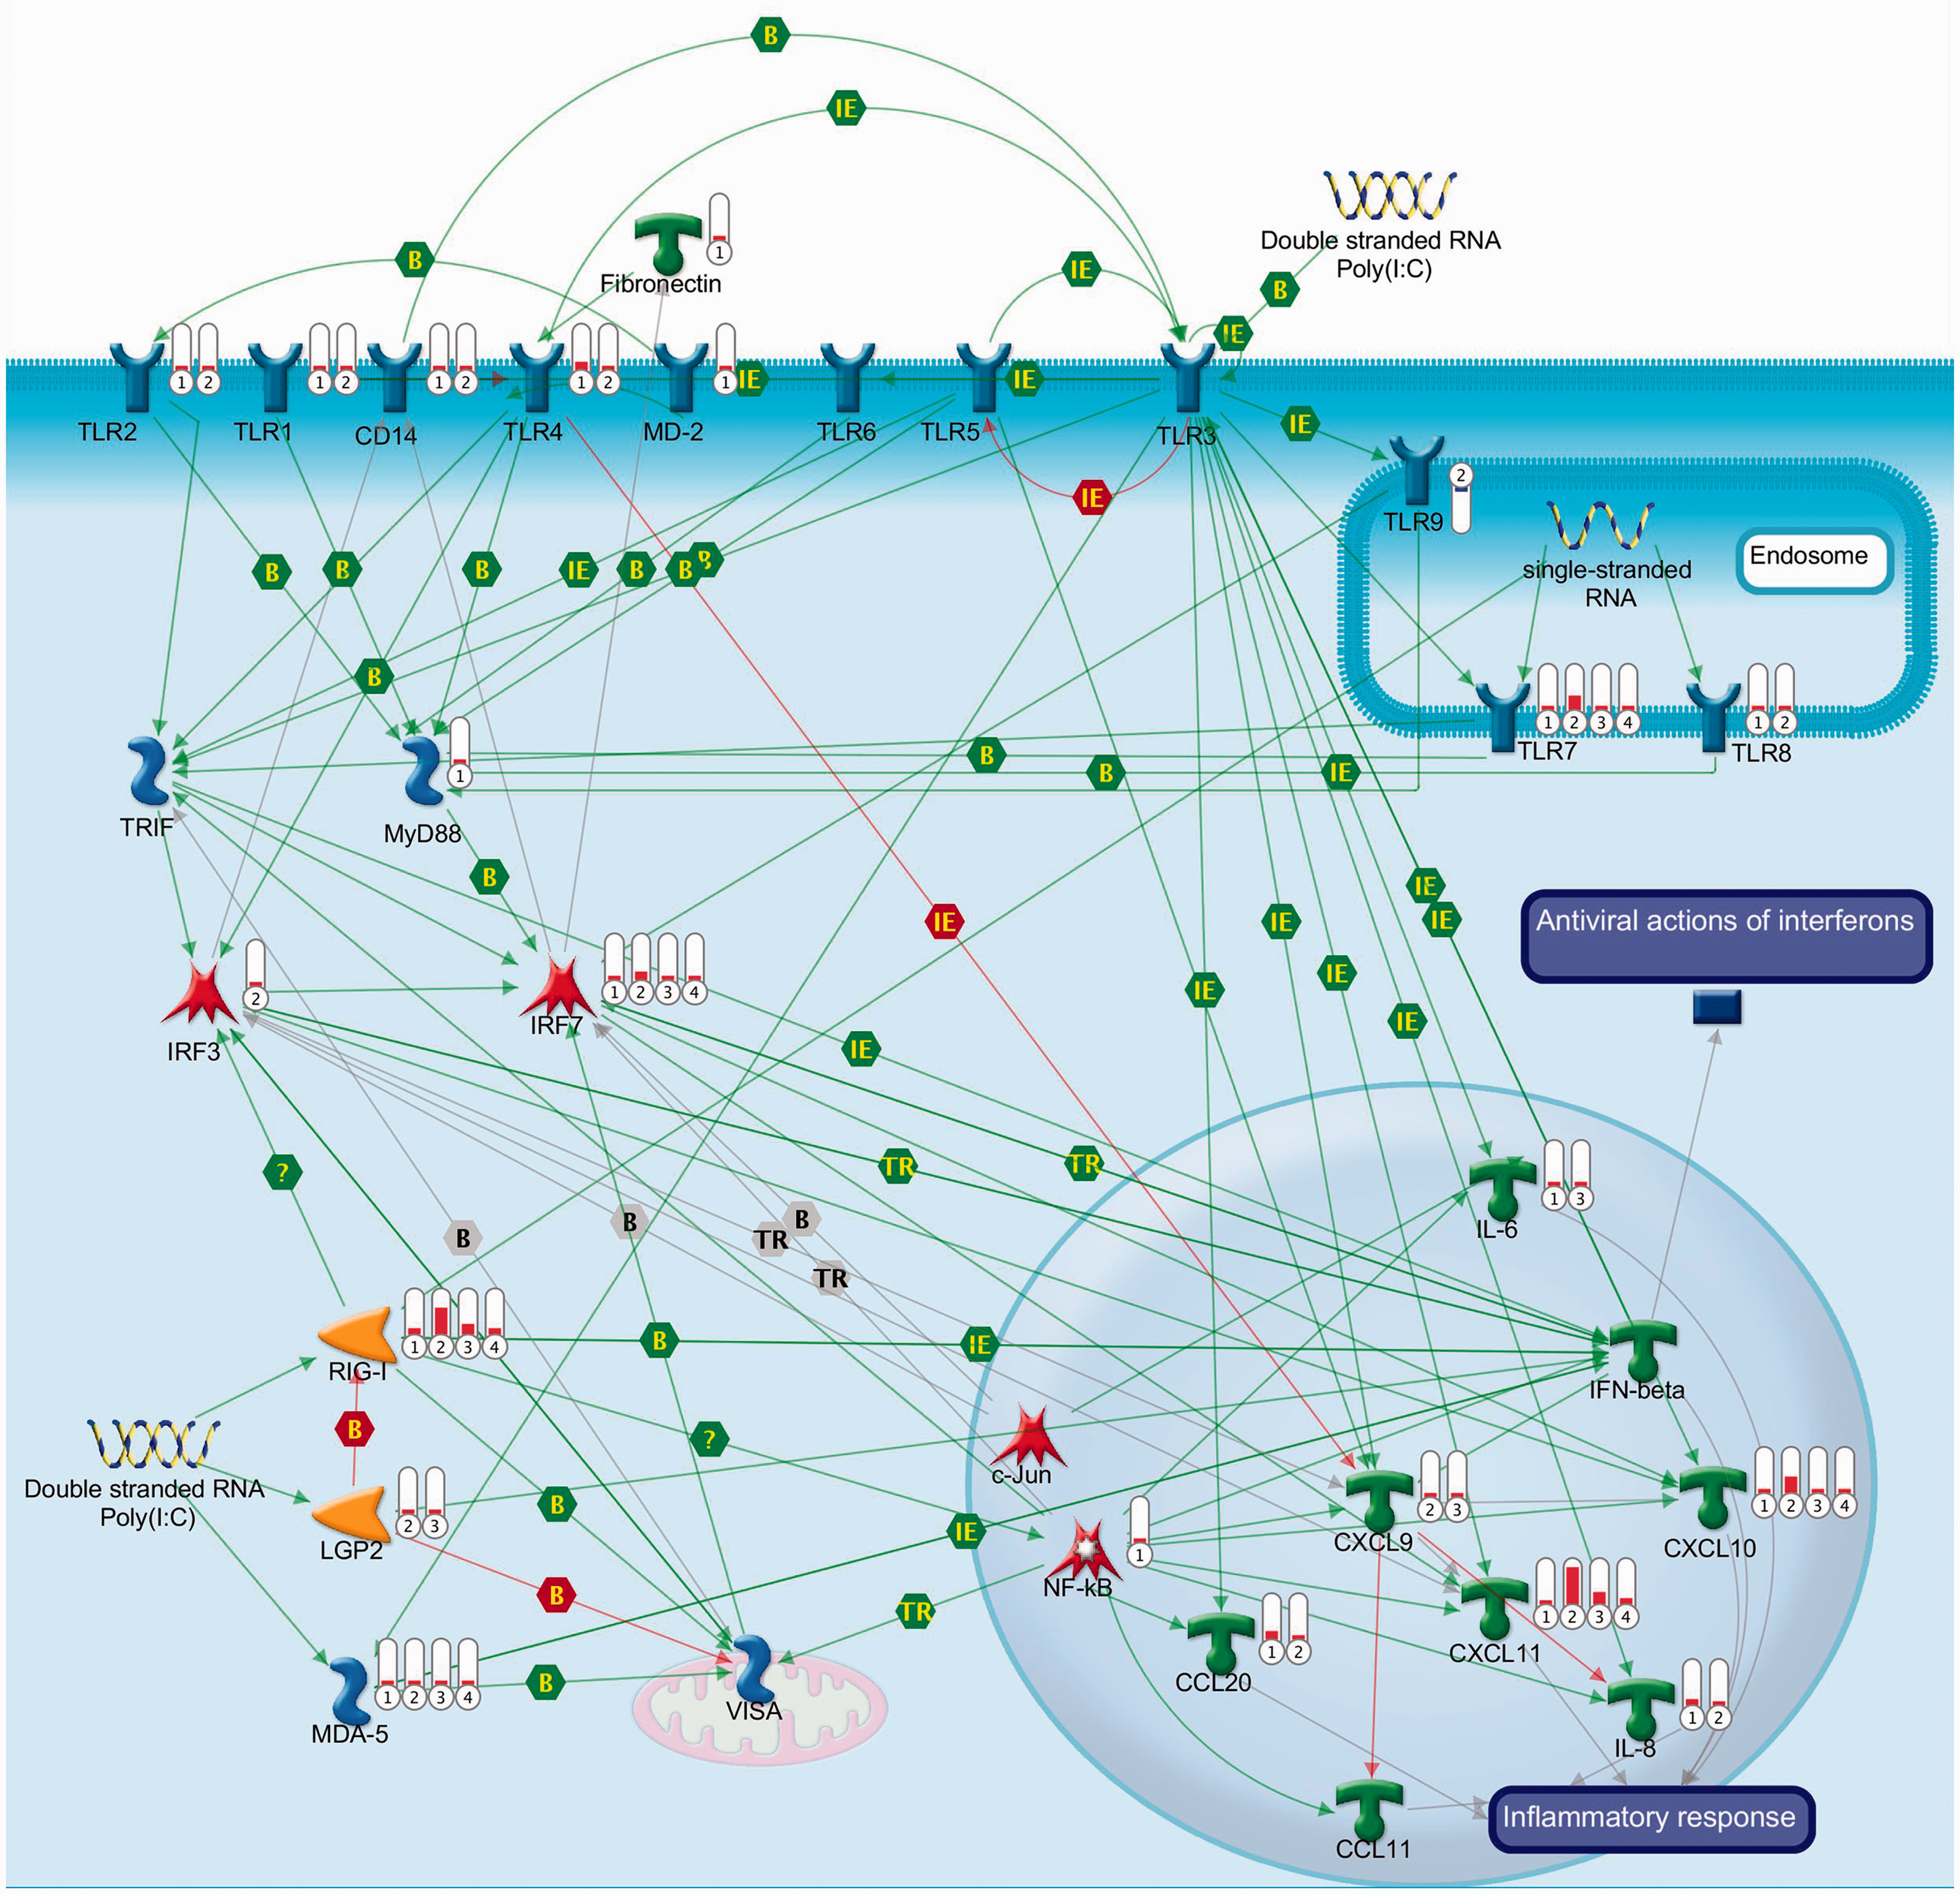
Genes and signalling pathways associated with different phases of the response to vaccination
To identify additional genes and signalling pathways associated with the vaccine response we next performed pathway and network analysis of genes up- or down-regulated at each time point, as well as hierarchical clustering to identify groups of genes, the expression of which correlated with different phases of the response (Figure 4). Construction of gene signalling networks (Supplementary Table S3) confirmed the importance of TNF-α, IL-1β, the NLRP3 inflammasome and the transcription factors NF-κB, HIF1A, STAT1, STAT3 and IRF in the early response to vaccination, as these genes featured in the highest ranking networks for these time points. Accordingly, expression of genes regulated by these transcription factors, including the pro-inflammatory cytokines TNF-α, IL-18, IL-1α and IL-1β, as well as IL-10, peaked at 6 and 28 h post vaccination, and declined thereafter (Clusters 1 and 2, Figure 4).
Vaccination induces the expression of groups of genes with distinct temporal patterns of expression in the afferent lymph. Hierarchical clustering analysis identified eight clusters (a) representing genes with early peaks in expression (clusters 1, 2 and 6); late peaks in expression (clusters 5 and 7); sustained expression from 26 h (cluster 3); and down-regulated expression (clusters 4 and 8). Key pathways, process networks and genes associated with each of these clusters are shown in the text boxes. In the colour bar representation of gene expression red represents up-regulation, green represents down-regulation and black represents unchanged expression relative to pre-vaccination controls (a). Fold-change in expression relative to pre-vaccination levels of chemokine and chemokine receptor genes with an increase in expression at 6 h (b), 28 h (c) and 53–78 h post-vaccination (d) or reduced expression (e) ECM: Extracellular matrix.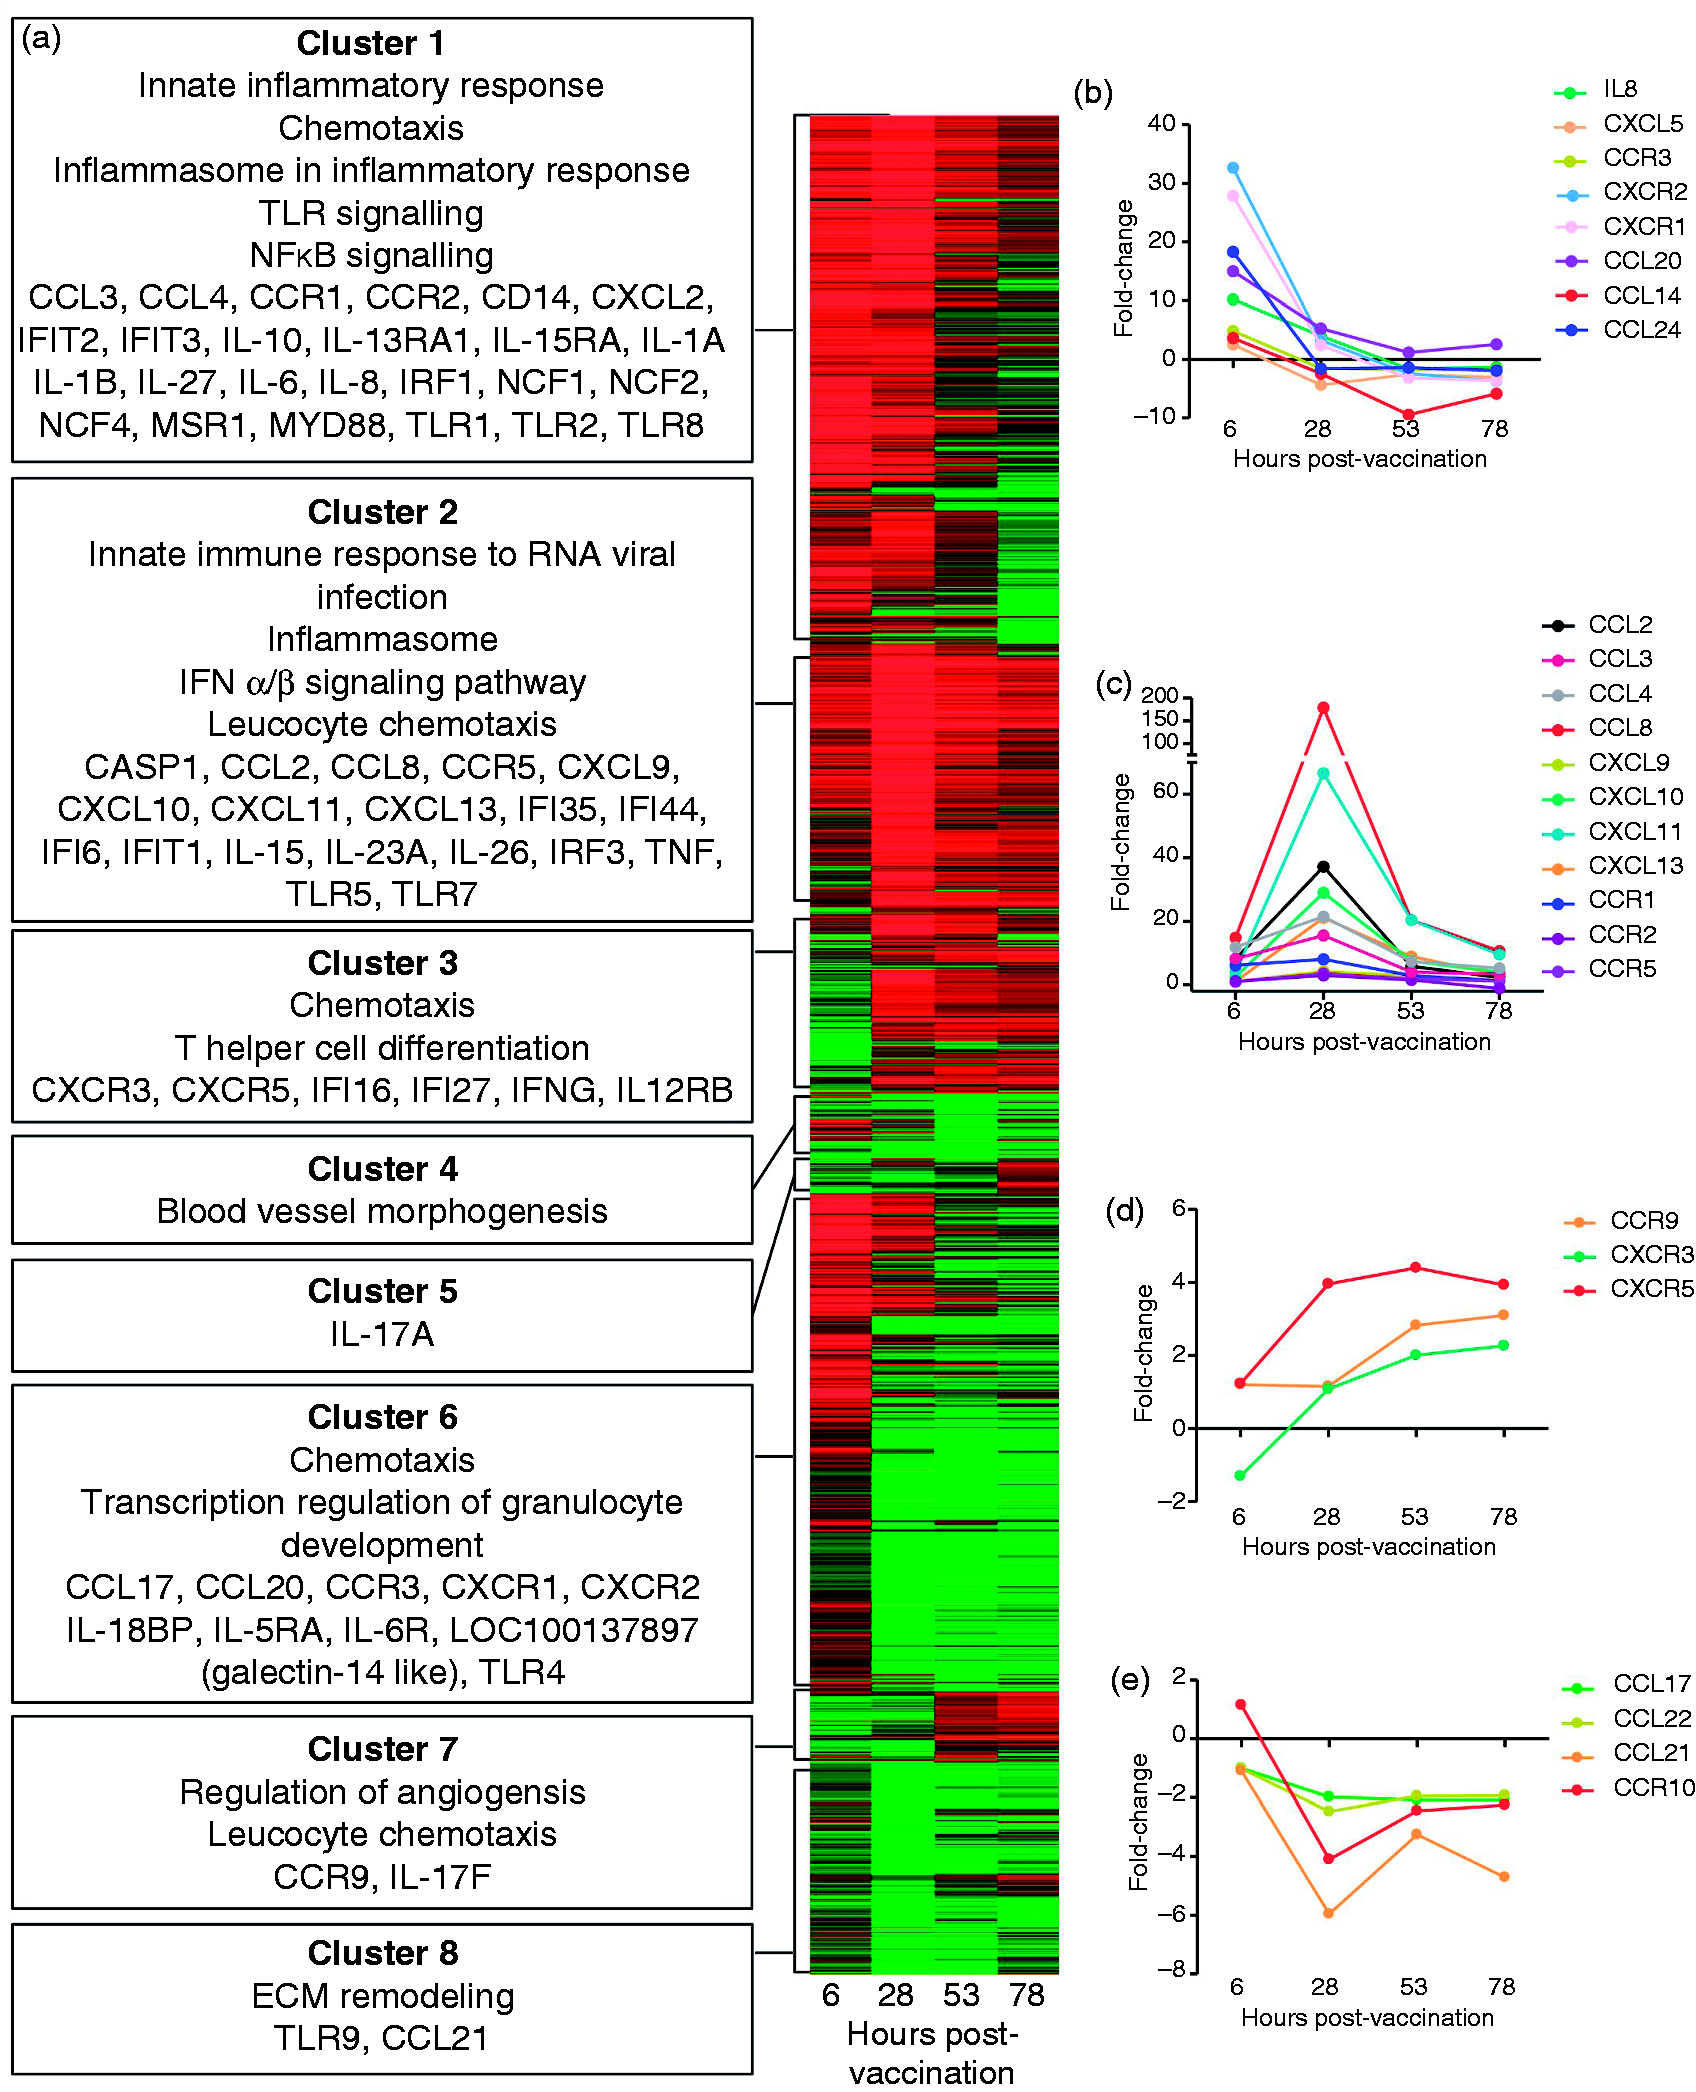
The early response to vaccination also featured the potent up-regulation of chemokines associated with recruitment of neutrophils (IL-8, 10.23-fold) and eosinophils (CCL24, 18.27-fold) at 6 h post-vaccination (Figure 4b). By 28 h the expression of these chemokines and their receptors (CXCR1/CXCR2 and CCR3 respectively) had returned to near baseline levels (Figure 4b). Corresponding changes in the expression of markers for neutrophils (NCF1, NCF4) and eosinophils [LOC100137897 (galectin-14), IL5RA] were also observed (Figure 4a). Monocyte chemokines (e.g. CCL2, CCL8 and CCL20) and monocyte-associated genes (CD14) were also up-regulated at 6 h with peak expression occurring at 28 h (Figure 4b,c). These gene expression patterns were consistent with the cell recruitment data showing peak neutrophil and monocyte infiltration into the afferent lymph at 6 and 28 h post-vaccination, respectively (Figure 1b,c).
In addition to sustained up-regulation of antiviral genes, the later response (53–78 h) was also associated with the up-regulation of IL17A and IL17F (Clusters 5 and 7), with IL17-associated pathways and process networks significantly enriched as early as 6 h post-vaccination (Supplementary Tables S1 and S2). Signalling networks involving CXCL13 receptors (CXCR3, CXCR5) and other G protein-coupled receptors (GPCRs) were also a prominent feature of the later time points (Figure 5).
CXCR3, CXCR5 and GPCRs contribute to late signalling events after vaccination. Metacore (Thomson Reuters, New York, NY, USA) was used to identify key signalling events at each time point by constructing networks from genes that were significantly up- and down-regulated in afferent lymph cells. Enrichment of networks featuring CXCR3, CXCR5, G-alpha(q)-specific peptide GPCRs and/or G-alpha(i)-specific peptide GPCRs as prominent side-chains was a common feature at 53 h (a) and 76 h (b) post infection. Gene expression data are illustrated in the coloured circles underlying the gene symbols where red shades indicate up-regulation and blue shades indicate down-regulation; if no circle is shown then expression was not significantly changed. Circles showing both red and blue quarters indicate that a group of genes contained multiple members with variable expression patterns (i.e. some were up-regulated and some were down-regulated). Objects and symbols on the networks are described in the legend (http://www.genego.com/pdf/MC_legend.pdf).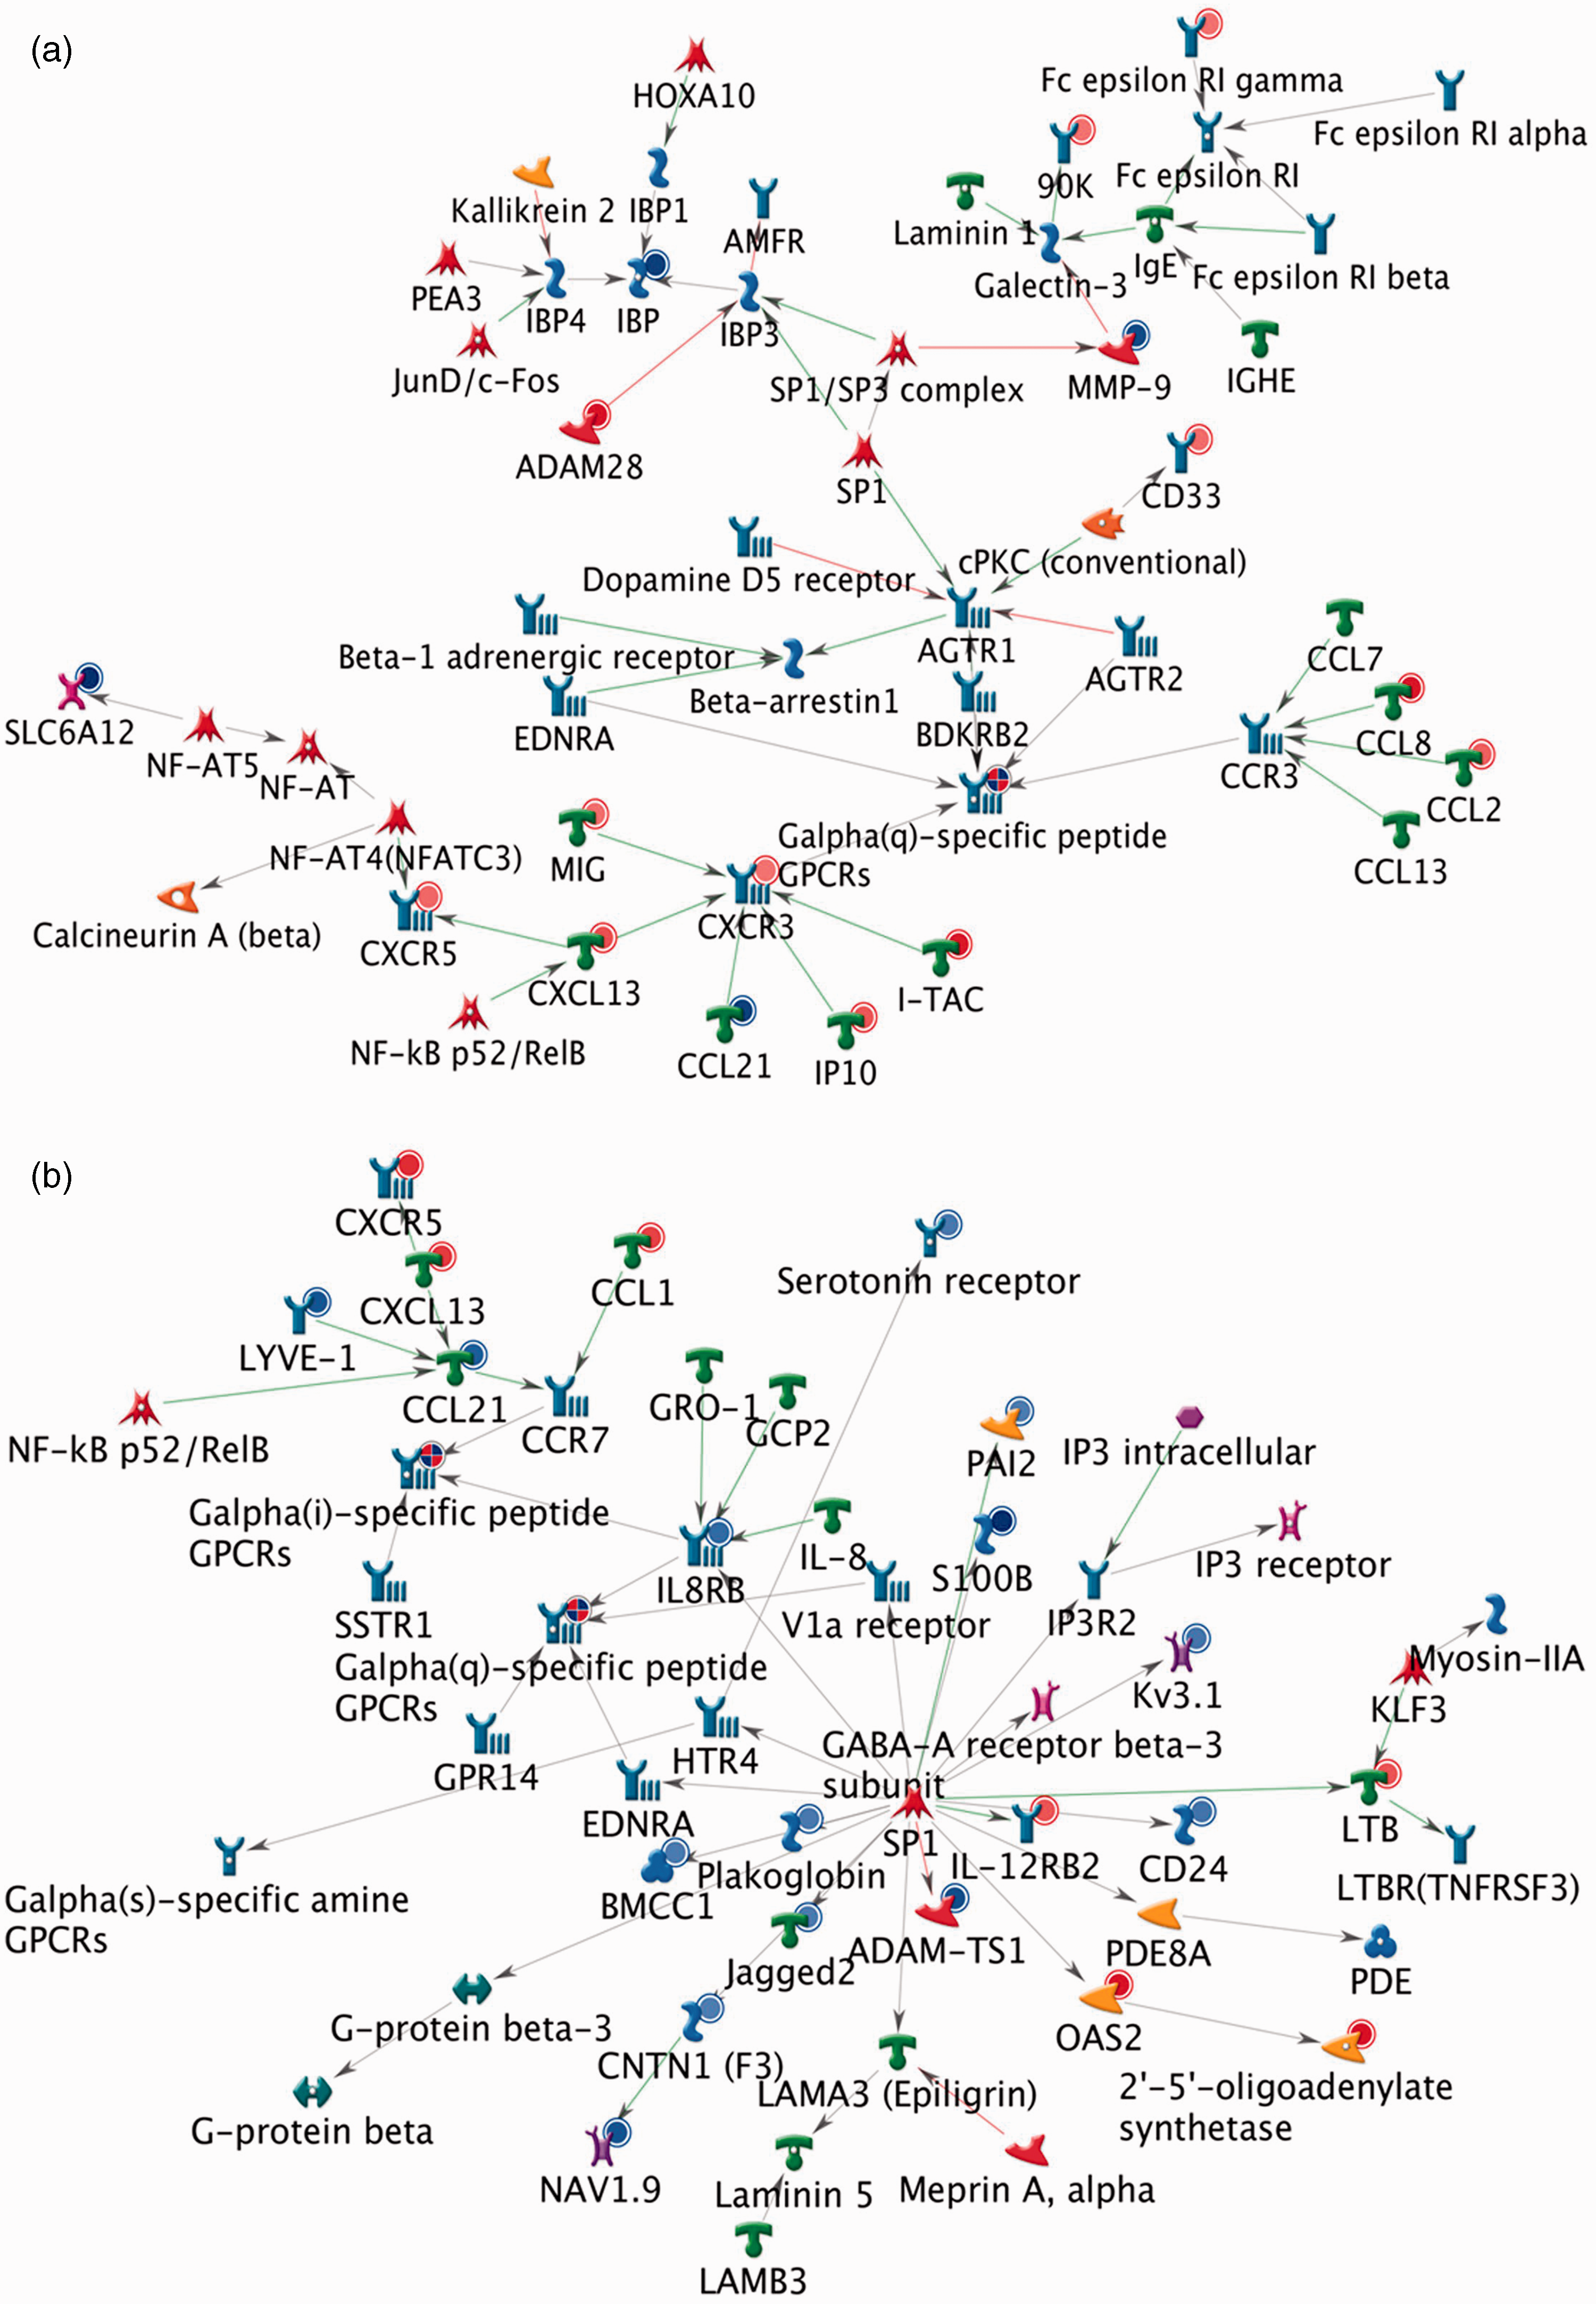
Discussion
A fundamental dogma within immunology is that an innate immune response is initiated within the periphery and this information is then transferred to the draining lymph node via the afferent lymph where naive T- and B-cells are activated to induce adaptive immunity. Exactly how this information is transferred is somewhat of a mystery as the afferent lymphatic compartment is largely inaccessible within murine models.
In the present study we used the ovine lymphatic cannulation model to provide the most comprehensive description of the cell types and associated gene expression signatures within the afferent lymph following vaccination with a liposome-based adjuvant system incorporating antigen and the innate stimulator, poly(I:C)—a dsRNA viral mimic. Our analyses indicate that the transfer of innate signals from the periphery to the lymph node in response to this vaccine formulation is a dynamic event, defined by clear temporal stages of cellular recruitment and associated gene expression. While the gene expression profiles appear to be shaped by the presence of the poly(I:C) adjuvant, a contribution of the liposome and antigen preparation to the overall response is also likely to occur.
Vaccination initially induced a broad pro-inflammatory response within the lymph, characterised by a marked influx of neutrophils, monocytes and the up-regulation of receptors, transcription factors and effector molecules associated with multiple inflammatory pathways. Interestingly, this neutrophil influx was not a feature of studies of the innate response to vaccination with poly(I:C) when examined in whole blood in humans. 15 The influx of neutrophils in afferent lymph was associated with an increase in neutrophil-associated chemokines and chemokine receptors (e.g. IL-8, CXCL2, CXCR1, CXCR2). While we have no specific surface markers for sheep eosinophils by flow cytometry, the transcriptomic data clearly revealed that eosinophils, characterised by expression of galectin-14 and IL-5RA, were also recruited into the afferent lymph after injection of poly(I:C)-containing liposomes, and this was later confirmed by cytospot analysis (not shown). Although typically associated with type 2 cytokine responses to allergy and parasite infection, eosinophil recruitment is increasingly associated with the response to viral infections, including respiratory syncytial virus, a dsRNA virus, in which they may contribute to antiviral defence.16,17 As poly(I:C) is a dsRNA mimic, it is possible that similar mechanisms are at play during the immune response to the vaccine preparation; however, the precise role of eosinophils in this process remains an important area for future research. Peak monocyte migration into afferent lymph coincided with peak expression of monocyte chemokines and pro-inflammatory cytokines. This, coupled with the granulocyte data, indicates that cellular recruitment is a major determinant of differential gene expression within this system. Further studies indicate that poly (I:C) is the major instigator of this cell recruitment, as antigen in liposomes alone induce only minor cellular changes in afferent lymph (Neeland et al., in preparation).
Other early gene responses included up-regulation of TLR signalling molecules and several components of the NLRP3 inflammasome pathway, including NLRP3, caspase 1, IL-1β, IL-18 and PYCARD (ASC) genes into the afferent lymph. Interestingly, in vitro studies of poly(I:C)-transfected murine monocytes and DCs show similar inflammasome induction, 18 indicating that perhaps the liposomal formation allows poly(I:C) access to cellular cytoplasm in vivo and this information is propagated through the lymph.
Co-incident with the arrival of monocytes in the afferent lymph at 24 h was a transition to a more antiviral profile with the peak expression of intracellular receptors for dsRNA/poly(I:C) (e.g. MDA5, RIG-I), IFN/TLR3-inducible chemokines and IFN-α/β-induced genes, known to be involved in the response to poly(I:C). 15 We observed no change in the expression of IFN-α/β within the innate afferent lymphatic compartment, indicating that the source of these cytokines is confined to the site of vaccination or is provided by non-innate cells within the afferent lymphatic compartment.
The expression data also indicate the presence of plasmacytoid DCs (pDCs) at 24 h as the expression of genes associated with these cells (e.g. TLR7 and IRF7) peaked at this time point. These results suggest that monocytes, monocytes-like cells or pDCs propagate the poly(I:C)-specific information from the periphery to the lymph node within the first 24–72 h following vaccination. This hypothesis is consistent with the results of Hansmann et al., 19 who showed that human peripheral blood monocytes are the primary source of IFN-α in response to poly(I:C) when complexed with the liposome formulation N-[1-(2,3-Dioleoyloxy)propyl]-N,N,N-trimethylammonium methyl-sulfate (DOTAP). Human pDCs are not thought to be activated by poly (I:C) alone; however, the effect of lipid formulations in this system have not been investigated. 20 It will be interesting to further characterise whether the antiviral signature that we observed is present within monocytes or pDCs trafficking in the afferent lymph.
In addition to the anti-viral pathways, there was later up-regulation of IL-17A and IL-17F, pro-inflammatory cytokines produced by activated Th17 cells. This is in agreement with an increase in lymphocyte numbers, 8 CD4 mRNA and the T-cell chemokine receptor CXCR3 at the latest time points. In addition, there was early up-regulation of Th17-inducing cytokines (IL-6, IL-23A and IL-1β 21 ), which corresponded with peak granulocyte numbers, suggesting that these cells could be an important source of cytokines that direct the phenotype of the resulting immune response. Th17 cells have been implicated in potentiating the pro-inflammatory response to poly(I:C),22,23 and the present results suggest that they may represent the earliest expression of an adaptive response under this vaccination regime. Interestingly, GPCRs were also prominent at the later time points. This is not entirely unexpected given the large number of identified GPCR genes and their established role in immune responses.24–26 However, the function of many GPCR, including those with altered expression in the present study, is yet to be determined and constitutes an important area for future research.
Conclusions
Innate immune stimulators have been heralded as the next possible breakthrough in vaccine development, but the way in which innate immune signals are transmitted from the periphery to the lymph node is not well characterised. This study represents the first global analysis of cellular and gene expression changes in the afferent lymphatic compartment following vaccination with a next-generation vaccine adjuvant system incorporating a specific innate immune agonist. It highlights the temporal nature of the innate in vivo response and the involvement of different cell populations and gene expression networks over time. It shows that specificity of innate immune recognition can occur within the periphery and that these signals are rapidly transmitted to the lymph node, as illustrated by the sustained up-regulation of genes and pathways long after the general inflammatory response has diminished. Together with our analysis of the cellular and antigen transport features of the afferent lymphatic compartment 9 these findings should form a framework for further studies aimed at understanding both the action of different adjuvant systems and the causes of any undesirable side effects or reactogenicity.
Footnotes
Acknowledgements
We wish to acknowledge Jackie Nathanielsz for preparing the vaccine formulations used in the study.
Funding
This study was supported by a linkage grant from the Australian Research Council with Pfizer VMRD (now Zoetis VMRD).
Conflict of interest
ME is an employee of Zoetis VMRD.
References
Supplementary Material
Please find the following supplemental material available below.
For Open Access articles published under a Creative Commons License, all supplemental material carries the same license as the article it is associated with.
For non-Open Access articles published, all supplemental material carries a non-exclusive license, and permission requests for re-use of supplemental material or any part of supplemental material shall be sent directly to the copyright owner as specified in the copyright notice associated with the article.