
Abstract
Whereas Th17 cells are associated with aggravated inflammation, regulatory T cells (Tregs) provide an environment to control overt responses. Nevertheless, Tregs display a certain degree of plasticity demonstrating that T cell differentiation processes are not absolute. Previously, we showed that human Treg clones induced B cells to produce IgG4. Here we focus on the actions of freshly isolated CD4+CD25+Foxp3+CD127dim Tregs on Ig production by B cells and the consequences of prior TLR activation of B cells. In the absence of TLR stimuli, Tregs, but not conventional T cells, dampened B cell proliferation, plasma cell formation and, with the exception of IgG4, all other Ig production. Although IgG4 levels were unchanged in total B cell:Treg co-cultures, levels were increased in Treg co-cultures of naive, but not memory, B cells. Triggering TLR on B cells skewed both Ig and cytokine secretion patterns and, surprisingly, Tregs within TLR4- and TLR9- but not TLR2-triggered B cell co-cultures up-regulated retinoic acid related orphan receptor (RORC) and produced IL-17. These data indicate that under conditions like bacterial or viral infections, B cells can escape Treg control, and provides an explanation as to why patients suffering from allergy or helminth infections display polar immunopathological symptoms despite being exposed to the same agent.
Introduction
CD4+ T cell development (Th1, Th2, Th17 and regulatory T cells) is dictated by the expression of lineage-specific transcription factors, which are fundamental in determining the cytokine profile of effector T cell populations. 1 In contrast to Th1, Th2 and Th17 cells, which promote inflammatory reactions, Foxp3+ regulatory T cells (Tregs) are renowned for their ability to prevent overt responses.2–4 Treg-mediated suppression in vivo needs IL-10 and TGF-β, and appears to require the close contact of effector T cells, APCs and Tregs within the lymph node.5–7 As Th cells provide B cells with the necessary cytokines and co-stimulation signals for Ig synthesis our previous research investigated whether Tregs also influenced Ig production. Interestingly, it was elucidated that regulatory T cell clones preferentially induced non-inflammatory IgG4 by B cells in a cell contact-, TGF-β- and IL-10-dependent manner.8,9 The benefits of such B cell responses is apparent in patients suffering from allergy or helminth infections as high IgE responses need to be counter-regulated to avoid immunopathology.8–10 Indeed, in studies with patients infected with the nematode Onchocerca volvulus we have shown that IL-10+ Tr1 cells, isolated and cloned from the nodules of generalized (hypo-reactive) patients, show a greater propensity to induce IgG4 from B cells.11,12 Moreover, using immuno-histochemistry, elevated Treg and IgG4-producing plasma cells were found in hypo-reactive patients, which complements another study that demonstrated that nodules from patients with severe pathology (hyper-reactive) had more IgE. 13
Although much attention has focused on how Treg subsets develop and functionally suppress different cell populations, it remains unknown how Tregs behave in the presence of innate stimuli, especially with increasing reports that innate activation can modulate developing adaptive immune responses.14–16 Although the outcome of T–B cell interactions is usually influenced by the T-cell driven cytokine environment, B cells also produce various cytokines, including IL-10, which can directly modulate T cell responses. 17 Possible routes of B cell activation include the recognition of foreign organisms or tissue damage via pattern recognition receptors, such as TLRs.14–16,18,19 Therefore, we were interested in whether the influence of Tregs on B cells was modulated or even avoided if B cells were treated with innate stimuli. The influence of TLR triggering has been well documented, with TLR2 playing an essential role in driving Treg development that, in turn, aids the control of ensuing immunopathology.15,20,21 In addition, it is becoming increasingly clear that TLR triggering on B cells is also important for Ab production in normal or autoimmune scenarios.22–26
Here, we show that, with the exception of IgG4, CD4+CD25+Foxp3+CD127dim Tregs, but not conventional T cells (Tconv) or Th1-producing T cell clones from healthy individuals, dampen the secretion of Ig from B cells. However, prior triggering of TLR4 or TLR9, but not TLR2, on B cells altered the patterns of secreted Ig. Moreover, Tregs in those cultures up-regulated retinoic acid related orphan receptor (RORC) and produced IL-17. These data indicate that under strong inflammatory conditions, B cells can escape Treg control and, in turn, re-programme themselves.
Materials and methods
Blood samples and PBMC preparation
Blood samples originated from healthy European donors and were provided by the Institute for Experimental Haematology and Transfusion Medicine, University Clinic Bonn, Germany. PBMCs were isolated as described previously via Ficoll-Plaque gradient centrifugation (density 1.077; PAA Laboratories, Cölbe, Germany).9,11,12 Cells were then used immediately or stored until required in liquid nitrogen in FBS (PAA, Linz, Austria) containing 10% DMSO (St Louis, MO, USA). Ethical clearance for the proposed study was given by the University of Bonn Ethics committee (‘Ethikkommission der Medizinischen Fakultät der Rheinischen Friedrich-Wilhelms-Universität Bonn’).
Reagents and Abs
Purified anti-CD3 and CD28 and various fluorescent conjugated Abs required for flow cytometry were purchased from eBioscience (San Diego, CA, USA). Ab clones (236A/E7 or PCH101 Foxp3) were used for the described studies. Carboxyfluorescein succinimidyl ester (CFSE) was purchased from Invitrogen (Eugene, OR, USA). ELISA kits were purchased from eBioscience, and used according to the manufacturer’s instructions and as described previously.9,11 Heat-killed Listeria monocytogenes (HKLM), CpG-ODN2006 and ODN 2006-G5 were obtained from InvivoGen (San Diego, CA, USA). LPS (Escherichia coli 0117:B08) and the synthetic lipoprotein Pam3Cys were purchased from Sigma-Aldrich (St Louis, MO, USA).
Cell subset isolation
CD4+CD25+Foxp3+CD127dim cells were isolated using the Regulatory T Cell Isolation Kit II (Miltenyi Biotec, Bergisch Gladbach, Germany) according to the manufacturer's instructions and as described previously. 9 Briefly, non-CD4+ and CD127high cells were labeled indirectly using a cocktail of biotin-conjugated Abs (10 µl/1 × 107 cells). After 10 min at 4℃, 30 µl buffer and 20 µl anti-biotin microbeads per 1 × 10⁷ cells were added. After an additional 15 min at 4℃ cells were washed and re-suspended in 500 µl buffer. The labeled cells were then depleted using a MACS® Separator and Large MACS-cell Depletion (LD) columns (Miltenyi Biotec). The effluent T cells (CD4+CD127dim/-) were collected in 90 µl buffer and incubated with 10 µl anti-CD25-coated microbeads (Miltenyi Biotec) for 15 min at 4℃. After washing, cells were re-suspended in 500 µl buffer and CD25+ Tregs were separated by positive isolation using 2 Small MACS-cell Depletion (MS) columns (purity > 95%). The negative fraction, containing no Tregs, was then used as the conventional CD4+ T cell fraction (Tconv). Th1- T cell clones (TCC) were generated as described previously.9,11 In short, PBMC from healthy individuals were stimulated with 10 µg/ml tetanus toxoid (NIBSC, Glasgow, UK) or 0.125 µl/well anti CD3/CD28 T cell expander beads (Invitrogen, Karlsruhe, Germany) in the presence of neutralizing (1 µg/ml) anti-IL-4 and anti-IL-10 (R&D Systems, Minneapolis, MN, USA). After 10 d, CD4+ T cells were isolated and re-stimulated in the same manner in the presence of irradiated autologous peripheral blood cells (feeder cells). After a further 10 d, proliferating cell lines were cloned per limiting dilution to obtain concentrations of 10, 3, 1, and 0.3 cells/well cultures in Terasaki plates (Nunc, Wiesbaden, Germany). After another 10 d, proliferating TCC were picked from Terasaki plates and re-stimulated in 96-well round-bottomed plates. After this first stimulation, clones were further stimulated with 0.125 µl/well CD3/CD28 T cell expander Dynabeads (Invitrogen, Karlsruhe, Germany) every 10 d. Th1 clones were identified by their secretion of IFN-γ and Tbet expression, respectively, per ELISA and flow cytometry. Purified B cells (CD19+) were isolated from freshly prepared PBMCs using the Dynal untouched B cell isolation kit (Dynal Invitrogen, Karlsruhe, Germany) according to the manufacturer’s instructions. Naive and memory B cells were isolated according to their expression of CD27 using CD27 specific microbeads from Miltenyi Biotec. 9 Purity of B cells was >98% and no contaminating monocytes or T cells were detected by flow cytometry (Supplementary Figure 1A, B).
In vitro co-cultures and Treg suppression assays
Cell cultures were incubated at 37℃ (5% CO2) in RPMI 1640 medium (PAA), supplemented with 10% FCS,
Flow cytometry and cytometric beads array
Prior to surface staining, cells were blocked with 1 µl of Fc-block (eBiosciences). Thereafter, the indicated Abs (CD69, MHC II, CD4) were added at 10 µl/5 × 104 cells and stained for 30 min. Cells were then washed with PBS and fixed in 1% paraformaldehyde (PFA) before analysis with the FACSCanto® flow cytometer and Diva® software (BD Biosciences, Franklin Lakes, NJ, USA). To determine the intracellular levels of IL-17, cells (1 × 10⁵/0.2 ml) were re-stimulated for 1 h with PMA/Ionomycin (50 ng/ml and 1 µg/ml) before the application of 1 µl/well of Monensin (Golgi stop) (BD Biosciences). After an additional 5–8 h of culture, cells were harvested, washed in PBS and incubated with 100 µl of cytofix/cytoperm (BD Biosciences) for 20 min at 4℃. After washing with perm/wash, 10 µl of the desired Ab (anti-IL-17 A, alone or in combination with anti-Foxp3) was added for 30 min in the dark. Cells were washed and re-suspended in 500 µl paraformaldehyde (PFA) before analysis. The intracellular expression of Foxp3 and RORC was determined using the Foxp3 staining kit from eBiosciences. Briefly, after incubation for 30 min at 4℃ in the dark with CD4-APC (alternatively CD4 PE-Cy5, FITC or PEC-y7 were used) cells were incubated with Foxp3-FITC and/or RORC-PE Abs after being fixed and permeabilized according to the manufacturer’s instructions.
After 14 d of co-culture supernatants were analyzed for Ig levels using cytometric bead arrays (BD Biosciences). IgG2, 3 and 4 were detected in a multiplex, whereas IgE and IgG1 were measured in simplex to avoid bead incompatibility. In brief, 50 µl of supernatants were incubated (1 h) with 50 µl of capture beads, washed and further treated for 2 h with a phycoerythrin-detection reagent. After additional washing, the beads were analyzed using the FACS Canto™. Data were analyzed using FCAP-Array software (BD Biosciences).
Statistical analysis
Statistical differences were analyzed by ANOVA or Student’s t-test using GraphPad Prism software.
Results
Dampened Ig production in the presence of Tregs is skewed after TLR triggering of B cells
Although Tregs are well renowned for suppressing T effector cells they also play an important role in the regulation of B cell Ig responses.9,11,22–24 Figure 1A shows that unlike Tregs, Tconv, increased the production of IgM, IgG1-3 and IgE, which confirms our earlier studies that these cells do not promote IgG4 production.9–12 Here, Tconv are the entire peripheral CD4+ T cell fraction depleted of Tregs. In contrast, the addition of freshly isolated Tregs (CD4+CD25+ Foxp3+CD127dim) to activated B cells significantly dampened the production of IgM, IgG1-3 and IgE, but did not affect IgG4 secretion (Figure 1A). Interestingly, when using naive or CD27+ memory B cell populations (Figure 1B–G) the secretion of IgG4 by naive B cells was significantly elevated in the presence of Tregs, whereas the production levels by memory cells remained equal (Figure 1F). This was in strong contrast to all other measured Ig as in the majority of scenarios Ig production was dampened in the presence of Tregs regardless of the B cell subtype (Figure 1B–E, G). Next, using CD138, we observed the effects of activated Tregs or Tconv on plasma cells. Following co-culture with Tconv, the percentage of CD138+CD19+ plasma cells rose significantly. This was not the case if B cells were cultured with Tregs, indicating that Tregs directly suppress plasma cell development (Figure 1H).
With the exception of IgG4, CD4+CD25+CD127dim Tregs suppress CD40/IL-4-induced Ig production by B cells. (A) Isolated CD19+ B cells were activated with CD40L (1 µg/ml) and IL-4 (50 U/ml) for 12 h and then co-cultured with either anti-CD3/CD28 mAb- (10 µg/ml/2.5 µg/ml) activated Tconv (CD4+CD25-Foxp3-) or Tregs (CD4+CD25+Foxp3+CD127dim). (B–G) Cultures of either total, naive or CD27+ memory B cells were stimulated with CD40L and IL-4 in the presence or absence of Tregs, which were activated with anti-CD3/CD28. Levels of IgM (d 5) or IgE and IgG subclasses (d 14) were measured in the culture supernatant using CBA and analyzed with FCAP-array software. Bars represent the mean ± SD from eight individually-tested donors. (H) The percentage of CD138+CD19+ B cells following co-culture with either activated Tregs or Tconv [as performed in (A)] was assessed by flow cytometry after 7 d of culture. Symbols represent the results of individually-tested donors (n = 6). Asterisks indicate significant differences (ANOVA or Student's t-test) between the groups indicated by the brackets (*P < 0.05, **P < 0.01, ***P < 0.001).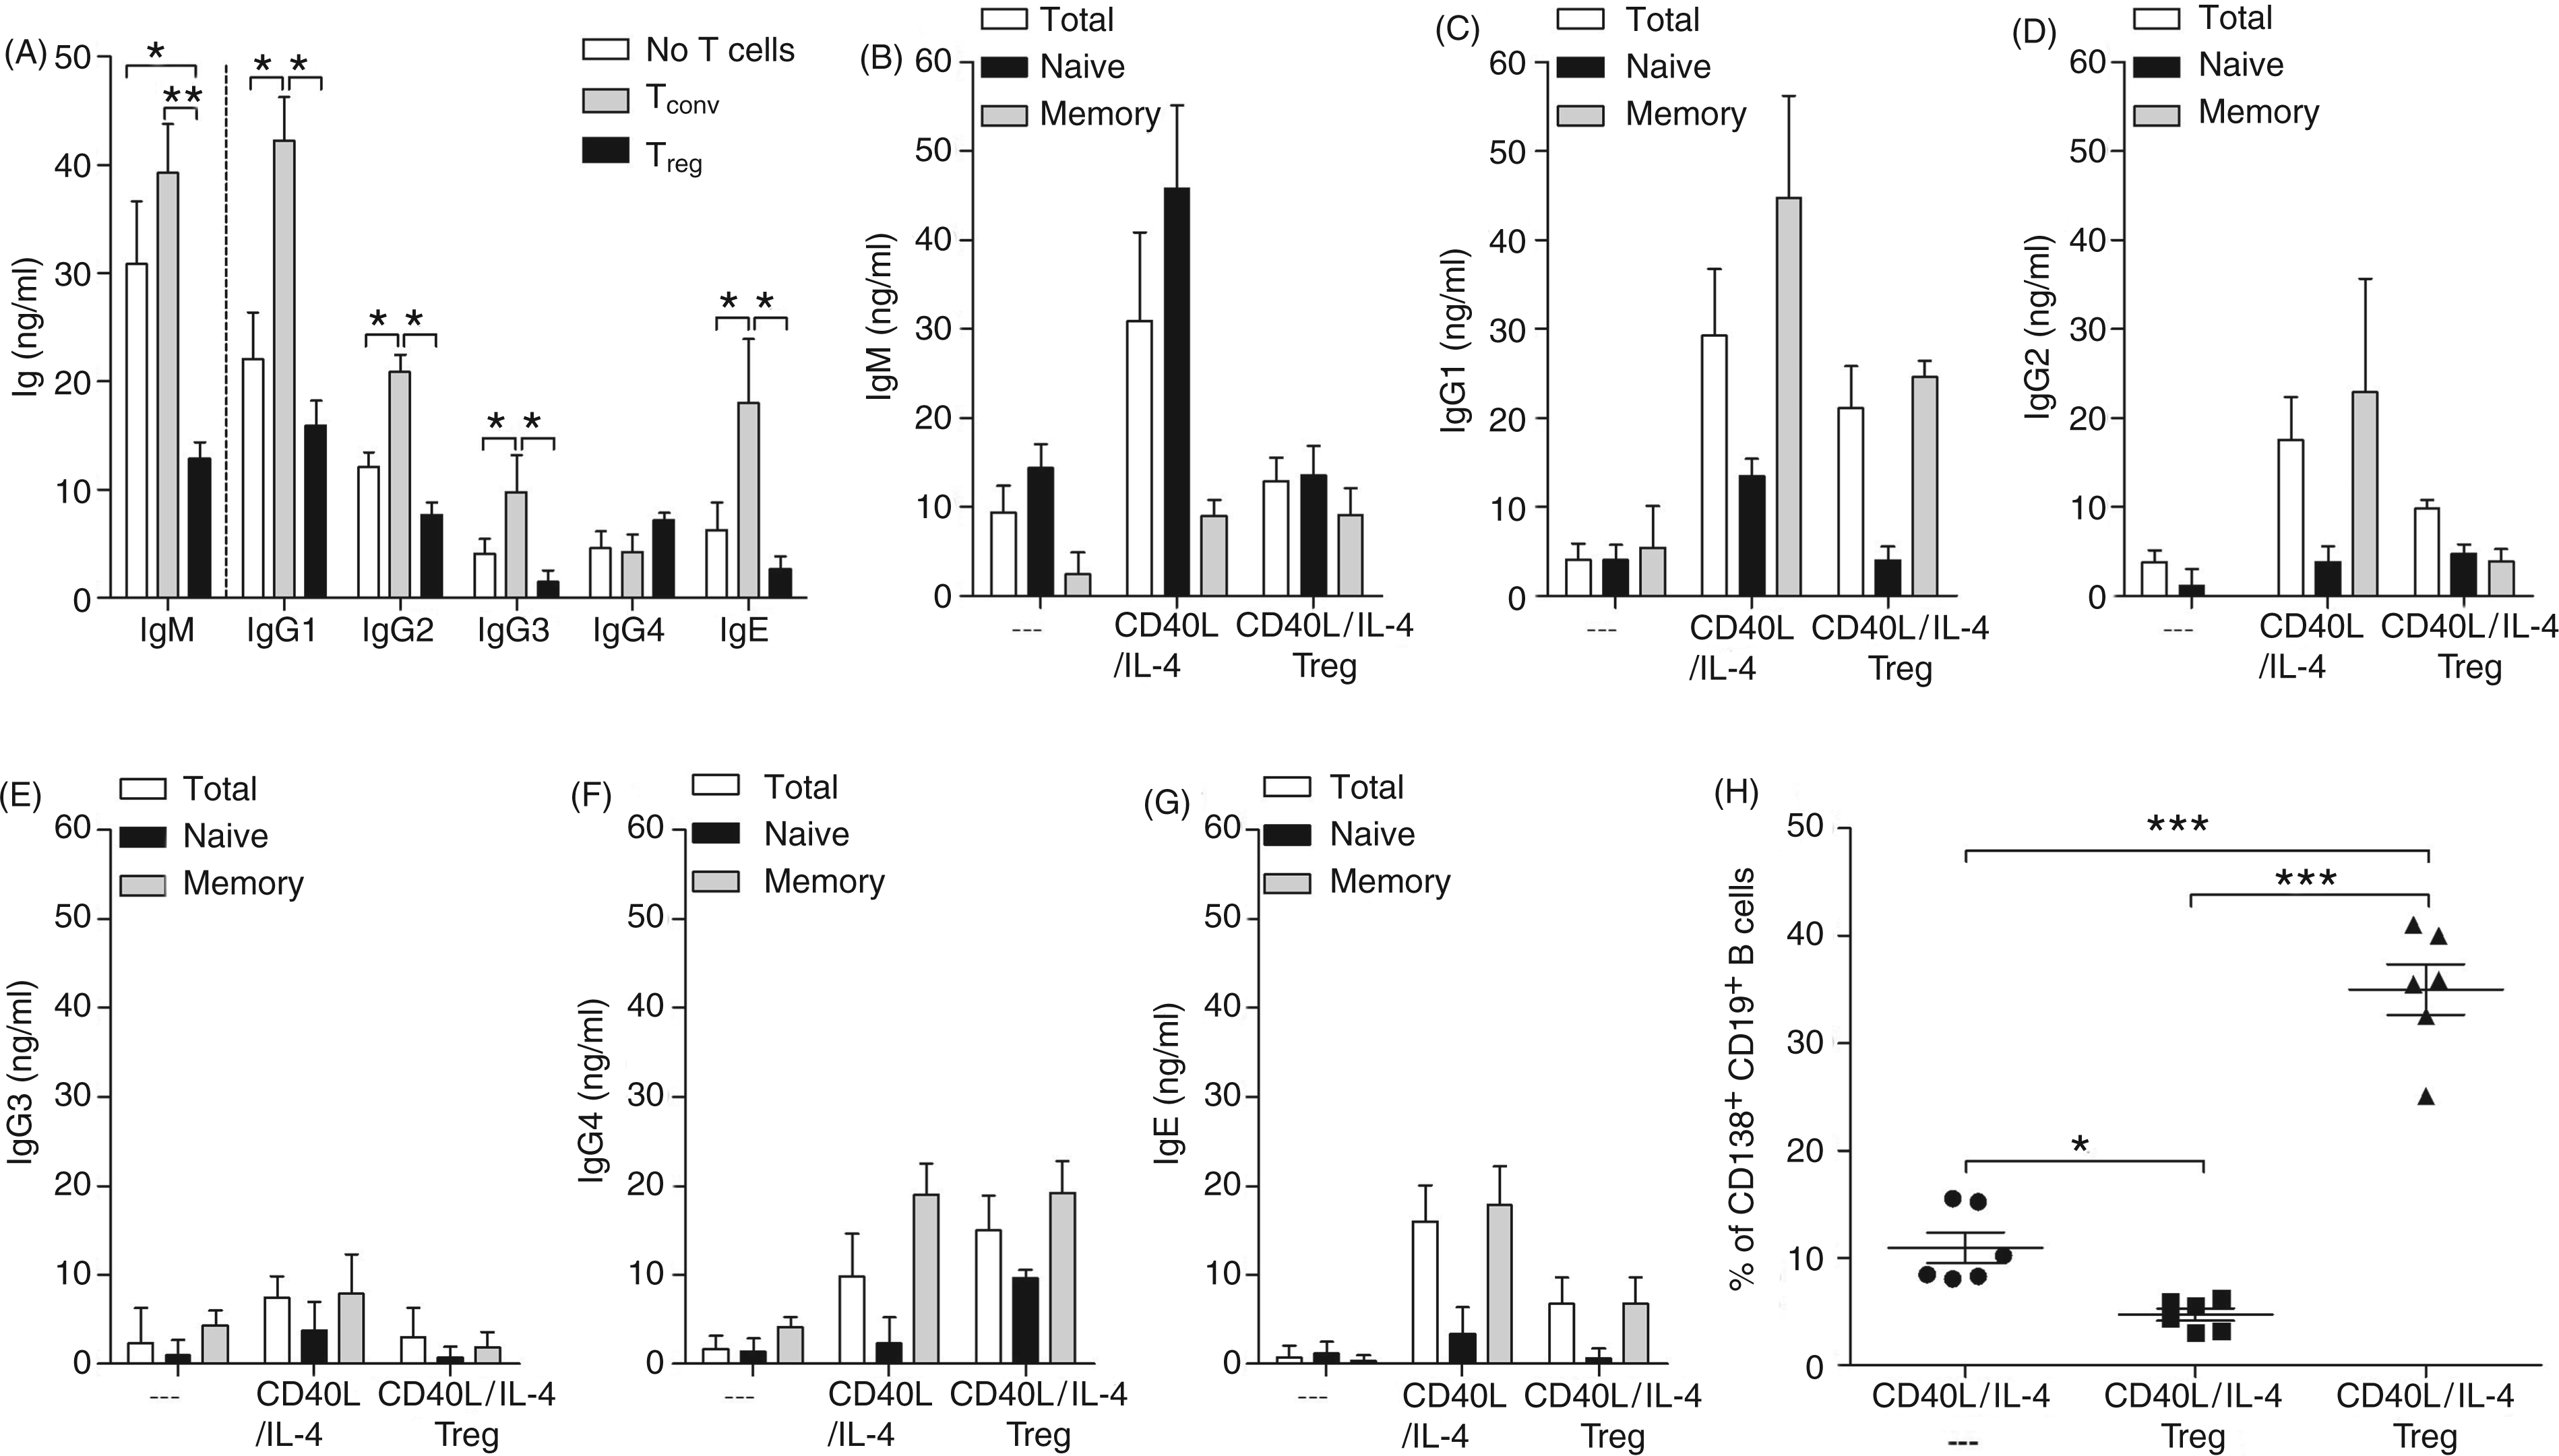
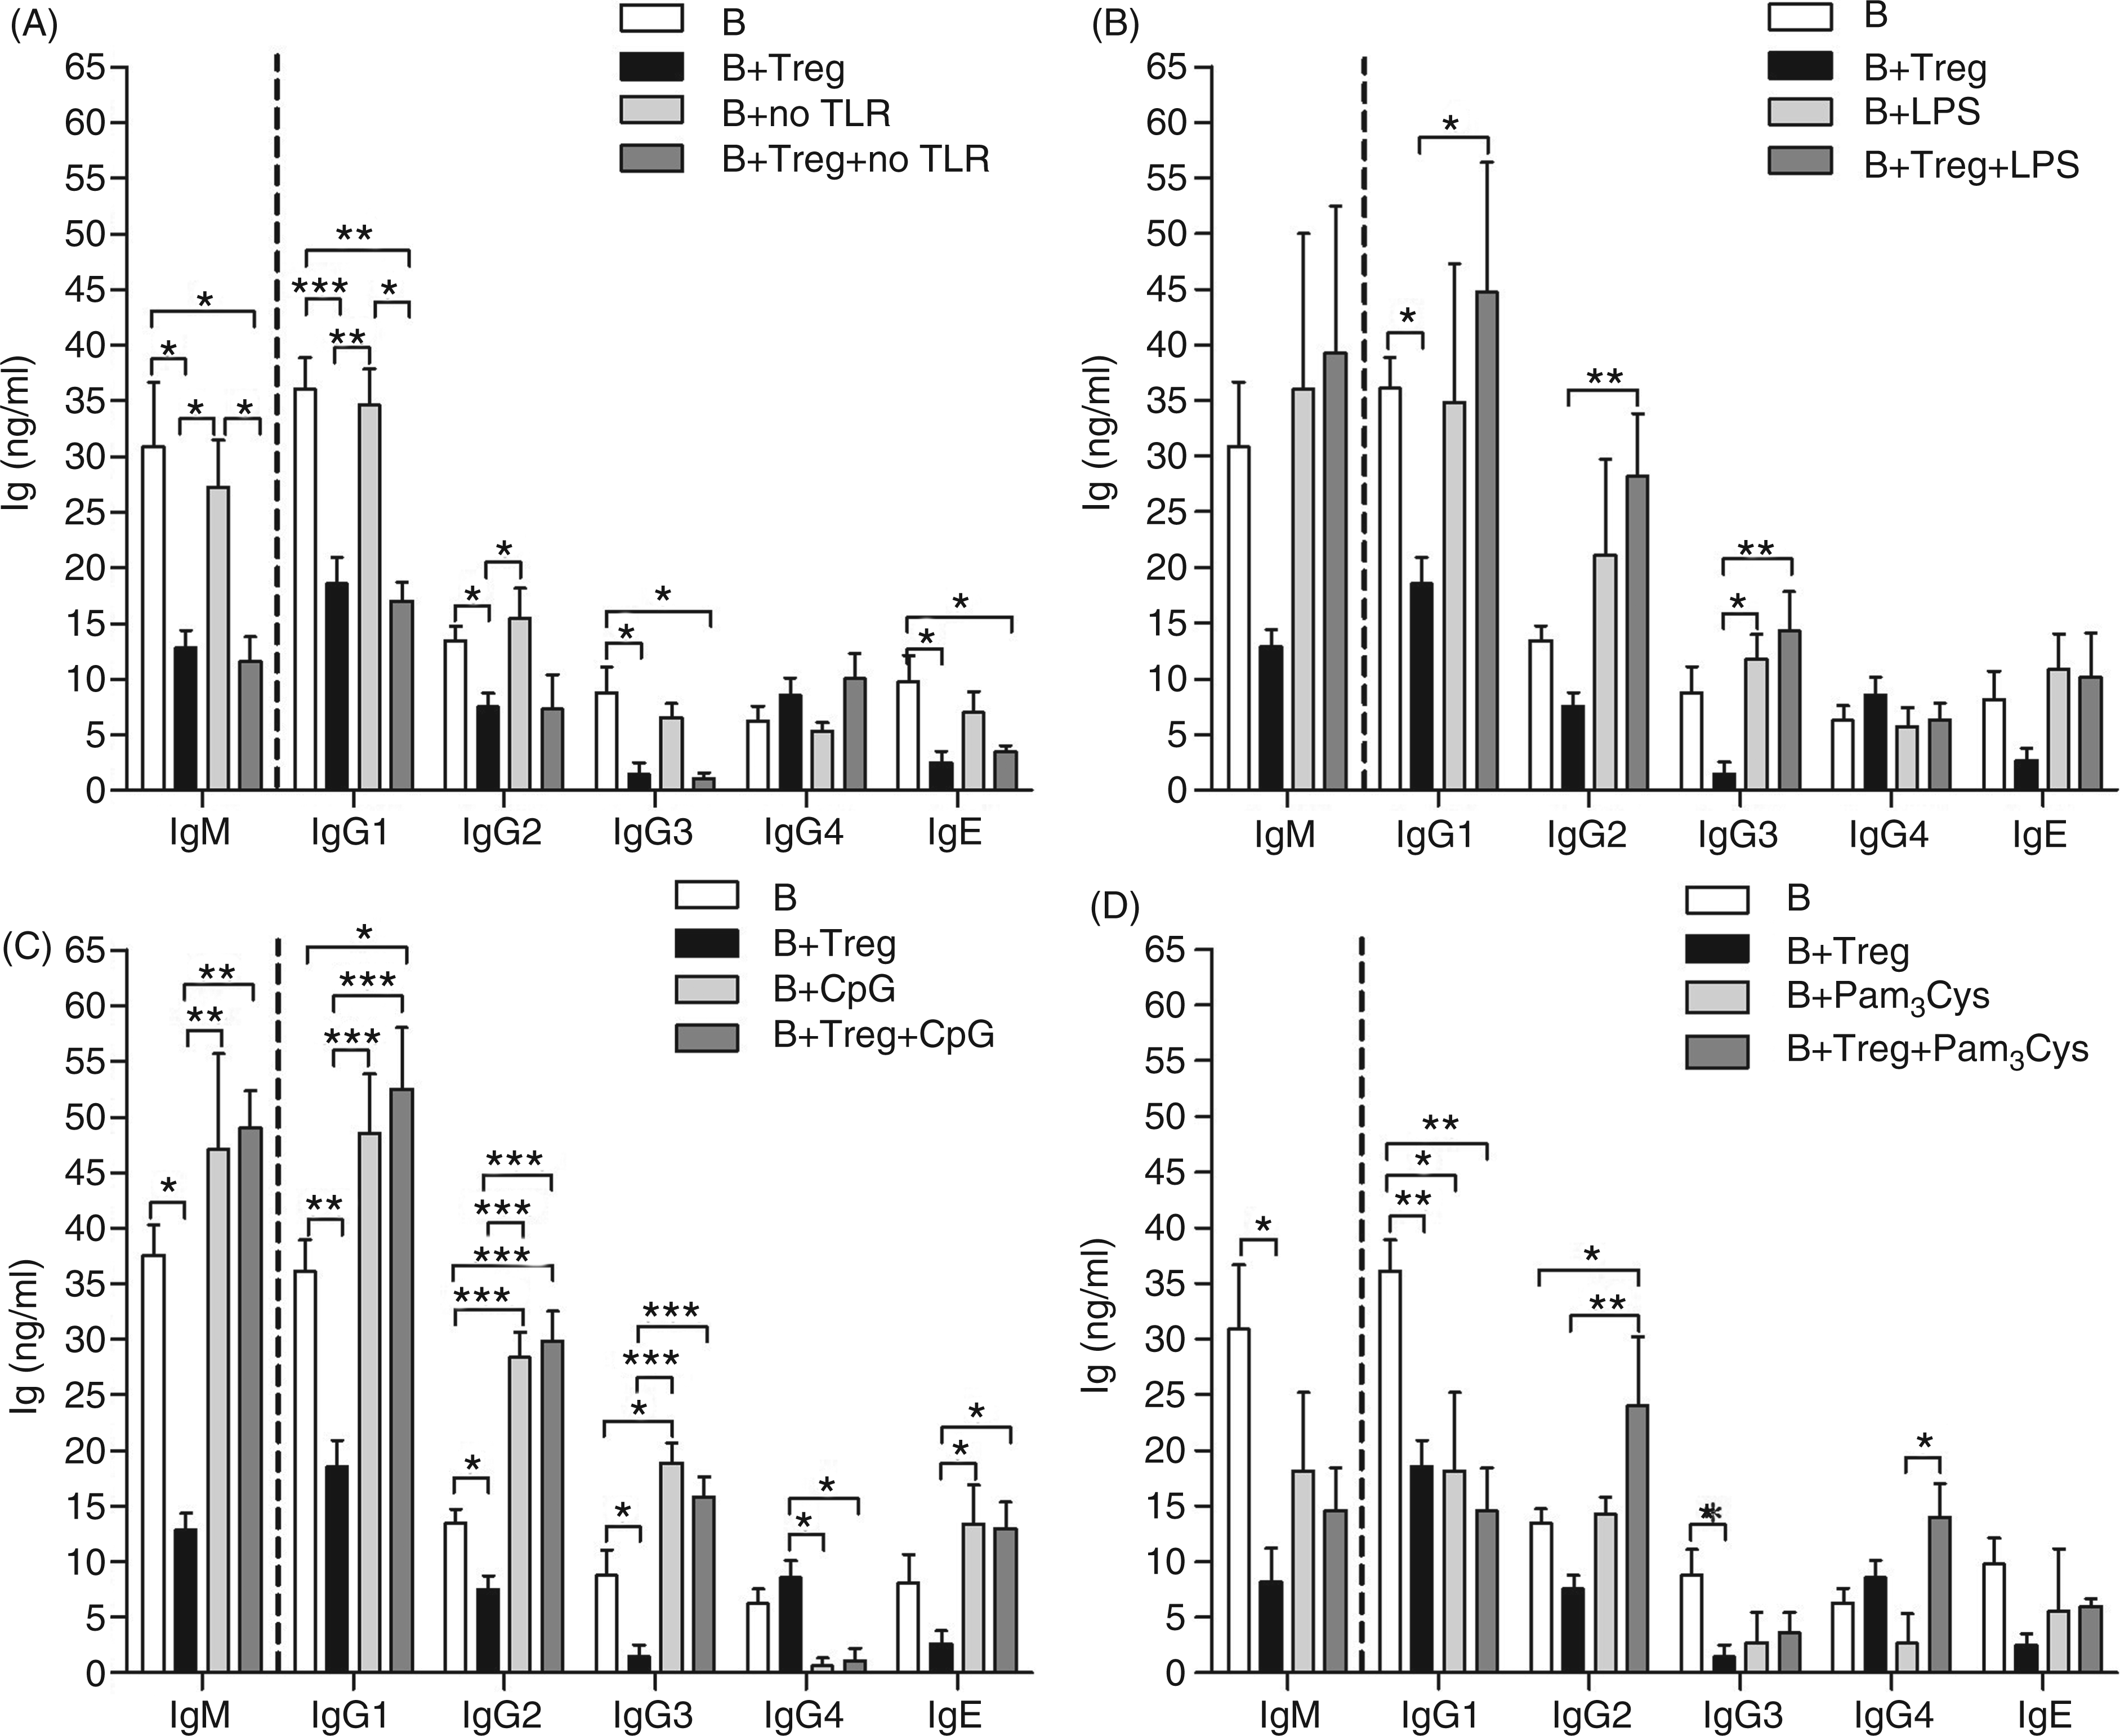
As Treg-mediated modulation lead to a significant increase in the ratios of IgG4/IgG and IgG4/IgE (Figure 2A–D) we addressed whether Tregs could retain their suppressive capacity after B cells were exposed to innate stimuli. Interestingly, prior activation of B cells with TLR4-stimuli (LPS) or TLR9-stimuli (CpG) prevented Treg suppression of Ig production and, in some situations, even enhanced Ig secretion, for example IgG2 (Figure 3B, C). These findings were also confirmed in the ratios of IgG4 to IgG subclasses or IgE (Figure 2A–D). This outcome remained when TLR stimuli were present throughout the co-cultures (data not shown). Although it has been reported that B cells respond weakly to LPS,
27
a combination of CD40L/IL-4 and TLR-triggering up-regulates B cell activation,28,29 as we have performed here. Surprisingly, with the exception of IgG2 and IgG4, the application of TLR2 ligands (Pam3Cys or HKLM) retained the suppressive effects seen by Tregs and even modulated Ig secretion levels of B cells alone (Figure 3D and Supplementary Figure 2 respectively). IgG4/Ig ratios were also significantly elevated when compared with the results from cultures of LPS or CpG-triggered B cells (Figure 2). No differences in Ig levels were observed when Tregs received TLR-stimuli prior to co-culture, and decreasing the number of Tregs within the co-culture abrogated the observed results (data not shown).
Treg-mediated promotion of higher IgG4 ratios is lost upon TLR-triggering of B cells. CD19+ B cells were stimulated for 12 h with TLR stimuli: LPS (100 ng/ml), synthetic oligodeoxynucleotides (CpG-ODN, 1 µg/ml) or triacyl-lipopeptide (Pam3Cys, 1 µg/ml) in the presence of CD40L (1 µg/ml) and IL-4 (50 U/ml). Thereafter, freshly isolated Tregs (CD4+CD25+Foxp3+CD127dim) were added and stimulated with anti-CD3/CD28 mAb (10 µg/ml/2.5 µg/ml). After 14 d, levels of IgG subclasses and IgE were determined in the culture supernatant using CBA. Graphs show the ratio of (A) IgG4/IgG1, (B) IgG4/IgG2, (C) IgG4/IgG3 and (D) IgG4/IgE from experiments using eight individual donors. Asterisks indicate significant differences (ANOVA) between the groups indicated by the brackets (*P < 0.05, **P < 0.01, ***P < 0.001). Triggering innate immune responses in human B cells skews Treg-mediated modulation of Ig production. CD19+ B cells (1 × 10⁵) were left either (A) un-stimulated (no TLR) or (B–D) stimulated for 12 h with the TLR ligands: LPS (100 ng/ml), CpG-ODN, (1 µg/ml) or Pam3Cys, (1 µg/ml), respectively, in the presence of CD40L (1 µg/ml) and IL-4 (50 U/ml). Thereafter, Tregs (1 × 10⁵) were added and cultures were stimulated with anti-CD3/CD28 mAb (10 µg/ml/2.5 µg/ml). (A–D) Levels of IgM (d 5) or other Ig (d 14) were determined in the culture supernatant using CBA. Graphs show the resulting Ig concentrations after B cells were pretreated with either (A) CD40L/IL-4/no TLR, (B) CD40L/IL-4/LPS, (C) CD40L/IL-4/CpG, or (D) CD40L/IL-4/Pam3Cys. Bars represent the mean ± SD from eight individually-tested donors. Asterisks indicate significant differences (ANOVA) between the groups indicated by the brackets (*P < 0.05, **P < 0.01, ***P < 0.001).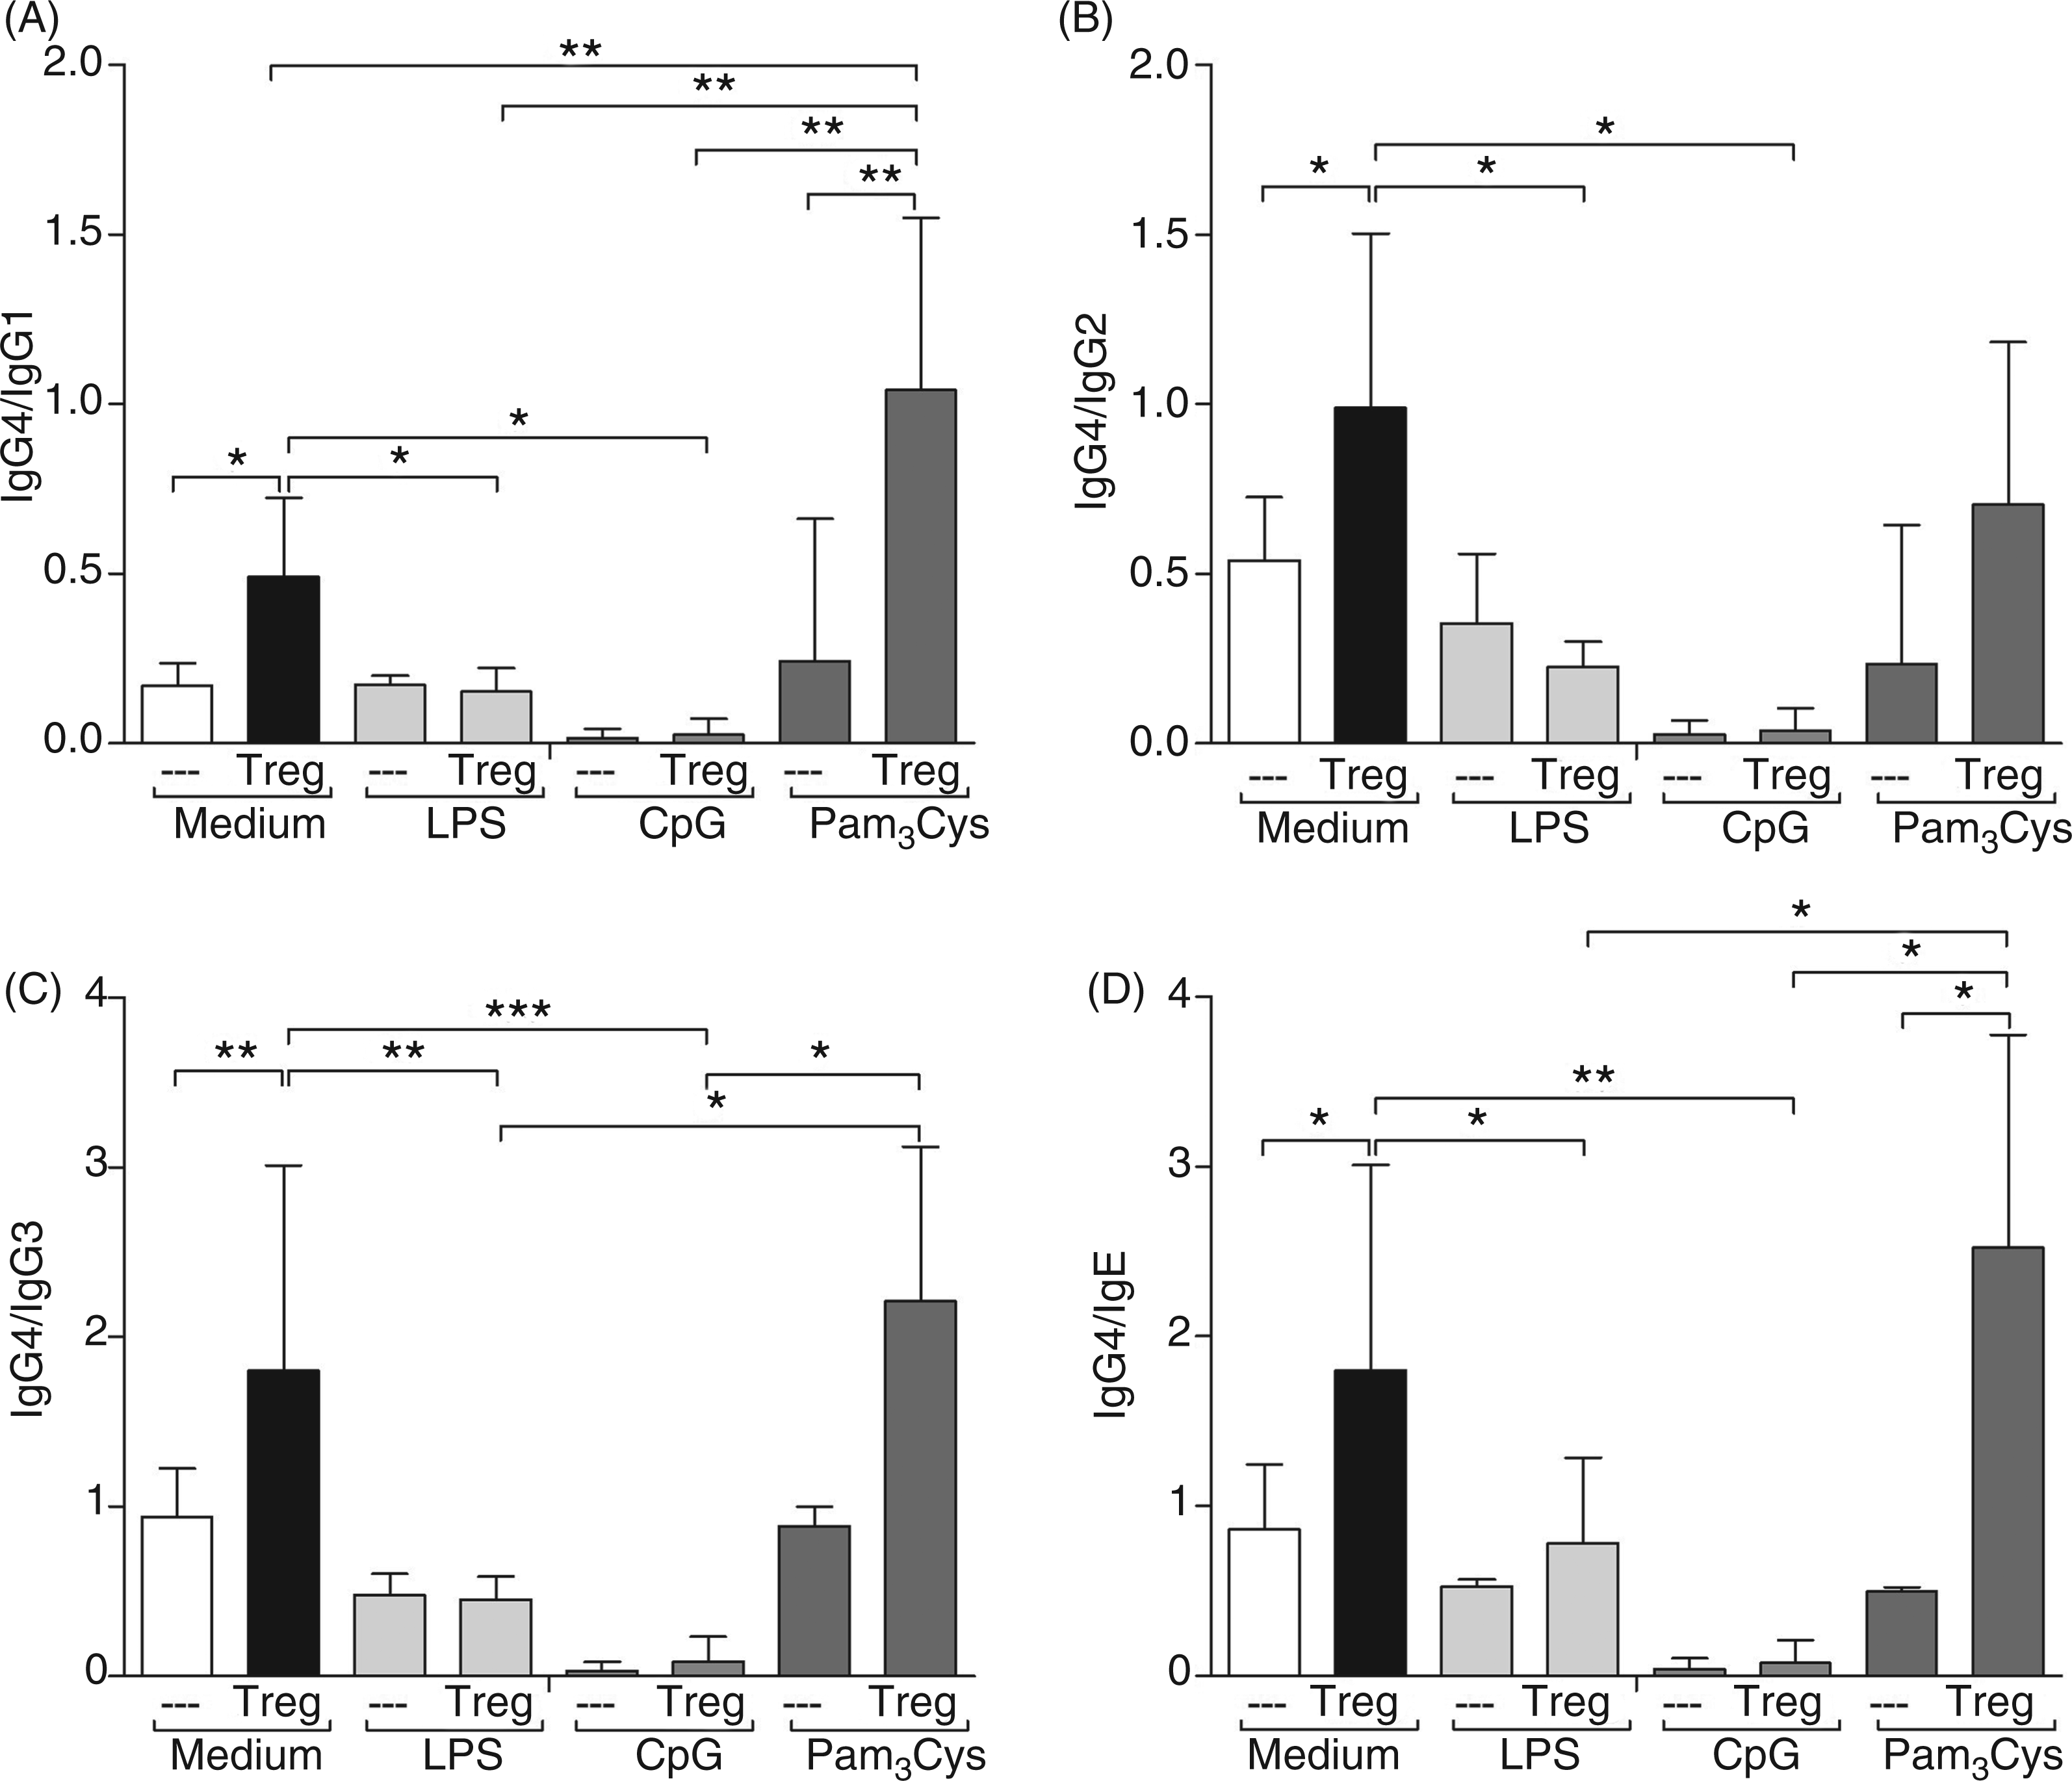
Treg-dampened B cell activation is lost upon TLR triggering
In order to understand how Tregs might influence B cells, we assessed the expression levels of activation markers on such cells after 24 h of co-culture with Tregs or Tconv. CD40L/IL-4 activated B cells cultured alone or, with Tconv, up-regulated their expression of MHC II (Figure 4A and Supplementary Figure 3A–C) and CD69 (Figure 4B and Supplementary Figure 4), and other markers, such as CD27, CD80, CD83 (data not shown). However, when co-cultured with Tregs, expression levels of MHC II and CD69 were both reduced (see bars 1 and 3 with 2 in Figure 4A and bars 2 and 4 with 3 in Figure 4B). Indeed, the presence of Tregs reduced the percentage of CD69+-expressing cells by approximately 32% (Supplementary Figure 4). Correlating with other studies that have shown that Tregs manipulate the characteristics of alternatively-activated macrophages (decreased HLA-DR, elevated CD206), these data confirm our findings (Figure 1), which revealed that activated B cells are also suppressed in the presence of Tregs.5,23,24 Next, we observed whether Tregs still had an effect on B cell activation markers following prior TLR stimulation. Figures 4A and B show that prior activation of B cells (CD40/IL-4) with LPS or CpG prevents Treg modulation as expression levels of MHC II and CD69 are not significantly altered when compared with levels produced by B cells co-cultured alone or with Tconv (Figure 4A, B, and Supplementary Figures 3 and 4). With regard to Pam3Cys stimulation, the levels of CD69 were reduced significantly (∼17%) in the presence of Tregs when compared with non-TLR-stimulated cultures (Figure 4B and Supplementary Figure 3). Levels of MHC II expression were also lower in TLR2-triggered B cell:Treg co-cultures, indicating that Pam3Cys does not skew Treg-modulated responses in the same manner as LPS or CpG; indeed, it appears to support it. Finally, we also assessed the effects of Tregs, Tconv or Th1-TCC (IFN-γ-producing TCC) on the proliferation of B cells, which was determined via flow cytometry using CFSE-labeled CD19+ B cells. Supplementary Figure 1C shows that the addition of Tregs to activated B cells in the absence of any TLR stimuli reduced the basal percentage of proliferating B cells (see bars 1 and 6). This was not observed with the other T cell subsets. Interestingly, the suppressive ability of Tregs was lost if B cells were stimulated with any of the TLRs, including Pam3Cys and HKLM.
Treg-mediated modulation of Igs is associated with down-regulation of B cell activation markers and is disrupted by TLR stimulation. Purified CD19+ B cells were cultured for 12 h in medium or in the presence of LPS (100 ng/ml), CpG-ODN (1 µg/ml) or Pam3Cys (1 µg/ml) in the presence of CD40L (1 µg/ml) and IL-4 (50 U/ml). B cells were then further cultured alone (white bars) or with isolated Tregs (black bars) or Tconv cells (grey bars) stimulated with anti-CD3/CD28 mAb (10 µg/ml/2.5 µg/ml). After 24 h, expression levels of (A) MHC II and (B) CD69 were measured by flow cytometry and analyzed after gating on the CD19+ B cell population using the FACS Canto Diva software. Bars represent the mean ± SD from experiments using six donors. Asterisks indicate significant differences (Student's t-test) between the groups indicated by the brackets (*P < 0.05, **P < 0.01, ***P < 0.001).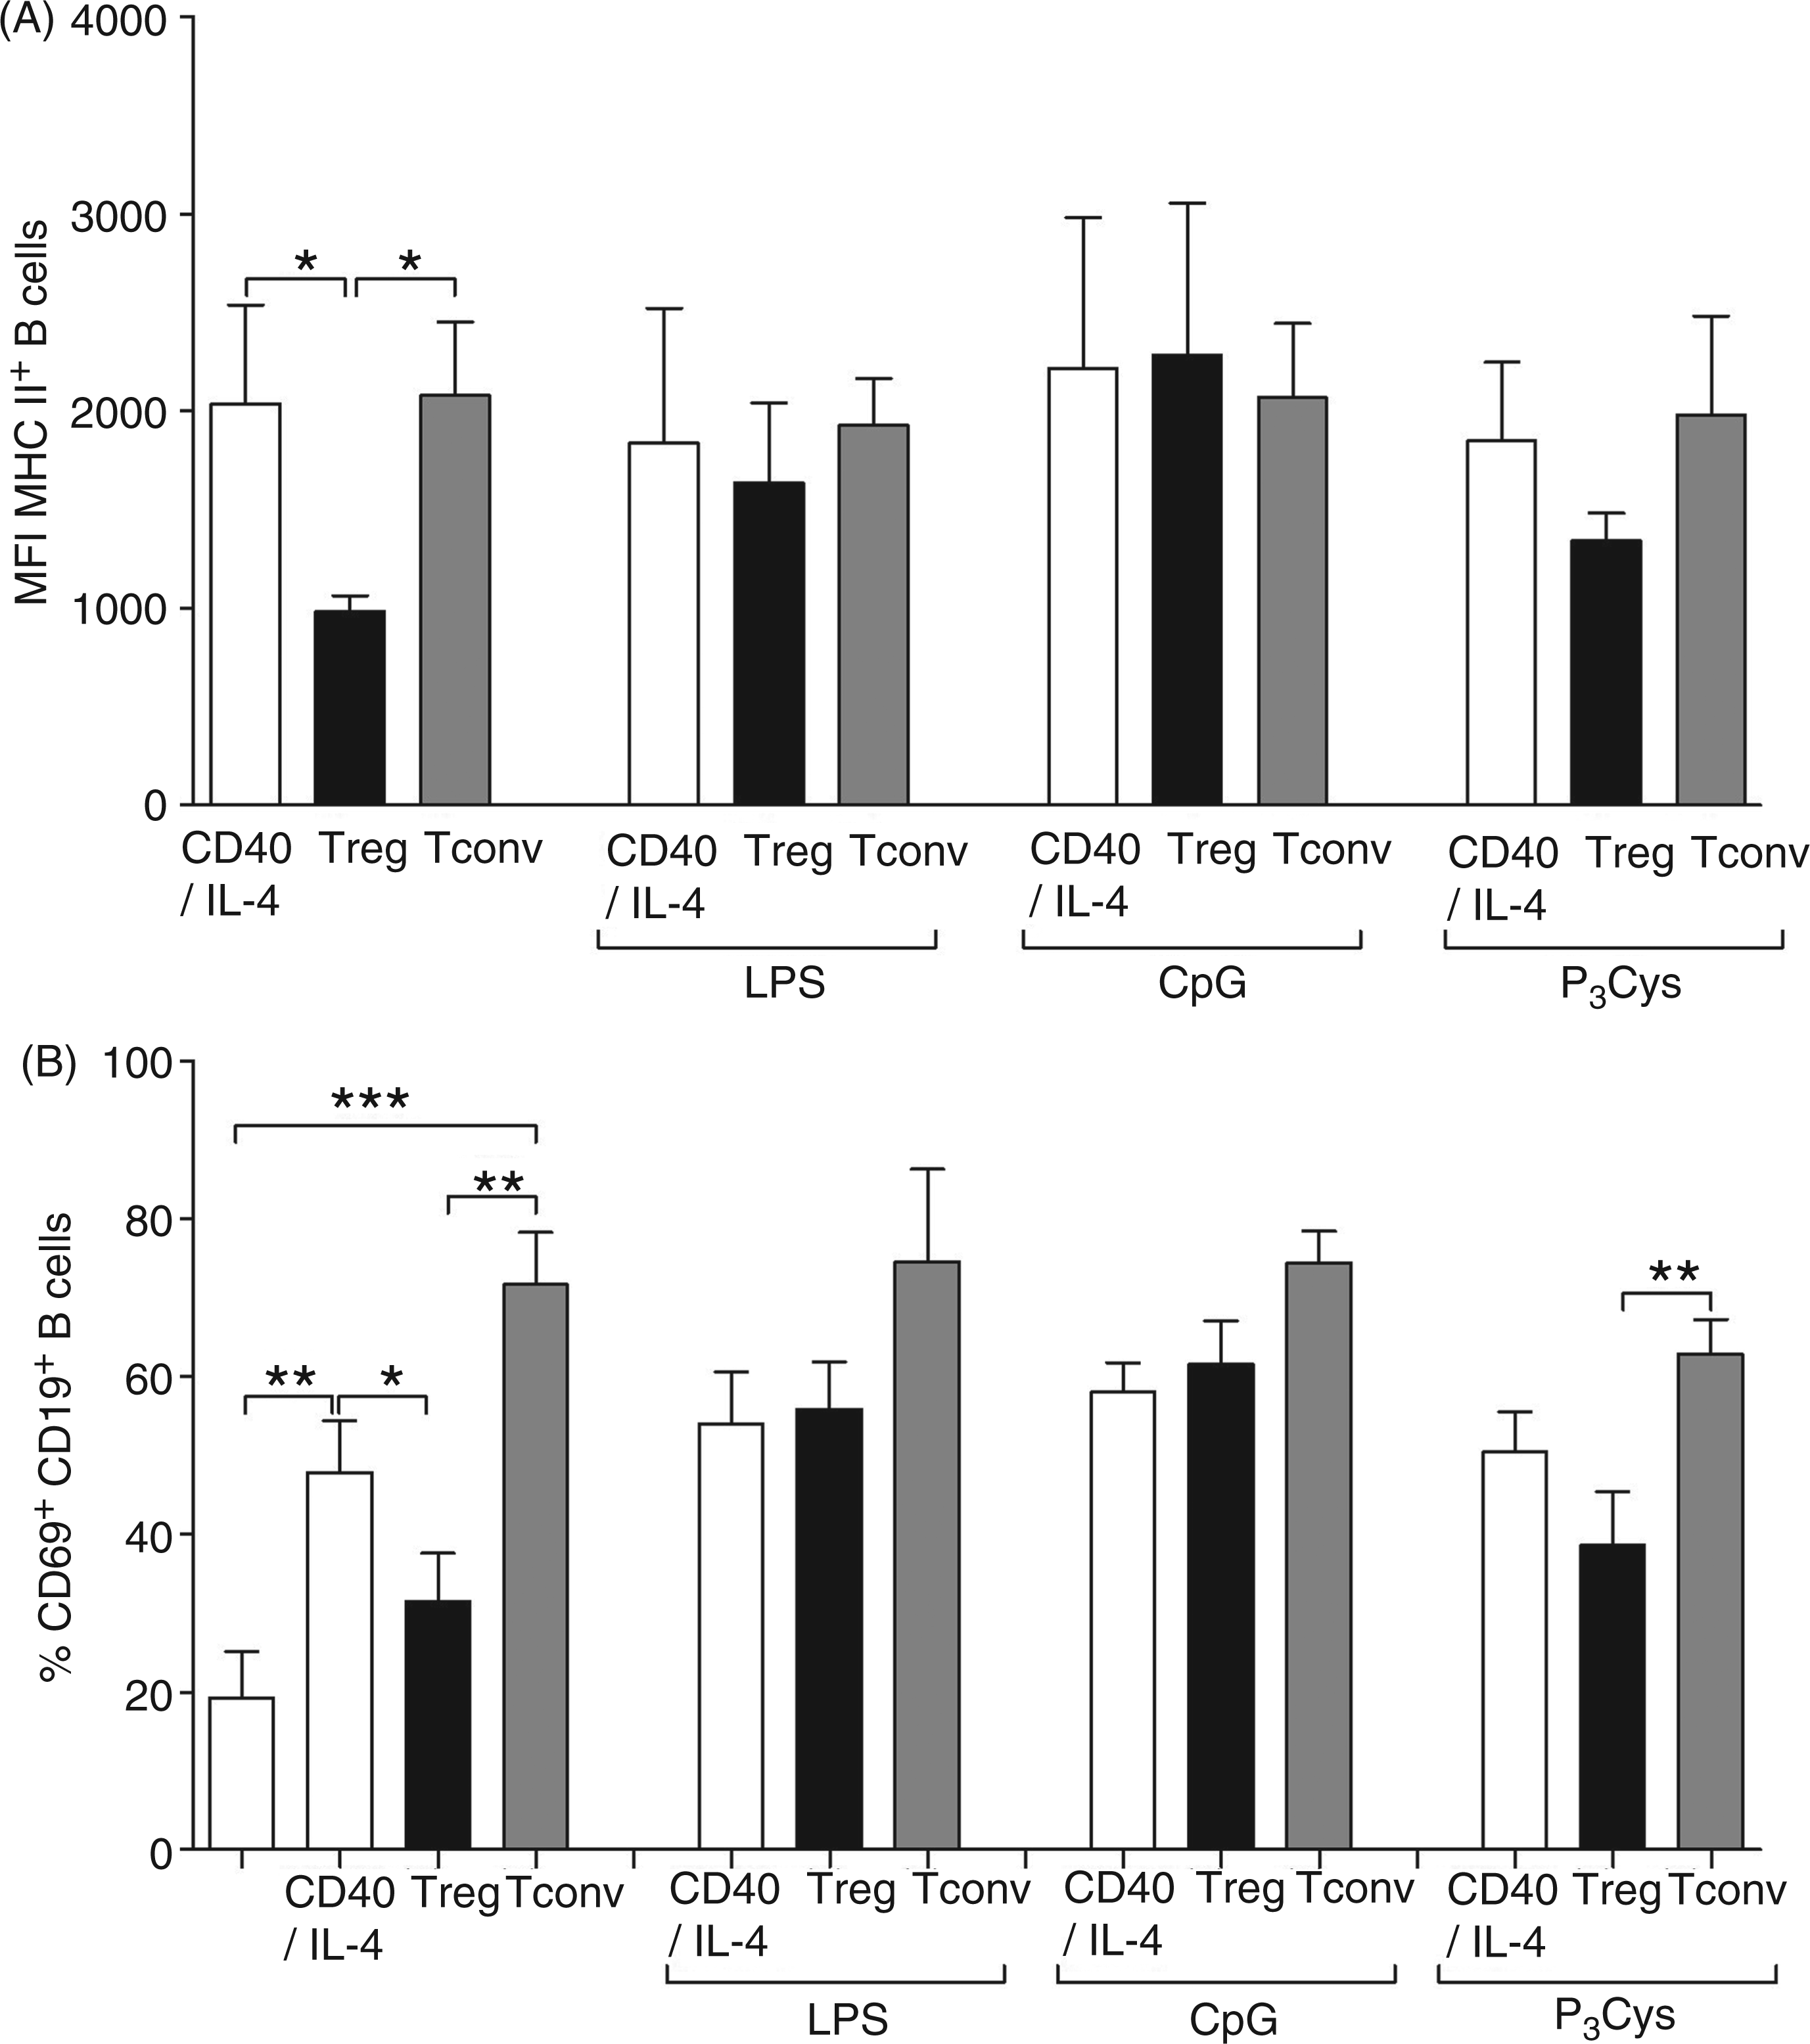
Altered cytokine profiles and re-programming of Tregs in TLR-triggered Treg:B cell co-cultures
Next, we analyzed the cytokine milieu in Treg:B cell co-cultures. In the absence of any T cells, TLR-stimulated B cells, again activated with CD40L/IL-4, produced some IL-6 (Figure 5A), but little IL-10 (Figure 5B), IFN-γ (Figure 5C) or IL-5 (data not shown). Interestingly, B cells produced significant amounts of IL-1β upon LPS and CpG stimulation, but not Pam3Cys (Figure 5D). No IL-1β responses were detected in cultures containing HKLM (data not shown). Upon the addition of T cell subsets (Tregs, Tconv or Th1-TCC) the resulting cytokine profiles were markedly altered. For example, the presence of Tconv and, to a lesser extent, Th1-TCC, boosted the overall production of IL-6 regardless of the nature of B cell pre-treatment (Figure 5A). The presence of these cells also instigated the release of IFN-γ—a cytokine barely detectable in co-cultures of B cells alone or with Tregs (Figure 5C). However, whereas IL-1β was elevated in cultures with Tconv cells this cytokine was not detected in cultures with Th1-TCC. It will be interesting to follow up on why the presence of Th1 cells dampens the production of this cytokine. IL-10, however, was produced strongly in non-TLR-stimulated Treg:B cell co-cultures (Figure 5B, bars 1 and 6). Interestingly, these levels were decreased significantly following LPS or CpG, but not Pam3Cys or HKLM stimulation; indeed, levels were significantly up-regulated in Pam3Cys-triggered cultures (see bars 6 and 9 in Figure 5B). This scenario was not observed in cultures with Tconv or Th1-TCC (Figure 5B). Although other studies have demonstrated the propensity of B cells to produce higher levels of IL-10 (800 pg/ml) after CpG stimulation,
30
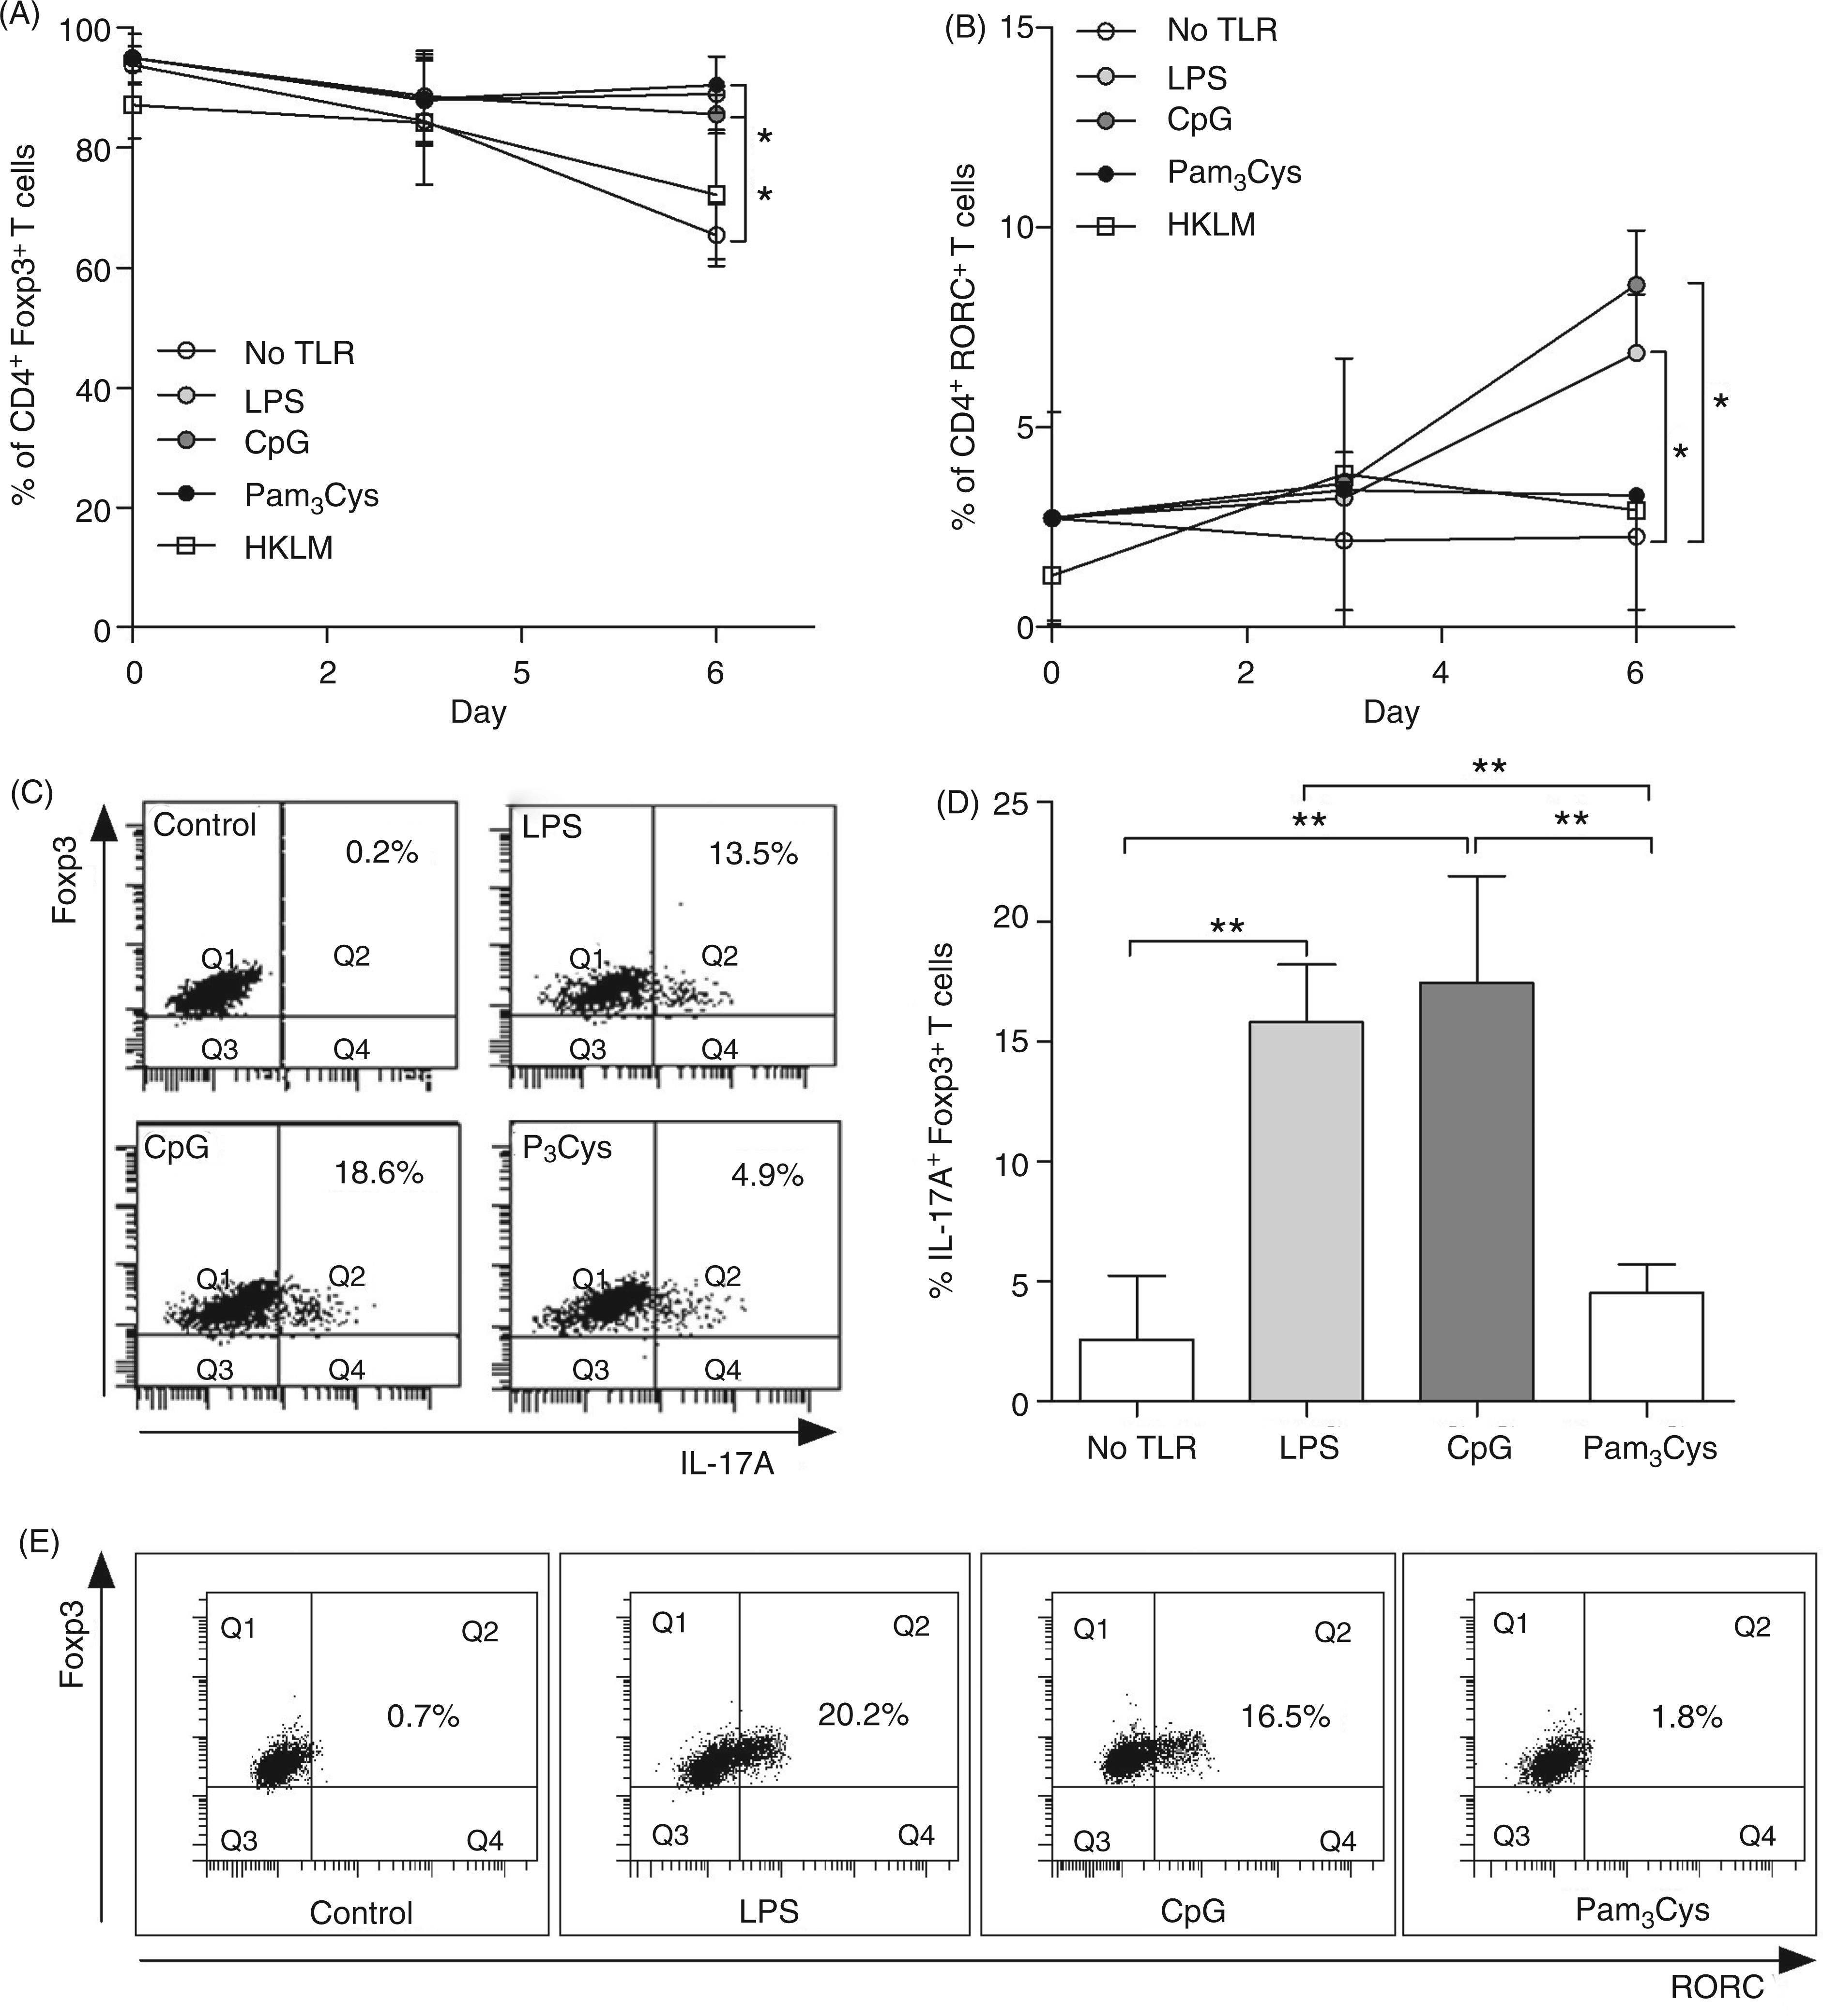
we consider that our data are in accordance as B cells were only pulsed here for 12 h. These data demonstrate clearly that despite all cultures involving TLR stimuli, different outcomes can occur in Treg, Tconv or Th1-TCC:B cell cultures. As IL-6 and IL-1β have been implicated in converting Tregs to IL-17-producing cells,31–33 we also measured IL-17 in the co-cultures (Figure 5E). Whereas TLR-stimulated B cells alone or with either Tconv or Th1-TCC induced only nominal levels of this cytokine, co-cultures of Tregs with LPS- or CpG-activated B cells produced significant levels of IL-17 (Figure 5E, see bars 7 and 8 with 6). This effect was not observed when triggering with TLR2 stimuli (Figure 5E, bars 9 and 10), indicating that signaling through this receptor supports Treg function. To determine whether Tregs were being re-programmed into Th17+ cells we stained Tregs intracellularly for Foxp3 and RORC2 during the assay co-culture (Figure 6A, B). On d 6, expression levels of Foxp3 decreased slightly (Figure 6A) in cultures without any TLR-stimuli, but not in cultures containing B cells stimulated with TLR ligands. With regards to ROR2, this transcription factor was only detected in Tregs from cultures with B cells stimulated with CpG and LPS, but not Pam3Cys or HKLM, suggesting the existence of Foxp3+RORC2+ T cells. To assess the extent of Treg re-programming we stained Tregs intracellularly for levels of Foxp3 and IL-17, and determined that Tregs from LPS or CpG co-cultures secreted much higher levels of IL-17 than those from non-TLR or Pam3Cys activated co-cultures (Figure 6C, D). These data suggested the generation of Foxp3+IL-17+-producing T cells and therefore we assessed the levels of RORC and, indeed, a dual intracellular staining of RORC and Foxp3 clearly showed the conversion of Tregs upon co-culture with CpG and LPS, but not Pam3Cys stimulated B cells (Figure 6E).
In contrast to TLR2, triggering TLR4 and 9 on B cells elicits IL-6 and IL-1β and promotes IL-17 production in the presence of Tregs but not Tconv. (A–E) Purified CD19+ B cells (1 × 10⁵) were cultured for 12 h in medium (no TLR) or in the presence of LPS (100 ng/ml), CpG-ODN (1 µg/ml), Pam3Cys (1 µg/ml) or HKLM (2 × 10⁶ cells/ml) in the presence of CD40L (1 µg/ml) and IL-4 (50 U/ml). B cells were then further cultured alone (- - -) or with 1 × 10⁵ Tregs, Tconv or Th1-TCC cells stimulated with anti-CD3/CD28 mAb (10 µg/ml/2.5 µg/ml). Levels of (D) IL-1β were measured after 24 h of incubation whereas (A) IL-6, (B) IL-10, (C) IFN-γ and (E) IL-17 were measured after 72 h by ELISA. Bars represent mean ± SEM from experiments using eight donors. Asterisks indicate significant differences (ANOVA or Student's t-test) between the groups indicated by the brackets (*P < 0.05, **P < 0.01, ***P < 0.001). Tregs co-cultured with TLR4- and TLR9-, but not TLR2-stimulated B cells partially develop into RORC+IL-17-secreting T cells. Purified B cells (1 × 10⁵) were stimulated for 12 h with TLR stimuli (LPS, CpG, Pam3Cys or HKLM) in the presence of CD40L (1 µg/ml) and IL-4 (50 U/ml). After medium exchange, isolated Tregs (1 × 10⁵) were added to the cultures and stimulated with anti-CD3/CD28 mAb (10 µg/ml/2.5 µg/ml). Over 6 d, levels of (A) Foxp3 and (B) RORC were measured within Tregs. Symbols show the mean ± SD from eight individual cell cultures. (C) Intracellular staining of IL-17 and Foxp3 in Tregs after 3 d of culture with CD40L/IL-4 stimulated B cells and either no TLR (upper left), LPS (upper right), CpG (lower left) or Pam3Cys (lower right). Dot plots show one representative of eight [see (D)]. (D) Flow cytometric quantification of IL-17+Foxp3+ Tregs within the co-cultures described in (C). Graphs show mean ± SD of eight individual experiments. (E) Dual intracellular staining of Foxp3 and RORC in Tregs from the above-described co-cultures: no TLR stimuli (far left); LPS, (left); CpG (right); or Pam3Cys (far right). Dot plots show one representative of eight individual cell cultures. Asterisks indicate significant differences (ANOVA or Student's t-test) between the groups indicated by the brackets (*P < 0.05, **P < 0.01).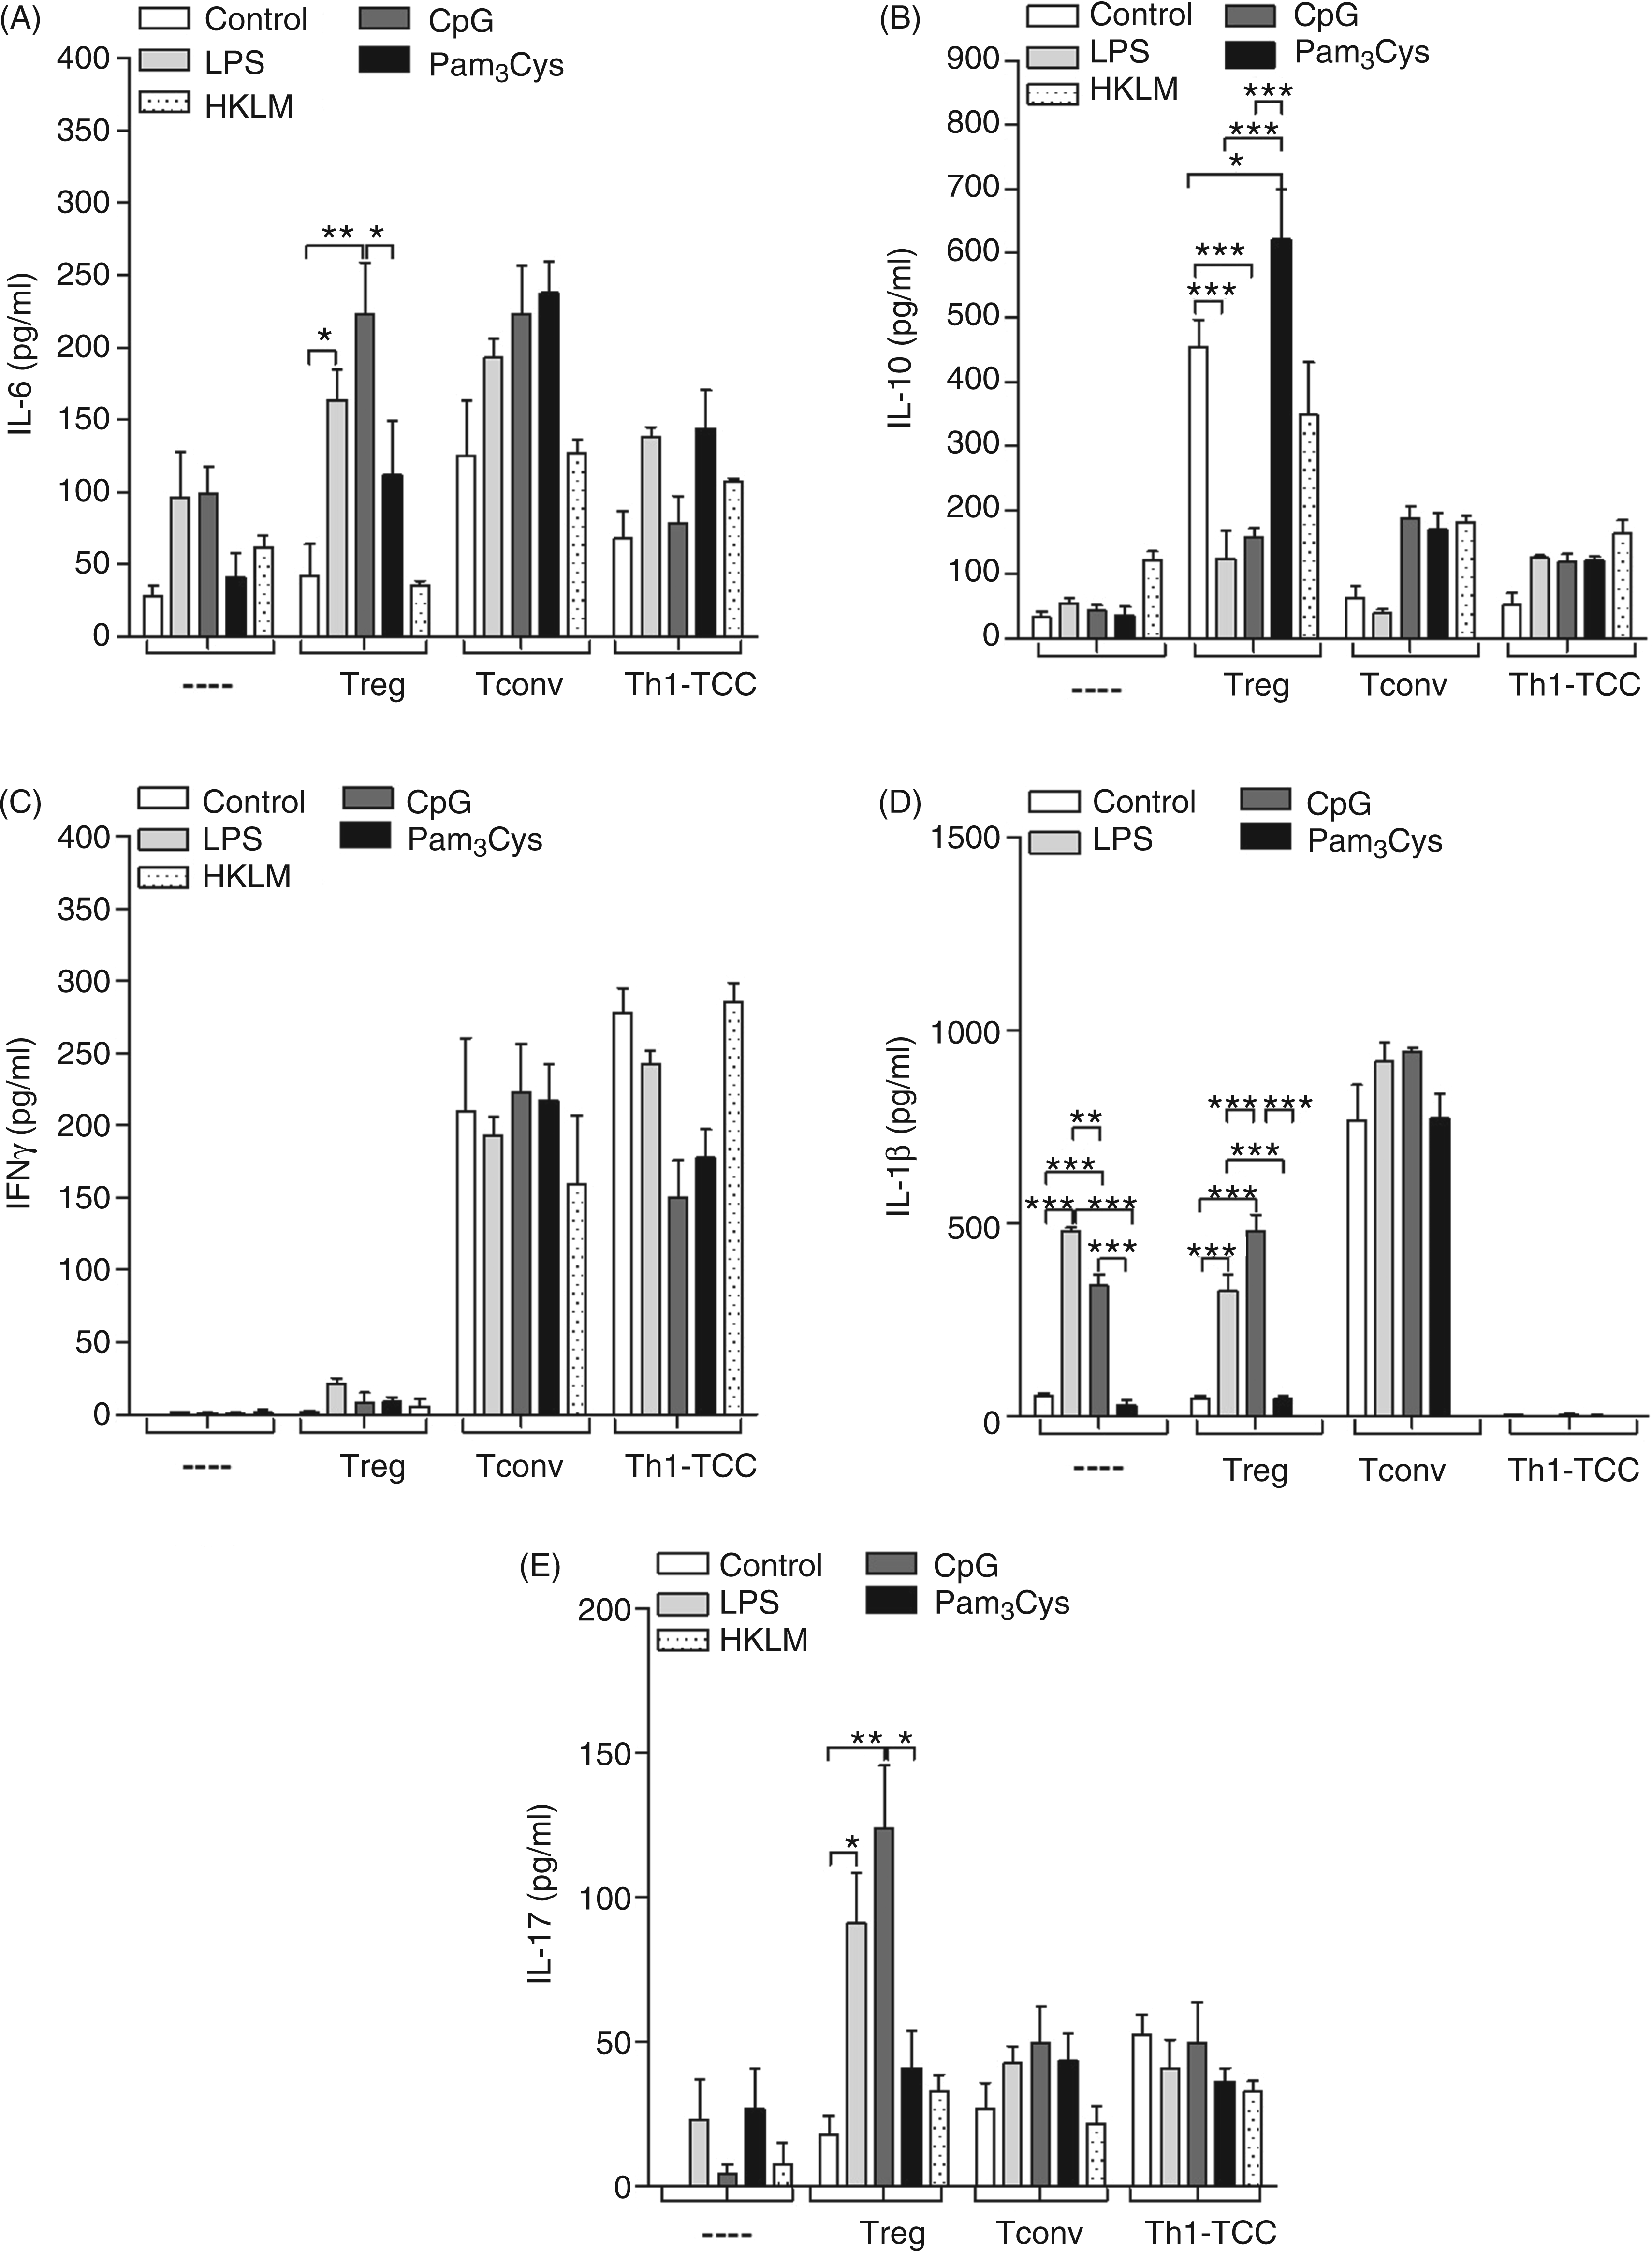
Discussion
Recent studies on the plasticity of Tregs and Th17 cells have demonstrated that these two T cell populations are related in ontogeny.34–36 Moreover, it appears that RORC can even inhibit the specific Treg transcription factor, Foxp3, emphasizing that during polarization intricate cross-regulation mechanisms ensure that the appropriate T cell population is polarized and expanded. 34 The data presented here however, reveal that this plasticity does not only occur during the differentiation step of T cell populations, but can even occur in already established Treg subsets. We show here that when B cells are triggered with certain innate stimuli, co-cultured Foxp3+ Tregs no longer dampen the production of Igs. Moreover, they up-regulate RORC and secrete IL-17. Interestingly, RORC+ Tregs have been shown to play a role in controlling diabetes, 37 and the emergence of such cells described here is in accordance with the general consensus that levels of RORC are strengthened under inflammatory conditions, whereas Tregs are promoted in a steady state.31–36
Although more renowned for their ability to suppress T effector cells, it has been shown that Tregs can also regulate Ig responses from B cells. For example, depletion of Tregs can lead to aberrant Ab production, and the administration of Tregs into autoimmune animals significantly reduces auto-Ab production.23,38 Furthermore, Foxp3+ Tregs are present in B cell areas where T–B cell interactions and humoral immune responses are believed to occur and can directly suppress the expression of activation-induced cytosine deaminase (AID), a key enzyme involved in class switch recombination. 24 Our previous research elucidated that Treg clones directly regulate B cell IgG4 production in a cell contact- and IL-10-dependent manner.9,11 Moreover, siRNA-induced down-regulation of Foxp3 in these Treg clones prevented their ability to induce IgG4 and skewed B cell Ab production. 9 Our current data demonstrate that CD4+CD25+Foxp3+CD127dim Tregs from healthy individuals down-regulate all Ig production by B cells except IgG4, and is further associated with the ability of those cells to dampen the generation of plasma cells and reduce levels of surface activation markers, such as MHC II and CD69. A reduction in these markers was not observed upon co-culture with Tconv cells and was over-ridden upon prior B cell stimulation with TLR4 and TLR9. Interestingly, these data correlate with other studies showing the ability of Tregs to induce alternative activation of macrophages. 5 Those studies also demonstrated that Tregs dampen HLA-DR expression on macrophages, but up-regulate CD206 and CCL18. 5 Thus, it appears that APCs are actively suppressed in the presence of Tregs.5,23,24,38
The prevalence of IgG4 during allergy or helminth infection is a logical protective response of the host as it provides a mechanism to counter-regulate high IgE and other IgG subclasses in order to avoid excessive immunopathology. For example, in filarial nematode infections, such as onchocerciasis and lymphatic filariasis, the majority of patients present mild symptoms of immunopathology, and, interesting, these patients have high levels of IgG4, IL-10 and Tregs.11–13 These ‘generalized’ patients are in strong contrast to the rare ‘sowda’ patients, who present severe pathological symptoms.10,39 Thus, the question remains how such differing immune responses can stem from the same agent. Our working hypothesis is that helminth components, many of which trigger innate receptors, immuno-modulate the host’s immune system by inducing Tregs, which then drives the more protective IgG4 scenario.39–41 The induction of helminth-specific Tregs has been shown in several helminth models, including schistosomiasis, and lack of Tregs in that model leads to uncontrolled Th responses and immunopathology.3,15 This finely tuned immune balance therefore ensures a beneficial atmosphere for both parasite and host, and guarantees the parasite’s long term survival. However, should an additional bacterial infection and thus TLR-triggering occur during the initial phase of ‘helpful’ Treg induction, we hypothesize that the Tregs are re-programmed in order to aid the current immune situation.
To test our hypothesis that a secondary infection could elicit signals that re-program Tregs, we simulated a bacterial or plasmodial infection42,43 by triggering TLR on B cells. To rule out that the observed immune responses were not due to TLR triggering on Tregs, assays were performed in which the Tregs were pre-cultured with different TLR stimuli. In these assays no differences were observed in the Ig profiles of B cells, indicating that TLR ligands were not directly influencing the Tregs themselves. Moreover, no IL-17 was detected in these cultures (data not shown). Interestingly, the re-programming of Tregs into IL-17-producing cells was also elicited using TLR-triggered dendritic cells (DC) and monocytes (data not shown) indicating that this broad spectrum mechanism facilitates prompt immune responses to danger. Such TLR triggering on B cells not only skewed the Treg phenotype, but also altered the outcome of Ig production. Other studies have also shown skewed Ig production upon TLR activation of B cells, such as decreased IgE, but up-regulated IgA upon CpG stimulation. 43 As mentioned earlier our observed effects were not seen upon prior activation of Tregs with TLR, which is in contrast to studies using murine models of inflammatory bowel disease that have uncovered that the generation of Th17 cells is through Myd88 signaling of T cells, but not DC. 25 Nevertheless, within the same model, TLR-dependent tolerance mechanisms have also been described that required innate signaling through APC.25,44,45 Similar scenarios are associated with autoimmune diseases, such as systemic lupus erythematosus where it is suspected that TLR triggering of APC drives effector CD4+ Th1 cells, which, in turn, influence Ab production.25,26,46 Thus, as with most immunological models, the setting and cell type play critical roles in the actual onset or outcome of disease.
As mentioned earlier, we have previously elucidated that Tregs require IL-10 to induce IgG4 by B cells and we were thus extremely interested in the fact that co-culturing Treg:B cell co-cultures with TLR2 ligands did not skew Ig production, but promoted IgG4 secretion and, moreover, enhanced the production of IL-10 in the co-cultures. The relationship between TLR2 and Tregs has been addressed for many years and dysregulation in this signaling prevents the development of immunoregulatory mechanisms that protect against autoimmunity. 47 Within this study we used two different ligands that are specific for different TLR2 structures: Pam3Cys and HKLM.48,49 Therefore, triggering either of the TLR2 dimers does not elicit the same responses as seen with LPS or CpG. With regard to helminth infections, TLR2 was shown to be critical for helminth-specific Treg induction during schistosomiasis15,16 and another study revealed that a certain schistosomal component actually triggered TLR2, which elicited IL-10+ Treg from a naive effector population. 21 The positive and negative effects of TLR ligands on Tregs themselves are intriguing, especially in regard to the dynamics of TLR expression on immune-suppressive Treg subsets during disease or upon encounter with certain pathogens. For example, Urry et al. 19 showed that TLR9 was highly expressed on vitamin D-activated Tr1 (IL-10+ T cells), but not Tregs or other Th subsets. In this context it will also be interesting to study the effect of endogenous TLR ligands on Tregs to in order to gain a better understanding of Treg homeostasis in either health or disease.
Footnotes
Funding
This work was supported by the German Research Foundation [DGF, grants Ho2009/8-1 and 8-2 and SFB 704].
Acknowledgements
We thank the Institute of Experimental Haematology and Transfusion Medicine, University Clinic Bonn, Germany, for providing access to blood samples. Special thanks to C. Horn for excellent technical assistance and M. Ritter and K. Arndts for critically reading the manuscript.
Conflicts of interest
The authors do not have any potential conflicts of interest to declare.
References
Supplementary Material
Please find the following supplemental material available below.
For Open Access articles published under a Creative Commons License, all supplemental material carries the same license as the article it is associated with.
For non-Open Access articles published, all supplemental material carries a non-exclusive license, and permission requests for re-use of supplemental material or any part of supplemental material shall be sent directly to the copyright owner as specified in the copyright notice associated with the article.