
Abstract
This study aimed at providing a better understanding of the involvement of innate immune factors, including miRNA, in the local host response to influenza virus infection. Twenty pigs were challenged by influenza A virus subtype H1N2. Expression of microRNA (miRNA), mRNA and proteins were quantified in lung tissue at different time points after challenge (24 h, 72 h and 14 d post-infection (p.i.). Several groups of genes were significantly regulated according to time point and infection status including pattern recognition receptors (TLR2, TLR3, TLR7, retinoic acid-inducible gene I, melanoma differentiation associated protein-5), IFN and IFN-induced genes (IFN-β, IFN-γ, IRF7, STAT1, ISG15 and OASL), cytokines (IL-1 β, IL-1RN, IL-6, IL-7, IL-10, IL-12A, TNF-α, CCL2, CCL3 and CXCL10) and several acute phase proteins. Likewise, the following miRNAs were differentially expressed in one or more time groups compared with the control pigs: miR-15a, miR-21, miR-146, miR-206, miR-223 and miR-451. At d 1 p.i. lung tissue protein levels of IL-6, IL-12 and IFN-α were significantly increased compared with the control group, and haptoglobin and C-reactive protein were significantly increased at d 3 p.i. Our results suggest that, in addition to a wide range of innate immune factors, miRNAs may also be involved in controlling acute influenza infection in pigs.
Introduction
Swine influenza is a highly infectious respiratory disease in pigs caused by influenza A virus. Swine influenza poses a major problem in agricultural settings with severe effects on both animal welfare and production economy. Infection with swine influenza A virus causes a number of symptoms, including fever, coughing, nasal discharge, dyspnoea, decreased appetite and mass loss, and is further characterized by high morbidity (up to 100%) and low mortality (< 5%).1,2 The H1N2 swine influenza virus, reported for the first time in the UK in 1995, spread to pig populations in European mainland countries during the 1990s.3–5 However, another reassortant H1N2 virus (used as infectious agent in the present study) with an avian-like swine influenza virus H1N1 HA and a European H3N2 swine influenza virus-like NA, has been circulating in Danish pig populations since 2003. Recently, this reassortant was also detected in Sweden and Italy.6–8
The pig has been proposed as an animal model for human influenza as the anatomy and physiology of the porcine respiratory tract are more similar to humans than these characteristics in rodent models.9–11 Cytokine response profiles in influenza-infected pigs have also been shown to resemble profiles found in nasal lavage and serum of humans with influenza A infection.2,12 Nevertheless, differences exist, including the large number of pulmonary intravascular macrophages found in pigs, 13 implying that further research is needed in order to fully elucidate the potential of the pig as an animal model of human influenza.
Infection with swine influenza virus is limited to the respiratory tract. The presence and replication of swine influenza virus H1N1 and H1N2 have been reported in bronchial and bronchiolar epithelial cells of pigs.14–17 A frontline of pattern recognition receptors (PRRs) expressed by epithelial cells and other cells of the respiratory tract activates the innate immune system after recognition of invading virus. Swine influenza virus recognition is operated primarily by two classes of PPRs: the membrane-bound TLRs and the cytoplasmic receptors, such as retinoic acid-inducible gene I (RIG-I)-like receptors and melanoma differentiation associated protein-5 (MDA5). TLR3 and TLR7, both located within intracellular endosomes, have been found to play an important role in influenza A virus recognition and initiation of the immune response in human respiratory epithelial cells and plasmacytoid dendritic cells.18,19 Activation of both the TLRs and the cytoplasmic receptors leads to a potent type 1 IFN release and simultaneous pro-inflammatory cytokine expression. Type 1 IFNs, IFN-γ and pro-inflammatory cytokines, such as IL-1, IL-6, IL-8, IL-12 and TNF-α, have been shown to be up-regulated in lung tissue and lung lavage after experimental infection of pigs with swine influenza virus.1,2,16,20,21
Although adaptive immune mechanisms are needed for complete clearance of swine influenza virus, high genetic variability due to antigenic drift and gene reassortment makes it possible for swine influenza virus to escape previously acquired immunity. Thus, the innate immune response is pivotal for protection until the establishment of specific immunity in the form of protective Abs and cytotoxic T lymphocytes. A transient induction of cytokines is required for this efficient antiviral defence. However, an over-reactive and prolonged pro-inflammatory response may lead to excessive infiltration of immune cells, contributing to immunopathology of the infected lung.22–25 Thus, this response must be tightly regulated. Recently, microRNA (miRNA) has been proposed to play an important role in modulating and fine-tuning the innate immune response in order to avoid such harmful overreactions.26–28
miRNA are small, non-coding RNA molecules (18–23 nt), that regulate gene expression in a wide range of organisms. 29 miRNA, incorporated into the RNA-induced silencing complex, binds to the 3′ untranslated regions (UTRs) of specific targeted mRNAs leading to mRNA degradation or to repression of translation of the targeted mRNA transcript to protein.30,31 Recent results suggest that cellular miRNAs are centrally involved in influenza infection, both by targeting immune-related host transcripts and by targeting viral gene products.27,32–34 Analysis of miRNA expression in lung tissue of macaques infected with the highly pathogenic H5N1 avian influenza virus and another group of macaques infected with a less pathogenic H1N1 virus revealed several miRNAs to be expressed according to the infective viral strain. 35 Host-encoded miRNA has been shown to target the infecting virus as reported by Song et al. 32 in 2010; they found miR-323, miR-491 and miR-654 to inhibit the replication of H1N1 in infected MDCK cells through binding to the conserved region of the PB1 gene of the influenza virus.
Still, little is known about the significance of miRNA regulation in the lung during acute influenza A infection. The present work aims to provide a better understanding of the involvement of innate immune factors, including miRNA, in the host response to establishment and progression of influenza virus infection. Twenty pigs were challenged by aerosols containing H1N2 (A/sw/Denmark/12687/03) influenza virus. Expression of mRNA coding for cytokines, chemokines, PRRs and other antiviral effector molecules was quantified, as were miRNA and protein levels of IFN-α, IL-1β, IL-6, IL-12A, haptoglobin (Hp), and C-reactive protein (CRP) in lung tissue sampled at different time points: 24 h post-infection (p.i.), 72 h p.i. and 14 d p.i.
In agreement with other influenza studies (H1N1, H1N2) in pigs,1,2,21,36 we found an early and substantial immunological response characterized by a strong and transiently increased expression of pro-inflammatory cytokines, interferons, chemokines, PRRs and acute phase proteins (APPs) in the lung of swine influenza H1N2 virus-infected pigs. Furthermore, our results demonstrate a significant regulation of several host miRNAs in these pigs.
Materials and methods
Experimental design
Pigs (cross-bred Large White × German Landrace) used in the present study were seronegative against swine influenza A viruses H1N1, H3N2 and H1N2 (tested against the following strains by haemagglutination inhibition assay: A/sw/Haselünne/IDT2617/03 H1N1, A/sw/Bakum/1832/00 H1N2, A/sw/Bakum/IDT1769/03 H3N2, A/sw/Denmark/13850/03 H1N1, A/sw/Denmark/12687/03 H1N2). Pigs were challenged by simultaneous aerosol exposure of 6 l culture supernatant containing 104.5 TCID50/ml of the Danish H1N2 reassortant virus (A/sw/Denmark/12687/03). Nasal swab samples from all infected animals were collected just before infection and at d 1, 3, 5, 7 and 14 after challenge. Infected animals were euthanized at 24 h p.i. (n = 6), 72 h p.i. (n = 6) and 14 d p.i. (n = 8). The five non-infected control animals were euthanized at the same time as the 14 d p.i. group. Lung samples (500 mg) from the left cranial lobe of all animals were stabilized immediately after sampling in RNAlater (Qiagen, Hilden, Germany), and stored at −20℃ until extraction of total RNA and protein. Lung samples were taken from regions without lung gross lesions.
Evaluation of clinical symptoms
After challenge, clinical symptoms and rectal body temperature were recorded morning and afternoon until d 3 p.i. Characterization of clinical symptoms was based on the following dyspnoea score: 0 = breathing unaffected; 1 = increased respiratory frequency and moderate flank movement; 2 = marked pumping breathing and severe flank movement; 3 = laboured breathing affecting the entire body, pronounced flank movement and substantial movements of the snout, 4 = severe breathing reflecting substantial lack of oxygen.
Detection of viral RNA in lung tissue and nasal swab samples
Total RNA was extracted from 30 mg lung tissue or 200 µl of nasal swab samples by RNeasy Mini Kit (Qiagen) according to manufacturer's procedure. Influenza A virus was detected by an in-house version of the PriProET assay detecting the matrix gene. 37
RNA extraction from lung tissue
Approximately 20–30 mg of RNAlater (Qiagen)-stabilized lung tissue was homogenized in 1 ml QIAzol Lysis Reagent (Qiagen) using a gentleMACS™ Dissociator machine (Milteny Biotec, GmbH, Bergisch Gladbach, Germany). Total RNA was extracted using miRNeasy Mini Kit (Qiagen), and all samples were treated with RNase-free DNase (Qiagen), according to the manufacturer’s instructions. The purity of extracted total RNA was assessed based on UV absorption spectra, including OD 260/280 and OD 260/230 ratios on a Nanodrop ND-1000 spectrophotometer (Saveen and Werner AB, Limhamn, Sweden). Total RNA was quantified at OD 260. RNA integrity was measured on an Agilent 2100 Bioanalyzer (Agilent Technologies, Nærum, Denmark) using the RNA 6000 Nano Kit.
Primer design and optimization (mRNA)
Porcine primers were designed using Primer3 (http://frodo.wi.mit.edu/) as described in Skovgaard et al.. 2009, 38 and synthesized at TAG Copenhagen (Copenhagen, Denmark). Primer sequences, amplicon length and reaction efficiency are shown in Supplementary Table S1. Primers were designed over introns if possible, and BLAST searches (http://blast.ncbi.nlm.nih.gov/Blast.cgi) were performed to ensure the absence of intraspecies polymorphisms at the primer site. Primer amplification efficiencies and dynamic ranges were acquired from standard curves constructed from several separate dilution series of pooled cDNA: dilution 1:3, 1:30, 1:300, 1:3000 and 1:30000. Melting curves and agarose gel electrophoresis of amplicons were performed to certify primer specificity, and selected amplicons were sequenced for further confirmation. For several genes of interest two or three primer pairs, annealing at different sites at the mRNA transcript, were designed.
cDNA synthesis and pre-amplification (mRNA)
Extracted RNA was converted into cDNA by reverse transcription of 500 ng total RNA using the QuantiTECT Reverse Transcription kit (Qiagen), containing a mix of random primers and oligo-dT, according to the manufacturer's instructions. Two separate cDNA reactions were performed for each sample. Non-reverse transcriptase controls were prepared. cDNA was diluted 1:6 in low EDTA TE-buffer (VWR – Bie & Berntsen, Herlev, Denmark) prior to pre-amplification. Pre-amplification was done using TaqMan PreAmp Master Mix (Applied Biosystems, Foster City, CA, USA) in the following way. A 200-nM combined primer mix was prepared combining all primers used in the present study. TaqMan PreAmp Master Mix (5 µl) was mixed with 2.5 µl of 200 nM combined primer mix and 2.5 µl of diluted cDNA, and incubated at 95℃ for 10 min, followed by 15 cycles of 95℃ at 15 s and 60℃ at 4 min. Pre-amplified cDNA was diluted at least 1:4 in low EDTA TE-buffer (VWR – Bie & Berntsen) before quantitative real-time PCR (qPCR).
qPCR (mRNA)
qPCR was performed in the 48.48 Dynamic Array Integrated Fluidic Circuits (Fluidigm, CA, USA, USA) combining 48 pre-amplified samples with 48 primer sets for 2304 individual and simultaneous qPCR reactions. The following reagents were used for 48 reactions of pre-sample mix: 3 µl of ABI TaqMan Gene Expression Master Mix (Applied Biosystems), 0.3 µl of 20X DNA Binding Dye Sample Loading Reagent (Fluidigm), 0.3 µl of 20X EvaGreen (Biotium; VWR – Bie & Berntsen), 0.9 µl low EDTA TE Buffer (VWR – Bie & Berntsen) and 1.5 µl diluted pre amplified cDNA. Primer mixes were prepared using 2.3 µl of 20 µM forward and reverse primers (see Supplementary Table S1), 2.5 µl of 2X Assay Loading Reagent (Fluidigm) and 0.2 µl of low EDTA TE-buffer (VWR – Bie & Berntsen). The 48.48 Dynamic Array was primed in the IFC controller (Fluidigm) prior to loading of sample and primer. Sample mix, including cDNA (5 µl) and primer mix (5 µl) was dispensed into appropriate inlets and loaded into the chip in the IFC Controller, combining each of the 48 samples with 48 primers in 2304 separate reactions. The chip was then placed in the BioMark real-time PCR instrument (Fluidigm) and the following cycle conditions were used: 2 min at 50℃ and 10 min at 95℃, followed by 35 cycles with denaturation for 15 s at 95℃ and annealing/elongation for 1 min at 60℃. Melting curves were generated after each run to confirm a single PCR product (from 60℃ to 95℃, increasing 1℃/3 s).
Reactions were performed in duplicate (cDNA replicates). Non-template controls were included to indicate potential problems with non-specific amplification or sample contamination. Non-reverse transcriptase controls were included to assess potential DNA contamination. Relative concentrations of target mRNA were assigned using standard curves constructed from 3 separate dilution series of pooled cDNA of equal amounts of all samples: dilution 1:3, 1:30, 1:300, 1:3000, 1:30,000. Data were acquired using the Fluidigm Real-Time PCR Analysis software 3.0.2 (Fluidigm).
cDNA synthesis and qPCR (miRNA)
Reverse transcription of 1 µg total RNA was performed according to the manufacturer's instructions (miScript; Qiagen). qPCR was performed on a Rotor-Gene 3000 (Corbett Research, Sydney, Australia) in 20 µl total volume with 1 µl of cDNA diluted 10–15 times, 10 µl of 2 x Quantitect SYBR Green PCR master mix (Qiagen), 1 µl of universal primer (Qiagen), 1 µl of 10 µM miRNA-specific primer and 7 µl of miliQ-water. Each run included a no-template control and standard curves with fivefold dilutions to calculate qPCR efficiency. Primer sequences and efficiency for each assayed miRNA gene are listed in Supplementary Table S2. Cycling conditions were 95℃ for 15 min followed by 40 cycles of 15 s at 94℃, 30 s at 55℃ and 30 s at 72℃. A melting curve analysis (60–99℃) was performed after 40 cycles. Using the same total RNA samples, a second highly specific cDNA synthesis and qPCR method described recently by Balcells et al. 39 was used in order to improve the robustness of the miRNA dataset.
Protein extraction from lung tissue
Protein extraction was performed on tissue from the left cranial lobe of all animals, the same tissue as for the RNA extraction. Briefly, homogenization was performed using 0.2–0.5 g of tissue in 1 ml buffer [0.1 M Tris/HCl pH 7.2, 0.1 M NaCl, plus protease inhibitor cocktail Complete Ultra from Roche (1 tablet per 10 ml buffer)] per 100 mg tissue using a GentleMacs Dissociator (Miltenyi Biotec). The homogenization was followed by incubation on a rocking table for 18 h (overnight) at 4℃. Finally, samples were centrifuged for 20 min at 10,000 g and the supernatant was retrieved and used for analysis of APPs and cytokines by ELISA.
Cytokine detection by ELISA
CRP was analysed in lung tissue extracts by a sandwich-type ELISA using dendrimer-coupled cytidine diphosphocholine (a CRP-binding ligand) in the coating layer, as described in Heegaard et al., 40 employing polyclonal rabbit anti-human Abs with cross-reactivity towards porcine CRP followed by peroxidase-conjugated goat anti-rabbit Ab for detection [both Abs from DAKO (Glostrup, Denmark)]. The cross-reactivity of the anti-human CRP Ab with pig CRP was demonstrated previously, 41 and combining it with diphosphocholine ensures specificity for CRP. Combined pig serum calibrated against a human CRP calibrator (DAKO A0073, DAKO) was used as standard. The detection limit was 35 ng/ml (human equivalents). Hp in lung tissue extracts was determined by a sandwich ELISA using an in-house mouse anti-porcine Hp monoclonal Ab in the coating layer and biotinylated commercial rabbit anti-human haptoglobin (DAKO A0030; DAKO) as the detection Ab, as described previously, 42 with a detection limit of 0.13 µg/ml for the tissue extracts. CRP and Hp plates were developed with a tetramethylbenzidine (TMB) peroxide color substrate from Kem-En-Tec (Taastrup, Denmark), following the manufacturer’s instructions. The ODs of wells were measured at 450 nm, subtracting unspecific colouration at 650 nm using an automatic plate reader (Thermo Multiskan Ex spectrophotometer; Thermo Scientific, Waltham, MA, USA). All samples, including standards, were measured in duplicate. Sample values were calculated from the curve fitted to the readings of the standard (using Ascent software v. 2.6; Thermo Scientific).
IL-6, IL-1β and IL-12A lung tissue concentrations were determined by ELISAs from R&D Systems (Duoset DY686, Duoset DY681, and Duoset DY912 respectively) using goat anti-pig IL-6/IL-1β/IL-12A for catching and biotinylated goat anti-pig IL-6/IL-1β/IL-12A for detection, and also including a porcine IL-6/IL-1β/IL-12A standard respectively. Development of plates was done with a TMB peroxide colour substrate from Kem-En-Tec, following the manufacturer’s instructions. Samples were run in duplicate at a dilution of 1:2 with a detection limit of 31.3 pg/ml (IL-6 and IL-12A) and 15.6 pg/ml (IL-1β). IFN-α was quantified by a sandwich ELISA as described by Sorensen et al. 43 Briefly, an anti-pig IFN-α monoclonal mouse Ab (clone K9; PBL Biomedical Laboratories, Piscataway, NJ, USA) was coated overnight at 4℃ at 0.2 µg/ml in PBS. The pig IFN-α standard was also from PBL Biomedical Laboratories (1.66 × 10⁶ U/ml), and this was applied in a twofold dilution series from 166 U/ml. Samples and standard were incubated for 5 h at 20℃ (room temperature), followed by wash and incubation overnight at 4℃ with the biotinylated detection Ab [mouse monoclonal anti pig IFN-α, clone F17 (PBL Biomedical Laboratories), biotinylated in-house by standard procedures]. Finally, plates were incubated with peroxidase-coupled streptavidin (DAKO) for 1 h at room temperature and then developed using TMB Plus substrate from Kem En Tec. The detection limit was 1.04 U/ml.
Lung tissue extract protein data were normalized in the following way. The extinction at 280 nm was determined for each sample, samples were normalized individually by multiplying with the correction factor: [E280 (mean, all samples)]/[E280 (sample)]. The detection limit for all ELISAs was determined as the lowest concentration in the standard row multiplied by the dilution factor employed for the samples.
Statistical analysis and target prediction
Data pre-processing, normalization, relative quantification and statistics were performed using GenEx5 (MultiD, Göteborg, Sweden). Data were pre-processed as follows. Data were corrected for PCR efficiency for each primer assay individually. For the mRNA data normalization was done to the mean of five reference genes (hypoxanthine phosphoribosyl-transferase 1, ribosomal protein L13a, peptidylprolyl isomerase A, TATA box binding protein and tyrosine 3-monooxygenase/tryptophan 5-monooxygenase activation protein, zeta polypeptide) found to be the most stably expressed reference genes out of seven tested in the present study using both GeNorm 44 and NormFinder. 45 For the miScript miRNA data MiR-107 and miR-664 were validated and used as reference genes. The two technical cDNA replicates were averaged after normalization. To visualize differential gene expression for each gene tested, the mean mRNA expression of the control animals was assigned the value of 1, and relative expressions were calculated for the rest of the samples compared to the control group. Data were log2 transformed for approaching normal distribution prior to ANOVA and t-test analysis. Gene expression was considered to be significant if the P-value was < 0.05. An increase or decrease in expression of at least 2- (mRNA) or 1.5-fold (miRNA) was considered as biologically significant. Gene expression data fitting both P-value and fold-change criteria were plotted in bar diagrams. Pearson correlation coefficients (Rho) were calculated when comparing mRNA and protein data; Spearman rank correlation was used when comparing dyspnoea score with rectal temperature or virus load.
The prediction of miRNA targets in the present study was performed using several different bioinformatics sources: Target Scan 6.1,46–48 PicTar,49,50 microT 51 and Miranda. 52 Vertebrate datasets with conserved target sites were used in Target Scan. The 3′ UTRs of human or bovine origin (if possible) were chosen.
Results
Clinical signs and pathology
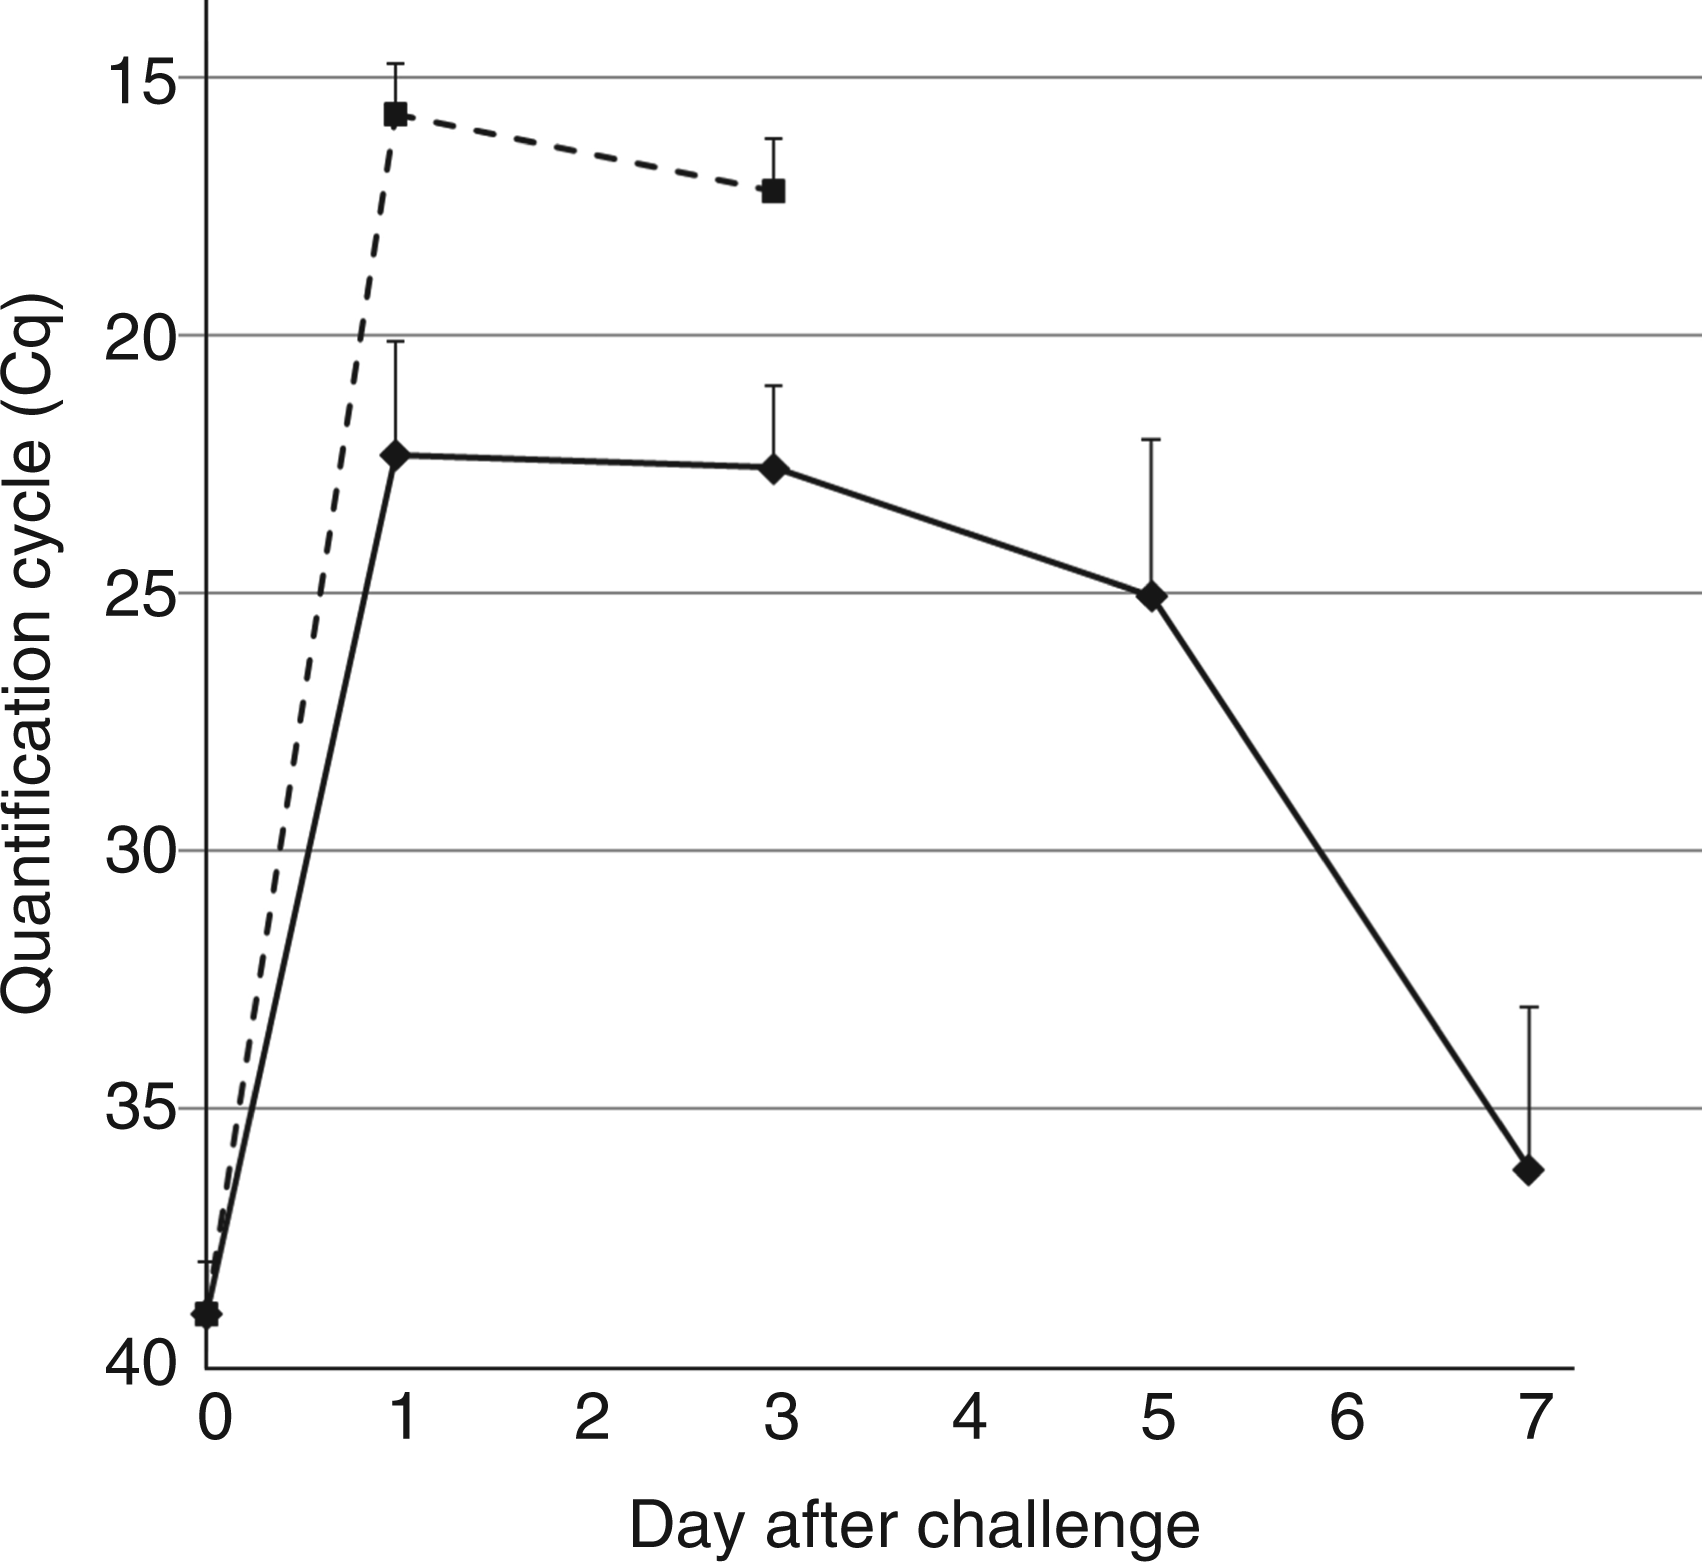
All pigs in the infected group developed typical clinical signs of influenza. For 19 out of the 20 infected animals the onset was abrupt, with fever > 40℃ (39.6℃ for 1 animal) on d 1 p.i. (Figure 1). Dyspnoea scores were found to peak at 1.5 d p.i. and then declined gradually thereafter (Figure 1). A significant correlation (Rho = 0.52, P < 0.001) was seen between rectal temperature and dyspnoea score. To further evaluate the influenza A virus infection in the animals, virus excretion was measured by analysis of nasal swab samples. Virus load in nasal swabs collected before and on d 1, 3, 5, 7 and 14 after challenge of infected animals was found to peak between d 1 and 3 p.i., and to decrease substantially between d 5 and 7 p.i. (Figure 2). No influenza virus was detected in nasal swabs at d 14 p.i. The same overall pattern were seen in virus quantified in lung tissue at d 1 and d 3; however, more viral RNA was detected in lung samples compared to nasal swabs (Figure 2). There was a high correlation between virus load and dyspnoea score (mean values of the time groups) within the first 3 d (Rho = 0.97). Demarcated dark purple areas of gross lesions were seen in the apical parts of the apical, cardiac and diaphragmatic lung lobes of infected animals 3 d p.i., which decreased until 14 d p.i.; no signs of pathological changes were seen in lungs from control animals (data not shown).
Dyspnoea score (grey) and rectal temperature (black). SEM is depicted by error bars. Number of animals: n = 20 (1 d p.i.), n = 14 (all other time points). Mean relative concentration of virus in nasal swabs (solid line) and in lung tissue (dashed line) at different days after challenge. SEM is depicted by error bars. Animals tested at d 14 p.i. were negative in both nasal swab and lung tissue samples (data not included in figure). Number of animals (n) tested at d 1, 3, 5, and 14 p.i. in nasal swab samples (n = 20, n = 14, n = 8, n = 8) and at d 1, 3 and 14 in lung tissue samples (n = 6, n = 6, n = 8). Limit of detection: Cq = 39.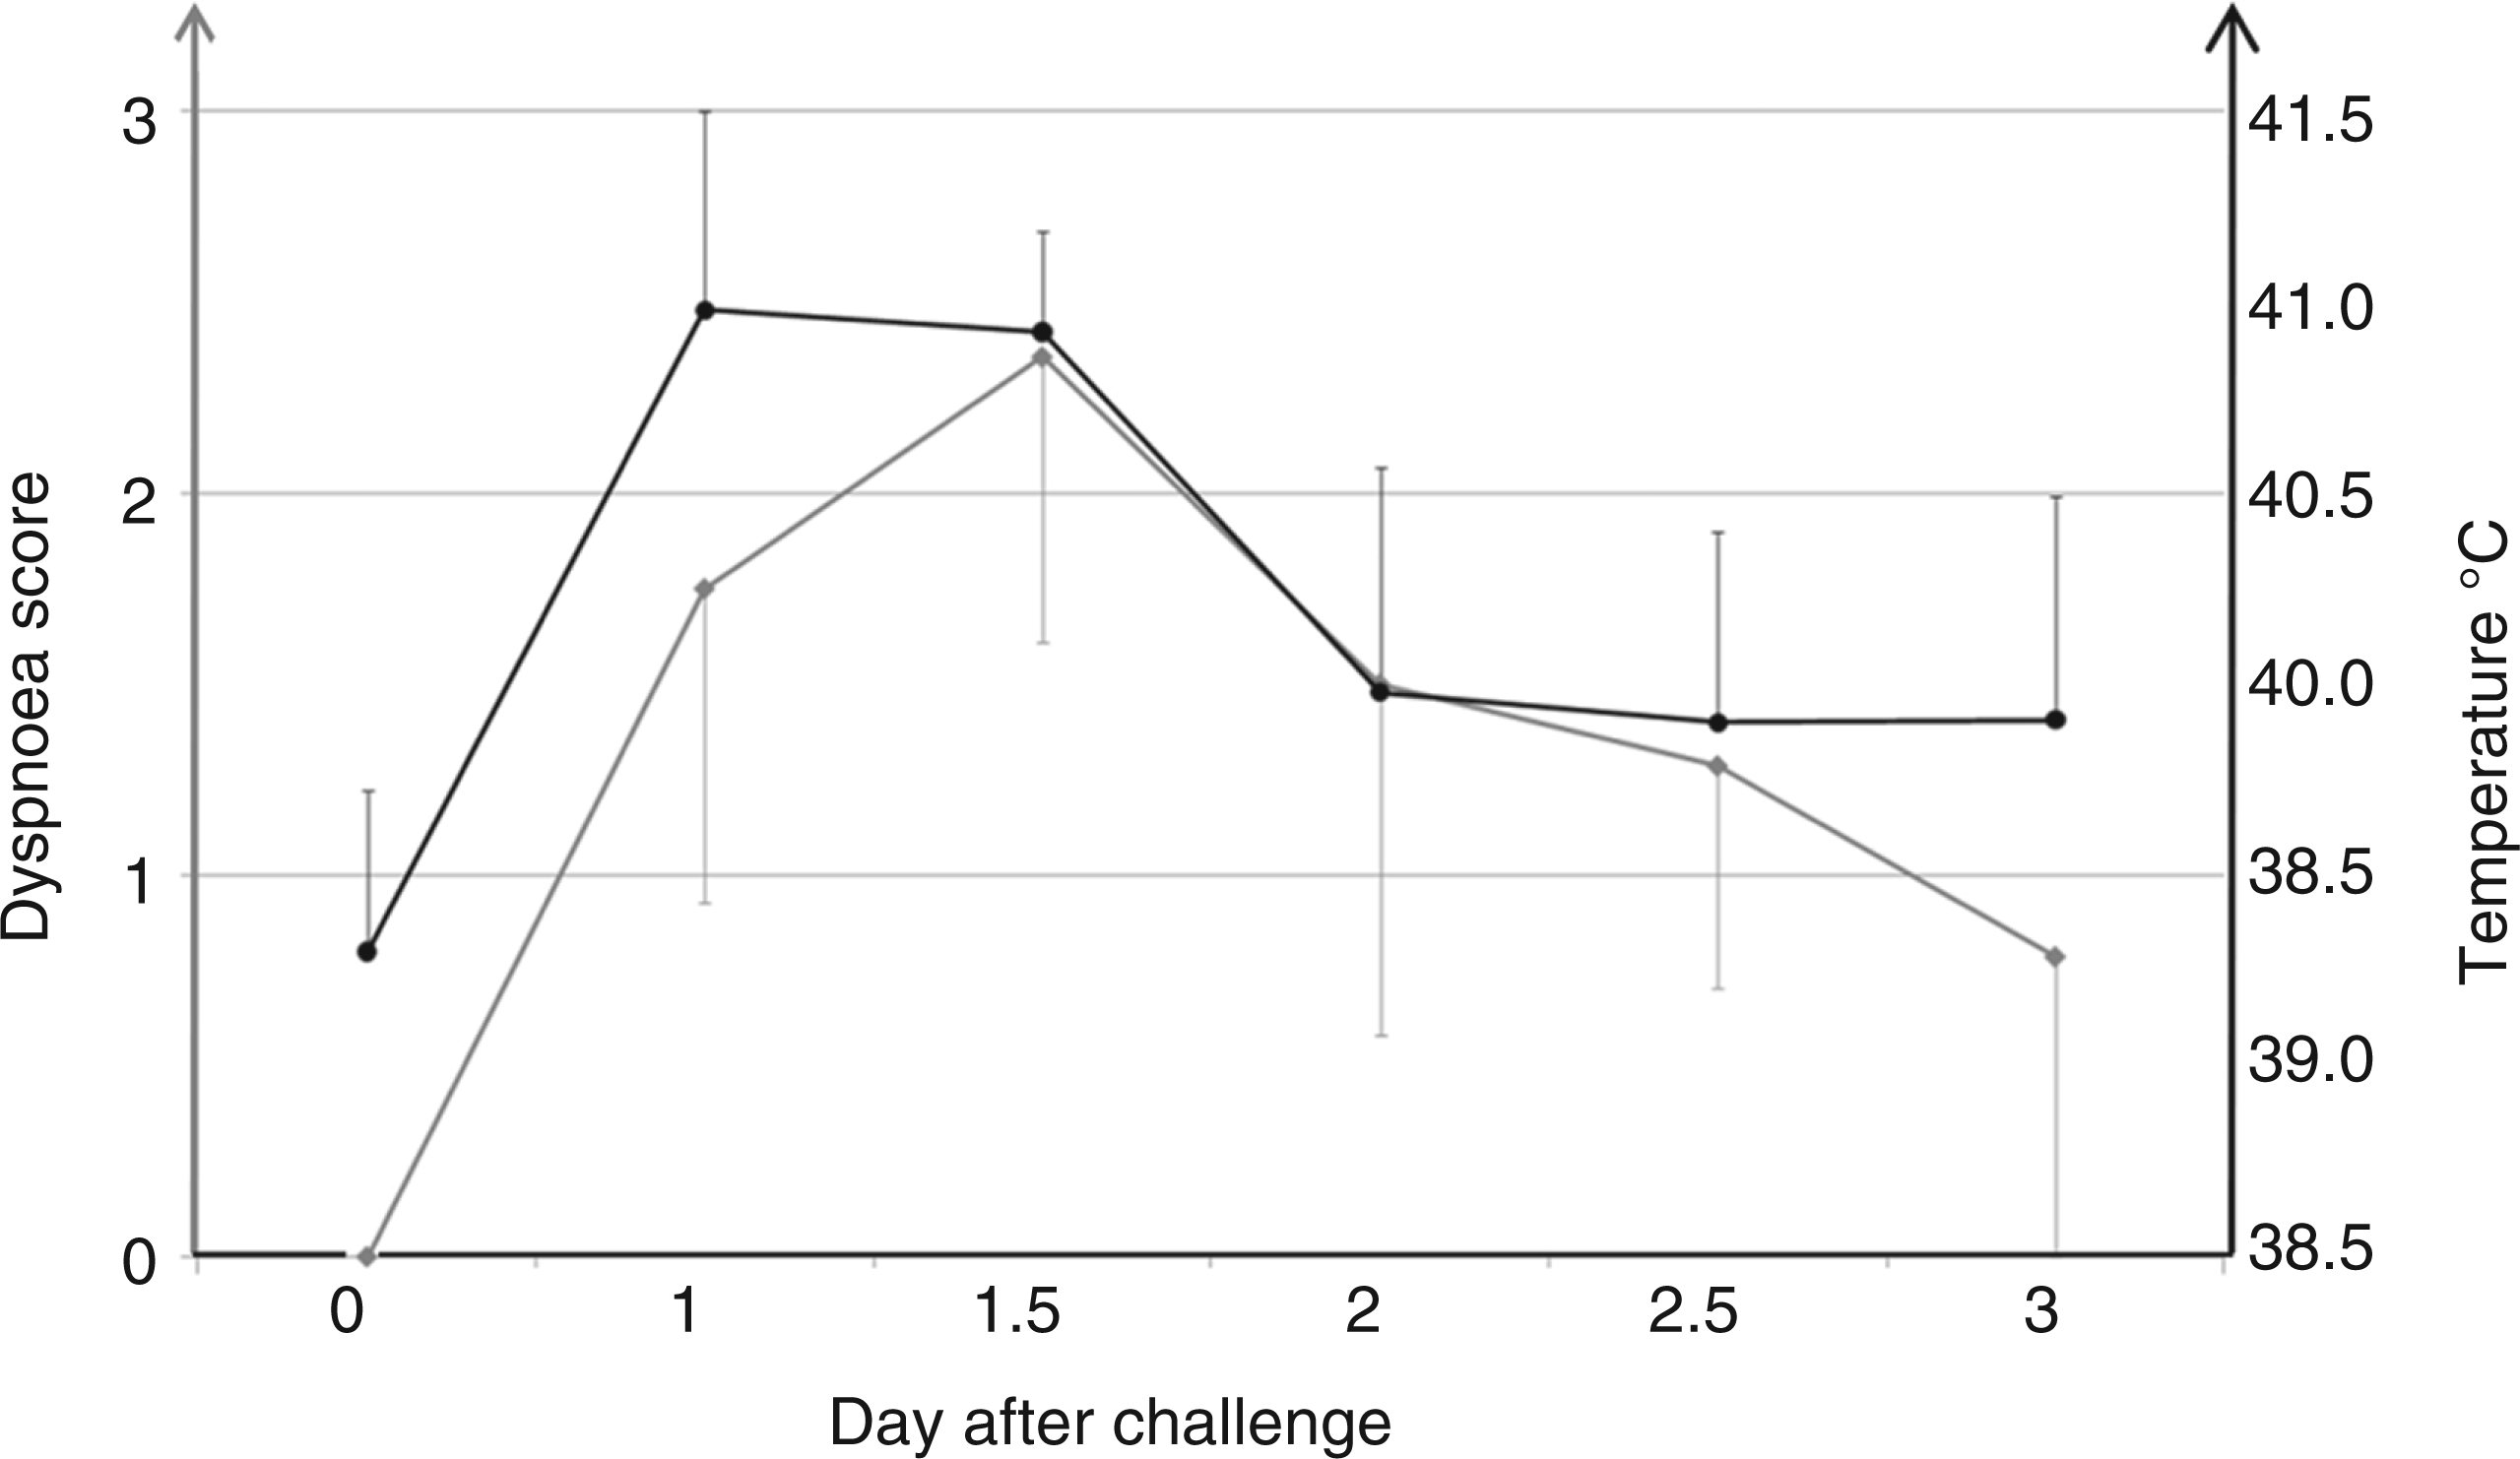
mRNA expression
Expression levels of mRNA coding for more than 60 different genes, including cytokines, chemokines, PRRs and other antiviral effector molecules, were quantified using RT-qPCR. We found several functional groups of genes to be significantly regulated according to time point and infection status (P < 0.05 and fold change > 2; see Figure 3a–d), including PRRs (TLR2, TLR3, TLR7, RIG1, MDA5), IFN and IFN-induced genes [IFN-β, IFN-γ, interferon regulatory factor (IRF) 7, signal transducer and activator of transcription 1 (STAT1), ISG15 ubiquitin-like modifier (ISG15) and 2′-5′-oligoadenylate synthetase-like (OASL)], cytokines [IL-1β, IL-6, IL-7, IL-10, IL-12 A, TNF-α, chemokine (C-C motif) ligand (CCL) CCL2, CCL3, CXCL10 and IL-1 receptor antagonist], and APPs [serum amyloid A (SAA), transferrin (TF), apolipoprotein A-I (APOA1)] (Figure 3a–d).
Gene expression visualized as mean fold change of mRNA levels relative to control samples in log2 scale. SEM is depicted by error bars. *P < 0.05, **P < 0.01, ***P < 0.001 (ANOVA). Control group (n = 5), d 1 p.i. (n = 6), d 3 p.i. (n = 6) and d 14 p.i. (n = 8). (A) Expression of PRRs and downstream signalling molecules. (B) Expression of IFNs and IFN-induced genes. (C) Expression of cytokines and chemokines. (D) Expression of acute phase proteins and mucin1 (linear scale).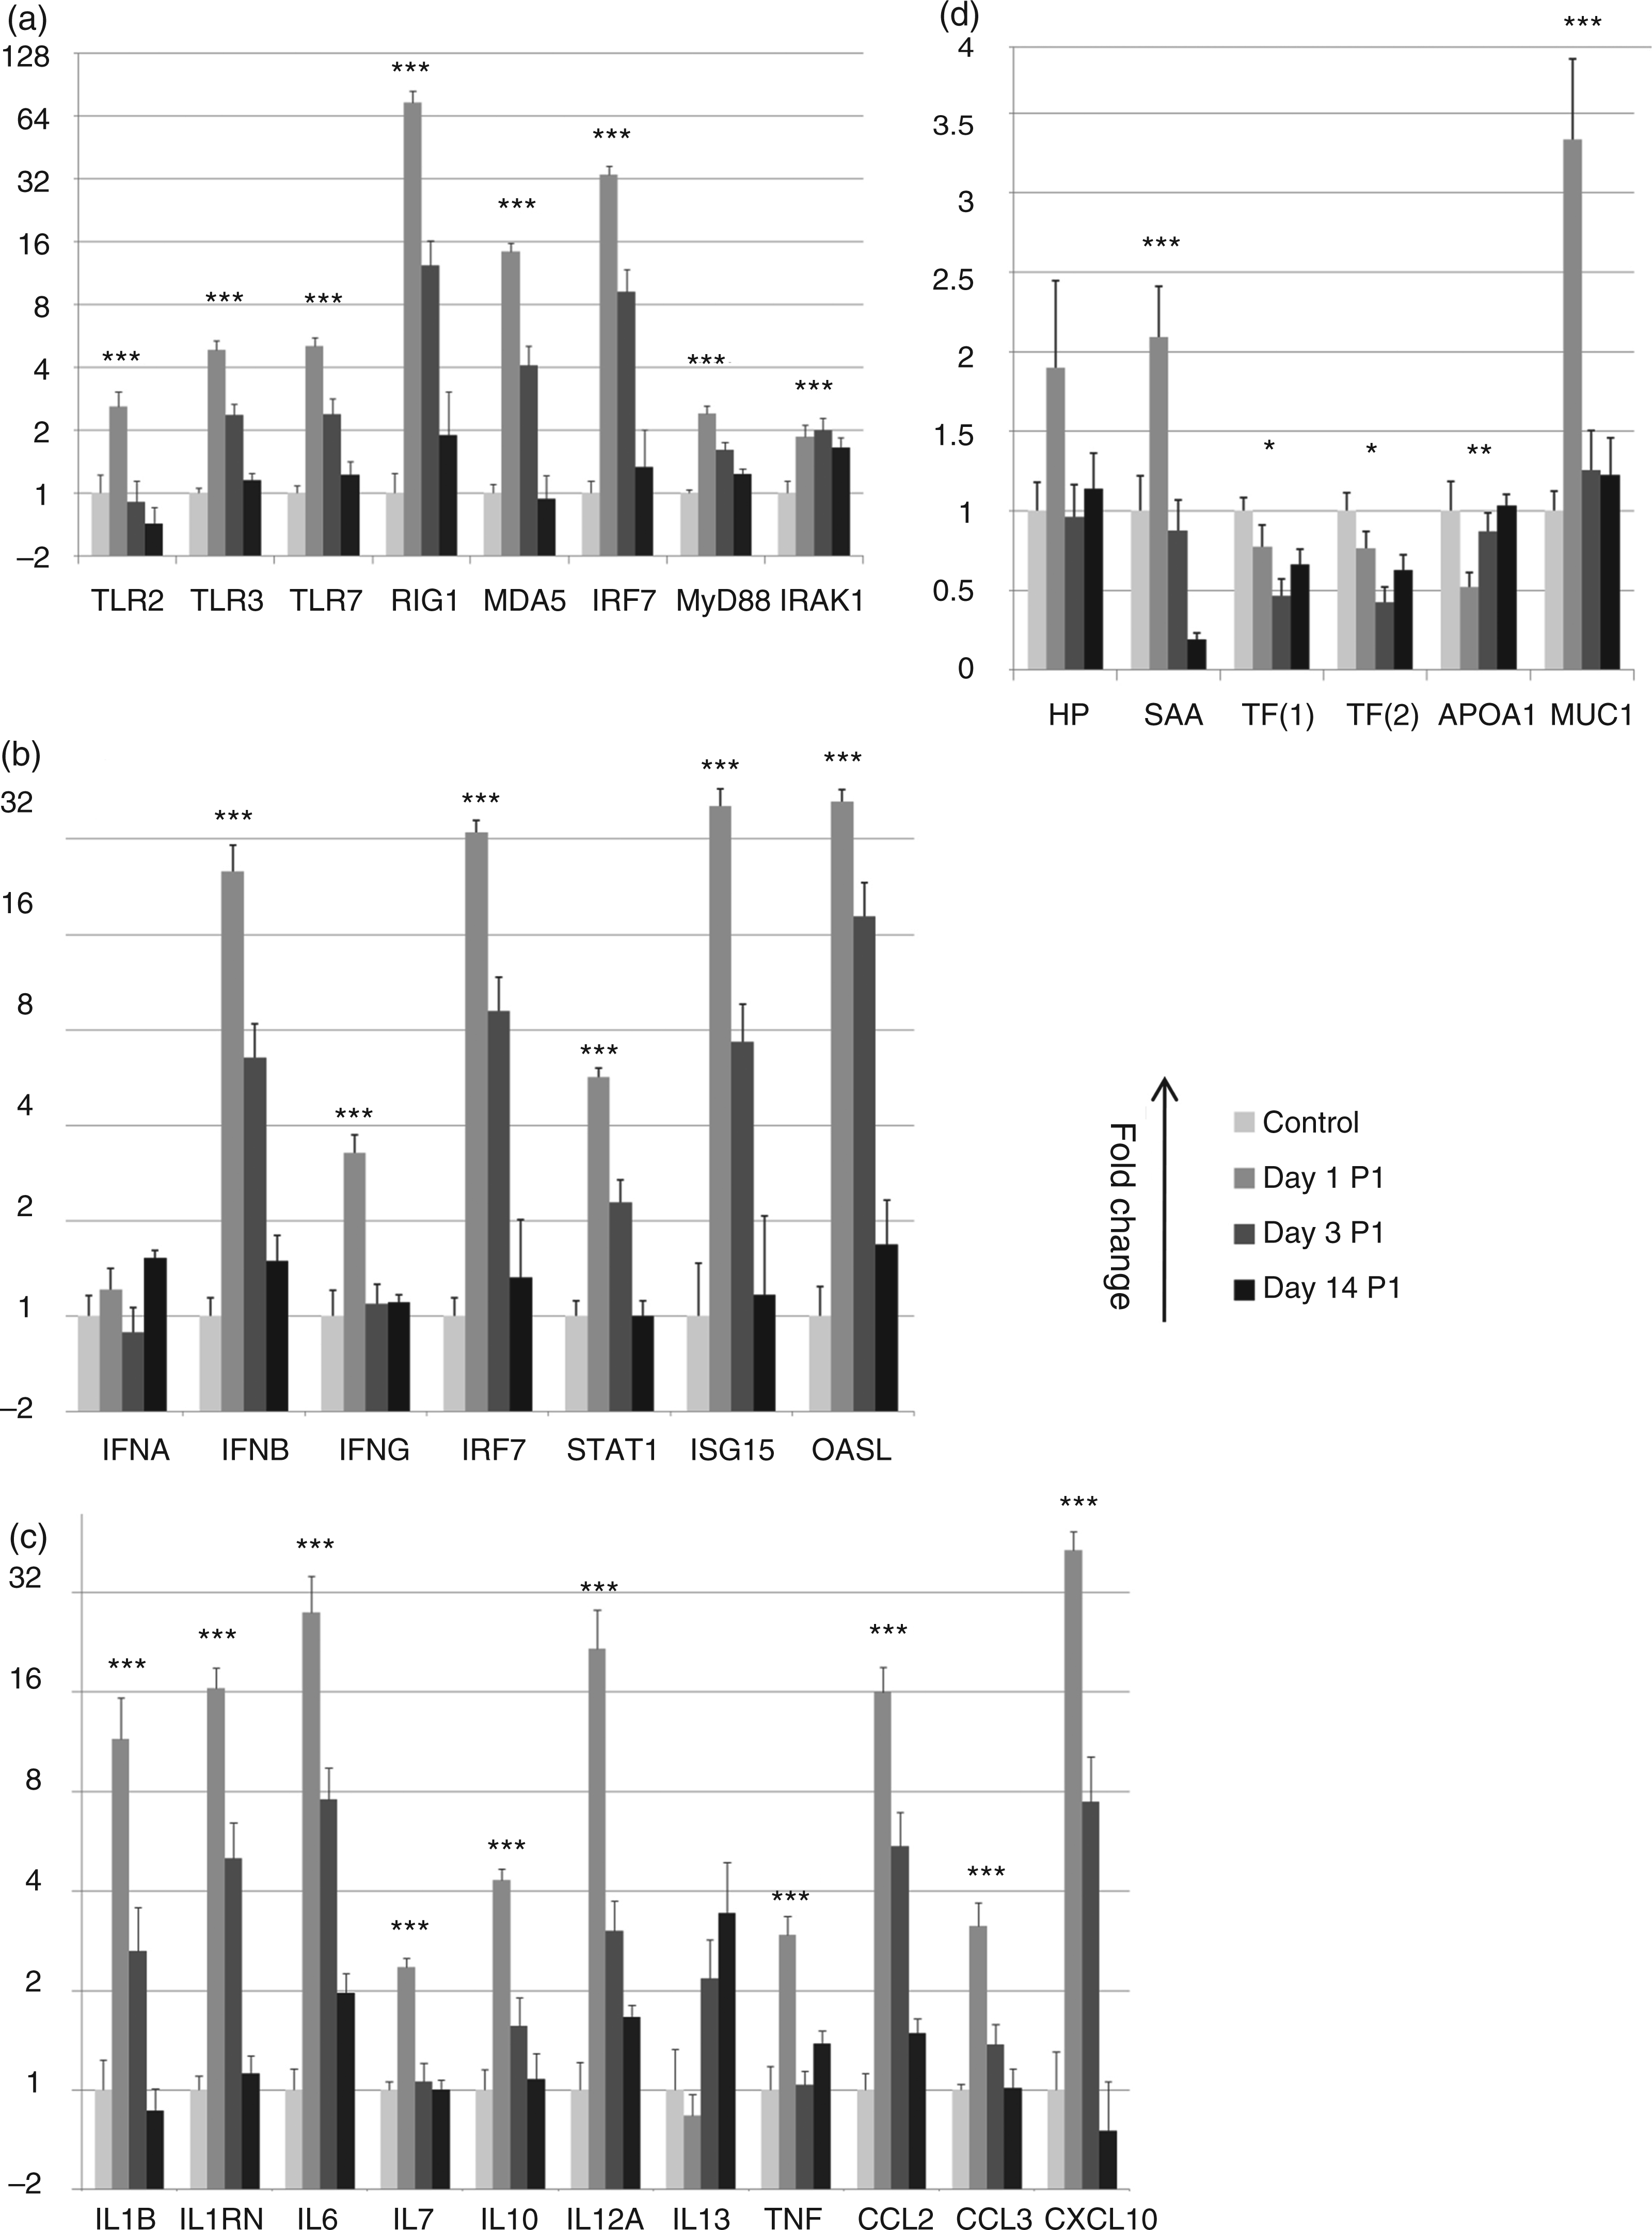
Expression of both membrane-bound and cytoplasmic PRRs was induced in a time-dependent way (Figure 3a). The two cytoplasmic PRRs, RIG1 (also known as DDX58) and MDA5, were two of the most highly induced PRRs, with RIG1 being up-regulated more than 60-fold at d 1 compared to the control pigs. This up-regulation continued until d 3 and continued at d 14 p.i. with 2-fold up-regulation of RIG1 expression. Nucleotide-binding oligomerization domain 1 (NOD1) and NLR family pyrin domain-containing 3 (NLRP3) were not regulated more than twofold at any time point (data not shown). TLR3 and TLR7, recognizing double- and single-stranded viral RNA, respectively, were significantly up-regulated at d 1 p.i. and at d 3 p.i. TLR2 was transiently up-regulated, peaking at d 1. Downstream of TLR7 we found myeloid differentiation primary response protein 88 (MyD88), IL-1 receptor-associated kinase (IRAK1) and IRF7 to be significantly up-regulated in response to influenza virus infection, whereas IRF3 was up-regulated less than twofold (data not shown). Mean expression of TLR3, TLR7, RIG1 and MDA5 at d 1, 3 and 14 p.i. was highly correlated with virus load (Rho = 0.92, P = 0.04) in nasal swabs. However, only RIG-1 and MDA5 were significantly correlated with virus load when the assessment was done based on individual animal samples rather than mean expression at the different days.
Interestingly, mRNA coding for IFN-α was found not to be regulated (Figure 3b); however, another type 1 IFN, IFN-β, was highly up-regulated a short time after infection. Both the IFN-β and the IFN-α data shown in Figure 3b represent one out of three different primer pairs amplifying different sequences of the same transcript; expression results from all three primer pairs were highly correlated (data not shown). IFN-γ was found to be transiently up-regulated. In accordance with the up-regulation of type 1 and type 2 IFN, significant up-regulation of the IFN-induced genes STAT1, ISG15, CXCL10 and OASL was detected shortly after influenza infection (Figure 3b, c).
A group of cytokine genes was strongly induced with a maximum response at d 1 p.i. (Figure 3c), which included IL-1β, IL-1RN, IL-6 and IL-12A (mainly pro-inflammatory cytokines), as well as the chemokine genes CCL2 and CXCL10. Another group of genes, namely IL-7, IL-10, TNF-α and CCL3, showed the same response; however, the response was more moderate. Remarkably, both IL-7 and TNF-α displayed relatively short lived responses, and fully returned to the levels of the controls at d 3 p.i. Both IL-1α and CXCL8/IL-8 showed a unique response with a moderate decrease of less than twofold at d 3 p.i. (data not shown). Finally, IL-13 showed a remarkably late response peaking at d 14 p.i. (P = 0.09).
Local expression of several APPs (Figure 3d) was found in the lungs of influenza-infected and control pigs. mRNA coding for SAA and Hp were up-regulated at d 1 p.i., whereas the two negative APPs APOA1 and TF were significantly down-regulated at d 1 and d 3 respectively. Expression data with the use of two different primer pairs of TF were found to be highly correlated (Rho = 0.98). The mRNA coding for CRP could not be quantified as this primer assay did not meet the quality criteria described in the Material and methods. Surprisingly, the positive APP SAA was found to be significantly down-regulated in lung samples of all 8 animals at d 14 p.i. Transcript coding for the antimicrobial protein mucin 1 (MUC1) was found to be up-regulated, whereas the surfactant proteins SFTPA1 and SFTPD were not affected (data not shown).
miRNA expression
We found the following miRNAs to be significantly regulated at one or more time point groups compared with the control pigs: miR-15a, miR-146, miR-206, miR-223 and miR-451 (Figure 4). Further up-regulation of miR-21 at d 3 was found to be borderline significant based on the miScript data (P = 0.055), but significant based on the Balcells method (P = 0.003) (see Materials and methods). The response patterns varied widely, with miR-15a being significantly increased at all time points, including d 14 p.i., miR-21, miR-206 and miR-451 showing late responses (d 3, 14 and 14 as maximum response respectively) and miR-223 showing a transient d 1 p.i. response. The down-regulation of miR-146 was also transient, peaking on d 1 p.i.
Gene expression visualized as mean fold change of miRNA levels relative to control samples in linear scale. SEM is depicted by error bars. *P < 0.05, **P < 0.01, ***P < 0.001 (t-test). (**) P < 0.01 based on the Balcells RT-qPCR method. Control group (n = 5), d 1 p.i. (n = 6), d 3 p.i. (n = 6) and d 14 p.i. (n = 8). Genes below the line are mRNA transcripts studied and predicted to be targeted by the above miRNA; bold are targets predicted by more than one of the prediction algorithms used.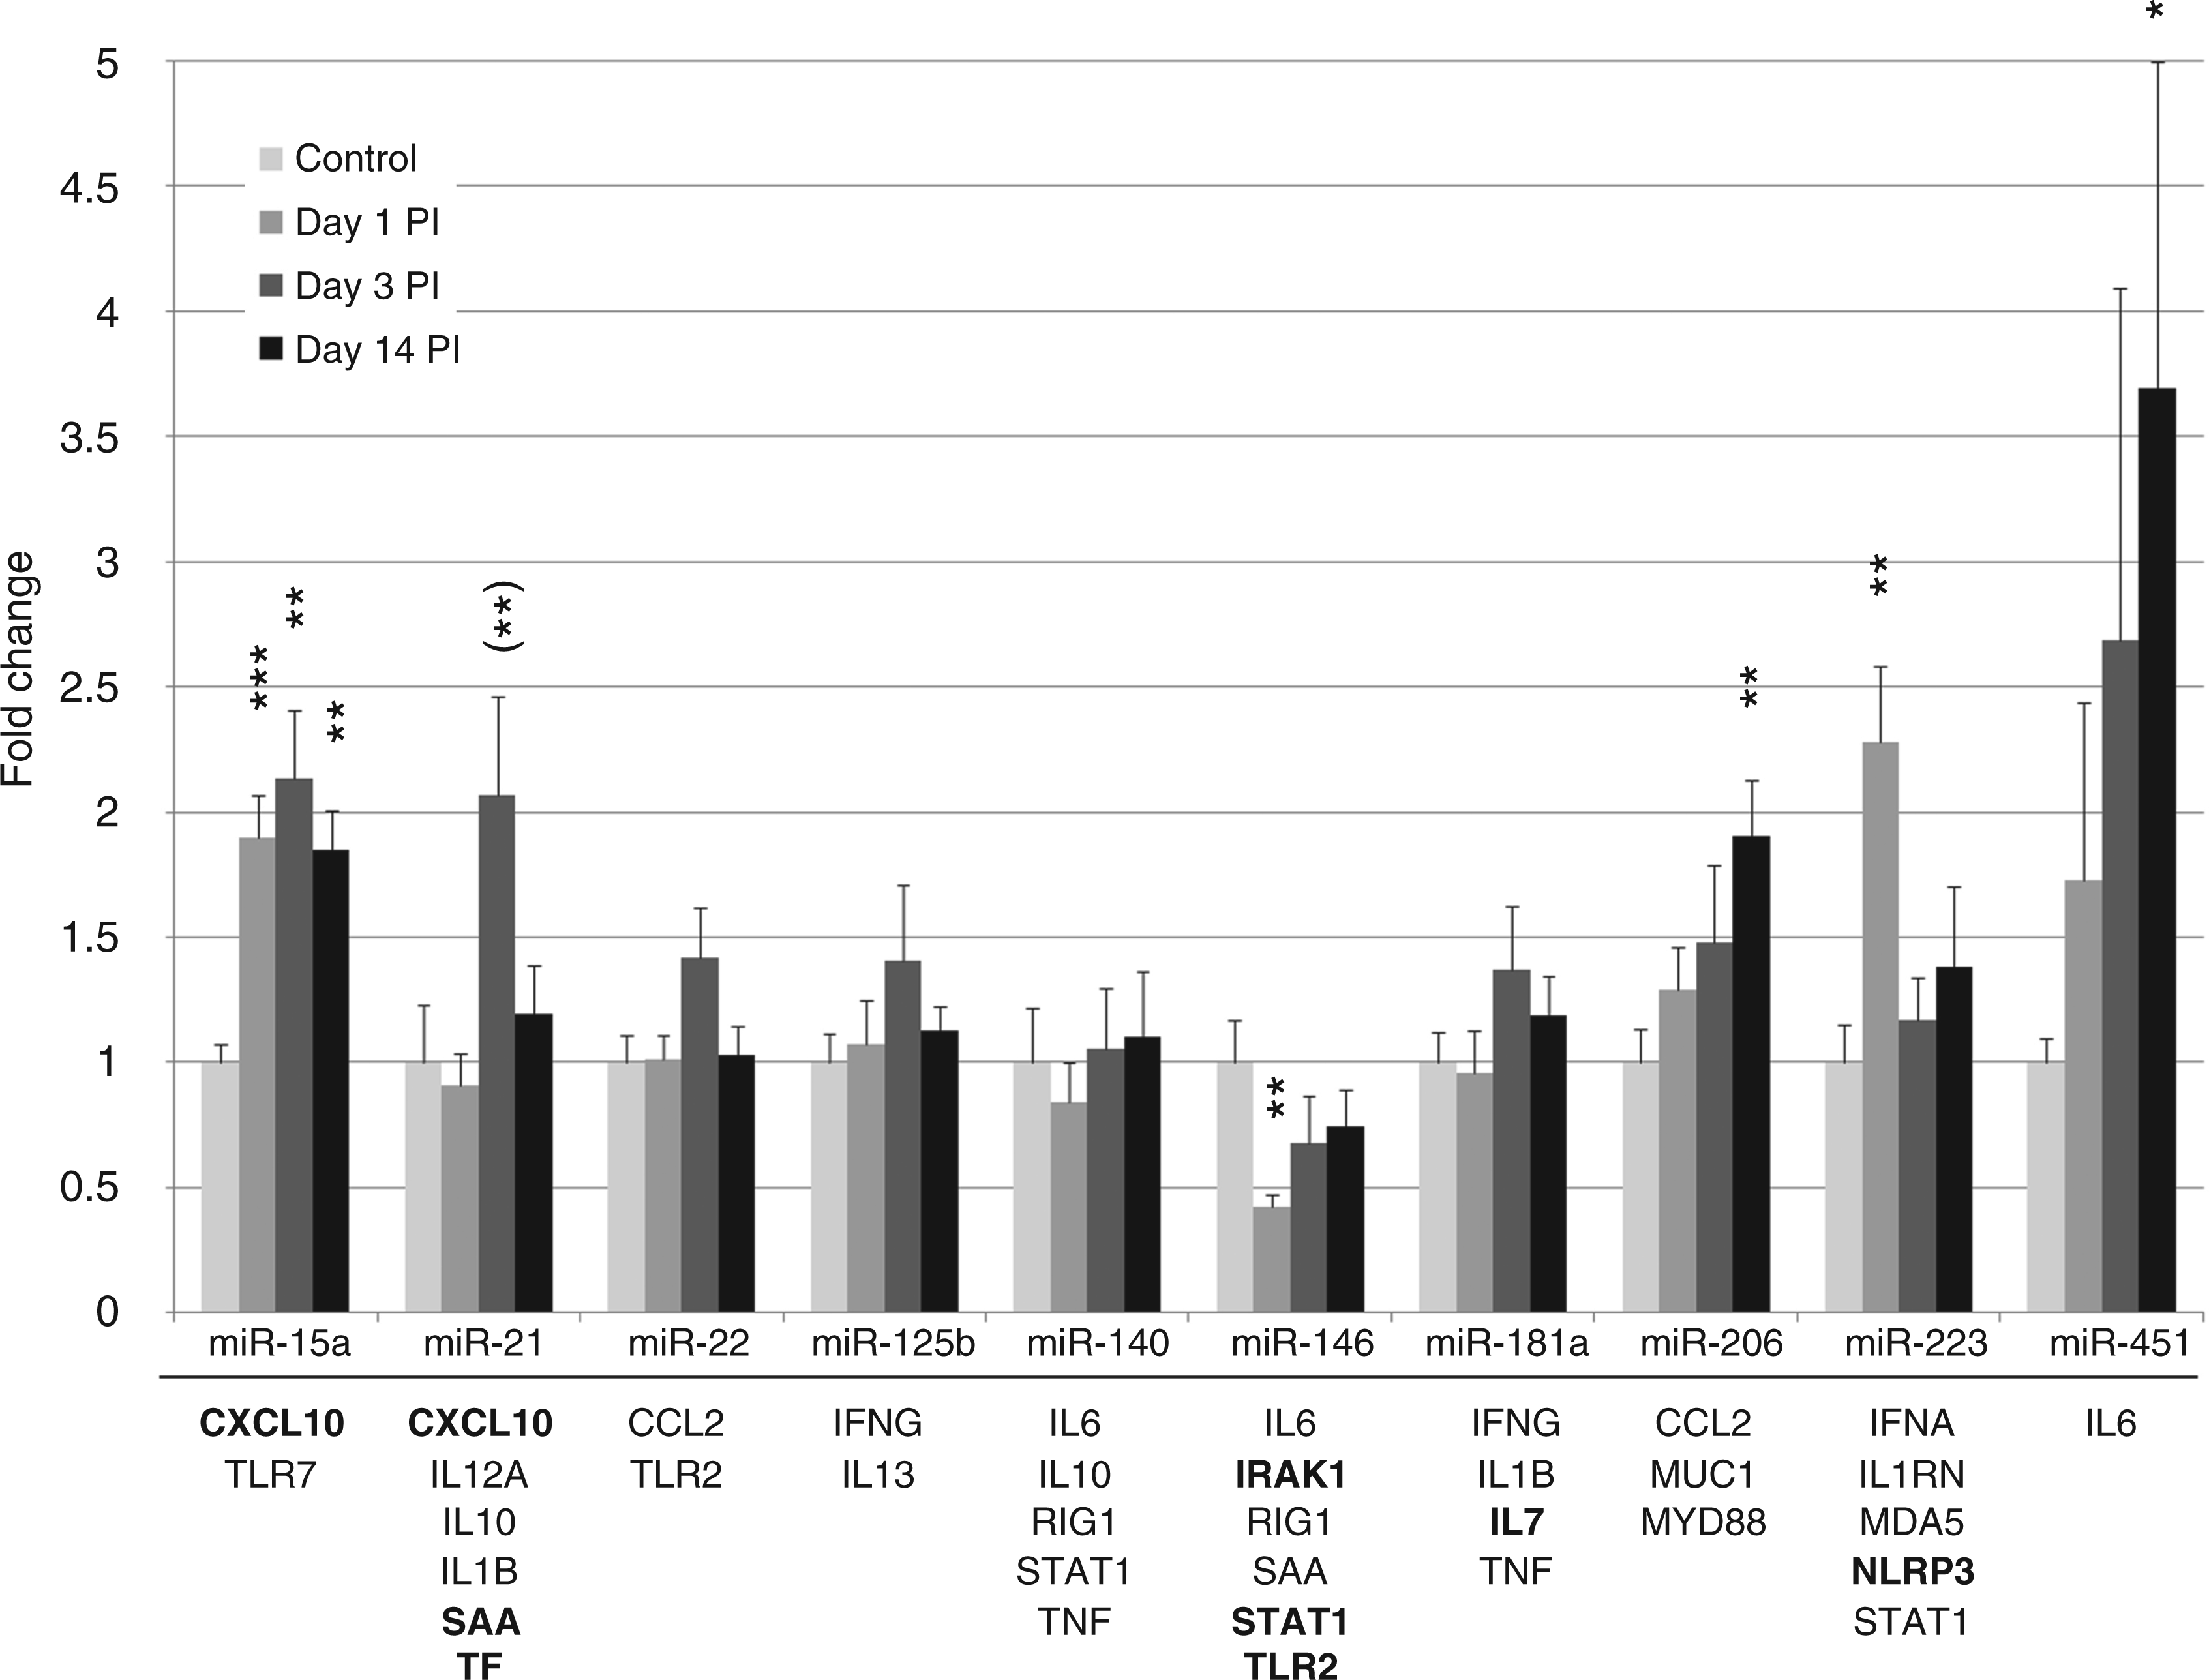
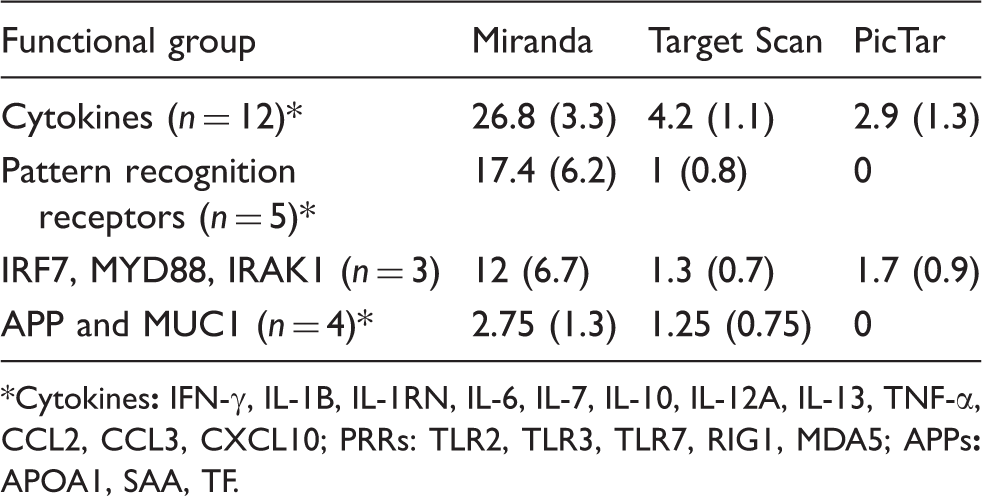
Mean number of miRNA target sites per gene in each functional group. All genes included in this table were regulated in response to swine influenza virus infection (SEM in brackets).
Cytokines
Protein concentrations in lung tissue
Protein analysis was performed on the same tissue as subjected to expression analysis of mRNA and miRNA. Lung tissue concentration of IFN-α, IL-1β, IL-6, IL-12A, HP and CRP in pigs slaughtered at 1, 3 and 14 d p.i. can be seen in Figure 5. Several samples from the control group, as well as from the 14 d p.i. pigs, were below the limit of detection. At d 1 p.i. protein levels of the pro-inflammatory cytokines IL-6, IL-12A and IFN-α were significantly increased compared with the control group; likewise, HP and CRP were significantly increased at d 3 p.i., reflecting an early pro-inflammatory cytokine response followed by a later expression of APPs in diseased animals (Figure 5). Strong correlation was found between IL-6 and IL-12 protein data and the mRNA expression data from the same cytokines. The correlation between IL-1β and HP mRNA and protein was more moderate (but significant), possibly as a result of the missing protein concentration data in samples below the limit of detection. No correlation was seen for the IFN-α protein and mRNA data (see Supplementary Table S4).
Scatter plots of protein levels in lung tissue. Mean is plotted as horizontal bar, *P < 0.05, **P < 0.01.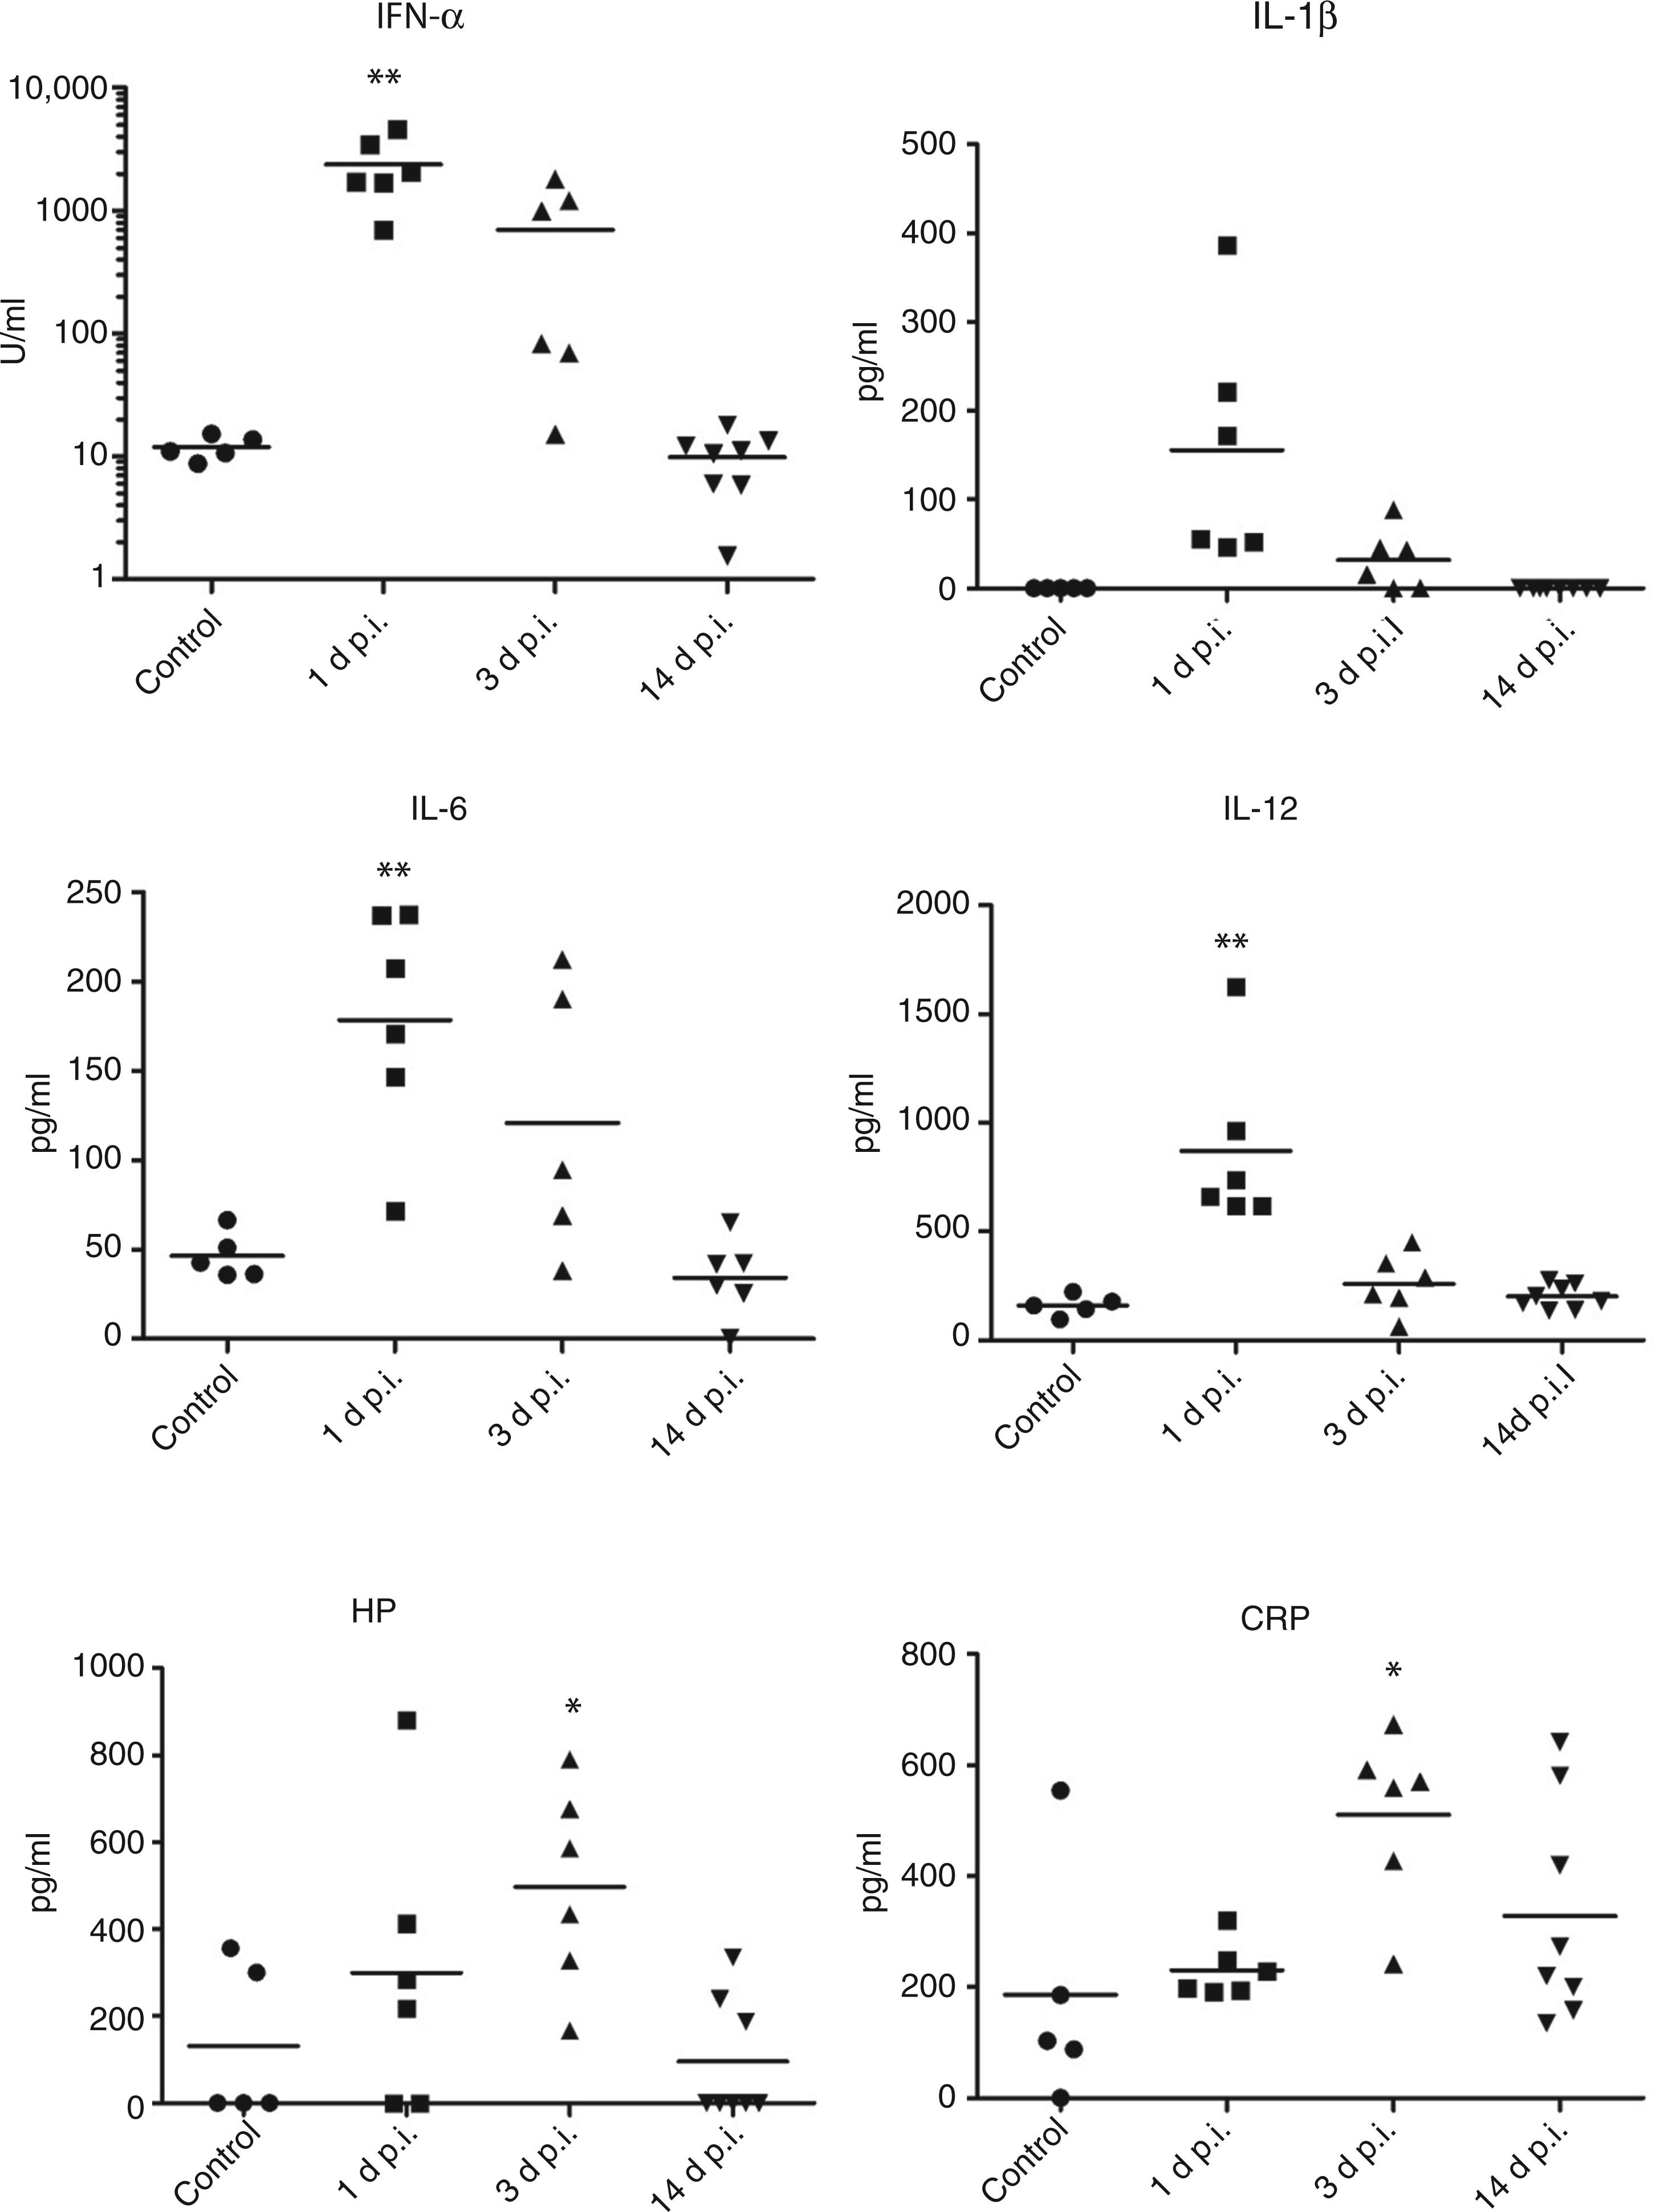
Discussion
The influenza virus-infected pig has been proposed as a model for human influenza, 16 as pigs are fully susceptible to human influenza strains, and as the pig has been demonstrated to be involved in influenza evolution and ecology.4,53,54 In the present investigation the development of the dyspnoea score in pigs after experimental H1N2 infection resembled symptom scores in human volunteers infected experimentally with H1N1. 12 Likewise, viral loads were found to peak between d 1 and 3 p. i., as has also been shown in humans, 12 confirming the pig as a promising animal model for human influenza.
We studied the expression of PRRs, cytokines, APPs and miRNAs involved in the host response to H1N2 influenza infection. The invading influenza virus is sensed initially by several types of PRRs found on the surface or within cells of the respiratory system.18,19 Here, the expression of classical virus-specific endosomal TLR3 and 7 was significantly increased at d 1 p.i. Interestingly, TLR8, which shares ligand specificities and cellular location with TLR7 and TLR3, was not induced significantly at any of the time points investigated. The plasma membrane-located TLR2, classically activated by Gram-positive bacterial ligands was induced moderately by the swine influenza virus infection at d 1 p.i. This confirms earlier observations that TLR2 may be activated in an endosomal-dependent fashion,55,56 leading to an antiviral IFN type I response.
Transcripts coding for the two cytoplasmic PRRs RIG1 and MDA5 were more up-regulated compared with the TLRs at d 1 p.i. This might, to some degree, reflect the cell type composition of the sampled lung tissue, as RIG1 is expressed by a wide variety of cell types, whereas TLR7 is expressed by a more limited range of cell types, namely plasmacytoid DC and macrophages. 57 Another cytoplasmic PRR, NOD1, was not induced (data not shown). This complies well with the known specificity of NOD1 for bacterial molecular structures and the specificity of RIG1 and MDA5 for dsRNA, produced upon replication of RNA viruses. The direct induction of classical bacterium-specific PRRs by swine influenza virus in pig lung tissue, as seen here for TLR2, but not for NOD1, may contribute to the hyper-responsiveness towards bacterial infections frequently occurring secondarily to viral infections. 58 The correlation established between virus load and mRNA levels of RIG1 and MDA5 in the lung tissue of each animal support the importance of these PRRs in recognition of H1N2 influenza virus in swine.
TLR7 activates the signalling pathway via MyD88, resulting in the activation of IRF7. Accordingly, we found both MyD88 and IRF7 to be significantly up-regulated, whereas IRF3 was only weakly up-regulated (not shown). This might suggest that the TLR7/MyD88 pathway predominates in the activation of intracellular signal cascades, leading to secretion of type I IFN and pro-inflammatory cytokines upon influenza infection in swine. In a recent study, Wang et al. 25 found RIG1 and MD5A expression to peak at 4 h p.i. and TLR3 and TLR7 to peak at 24 h p.i. in H1N1-infected human alveolar macrophages. We were not able to differentiate between early and late PRRs, possibly owing to the lack of porcine lung tissue sampled at time points earlier than 24 h p.i.
Remarkably, expression of mRNA coding for IFN- α was not increased at any of the time points investigated. The lack of regulation was surprising as (i) IFN-α is a central type I antiviral cytokine, (ii) IFN-α was found to be strongly induced at the protein level in lung tissue (see below), (iii) another type I IFN (IFN-β) was strongly induced and (iv) several IFN-stimulated genes (ISGs) were, indeed, induced (IRF7, STAT1, ISG15, OASL, CXCL10). However, previous data indicate that type I IFN gene induction may be very cell-type specific although still capable of a full-blown induction of systemic type I IFN activity.59,60 Another possibility is that the IFN-α gene is very transiently induced and has simply returned to baseline expression at d 1 p.i. as described after CpG oligodeoxynucleic acid stimulation of porcine blood mononuclear cells by Sorensen et al. 43 for porcine IFN-α in cell culture. Type I IFNs (IFN-α and IFN-β) act by activating NK cells and by inducing expression of ISGs.57,61,62 Accordingly, Sadler and Williams 63 found several ISGs to be up-regulated during influenza infection in pigs. ISG15 and OASL, also found to be up-regulated in the present study, are well known inducers of antiviral activity. Similarly, CXCL10, another highly up-regulated ISG in the present study, is a potent chemoattractant of NK cells.64,65 Interestingly, at the protein level, IFN-α was significantly and dramatically (around 100-fold) increased in the lung tissue of infected pigs at d 1 p.i., followed by normalization at d 3 p.i. The same pattern was seen for IL-1β, IL-6 and IL-12A proteins, although the increases were much smaller.
We found an early and substantial increase of mRNA levels of IL-1β, IL-6, IL-12A, TNF-α, CCL2, CCL3 and CXCL10. This is in accordance with other influenza studies in pigs1,2,21,36 and in humans.25,66–71 IL-13, a known inducer of alternatively activated macrophages (AAM), was expressed at its highest level at day 14 p.i. Changes in the composition of immune cells several weeks after viral infection, leading to increased susceptibility to secondary bacterial infections, have been reported.58,72 In mice, AAM have been proposed to contribute to hyper-susceptibility to secondary bacterial infection. 73
Many of the up-regulated genes are well known pro-inflammatory cytokines, strongly involved in local inflammation and in induction of the systematic acute phase response. Even though these pro-inflammatory cytokines and chemokines are pivotal in controlling the viral infection and in shaping the adaptive immune response, excessive production by an overexcited innate immune system might, indeed, exacerbate the infection.24,25,74,75 Several chemokines—CCL2 (NK cells and macrophages), CCL3 (macrophages) and CXCL10 (NK cells)—were highly up-regulated. A massive influx of NK cells and macrophages into the diseased lung leads to secondary waves of pro-inflammatory cytokines and increased immunopathology due to nitric oxide mediated cytotoxicity. 76
To our knowledge, regulation of miRNA expression has not previously been investigated in influenza virus-infected pigs, although a single publication, strictly based on in silico analysis, suggests the presence of swine-encoded miRNA that targets the influenza virus. 77 Recent studies in mice, 27 in macaques, 35 in chickens33,34 and in the human alveolar cell line A549 78 imply miRNA to be centrally involved in influenza infection. Here, we studied the relative levels of 10 miRNAs previously reported to play a part in the immune response to viral infection.34,35,78 Furthermore, in silico analysis of possible inflammatory cytokine–miRNA connections was performed.
Although miRNA changes were small (below 3.5-fold) compared with PRRs and cytokines, significant changes were observed for 6 of the 10 miRNAs studied, with miR-146 being down-regulated and the others being up-regulated following different kinetics. Of the 5 up-regulated miRNAs, miR-21 and miR-223 have also been described as being up-regulated in lung tissue of both macaques and mice within 5 d of influenza virus infection. 35 In addition, miR-21 has previously been associated with lung inflammation of mice. 79 Both miR-15a and miR-21 were predicted to target CXCL10, which could suggest that these miRNAs are involved in the down-regulation of CXCL10 from d 1 to d 14 p.i.
A twofold down-regulation of miR-146 was seen at d 1 p.i., followed by a return to normal levels at d 3 and 14 p.i. Six target genes putatively regulated by this miRNA were all increased at d 1 p.i. and, with the exception of IRAK1, much less increased at d 3 p.i. This suggests that miR-146 might be involved in down-regulating transcription of these target genes in the normal, non-infected pig lung. In contrast, miR-15a was increased at all time points after infection; however, both of its target genes were also increased (moderately for TLR7 and strongly for CXCL10). This indicates that miR-15a may not be involved in the observed regulation of TLR7 and CXCL10 mRNA levels, or that this miRNA acts through repression of mRNA translation to protein, although we have no data to support this notion. In addition, concurrent up-regulation of miRNA and its target mRNA may also occur in order to control critically high levels of the mRNA. As all targets predicted are based on in silico analysis, future functional studies should be given high priority. Although increased with different kinetics, parallel expression was also seen for the rest of the increased miRNAs and their target genes, which were also increased, at least at d 1 p.i. Generally, the target mRNA transcripts predicted for the regulated miRNAs were associated with inflammatory responses, some of which were, indeed, confirmed as regulated in the present study. In addition, targets were predicted in receptors for IL-1, IL-6 and IL-12.
It was also investigated whether the group of regulated cytokines found in the present study might have an increased probability of being prone to miRNA regulation by containing a high number of miRNA target sequences in their mRNA transcripts. This was done by in silico target prediction and it was shown that the cytokine group had the highest number of predicted targets compared with both PRR and APP groups, using three different target prediction algorithms. This further supports the idea that miRNAs are centrally involved in the fine-tuning of a robust, but transient, innate response towards influenza infection, accomplished, to a certain extent, by regulation of pro-inflammatory cytokines and chemokines in pigs.
Finally, expression of several positive (CRP, HP, SAA) and negative (TF and APOA1) APPs and their coding transcripts was demonstrated in lung tissue of infected and control pigs. Positive APPs (HP and SAA) and MUC1 were moderately up-regulated at d 1 p.i., and negative APPs APOA1 and TF were significantly down-regulated at d 1 and 3 p.i. respectively. SAA expression was strongly down-regulated at d 14 p.i. compared with the control group, integrating data from three highly correlated different primer pairs targeting several isotypes of SAA. Studies of PRRs, cytokines and APPs weeks after viral clearance might further elucidate the involvement of late, long-term gene regulation in susceptibility to secondary infections.
At the protein level, HP and CRP were increased significantly at d 3 p.i., although changes were small. Few studies have explored the expression of APP during influenza infection; however, in two recent studies, CRP and HP were found to peak 2–3 d after infection in alveolar lavage fluid and serum of H1N1 infected pigs, 2 and CRP, HP and SAA were increased in serum of H1N2-infected pigs, 80 in accordance with the present study. Even though the liver is the major producer of APP, extra-hepatic expression has been demonstrated in several different tissues, including lung tissue in pigs experimental infected with Actinobacillus pleuropneumoniae.38,81
Conclusions
In the present study we investigated the involvement of innate host immune factors, including miRNA, in the response to experimental high-dose aerosol H1N2 infection in pigs. Our results demonstrate a significant regulation of several miRNAs, their targeted mRNA and resulting protein in the lung tissue of pigs during acute influenza infection. Future functional studies of carefully selected miRNAs are planned to reveal their role, both locally and systematically, in regulating and fine-tuning the innate immune response during influenza infection.
Footnotes
Funding
This research received no specific grant from any funding agency in the public, commercial, or not-for-profit sectors.
Acknowledgements
Karin Tarp, Henriette Vorsholt and Heidi Gertz Andersen are kindly thanked for technical assistance. Assistant researcher Fang Yong Xiang is acknowledged for his help with primer design. We also thank Associate Professor Peter Busk and post doc Shila Mortensen for assistance with miRNA primer design and collection of samples, respectively.
References
Supplementary Material
Please find the following supplemental material available below.
For Open Access articles published under a Creative Commons License, all supplemental material carries the same license as the article it is associated with.
For non-Open Access articles published, all supplemental material carries a non-exclusive license, and permission requests for re-use of supplemental material or any part of supplemental material shall be sent directly to the copyright owner as specified in the copyright notice associated with the article.