
Abstract
The purpose of this research was to study ocular surface inflammation in relation to systemic disease activity in rheumatoid arthritis (RA) patients with or without secondary Sjögren’s syndrome (SSII and non-SSII respectively). The study was conducted in two phases. In phase I, 12 patients with active RA SSII and 12 with active RA non-SSII were consecutively enrolled. Each completed an Ocular Surface Disease Index (OSDI) questionnaire and underwent a full eye exam and in vivo confocal microscopy examination of the cornea. Tear fluid samples were collected in sponges and analyzed for IL-1α, -6, and -8, and TNF-α. When RA activity was suppressed by systemic treatment the patients entered phase II of the study in which all of the phase I examinations were repeated. In RA SSII patients, OSDI, fluorescein staining dendritic cell density, and concentrations of IL-1α and IL-6 decreased significantly (P < 0.01) between phases I and II. Tear breakup time scores increased significantly. For RA non-SSII patients, there were no significant differences between phases I and II. Differences in the clinical, cellular and cytokine responsiveness to systemic RA treatments show that the ocular surface pathology is dissimilar for RA SSII and RA non-SSII patients.
Introduction
Rheumatoid arthritis (RA) is a chronic inflammatory disease of unknown etiology that involves most joints, but it also has systemic involvement. The RA course is chronic, occurring in most cases with quiescent phases alternating with relapses.1,2 The systemic disease may involve the respiratory, cardiovascular, nervous and renal systems, as well as the skin and eyes.1,3,4
Keratoconjunctivitis sicca (KCS) is the most frequent ocular complication of RA. Based upon extended diagnostic criteria, the prevalence of KCS among RA patients might be about 90%. 5 Approximately 11–31% of RA patients have secondary Sjögren’s syndrome (RA SSII), in which the most prevalent clinical sign is KCS. The pathogenic processes of the ocular surface in patients with RA, with or without SSII (RA non-SSII), and the potential correlations with the systemic inflammatory disease have been reported.5–7 The purpose of this study was to investigate the ocular surface inflammatory changes in relation to systemic disease activity in RA SSII and RA non-SSII patients.
Materials and methods
All patients in this study signed an informed consent agreement in compliance with the Italian privacy law. The patients were treated in accordance with the criteria of the Helsinki Declaration. This study was approved by the institutional review board at the Fondazione Ospedale Maggiore Policlinico, Mangiagalli e Regina Elena, IRCCS, Milan, Italy. The study was performed in two phases. In phase I, patients with active RA SSII and RA non-SSII were given clinical exams with ocular surfaces imaging by confocal microscopy, and tear samples were collected (described later). Each patient was then treated medically for RA as described later. When the RA was in remission, the patients entered Phase II of the study in which the examinations of phase I were repeated.
Phase I
Patients
Baseline anagraphical and clinical data.

Potential patients were excluded if they had lymphoma; AIDS; sarcoidosis; diabetes mellitus; dystrophies or infections of the ocular surface; systemic treatments with drugs of known corneal toxicity; local treatments with drugs for glaucoma and steroidal or non-steroidal anti-inflammatory drugs; wore contact lenses; or previous ophthalmic surgery.
Clinical examination
An accurate medical history was taken for each patient in the study and all patients completed a questionnaire for a standardized evaluation of dry eye-related symptoms (Ocular Surface Disease Index; OSDI). All patients included in the study underwent a thorough ophthalmic evaluation, including biomicroscopic examination of ocular adnexa and anterior segment, evaluation of tear breakup time (BUT), corneal surface staining with sodium fluorescein 1% collyrium and bulbar conjunctival staining with lissamine green, which was evaluated by the Collaborative Longitudinal Evaluation of Keratoconus scheme. 12 Corneal apex sensitivity was evaluated with a Cochet-Bonnet nylon thread aesthesiometer (Luneau Ophtalmologie, Chartres, France) and tear secretion was evaluated by the Schirmer test with oxybuprocaine cloridrate 0.4%. 13 Both eyes were examined in all subjects. For statistical analysis, the eye with the highest fluorescein staining score was selected. In case of equal scores for the two eyes, the discriminant criteria considered were, by order of relevance, the conjunctival staining and the Schirmer test.
Confocal microscopy
Images acquisition
All patients underwent corneal scanning laser digital confocal microscopy with the Heidelberg Retina Tomograph (HRT) II Corneal Rostock Module (Heidelberg Engineering, Dossenheim, Germany) using a scanning wavelength of 670 nm. The objective lens (Zeiss 63 × immersion) was covered by a polymethacrylate sterile cap and had a working distance of 0.0–2.0 mm. Before each examination, a drop of oxybuprocaine chlorohydrate 0.4% and an ophthalmic gel (polyacrylic gel 0.2%) were instilled separately in the conjunctival fornix. The duration of each confocal exam was between 4 and 6 min.
The examination with the confocal microscope was conducted over an area of 400 × 400 µm, approximately at the corneal apex, with the help of an accessory digital camera set perpendicularly to the lens. With the microscope in the acquisition modality ‘Section Mode’, we manually acquired frames beginning with the sub-basal plexus nerve fibers and then progressed through the anterior and posterior stroma. Image acquisition was repeated three times consecutively, from the superficial to the deep layers.
Image analysis
For statistical analysis we selected the best quality image of the sub-basal plexus from each of the three antero-posterior scans. Similarly, we selected the first good image of the anterior stroma taken after passage through the sub-basal plexus. For the posterior stroma, we selected the last good image that appeared just before the endothelium. Each confocal microscopy variable was obtained by averaging the results of the three scans.
All images were analyzed by the same masked investigator. By quantifying the cell number in a standardized region of interest (0.05 mm2), we quantified the apparent cell densities (cell/mm2) of the anterior and the posterior stroma and the density of the sub-basal dendritic cells. As described previously, we also quantified the number of activated keratocytes (hyper-reflective stromal cells), the number of the sub-basal plexus nerve fibers visible in one frame, and the tortuosity of those fibers that was graded on a scale of 0–4.14,15 We also counted the number of bead-like formations per 100 µm of nerve fiber. 7 A second independent investigator analyzed the images, quantifying the cell density in the different layers and the number of bead-like formations. These data were used to calculate the inter-observer variances.
Tear fluid collection
At least 30 min after the end of the clinical and confocal examinations, tear fluid was collected from all patients using polyurethane absorbent mini-sponges (PeleTim; VOCO, Cuxhaven, Germany). 16 The patient was asked to communicate any discomfort during the procedure. A dry mini-sponge was laid in the outer third of the lower conjunctival fornix for about 5 min. The sponge was recovered and placed in the narrow end of a truncated tip of a Gilson micropipette adapted to an Eppendorf tube and centrifuged at 4000 g for 5 min. The amount of absorbed tear fluid was quantified by weighing the sponge within the micropipette tip and the Eppendorf tube both before and after the tear collection. Tear collection was repeated two more times consecutively for each patient. All samples were collected and stored at –80℃.
Phase II
Patients and treatments
Each patient, at the rheumatologist’s indication, started RA systemic therapy soon after phase I and were treated with prednisone, starting with 1 mg/kg and adopting a tapering scheme, and methotrexate, 0.3 mg/kg/wk. The rheumatologist evaluated all patients 8 wk after phase I and then every 2 wk until remission of the RA activity, as determined by a DAS 28 < 2.6. 11 Patients were then directed to our clinic for the phase II visit. No topical drugs were allowed between the phase I and phase II visits.
Examinations
Each patient underwent an anamnestic update to verify compliance with the inclusion and exclusion criteria. Following the update, clinic examination, confocal microscopy and tear fluid collection were performed as described in phase I.
Cytokine assay
Human IL-1α, IL-6, IL-8 and TNF-α in the tear samples collected from Phases I and II were assayed in duplicate using ELISA kits (Bender MedSystems, Vienna, Austria).17,18
Statistical analysis
All data were expressed as means ± SD. The tortuosity of nerve fibers was treated as a non-parametric variable. Because in some cases the concentrations of IL-1α, IL-6, IL-8 and TNF-α may be too low to be measured, these were also treated as non-parametric variables.
The statistical analysis was conducted with commercial software (SPSS for Windows, ver. 12.0; SPSS, Chicago, IL, USA). The comparisons of RA with SSII versus RA non-SSII at phases I and II were done using the t-test for independent samples for parametric variables and the Mann–Whitney U test for non-parametric variables. Comparisons within each group of patients between phases I and II were done with the t-test for repeated measures for parametric variables and with the Wilcoxon test for non-parametric variables. The minimum criterion for tests of significance was P < 0.01.
For each variable in which we found no significant difference between phase I and phase II data, we calculated the minimum detectable difference (MDD; β = 0.80) for that variable. Correlations among variables were analyzed with Spearman’s index of linear correlation. The minimum criterion for tests of significance was P < 0.01.
Results
Phase I
We collected 44.7 ± 6.2 µl of tear fluid from RA with SSII patients and 48.4 ± 7.5 µl from RA non-SSII patients. There was no statistically significant difference between RA SSII and RA non-SSII for any of the clinical, confocal or cytokine variables.
Phase II
In phase II, we collected tears from each patient after he/she was in remission, as determined by the DAS 28 score. We collected 52.1 ± 7.3 µl of tear fluid for RA SSII patients and 45.8 ± 7.8 µl of tear fluid for RA non-SSII patients. The only variable that was significantly different between RA SSII and RA non-SSII patients was IL-1α (86.27 ± 81.69 pg/ml and 212.17 ± 118.65 pg/ml respectively; P < 0.01; Mann–Whitney test).
Phase I versus phase II
Clinical data
In RA SSII patients, OSDI and fluorescein staining were significantly decreased in phase II compared to phase I, and BUT was significantly increased (P < 0.01 for all comparisons, t-test for repeated measures).
Ocular surface clinical data: Phase I versus phase II.
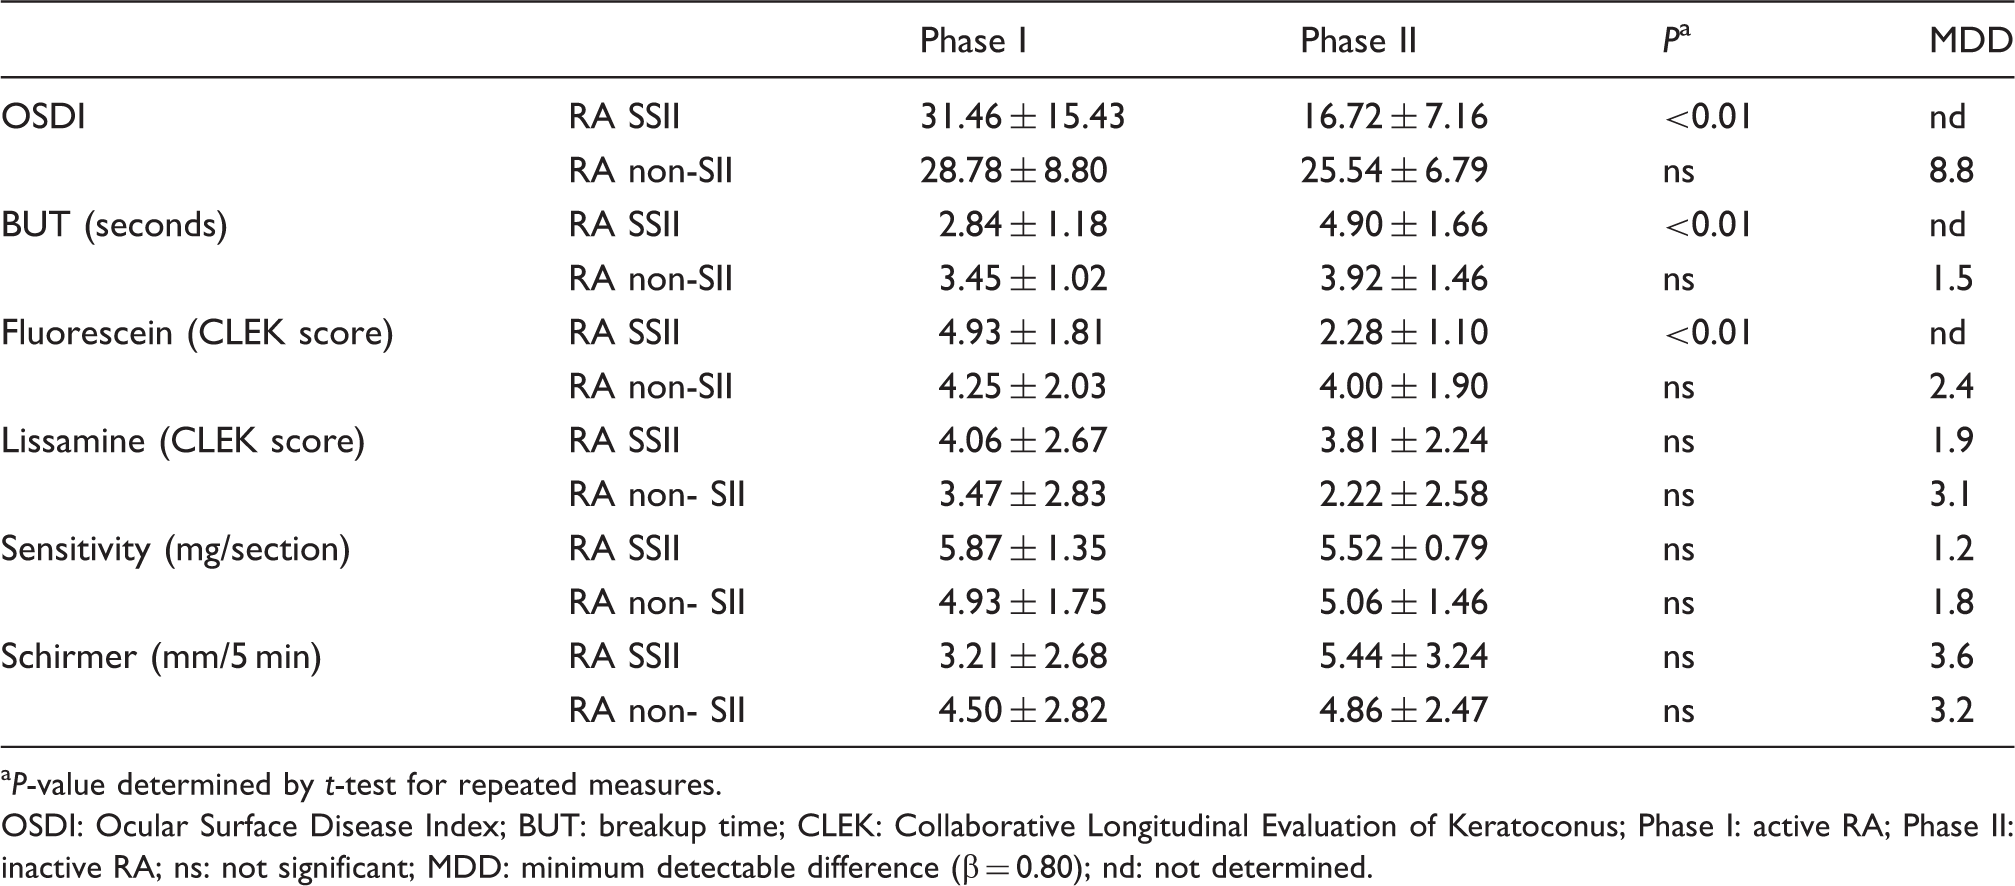
P-value determined by t-test for repeated measures.
OSDI: Ocular Surface Disease Index; BUT: breakup time; CLEK: Collaborative Longitudinal Evaluation of Keratoconus; Phase I: active RA; Phase II: inactive RA; ns: not significant; MDD: minimum detectable difference (β = 0.80); nd: not determined.
Confocal data
Confocal microscopy data: Phase I versus phase II.
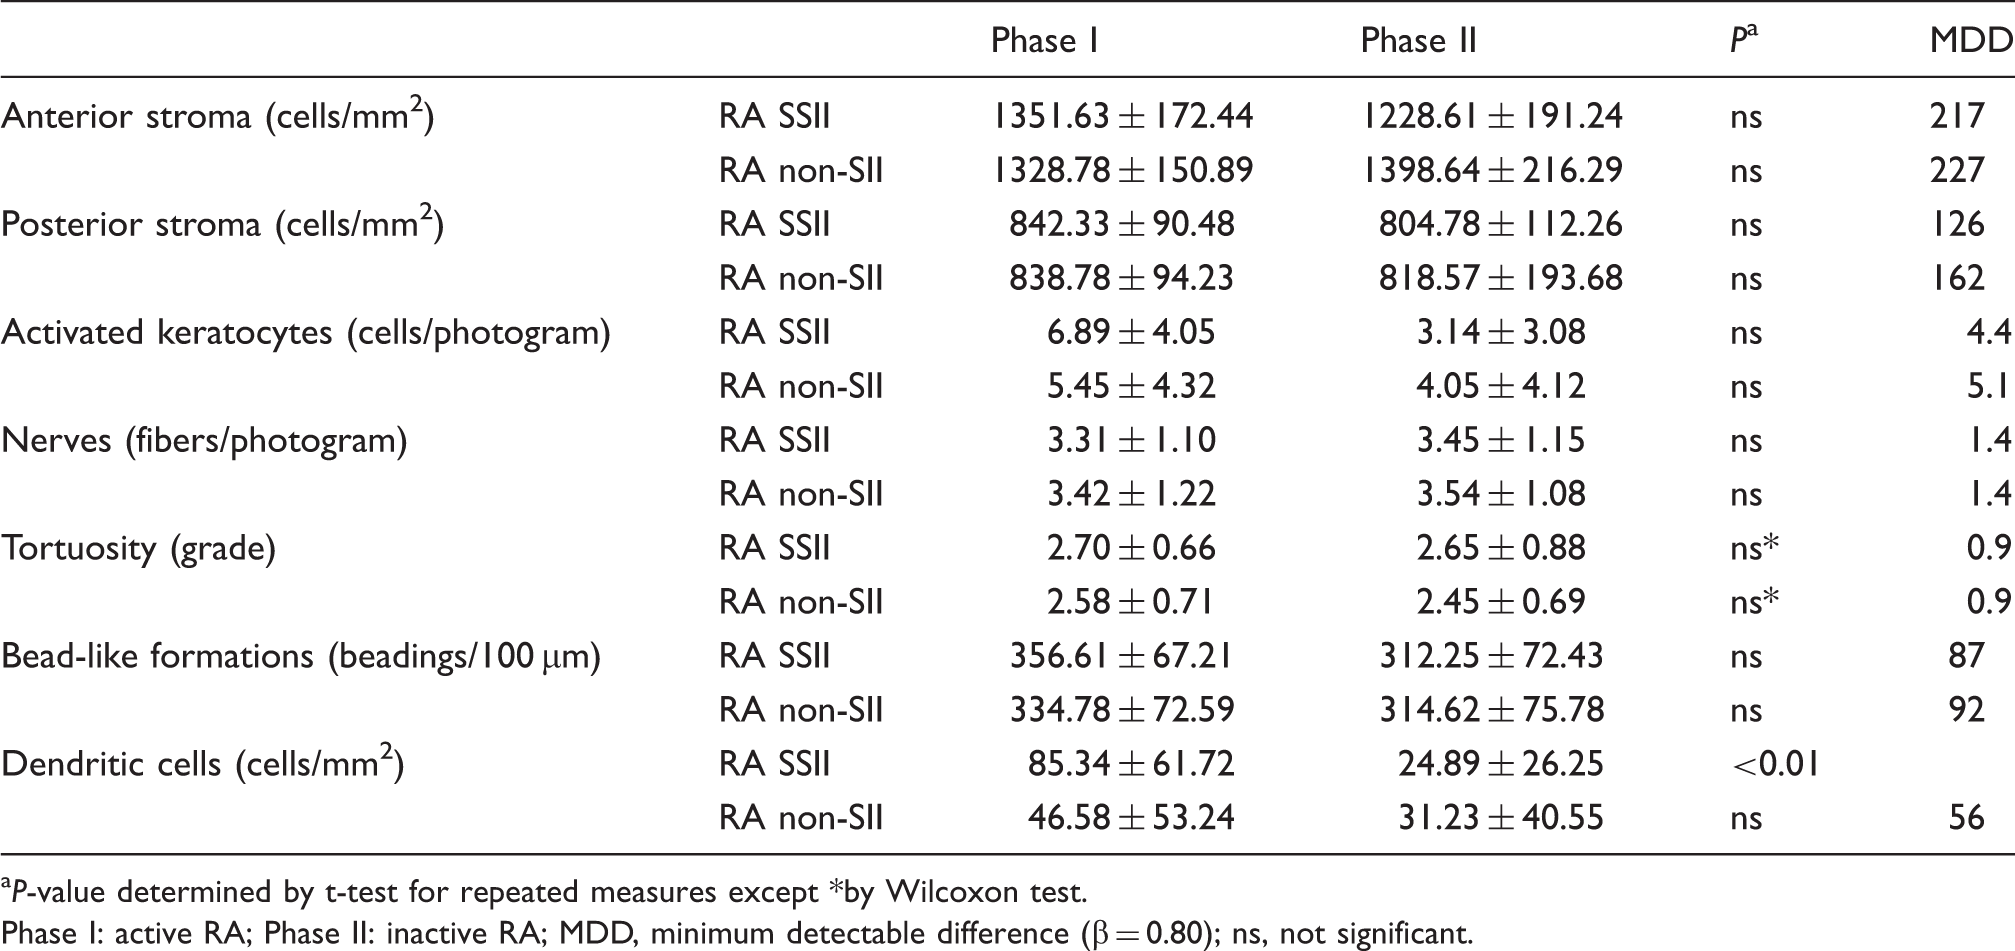
P-value determined by t-test for repeated measures except *by Wilcoxon test.
Phase I: active RA; Phase II: inactive RA; MDD, minimum detectable difference (β = 0.80); ns, not significant.
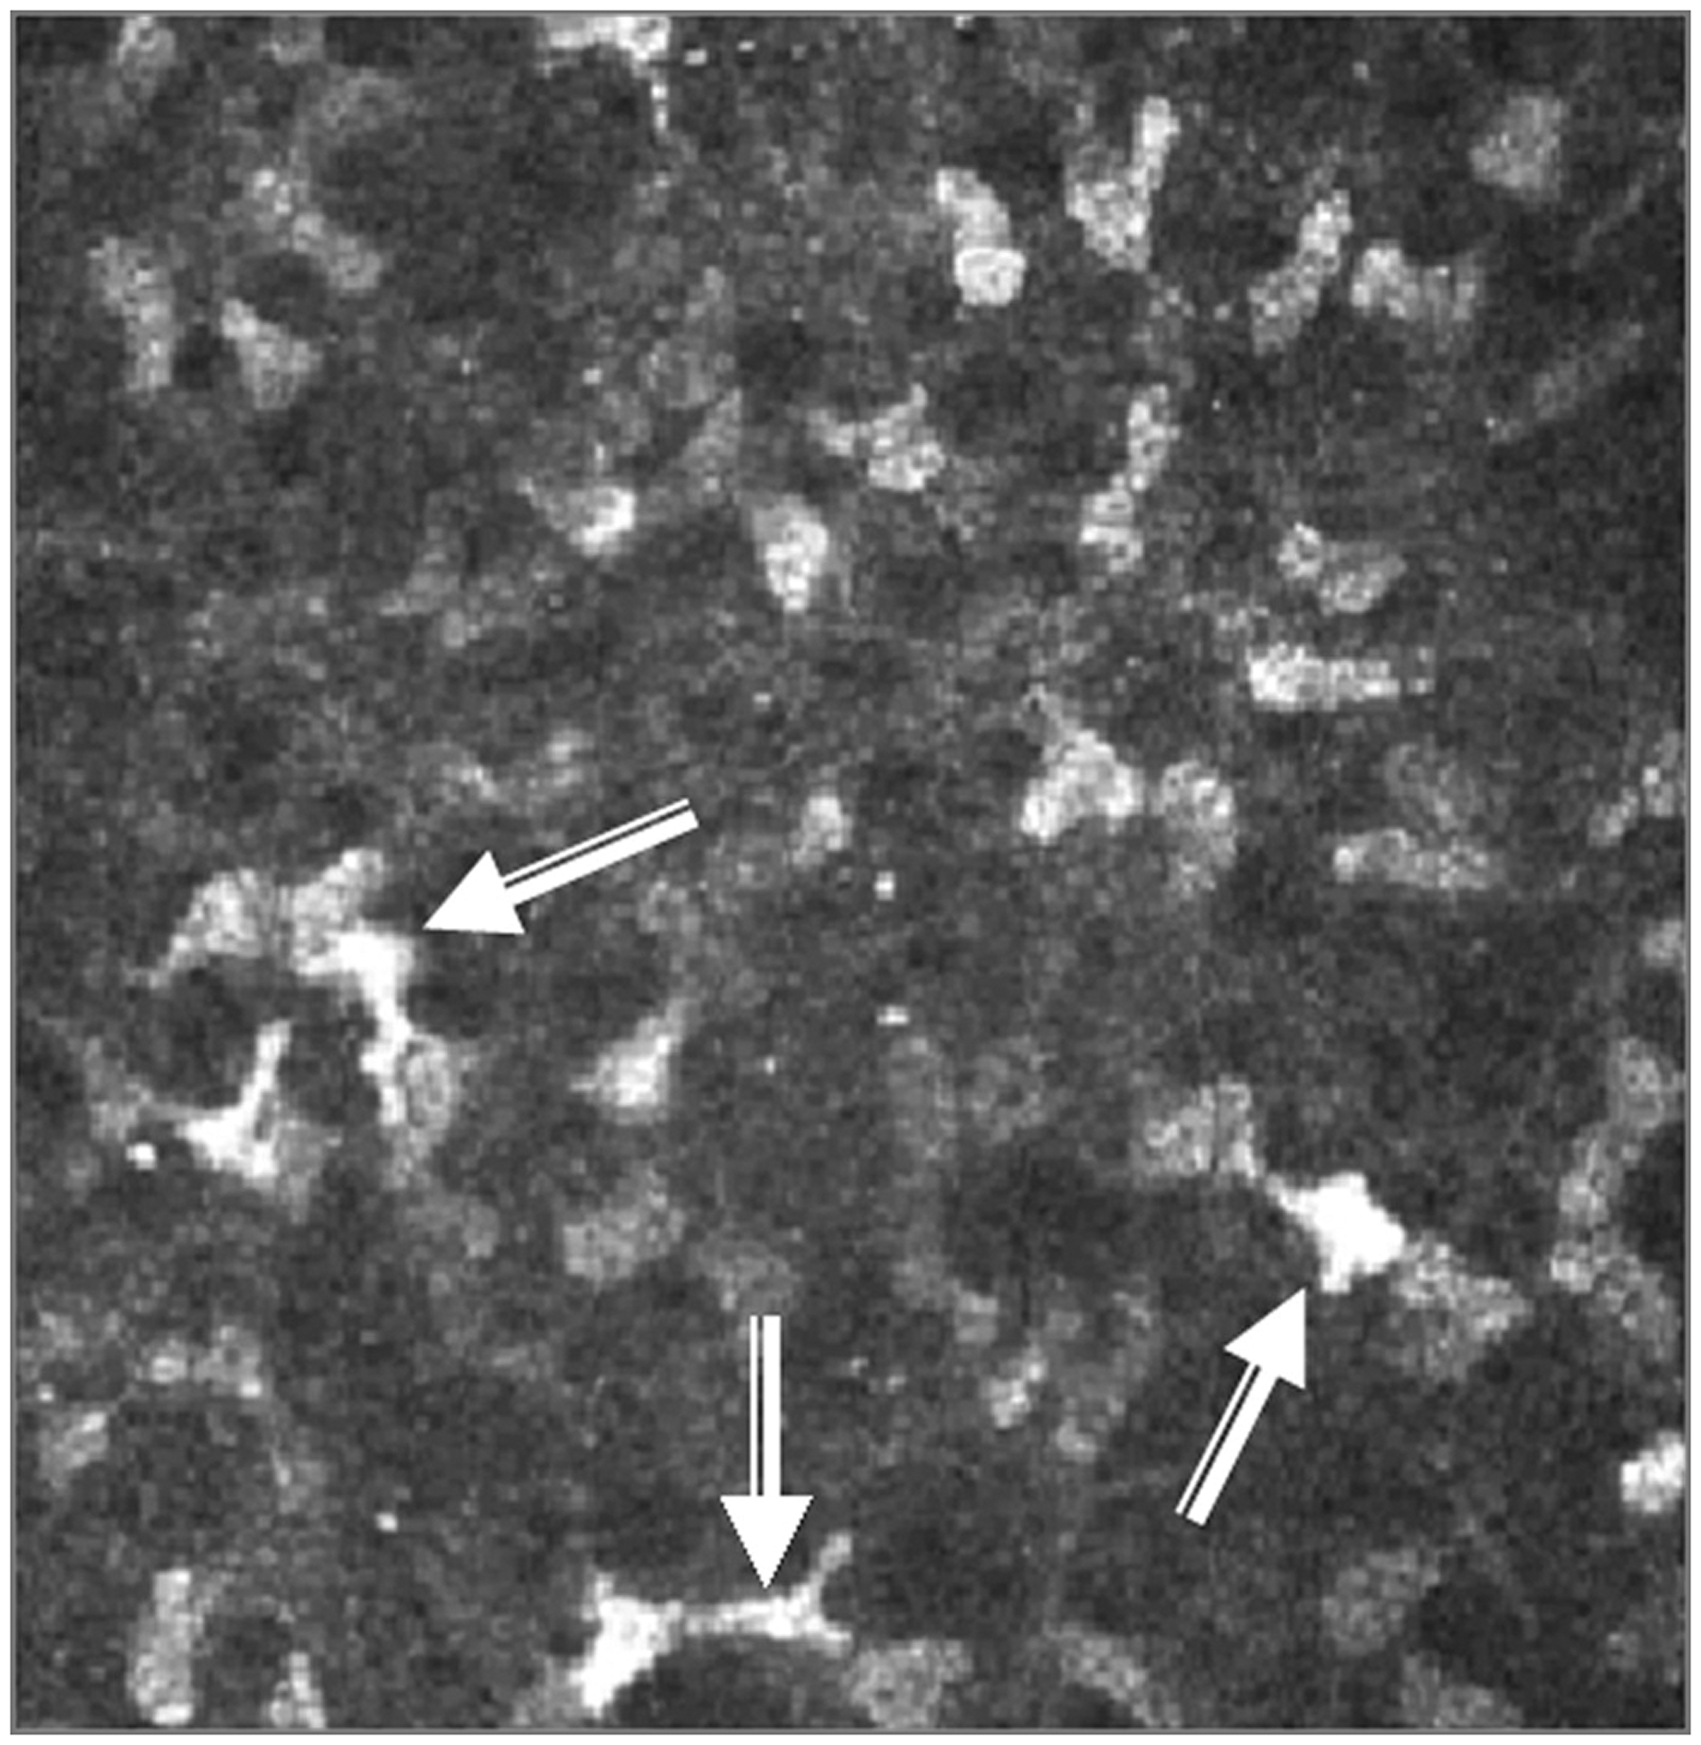
Hyper-reflective and normal low-reflective stromal cells. Activated keratocytes were detected as hyper-reflective cells (arrows) in the stroma of this secondary Sjögren’s syndrome phase I patient.
For RA SSII patients, the phase II density of the dendritic cells of the sub-basal layer was significantly reduced compared with phase I (Figure 2). However, there were no significant differences between phases I and II in nerve density, tortuosity or bead-like formations. For RA non-SSII patients, there were no differences between phases I and II in nerve density, tortuosity, bead-like formations or dendritic cell density.
Sub-basal dendritic cells. (A) In phase I, several sub-basal dendritic cells were apparent in this RA SSII patient. (B) For the same patient in phase II, no clearly recognizable dendritic cells were present. In RA non-SSII patients, the density of sub-basal dendritic cells did not change between phase I (C) and phase II (D).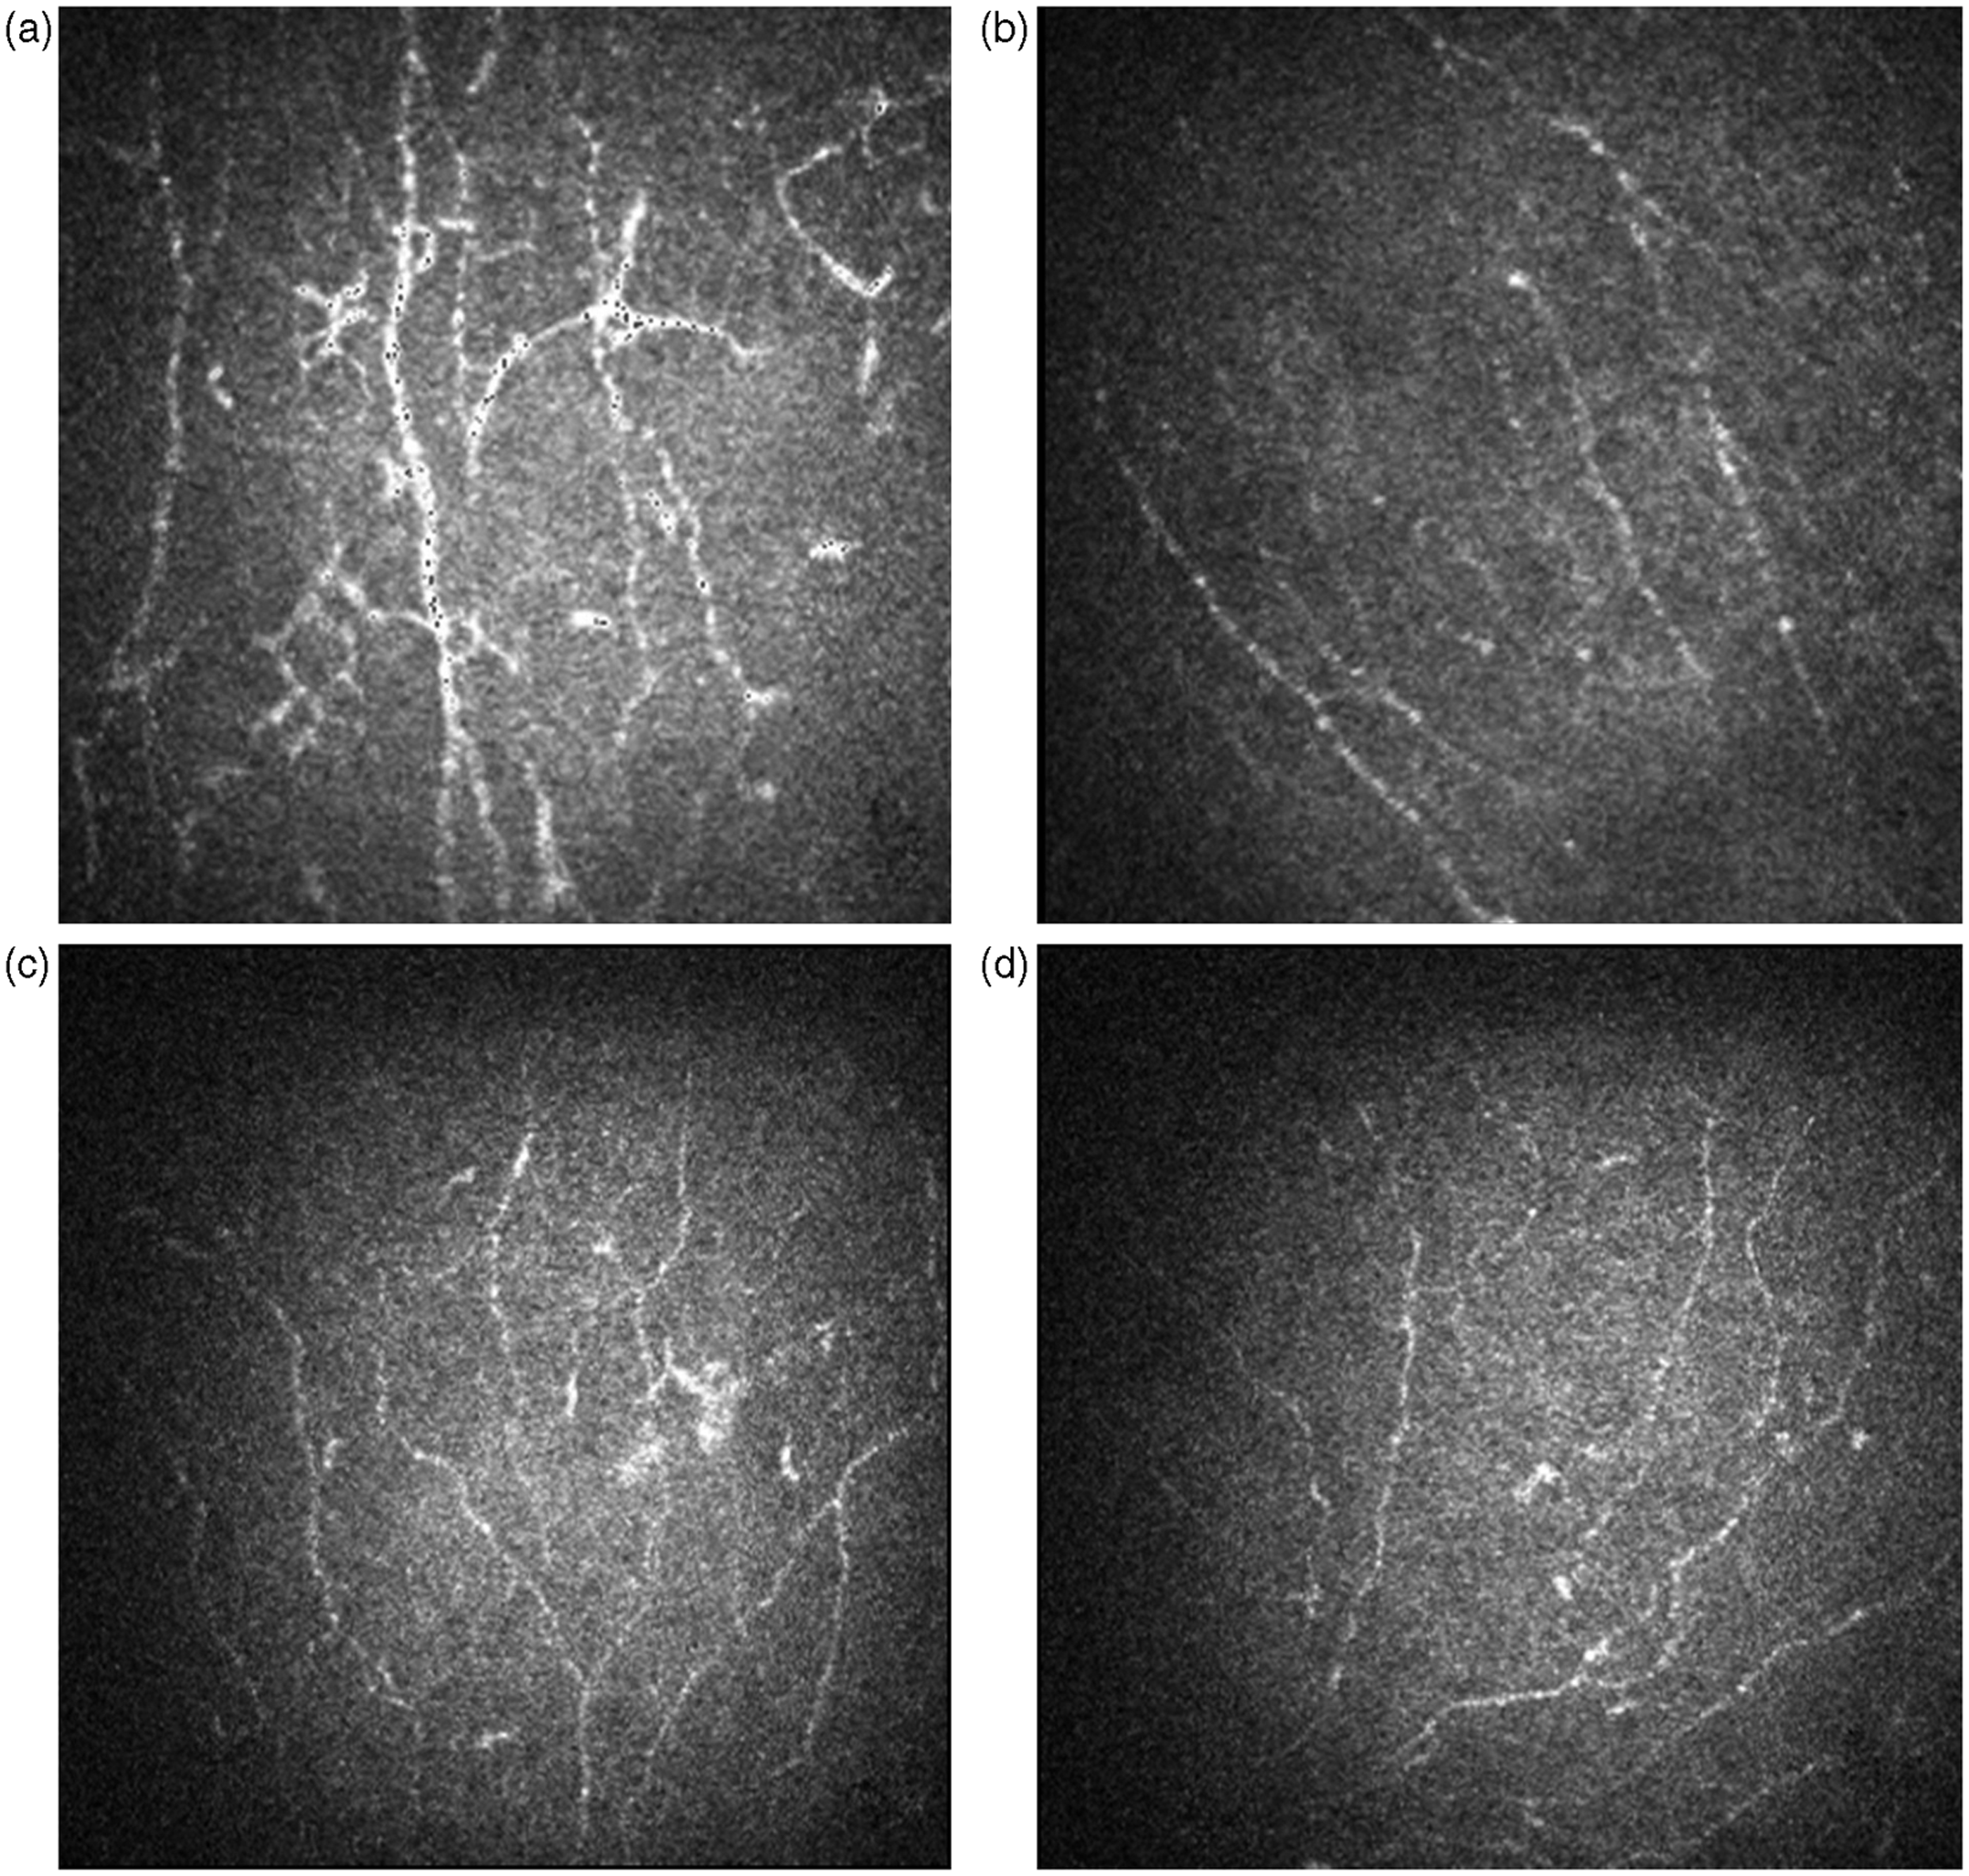
The inter-observer variance was 18%, 26% and 10% for the number of activated keratocytes, the number of bead-like formation and the density of dendritic cells respectively. For all the three variables, values calculated by the two investigators showed a strong correlation (P < 0.001; Spearman).
Cytokine data
Cytokine concentrations in tear fluid: Phase I versus phase II.
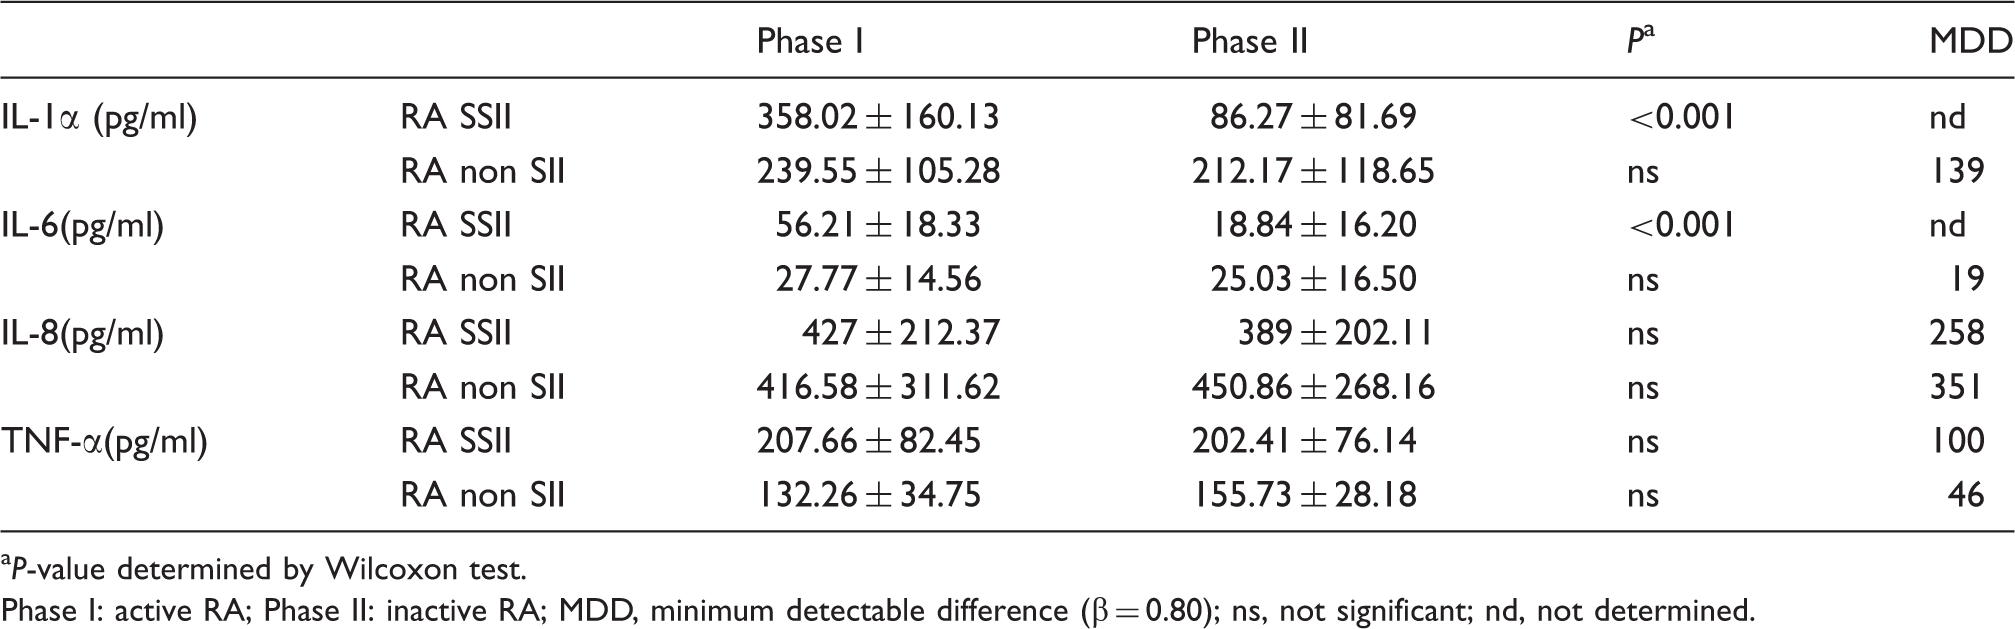
P-value determined by Wilcoxon test.
Phase I: active RA; Phase II: inactive RA; MDD, minimum detectable difference (β = 0.80); ns, not significant; nd, not determined.
Correlations
We analyzed five sets of correlative data: (i) number of dendritic cells versus number of activated keratocytes; (ii) number of bead-like formations versus tortuosity of the fibers, (iii) concentration of IL-1α versus corneal staining with fluorescein, (iv) concentration of IL-1α vs. concentration of IL-6; (v) concentration of IL-1α versus number of dendritic cells. In each case, the correlation was highly significant (P < 0.01, Spearman’s index of linear correlation).
Discussion
Confocal microscopy and other new approaches that offer us a real or optical ‘sampling’ of the ocular surface are providing new information regarding the pathogenesis of ocular surface diseases. In vivo confocal microscopy is an emerging non-invasive technology which enables microstructural analysis of the cornea and several ocular surface components, allowing fresh insight into their structure in health and in several pathological conditions.7,19–21 While still evolving methodologically and technically, the quantitative approach to confocal microscopy increases the potential usefulness of this technology.
Despite the many obvious methodological limitations, this study offers new data about ocular surface inflammation associated with RA and about the pathogenesis of SS and non-SS autoimmune dry eye.
Recently, the International Dry Eye Workshop inserted the concept of inflammation into the definition of dry eye. 22 The role of this pathogenic aspect is particularly evident in KCS associated with inflammatory autoimmune pathologies. In a previous study using confocal microscopy 7 we quantified in RA patients the number of hyper-reflective corneal keratocytes, which are indicators of activated stromal cells. We also reported the density of neuronal bead-like formations, which are signs of metabolic activation. 7 The changes in keratocytes and bead-like formations were consistent with changes in inflammation of the ocular surface of the patients. Mastropasqua et al. 23 first described the presence of sub-basal dendritic cells, such as antigen presenting cells, as indicators of inflammation.
In the present study, the number of activated keratocytes was correlated significantly with the density of dendritic cells. While the decrease in activated keratocytes in patients with RA SSII was not significant, this may have been owing to the small size of the study population. If the decrease is subtle but real, this could be detected with a larger sample size. In this case, the decrease would support the interpretation of these hyper-reflective keratocytes as a sign of inflammation.7,14
There was no detectable change in the density of bead-like formations between phases I and II for either group of RA patients. This finding raises doubts about the reliability of the bead-like formations as an indicator of the corneal inflammatory status.24 Additional studies may be necessary to clarify the nature of these structures in the context of corneal damage and regeneration of the nerve fibers.
We quantified the concentration of some inflammatory cytokines in tear fluid to determine how they varied with the clinical and confocal data. Collection of tears for cytokine assay is a way of ‘sampling’ the ocular surface, 13 but required us to choose between methods that would obtain very small samples of tears and others that would induce a degree of reflex tearing that enabled the collection of larger volumes. The purpose of our work was not to obtain the absolute concentration of the cytokines, but to compare the concentration of cytokines in the same patient in phases I and II. Therefore, we decided to ensure sufficient tear volumes by the induction of reflex tearing. By strictly using the same standardized sampling procedure for phases I and II we ensured a valid comparison between before and after treatment phases.
There are a number of cytokines involved in inflammatory diseases of the ocular surface. However, we obtained sufficient volume of tears for the study of only four of them. We chose IL-1αIL-6, IL-8 and TNF-α because they are involved in both ocular inflammation and in RA. Future studies, performed with techniques which allow the study of a greater number of cytokines, may provide important information, exploring also the balance between pro- and anti-inflammatory cytokines (i.e. IL-10).
Increased levels of inflammatory mediators, including pro-inflammatory cytokines and chemokines such as the ones we chose for study, have been detected in the tear fluid and/or conjunctival epithelium of patients with KCS.17,25–27
Clinical evidence indicates that these inflammatory mediators are relevant in the pathogenesis of KCS. Anti-inflammatory therapies that target components of the inflammatory response to dry eye are effective. 28 Moreover, IL-1 is a potent inducer of other inflammatory cytokines, such as IL-6 and TNF-α and of chemokines, such as IL-8. 29 Pro-inflammatory cytokines are also important in RA. Various cytokines, including IL-1α, TNF-α, IL-6 and IL-8, are present in the synovial fluid and tissue of RA patients.29,30 Intervention therapy using blockers of TNF-α, IL-1α and IL-6 have remarkable therapeutic efficacies.31–36 These findings indicate that these pro-inflammatory cytokines play crucial roles in the pathogenesis of RA. 37
Our results showed that IL-1α and IL-6, but not IL-8 or TNF-α, decreased significantly at the ocular surface of RA SSII patients with the reduction of the systemic disease activity. It is difficult to clearly explain these results, but they might be attributed to the existence of different response times.
A limitation of this study is the small number of patients and its potential effect on the power of the statistical tests. To check this, in each case in which we found no significant differences between phase I and phase II data, we calculated the MDD with α = 0.01 and β = 0.80. The values we obtained were in all cases reasonable from a biological point of view. This provides indirect reassurance regarding the statistical power of our analysis.
The clinical, confocal and cytokine data revealed differences between RA SSII and RA non-SSII patients in the behavior of the ocular surface inflammation when the systemic disease activity decreased. Previously, we found an association between systemic RA non-SSII activity and the number of bead-like formations and activated keratocytes. 7 We interpreted these associations as signs of ocular surface inflammation. Here, we tried to clarify this issue by analyzing the ocular surface disease activity in both the active and inactive phases of RA. However, in this study, we could not confirm the previously hypothesized association.
Fujita et al. 5 found a significant correlation between RA activity and some clinical tests for KCS in patients with RA SSII. Our results show important links between RA activity and the inflammation of the ocular surface in SSII patients. These links are not present in patients with RA non-SSII. It is possible that in RA non-SSII patients, KCS is associated with local pathogenic mechanisms more than with the systemic inflammation. These results support Lemp’s 6 hypothesis that ocular surfaces of RA SSII and RA non-SSII patients have very different pathogenic processes, but that they often lead to similar clinical findings. Thus, the molecular mechanisms in the pathogenesis of KCS and ocular surface inflammation in patients with autoimmune diseases with or without SSII must be clarified.
Footnotes
Acknowledgment
Edoardo Villani had full access to all the data in the study and takes responsibility for the integrity of the data and the accuracy of the data analysis.
Funding
This research received no specific grant from any funding agency in the public, commercial, or not-for-profit sectors.