
Abstract
Much evidence indicates that bacterial LPS (endotoxin) is removed from the bloodstream mainly by the liver, yet the hepatic uptake mechanisms remain uncertain and controversial. In plasma, LPS can be either ‘free’ (as aggregates, bacterial membrane fragments or loosely bound to albumin, CD14, or other proteins) or ‘bound’ (complexed with lipoproteins). Whereas most free LPS is taken up by Kupffer cells (KCs), lipoprotein-bound LPS has seemed to be cleared principally by hepatocytes. Here, we compared the liver’s ability to take up and deacylate free LPS aggregates and the LPS in preformed LPS-high density lipoprotein (HDL) complexes. In mice examined from 1 h to 7 d after a small amount of fluorescent (FITC-)LPS was injected into a lateral tail vein, we found FITC-LPS almost entirely within, or adjacent to, KCs. As expected, FITC-LPS complexed with HDL (FITC-LPS-HDL) disappeared more slowly from the circulation and a smaller fraction of the injected dose of FITC-LPS was found in the liver. Unexpectedly, the FITC-LPS injected as FITC-LPS-HDL complexes was also found within sinusoids, adjacent to, or within, KCs. In other experiments, we found that both free and HDL-bound radiolabeled LPS underwent enzymatic deacylation by acyloxyacyl hydrolase (AOAH), the LPS-inactivating enzyme that is principally produced within the liver by KCs. Our observations suggest that KCs and AOAH play important roles in clearing and catabolizing both free LPS and the LPS in circulating LPS-HDL complexes.
Introduction
The intrasinusoidal hepatic macrophages known as Kupffer cells (KCs) are often credited with removing Gram-negative bacterial LPS from the circulating blood. This conclusion has been reached by many of the investigators who have injected LPS intravenously into animals and studied its uptake by the liver. The methods used to identify the hepatic cells that take up bloodborne LPS have included autoradiography,1,2 immunostaining using anti-LPS Abs,3–5 tracking fluorescent LPS molecules using confocal microscopy6,7 and detection of LPS bioactivity using horseshoe crab amoebocyte factor C.8–10 Other investigators have injected radiolabeled LPS intravenously, isolated individual hepatic cell types and quantitated LPS uptake using scintillation counting.5–11 In each of these studies, LPS was detected most abundantly, and sometimes almost exclusively, in KCs. In some, neutrophils were found to take up the LPS and then undergo phagocytosis by KC. 12
However, there is also evidence that LPS can be taken up by both sinusoidal endothelial cells (SEC) and hepatocytes. Some of these studies used isolated SECs or hepatocytes that were exposed ex vivo to LPS; others found LPS associated with these cell types in vivo following i.v. LPS injection.3,9,10,13–15 In addition, LPS exposure can enhance the uptake of latex beads by SEC in situ, raising the possibility that these cells, if activated, might also take up LPS in vivo. 16 In one indirect approach, FITC-LPS was injected intravenously and recovered from the bile within a few minutes; 17 rapid transit through hepatocytes was suggested. In another, studies of the kinetics of 3H-LPS binding in buffer-perfused livers found that depleting KCs with gadolinium allowed hepatocytes to clear LPS effectively from the perfusate. 18
These studies have not addressed the role that the physical state of bloodborne LPS might play in determining its fate in the liver. In plasma, LPS can be either ‘free’ (as aggregates, bacterial membrane fragments, or loosely bound to albumin, soluble CD14 or other proteins) or complexed with lipoproteins. Binding to high density lipoprotein (HDL), low density lipoprotein (LDL), very low density lipoprotein (VLDL) or chylomicrons occurs within seconds when LPS is incubated in vitro with serum or plasma. 19 A major determinant of binding is the phospholipid content of the lipoprotein particles, which correlates with their surface area. 20 Mediated largely by LPS binding protein (LBP),21,22 LPS binding to lipoprotein also occurs quickly in vivo; it has been generally thought to target the LPS to cells, such as hepatocytes, that can take up the lipoprotein(s) via specific receptors.23–25 Lipoprotein-bound LPS is cleared more slowly from the bloodstream and is less able to stimulate cells than free LPS is, presumably because its lipid A moiety is sequestered within the lipoprotein micelle.26–28
Important mechanisms modulate hepatic responses to LPS. A critical catabolic step requires the enzyme acyloxyacyl hydrolase (AOAH), which inactivates LPS by removing the secondary fatty acyl chains from its lipid A moiety. 29 AOAH is expressed by various phagocytes, including KCs and hepatic dendritic cells. 6 Studies performed in AOAH-deficient mice revealed that even small doses of bioactive LPS can persist in cells and tissues for weeks, resulting in chronic activation and prolonged macrophage tolerance to LPS and other microbial stimuli; the presence of fully acylated LPS is accompanied by immunosuppression and long-lasting pathologies such as hepatomegaly and exaggerated polyclonal Ab responses.6,7,30,31 Although LPS may also be inactivated in vivo by i.v. injections of alkaline phosphatase32,33 and there is evidence that intestinal alkaline phosphatase may inactivate LPS in the gut,34,35 endogenous tissue phosphatases are unable to inactivate LPS in mice that lack AOAH.
Here, we compared the intrahepatic fates of LPS and LPS-HDL complexes. We found that free LPS is taken up initially by KCs and that some of this LPS remains KC-associated for at least 7 d. Although the LPS in LPS-HDL complexes was taken up by the liver more slowly than was free LPS, it gradually became associated with KCs and underwent enzymatic deacylation within the liver. The findings show that KCs and AOAH play important roles in deacylating both free and HDL-bound LPS.
Materials and methods
LPS preparation and labeling
We prepared fluorescent LPS (FITC-LPS) by suspending 2.4 mg of pure Escherichia coli O14 LPS (Ra chemotype), prepared using the phenol-chloroform-light petroleum method of Galanos, 36 in 1.2 ml 0.1 M Na-borate (pH 10.5). After water bath sonication until the suspension was translucent, we added 10 mg FITC (Invitrogen, Carlsbad, CA, USA) and incubated the mixture for 3 h at 37°C. Glycine (10.75 mg) was added to stop the reaction and the mixture was dialyzed (1000 MM cutoff) against PBS at 4°C, with daily changes until no yellow color appeared in the PBS. The FITC-LPS was precipitated by adding two volumes of 100% ethanol and the pellet was washed three times with 70% ethanol before being suspended in pyrogen-free water (1.2 mg/ml). Approximately 50% of the LPS was recovered; the FITC/LPS molar ratio in the conjugate was 0.53. The activity of FITC-LPS was tested by incubating different amounts of FITC-LPS or LPS with peritoneal macrophages for 6 h in vitro and measuring IL-6 in the culture medium; the two dose-response curves were superimposable (not shown). FITC sodium salt and FITC-BSA were from Sigma (St Louis, MO, USA). Each of the preparations was suspended in sterile, endotoxin-free PBS prior to injection.
Biosynthetically labeled Salmonella enterica sv. Typhimurium PR122 (Rc structure) [3H/ 14 C]LPS (1.2 × 10⁵ dpm 3H/µg LPS in the fatty acyl chains and 8 × 10³ dpm 14 C/µg LPS in the lipid A glucosamine backbone) was used to measure LPS clearance, uptake and deacylation. 6 To prepare LPS-HDL complexes, we incubated 100 µg [3H/ 14 C]LPS and 100 µg FITC-LPS with 10 mg human HDL (provided by Y. K. Ho, UT Southwestern Medical Center) and 2 µg recombinant human LPS-binding protein 37 for 6 h at 37°C, 150 mM NaCl, 100 mM HEPES, pH 7.4. The density of the solution was adjusted to 1.21 g/ml with KBr and the FITC-LPS-HDL complexes were isolated by ultracentrifugal flotation. 38 After dialysis against 0.9% NaCl, 3 mM EDTA at 4°C, the FITC-LPS-HDL and uncomplexed HDL were filtered (0.45 µm, Amicon filters; EMD Millipore, Billerica, MA, USA) and stored at 4°C. Approximately 60% of the radiolabeled LPS floated at the top of the gradient (the position occupied by HDL), whereas less than 3% was found at the top of the gradient in the absence of HDL (control). As expected, 26 the ability of the LPS to induce macrophage IL-6 production in vitro was reduced 10-fold in LPS-HDL complexes (not shown).
Mouse strains
Wild-type and Aoah-/- C57BL/6 mice 39 were maintained in specific pathogen-free conditions in the UT Southwestern Animal Resources Center and used for experiments when they were 5–12 wks of age. On one occasion, serology for murine norovirus was positive for sentinel mice. Although the significance of the norovirus exposure is not known, and very few animal facilities screen for it, we feel that including this information is important for a full account of the experiments. All protocols were approved by the UT Southwestern Institutional Animal Care and Use Committee.
LPS administration and specimen preparation
Mice were injected with FITC-LPS or [3H/ 14 C]LPS (5–10 µg/mouse), FITC-LPS plus [3H/ 14 C]LPS (total of 10 µg per mouse, mixed prior to injection), LPS-HDL complexes [FITC-LPS-HDL plus [3H/ 14 C]LPS-HDL (total of 10 µg LPS)], FITC sodium salt (0.6 µg/mouse) or FITC-BSA (10 µg BSA/mouse). Injections were given into the lateral tail vein in a volume of 200 µl. At sequential time points (1 h, 4 h, 24 h, and 3 d and 7 d) after injection, the livers, spleens, kidneys and (in some experiments) abdominal fat were harvested. Small liver pieces were embedded in optimal cutting temperature (OCT) compound (Ted Pella, Inc., Redding, CA, USA) and frozen in liquid nitrogen; other pieces of liver, spleen, kidney and fat were lysed by sonication in lysis buffer (PBS with 0.2% Triton X-100, 5 mM EDTA) and aliquots were subjected to scintillation counting as previously described. 6 In other experiments, Aoah-/- mice were given i.v. injections containing clodronate-liposomes or PBS-liposomes [prepared in the laboratory of Jerry Niederkorn, UT-Southwestern, from clodronate provided by Roche (Mannheim, Germany), or in the laboratory of R. Munford at NIAID, using clodronate purchased from Sigma-Aldrich (St Louis, MO, USA)]. Forty-eight hours after liposome treatment, half of the clodronate- or PBS-liposome-treated mice were injected with 10 µg FITC-LPS or PBS mixed with 2 µg [3H/ 14 C]LPS. The livers from each group were harvested 4 h, 1 d or 6 d after the LPS injection.
LPS uptake and deacylation
The [3H/ 14 C]LPS contains a 14 C-glucosamine-labeled lipid A backbone and 3H-labeled fatty acyl chains. The 14 C content reflects the number of LPS molecules in the sample and the ratio of 3H to 14 C dpm is determined by the number of fatty acyl chains per LPS molecule. Because the 14 C radioactivity remaining in the plasma following i.v. LPS injection was very low at some time points, we used the 3H dpm to follow LPS disappearance from the blood over time. Measurements of LPS deacylation were performed as previously described (Method 2 in Shao et al. 6 ). Briefly, the 14 C-labled LPS with its remaining 3H-labeled fatty acyl chains was precipitated from tissue lysates by adding two volumes of ethanol, leaving the released 3H-fatty acids, lipid metabolites and any ethanol-soluble degradation products in the supernatant. Deacylation was calculated by comparing the 3H/ 14 C ratio of the ethanol-insoluble material to that of the initial 3H/ 14 C ratio of the LPS: % deacylation = 1 – [measured 3H / 14 C ratio]/[starting 3H / 14 C ratio]) × 100. As two of the six fatty acyl chains are secondary chains that can be removed by AOAH, the percent removal of secondary acyl chains was calculated by the formula: % deacylation of secondary chains = % deacylation/0.33.
Microscopy
Six-micrometer cryostat liver sections were fixed with cold 70% methanol/30% acetone for 15 min at −20°C. After blocking with normal mouse IgG and BSA, they were stained with rat anti-mouse CD144 Ab (11D4.1; BD Pharmingen, Sparks, MD, USA) followed by Alexa Fluor® 555-conjugated goat anti-rat IgG (Invitrogen, Grand Island, NY, USA) to identify endothelial cells, or with biotin-conjugated rat anti-mouse CD11b Ab (M1/70; BD Biosciences Pharmingen, San Diego, CA, USA) followed by Alexa Fluor® 555-conjugated streptavidin (Invitrogen) to identify neutrophils. Alexa Fluor® 647-conjugated rat anti-mouse F4/80 Ab (BM8; Invitrogen) was added to identify KCs and Qdot® 565-conjugated goat anti-FITC Ab (Invitrogen) was added to amplify the FITC signal. Nuclei were stained with 4’,6-diamindino-2-phenylindole (DAPI). Images were taken using a Leica TCS SP5 confocal microscope in the Live Imaging Core (UT Southwestern, Kate Luby-Phelps, Director). Livers from three mice per group were studied by immunofluoresence microscopy at each time point. Multiple (at least three) images were taken at 63 × magnification from each section. One selected field from each of these images was recorded at a higher magnification using a 2.4 × zoom. Semi-quantitative analysis of higher magnification (63 × with 2.4 × zoom) images was performed in a blinded fashion on coded images by overlaying three single color images (CD144, F4/80 and LPS) in Adobe Photoshop® to determine whether FITC-LPS areas overlapped with, or were directly adjacent to, CD144+ or F4/80+ areas of the liver section. The intensity of the bright (+++) areas of FITC-LPS were assumed to reflect at least one log (10-fold) more LPS than was present in the dim areas. Therefore, dim (+), medium (++) and bright (+++) areas of FITC-LPS were assigned the numbers 1, 3 and 10, respectively, to approximate the relative amounts of LPS on a logarithmic scale. The amount of LPS associated with CD144 and/or F4/80 was determined as the percentage of the total numerical sum of LPS intensities in each group. Statistical analysis was based on percentages derived from each image (usually n = six images from three mice/group).
KC depletion and LPS deacylation
AOAH-wild type mice were injected i.v. with 200 µl clodronate-liposomes or PBS-liposomes. Two days later, the mice were injected i.v. with 5 µg of [3H/ 14 C]LPS or HDL-[3H/ 14 C]LPS. The spleen and liver were harvested 4 h after LPS injection. A small piece of liver (around 180 mg) and spleen were lysed by sonication in lysis buffer (PBS with 0.2% Triton X-100, 5 mM EDTA). Tissue LPS uptake and deacylation were calculated as described above and sections of liver and spleen were examined for the presence of KCs as described above. Clodronate-liposomes reproducibly depleted 90% of the F4/80-positive cells.
Statistics
We tested for significant differences between groups using the two-tailed Student’s t-test.
Results
Uptake of radiolabeled LPS and LPS-HDL complexes by the liver
Within 1 h of injecting [3H/
14
C]LPS into the tail vein, over 90% of the LPS had been cleared from the circulation and approximately 90% of the injected
14
C dpm (a marker for the carbohydrate backbone of LPS) was found in the liver (Figure 1A, B). The [3H/
14
C]LPS in LPS-HDL complexes was cleared much more slowly (about 50% was still in plasma 1 h after injection) and only 15% of the injected
14
C dpm had accumulated in the liver. In contrast, the uptake of [3H/
14
C]LPS-HDL by the kidney and abdominal fat exceeded that of [3H/
14
C]LPS (Figure 1C). The slower clearance rate and tissue distribution confirm previous findings3,10,11 and provide additional evidence that the LPS-HDL complexes were formed as expected.
Plasma clearance and tissue uptake of radiolabeled LPS and HDL-LPS. LPS or HDL-LPS (each containing 5 µg [3H/
14
C]LPS), was injected via the lateral tail vein. A and B show the time course for disappearance of LPS and LPS-HDL from the plasma (A) and their uptake by the liver (B). (C) Comparison of the tissue distribution of LPS and LPS-HDL 22 h after i.v. injection. n = 3–6 mice/time point. Error bars = 1 SEM. Data combined from three experiments with similar results. **P < 0.01, ***P < 0.001.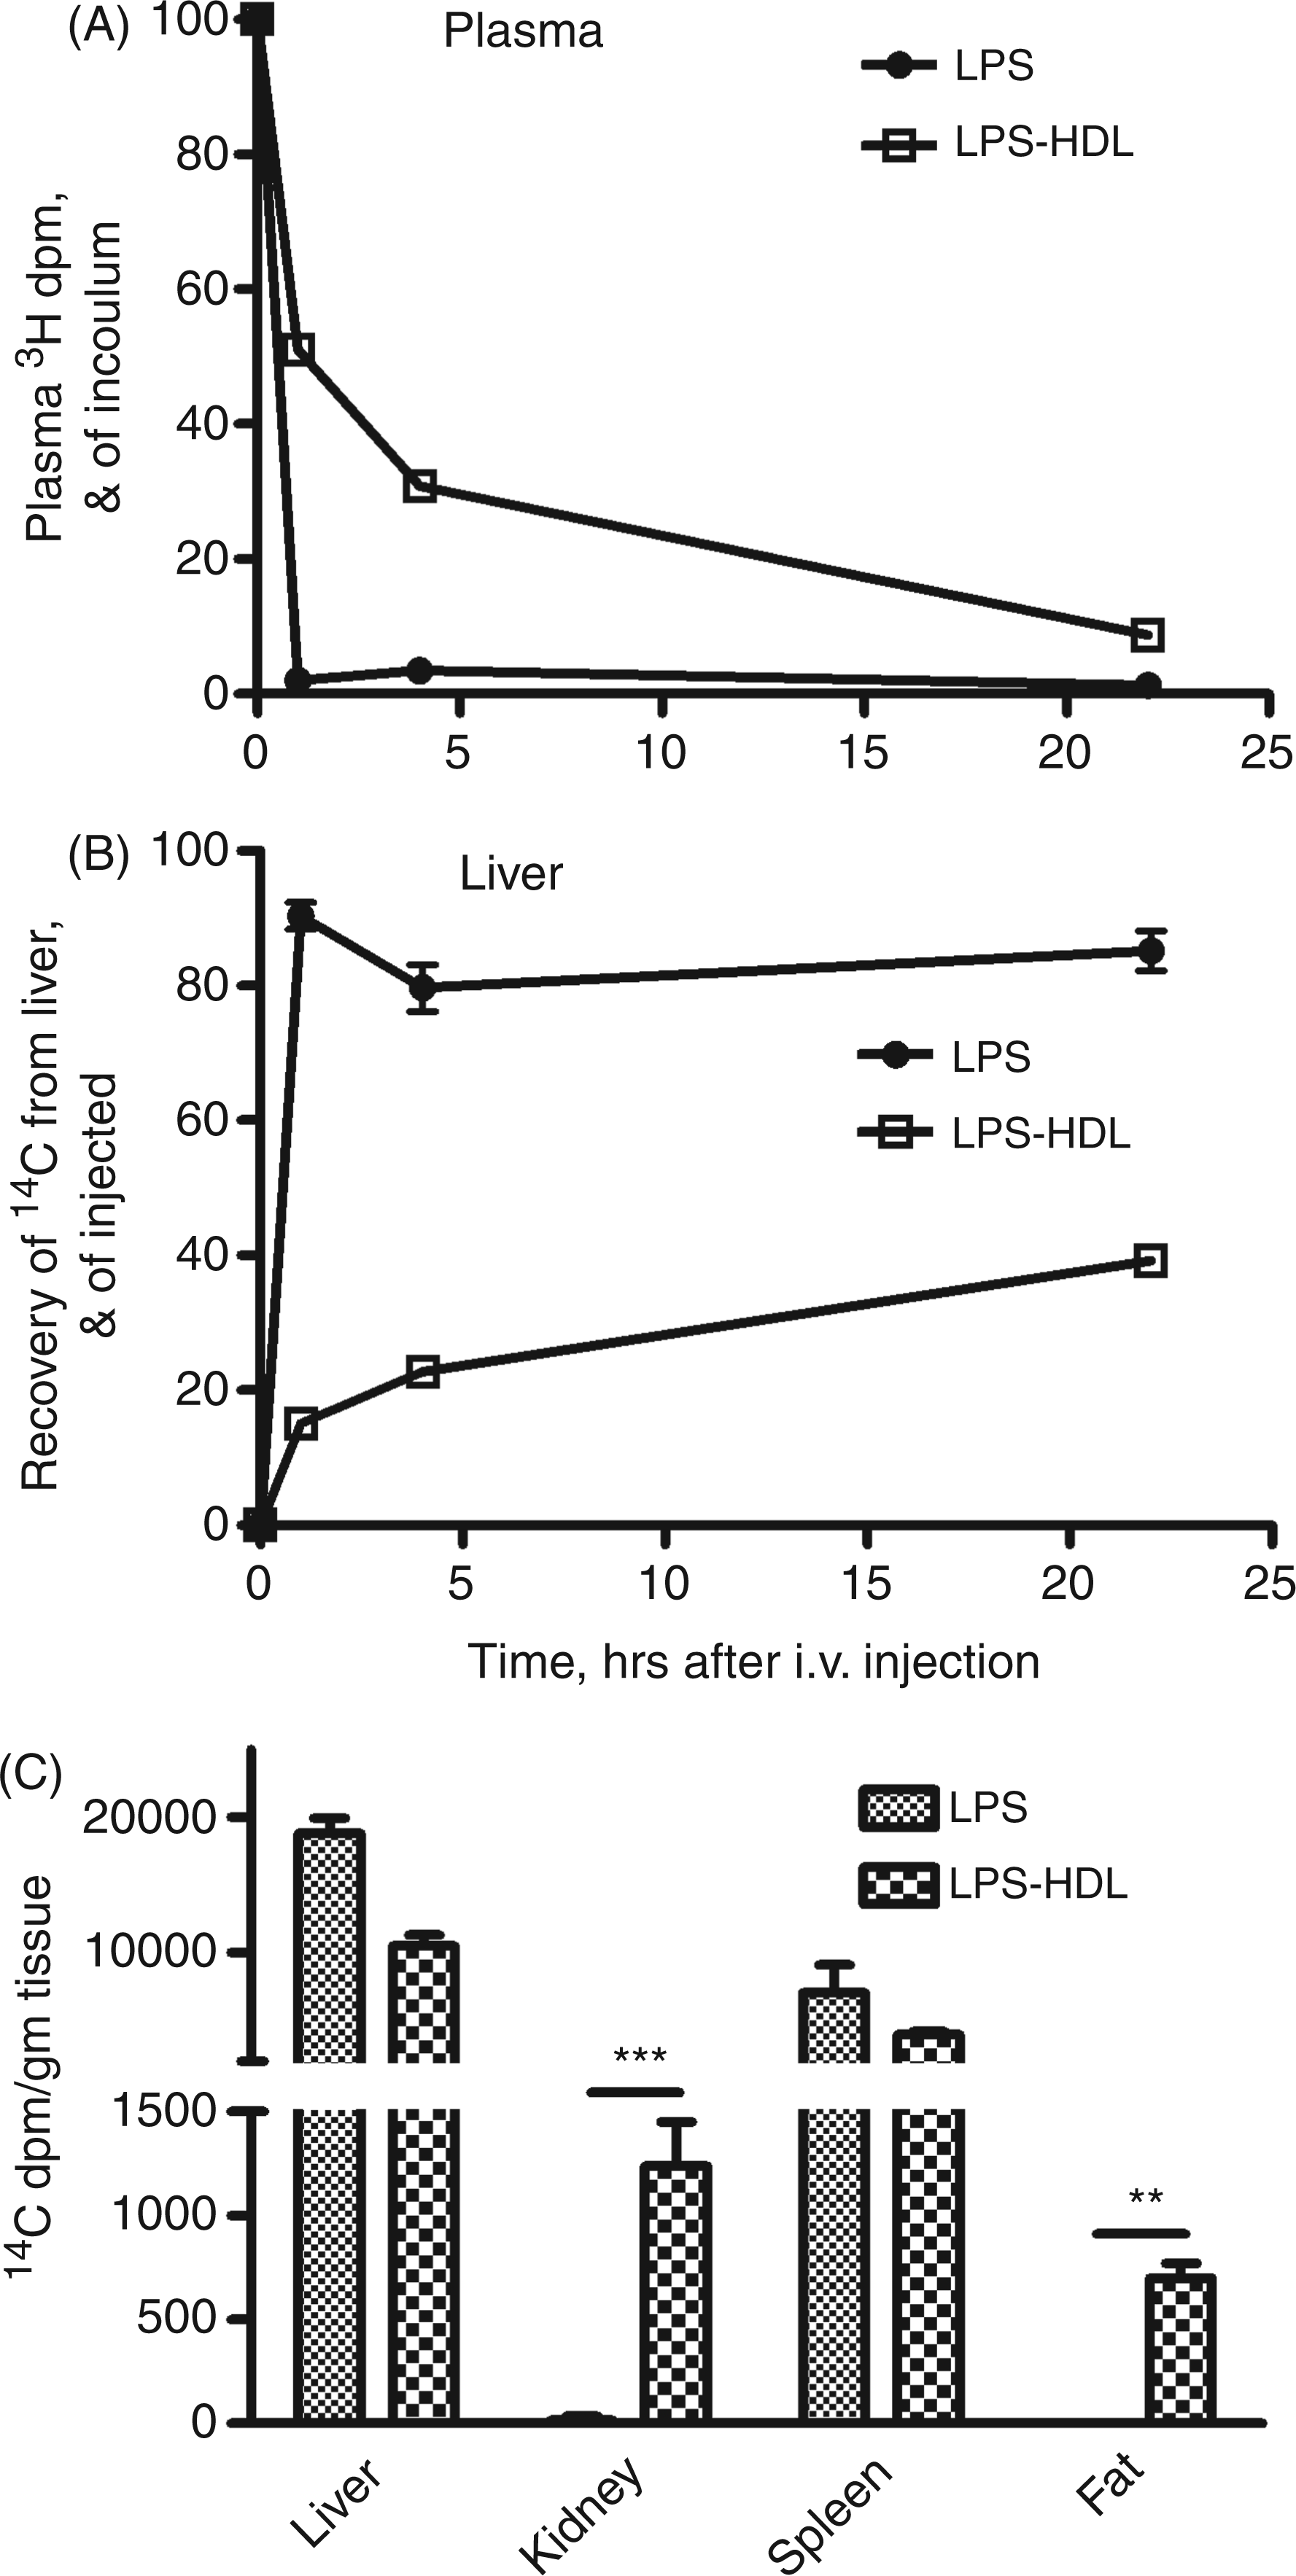
Intrahepatic locations of LPS and LPS-HDL
Vascular endothelial (VE)-cadherin is an important constituent of endothelial cell junctions. Its location can provide an approximate outline of the hepatic sinusoids (red in Figure 2A, white in Figure 2C–E). An Ab to F4/80 was used to identify KCs (red, Figure 2B–E). DAPI (blue) stains cell nuclei. Qdot®565 nanocrystals (conjugated to an anti-fluorescein Ab) were used to amplify the FITC signal (green). Using these markers, it was possible to judge whether FITC-LPS was intra- or extra-sinusoidal and to assess its proximity to KCs. In the composite images (Figure 2C–E), VE-cadherin is white, F4/80 is red, DAPI is blue and FITC is green. The FITC-LPS was almost always found in contact with KCs, although some was free within the sinusoids. We found very little FITC outside sinusoids (i.e. in hepatocytes). We further confirmed that intrasinusoidal FITC-LPS was KC-associated by depleting KCs with clodronate-liposomes prior to injecting FITC-LPS. As shown in Figure 2D, we found intrasinusoidal FITC (green) in the absence of KCs (red) 24 h after injection. Although there was green fluorescence within sinusoids at the 7 d time point, very little co-localized with the F4/80-positive cells that had re-populated the sinusoids at that time (Figure 2E).
Uptake of FITC-LPS by liver cells. (A) Sinusoidal endothelial cell junctions were stained with anti-CD144 (VE-cadherin), which is red in this panel. FITC-LPS is green. Cell nuclei are blue (DAPI). Note that the red label outlines many of the sinusoids. (B) In the same image, Kupffer cells were stained with anti-F4/80 (red). (C) The merged image with VE-cadherin now shown in white. Note that the FITC (green) is almost always found in contact with Kupffer cells (arrowheads), although some is also free within the sinusoids and there is also occasional extrasinusoidal FITC (arrow). (D, E) FITC-LPS is shown 1 d (D) and 7 d (E) after FITC-LPS administration to mice that had received clodronate liposomes 48 h before as described in Materials and Methods. FITC-LPS (green), KC (F4/80, red), SEC (VE-cadherin, white) and nuclei (DAPI, blue).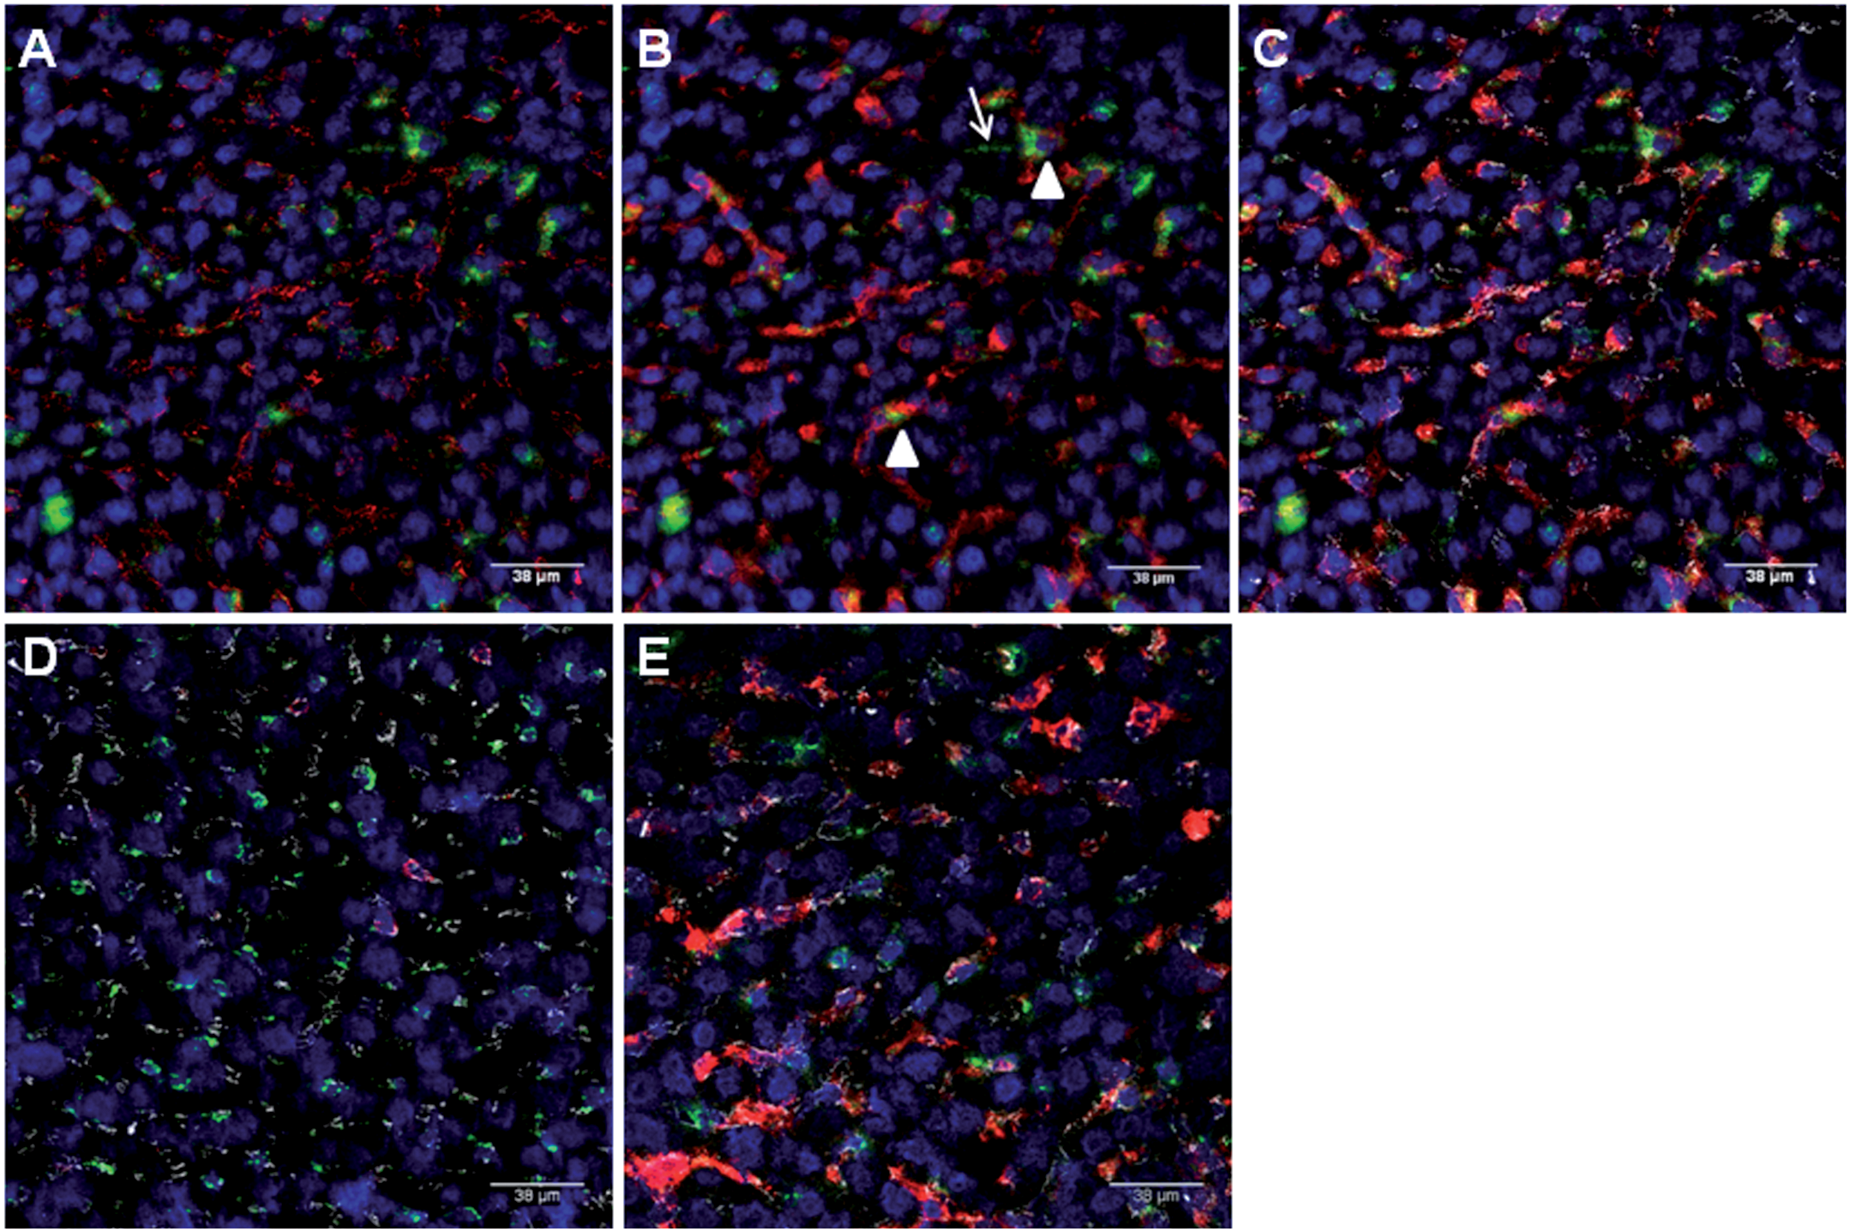
The two LPS forms had somewhat different fates after they arrived in the liver. One hour, 4 h and 1 d after injecting FITC-LPS, green fluorescence was found within sinusoids, where it was largely, but not entirely, within or adjacent to KCs (red) (Figure 2C, Figure 3A–C). Similar results were found 7 d after injection (not shown). Although the FITC in FITC-LPS-HDL complexes was found within sinusoids 1 h after injection, there was little apparent association with KCs (Figure 3D) and FITC was also found overlying extrasinusoidal cells (arrows). At 4 h after injection, however, and again at 24 h, more of the FITC from the FITC-LPS-HDL complexes co-localized with KCs (Figure 3E, F). Free FITC and FITC-BSA, used as controls, were not detectable in the liver sections 1 h or 3 d after i.v. injection (not shown).
LPS and LPS-HDL uptake by the liver. Each panel shows a merged image with VE-cadherin (white), Kupffer cells (red), FITC-LPS (green) and cell nuclei (blue). (A–C) FITC-LPS; (D–F) FITC-LPS-HDL. At 1 h after injection most of the FITC-LPS is associated with Kupffer cells (A), whereas most of the FITC-LPS-HDL is within sinusoids but not Kupffer cell (KC)-associated, and some may be extrasinusoidal (D, arrows). By 4 h and 24 h after injection, more of the FITC-LPS-HDL is in close proximity to KCs (E, F), yet the overlap is not so prominent as it is for FITC-LPS and KCs (B, C).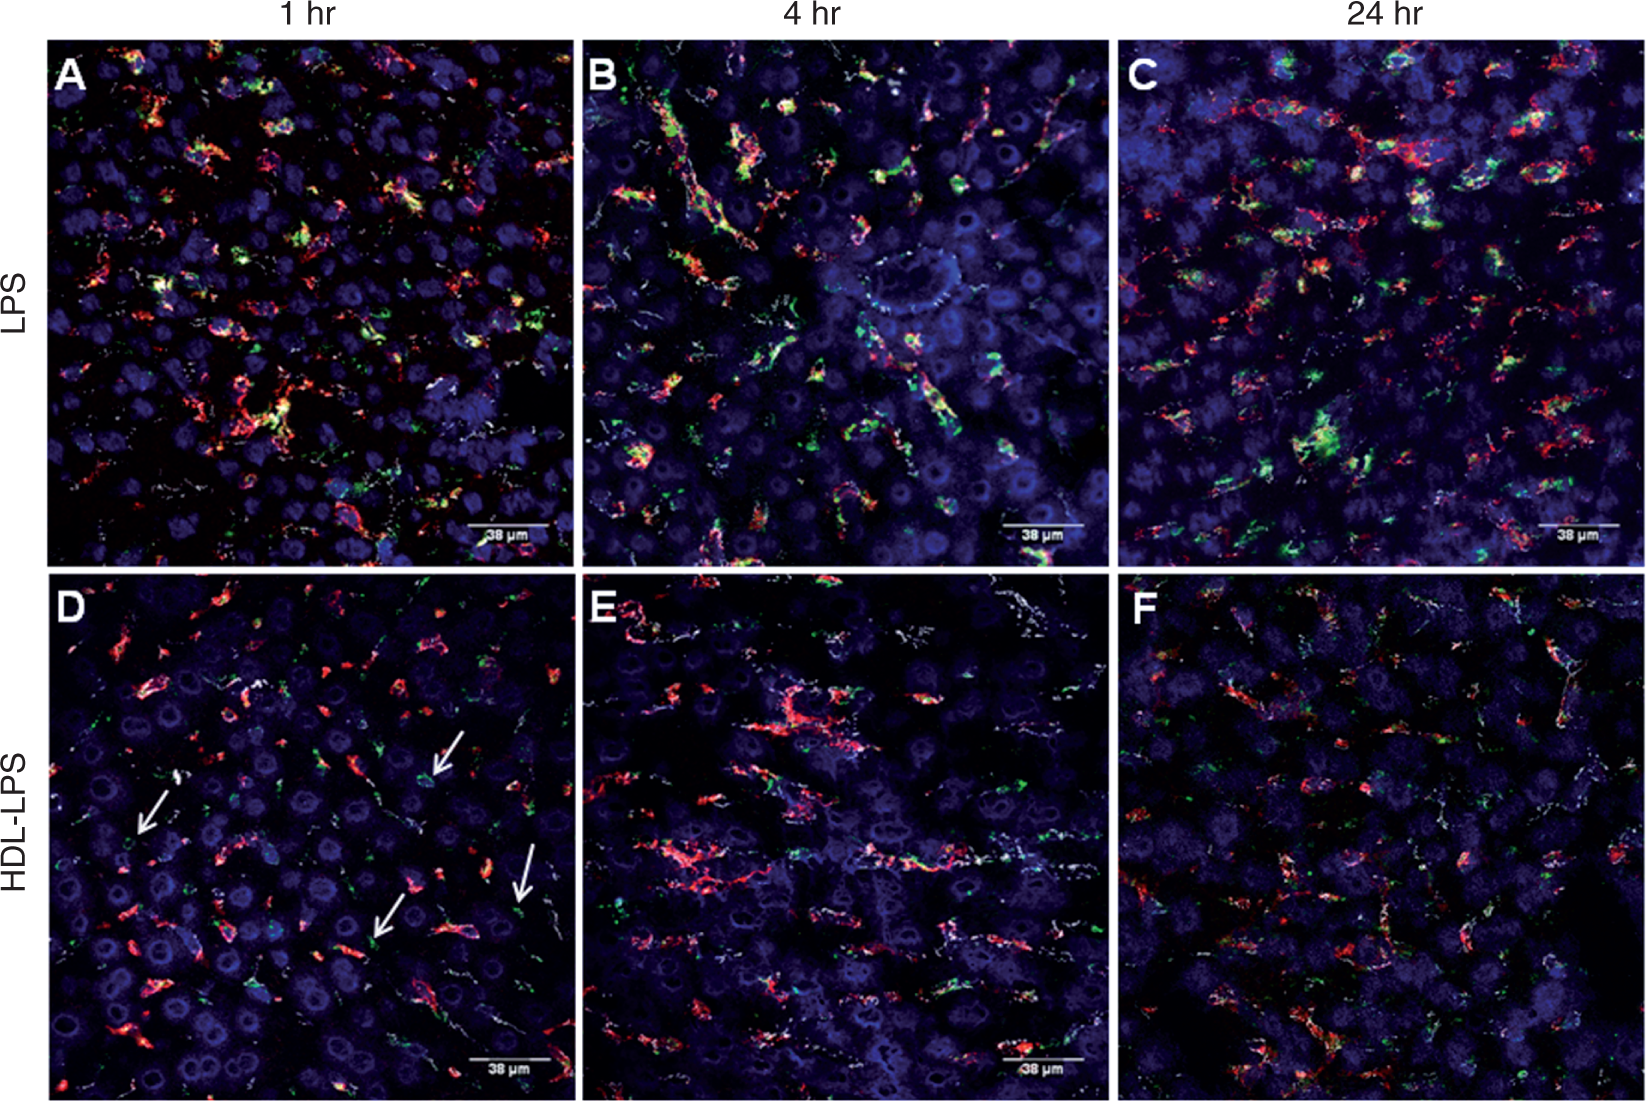
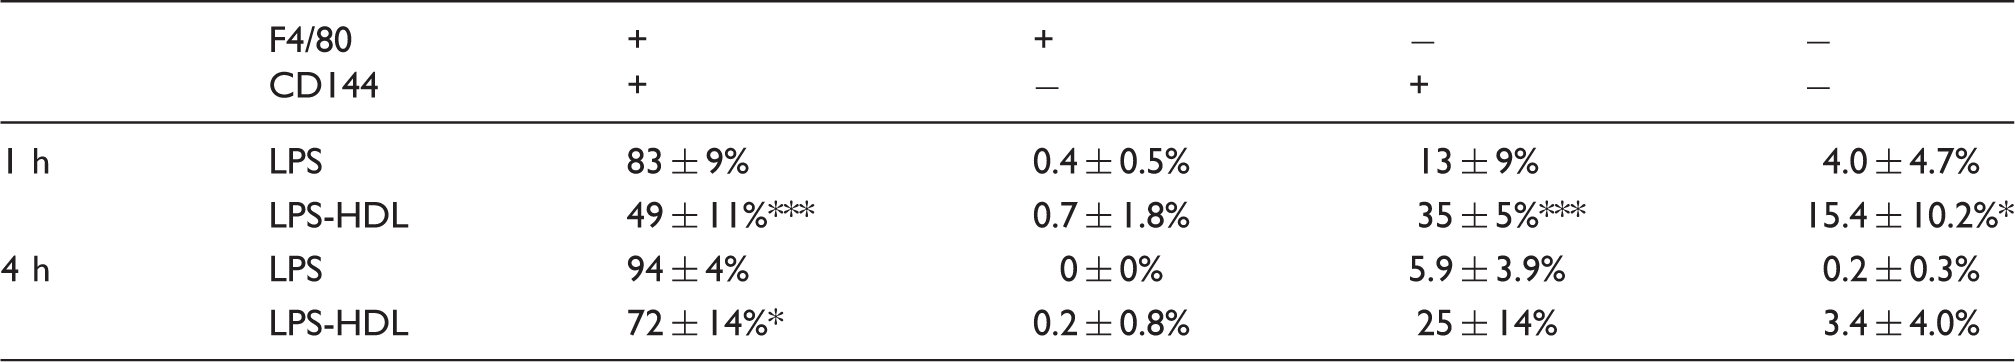
Analysis of LPS distribution in liver sections. The percentage of the total FITC-LPS that overlapped or was adjacent to Kupffer cells (F4/80+) or sinusoidal endothelial cells (CD144+) was estimated as described in the Materials and Methods and is shown as mean ± SD (n = 6 images) derived from three mice/group. Asterisks denote significant difference from the control (LPS) group [*P < 0.05, **P < 0.01, ***P < 0.001)].
We identified neutrophils in liver sections by using an Ab to CD11b that does not bind to KCs in liver sections (not shown). At 1 h and 1 d after FITC-LPS injection, increased numbers of neutrophils were found in the liver, but only rarely was the FITC label found associated with these cells. The absence of FITC-LPS in neutrophils was not unexpected, as in previous studies we found that depleting neutrophils by prior treatment with an anti-Gr-1 Ab did not reduce the recovery of [3H/ 14 C]LPS from the liver 15 h after i.v. injection (88.4 ± 2.4% was recovered from control mice versus 87.9 ± 4.17% from neutrophil-depleted mice). 6 These results suggest strongly that neutrophils do not play a significant role in liver uptake of free LPS.
Deacylation of LPS and LPS-HDL in vivo
Hepatic uptake of LPS-HDL can be blocked by excess HDL,
23
suggesting strongly that the complexes are taken up via mechanisms that normally clear HDL. Whereas macrophages express receptors that can bind HDL (SR-BI), HDL can also be taken up by hepatocytes, bypassing KCs. It was of interest to know whether the LPS in these complexes undergoes deacylation in the liver, as the deacylating enzyme, AOAH, is principally produced by KCs and not by hepatocytes.
6
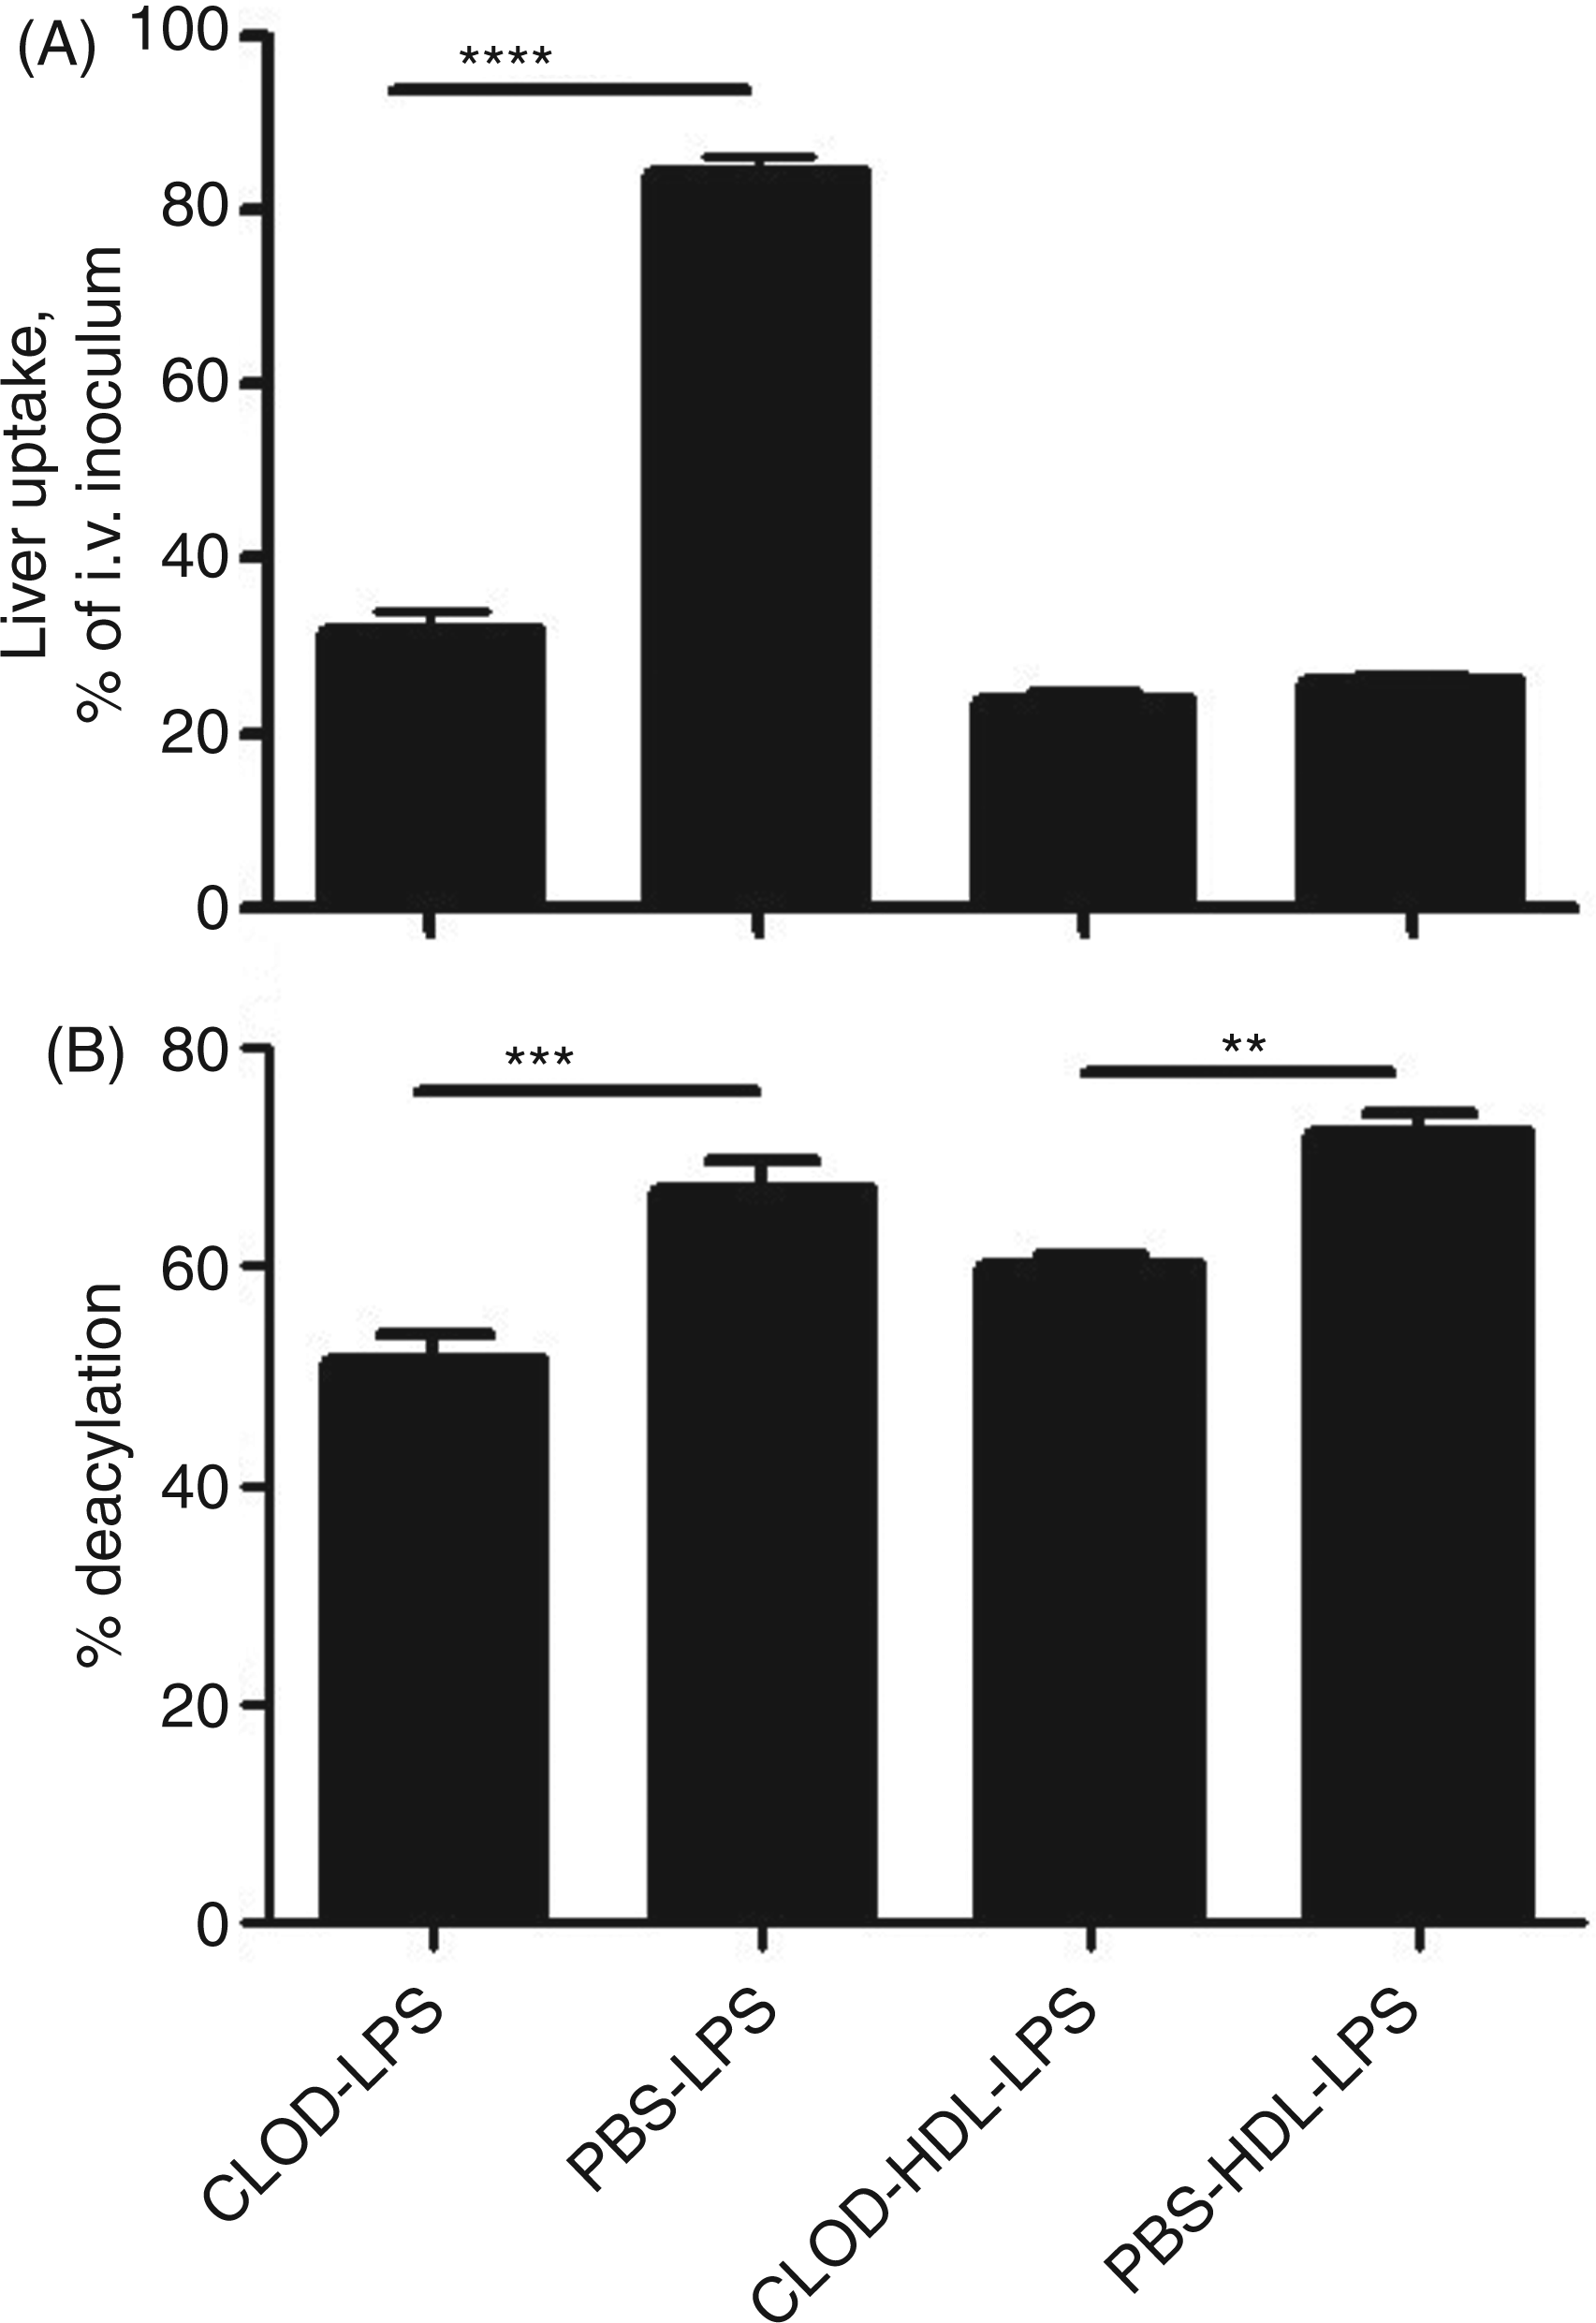
Unexpectedly, we found that ‘free’ LPS and the LPS in LPS-HDL complexes underwent deacylation at approximately the same fractional rate (Figure 4A); the amount of deacylated LPS in the liver at 4 and 22 h was greater for LPS than for LPS-HDL (Figure 4B), in keeping with the greater amount of free LPS that had been cleared by the liver at each time point. KC depletion decreased the uptake of free LPS by 65% without altering the uptake of LPS-HDL (Figure 5A); the deacylation of both free and lipoprotein-bound LPS measured 4 h after injection decreased by approximately 20% (Figure 5B). Clodronate treatment did not significantly diminish AOAH activity in plasma (n = 6 mice/group, data not shown), suggesting an explanation for the relatively minor impact of KC depletion on LPS-deacylating activity in the liver.
Time course of LPS deacylation in the liver. Five µg [3H/
14
C]LPS or [3H/
14
C]LPS-HDL were injected i.v. at time = 0 and the liver was harvested at the indicated times. n = 3–6 mice/time point. (A) Deacylation at each time point is expressed as the loss of secondary acyl chains from LPS. (B) The amount of LPS deacylated at each time point is shown. The greater amount of LPS deacylated in B is a result of the greater uptake of LPS by the liver; the deacylation rate was similar for LPS and LPS-HDL. AOAH-KO mice (closed triangle) lack AOAH (control). n = 3–6 mice/time point for each LPS preparation. Error bars = 1 SEM. Data combined from four experiments with consistent results. Effect of Kupffer cell (KC) depletion on LPS uptake and deacylation in the liver. Hepatic LPS uptake (A) and deacylation (B) were measured 4 h after i.v. injection of LPS or LPS-HDL into mice that had received either PBS-liposomes or clodronate (CLOD) liposomes 2 d earlier. KC depletion, documented by staining liver sections for F4/80-positive cells (data not shown), reduced hepatic uptake of LPS at this early time point but not that of LPS-HDL (A). Deacylation of both free LPS and HDL-bound LPS was reduced by approximately 20%. n = 3 mice/group. The experiment was repeated with similar results. **P < 0.01, ***P < 0.001.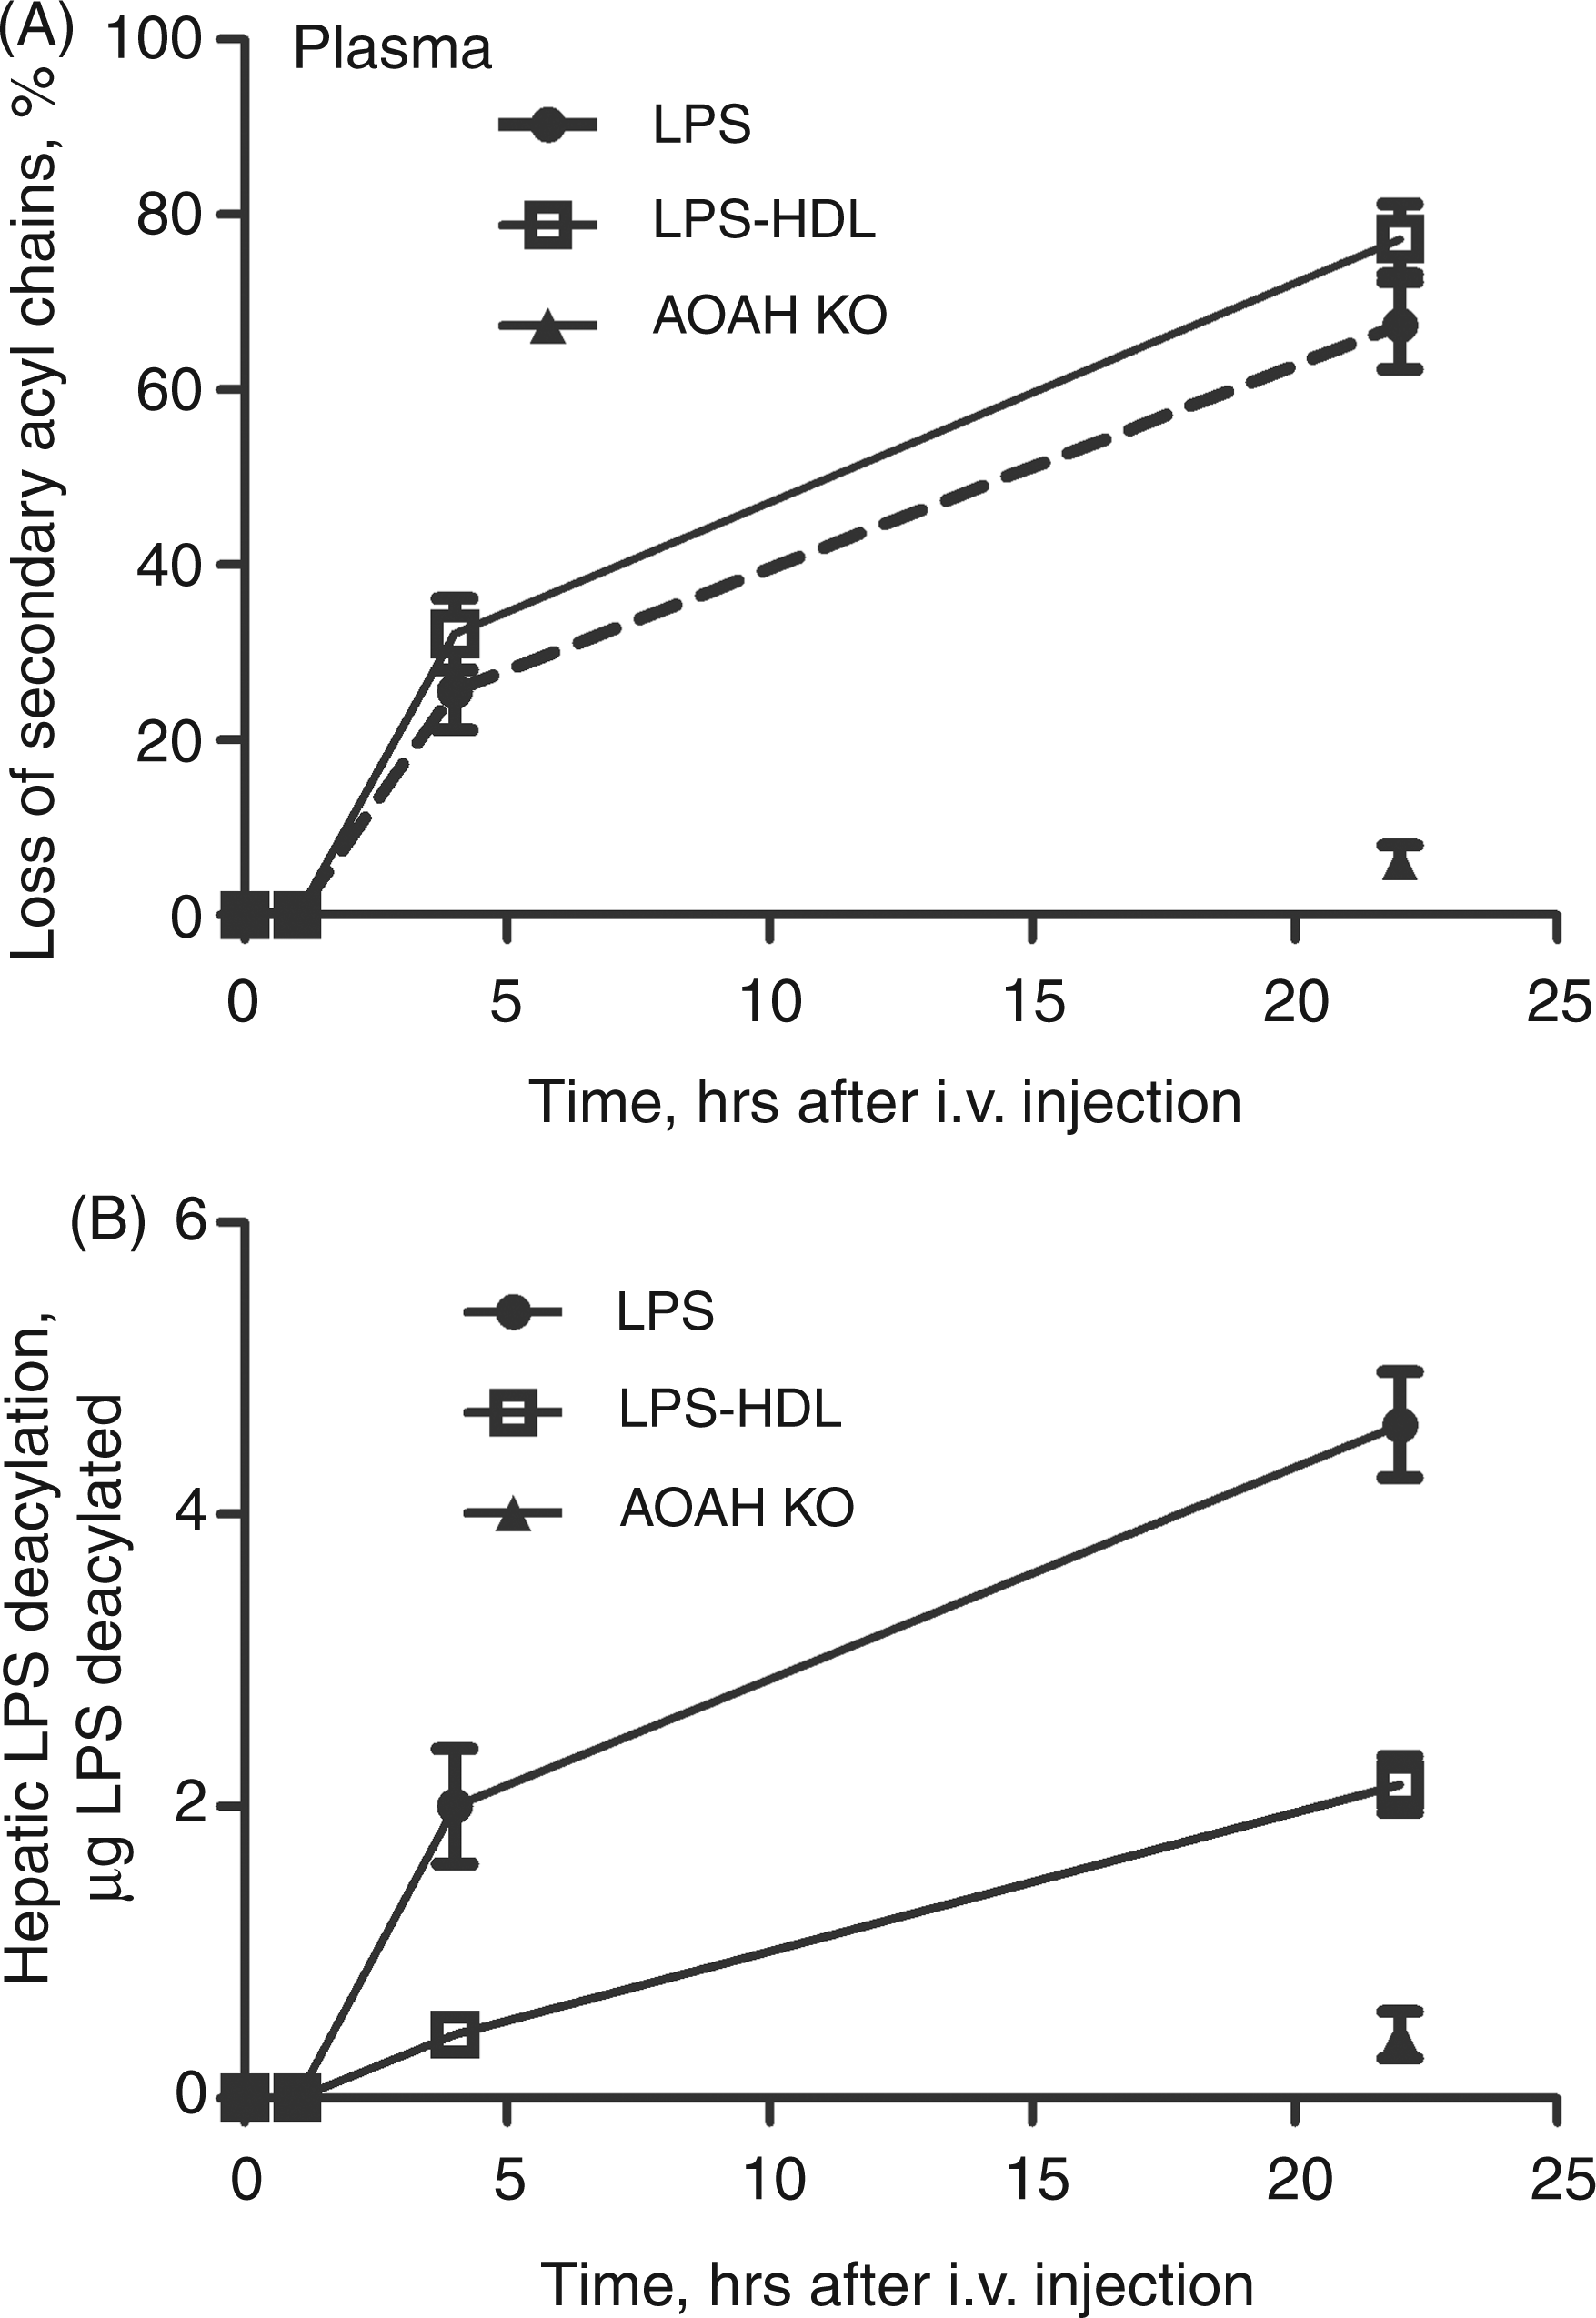
Discussion
How the liver disposes of bacterial endotoxin has intrigued investigators for many years. The liver’s ability to take up and inactivate LPS is thought to influence phenomena as diverse as energy intake, 40 carbohydrate and lipid metabolism (‘metabolic endotoxemia’), 41 alcoholic liver disease42,43 and immune responses in HIV-infected individuals. 44 Recent studies have also highlighted the important role that plasma lipoproteins can play in LPS clearance from the blood, and differences have been found in the ability of certain lipoproteins to transport and deliver LPS to hepatic cells. An apoE-rich emulsion reduced LPS uptake by the liver and increased delivery to hepatocytes, 45 for example, and chylomicrons, which may promote intestinal absorption of LPS, 46 increased hepatic uptake while shunting LPS away from KCs. 25
The present experiments were performed after we had observed that (i) almost all of the LPS that is taken up by the liver undergoes enzymatic deacylation (thus, inactivation) within 2 to 3 d 6 and (ii) the deacylating enzyme AOAH is produced by KCs and hepatic dendritic cells. 6 As others have reported that lipoprotein-bound LPS interacts directly with hepatocytes, which do not produce AOAH, 6 we wanted to know whether the LPS in LPS-HDL complexes also undergoes deacylation in the liver. We found that LPS and LPS-HDL were deacylated at approximately the same rate, despite striking differences in both the rate of LPS uptake by the liver and its intrahepatic location (much less of the LPS in LPS-HDL complexes was found near, or in, KCs during the first 4 h after injection; Figure 3). This result suggests that plasma AOAH, in addition to that released by KCs, deacylates LPS within sinusoidal blood or, possibly, within SECs, stellate cells or hepatocytes that have taken up both AOAH and LPS (or LPS-HDL) from the blood.
Some previous studies of LPS clearance used very large and undoubtedly non-physiological LPS inocula, whereas in others the LPS was injected directly into the portal vein, thus achieving very high intrasinusoidal LPS concentrations and minimizing mixing of LPS with blood constituents. We sought to avoid these problems by injecting small doses via the lateral tail vein. However, our conclusions regarding the localization of LPS in the liver may be limited by the possibility that detection of the FITC chromophore, even after Qdot amplification, will decrease as FITC-LPS aggregates disperse or FITC-LPS-HDL complexes break up in vivo. The apparent increase in sinusoidal and KC-associated FITC that occurred between 1 h and 4 h after injection of FITC-LPS-HDL (Figure 3D, E; Table 1) may thus reflect the loss of extrasinusoidal FITC signal as a result of dispersion of FITC-LPS within hepatocytes or other cells. It is also possible that the FITC-LPS linkage was disrupted in vivo; the conjugate was stable in ethanol, however, and neither FITC-glycine nor FITC-BSA was detectable in the liver following i.v. injection.
We conclude that the LPS in LPS-HDL complexes can remain sinusoidal for hours, become at least partially KC-associated, and undergo deacylation by AOAH. As AOAH-mediated deacylation inactivates LPS, further studies are needed to test the hypothesis that AOAH-mediated LPS inactivation ameliorates both metabolic and infectious diseases of the liver.
Footnotes
Funding
This work was supported by National Institutes of Health grants [AI-018188] and [AI-045896] from the National Institute of Allergy and Infectious Diseases; the Jan and Henri Bromberg Chair in Internal Medicine (UT-Southwestern); and, in part, by the Division of Intramural Research, NIAID, NIH.
Acknowledgements
We thank Dr Mingfang Lu for advice and helpful discussions and Patricia Thompson for making LPS-HDL complexes.