
Abstract
In innate immunity, dead and dying cells release internal constituents that can serve as damage-associated molecular patterns (DAMPs) or alarmins. This release occurs more abundantly during necrosis than apoptosis and may account for the differences in the immunologic properties of these death forms. To elucidate DAMP release in necrosis, we compared the levels of two nuclear molecules (DNA and HMGB1, a non-histone protein with alarmin activity) in media following necrosis of Jurkat T cells by freeze-thawing, ethanol, heat or hydrogen peroxide treatment. In our experiments, DNA release was measured by fluorimetry with the dye PicoGreen, while HMGB1 was measured by Western blotting. As the results of our study show, each form of necrosis is associated with a distinct pattern of DNA and HMGB1 release with respect to kinetics and amounts. Of these, freeze-thawing produced the highest and most rapid increase in HMGB1 and DNA levels, although the released DNA was subject to nuclease digestion; in addition, freeze-thawing led to the production of particles measured by flow cytometry. Together, these results indicate that experimental necrosis leads to diverse patterns of nuclear molecule release which could affect their immunologic activity.
Introduction
In innate immunity, molecules released by dead and dying cells can play a key role in stimulating responses via both TLR and non-TLR sensing systems. These molecules are structurally diverse and encompass both small molecules (e.g. monosodium urate and ATP) and large molecules (e.g. DNA, RNA and HMGB1).1–6 As a group, endogenous molecules that signal ‘danger’ and stimulate innate immunity are called damage-associated molecular patterns (DAMPs) by analogy with pathogen associated molecular patterns (PAMPs). DAMPs can serve as alarmins, although the term alarmin can be applied to other molecules that promote innate immunity and stimulate antigen-specific responses.7–9
DAMPs acquire their immunological activity following exposure on cells or release into the extracellular milieu where they can trigger various sensing systems.7–9 Among these DAMPs, nuclear molecules, both proteins and nucleic acids, can have important roles in inflammation, with HMGB1 serving as a prototype alarmin emanating from the nuclear compartment. HMGB1 is a non-histone nuclear protein that can bind DNA as an architectural element to regulate key processes such as recombination, repair and transcription.5,6 Once released from cells during activation or cell death, however, HMGB1 can induce cytokine production and other pro-inflammatory activities via interact with receptors that include TLR2, TLR4 and RAGE; these interactions may reflect HMGB1’s redox state, as well as binding of other molecules in the extracellular mileu, such as cytokines.10–14 While HMGB1 may have intrinsic immunologic activity, some molecules that acquire DAMP activity may be immunologically inert in their native form and must undergo structural changes to become fully active.7–9 For these molecules, immune activity may result from post-translational modification, enzymatic degradation or denaturation.
Once the DNA or RNA has left the dying or damaged cell, the display of DAMP activity may require association with binding molecules (e.g. HMGB1, LL37) to generate immunostimulatory activity.15–17 In contrast to PAMPs and DAMPs that stimulate surface receptors, DNA and RNA signal TLR and non-TLR receptors that are on the inside of cells; the location has suggested that the stimulation usually occurs during the course of intracellular infection with nucleic acids derived from the infecting organism. For DNA or RNA that is released from dying cells to trigger response via these receptors, however, a mechanism to promote uptake and access to internal receptors is necessary. Binding molecules may facilitate this uptake process, serving essentially as transfection agents. As such, the DAMP activity of DNA may be critically dependent on the presence of another DAMP, such as HMGB1, or a cathelicidin, such as LL37. Whatever the mechanism for stimulation, DAMPs, because they are ubiquitous, may represent a signaling system for danger that can apply to all tissues in the body.
The pathways of cell death are multiple, reflecting the variety of triggers and subsequent molecular events causing cellular demise. In the context of innate immunity, however, cell death has generally been dichotomized into apoptosis and necrosis.18–21 Apoptosis is a form of programmed cell death, in which the cell is systematically disassembled. In contrast, necrosis is a form of sudden death induced by a physical or chemical insult. Consistent with the differences in the mechanisms of death, cells dying by apoptosis and necrosis can differ in their immunologic properties, with apoptotic cells showing anti-inflammatory activity and necrotic cells pro-inflammatory activity. As necrosis causes a dramatic breakdown in cell permeability, it represents a setting in which internal components (including DAMPs) potentially have the greatest exposure to the immune system.22–27
The various triggers and course of necrotic cell death may determine its immunologic properties in both in vivo and in vitro experimental settings. While cell death can be monitored morphologically and biochemically in well-defined apoptosis models, necrosis has been generally modeled using physical or chemical injury. We therefore investigated the release of DNA and HMGB1 during various forms of experimental necrosis to elucidate any patterns that may affect immunologic activity. We have chosen these two nuclear molecules because of evidence for their immunological activity, their concurrent expression in the blood in settings of cell death and data indicating the importance of their association in promoting inflammation. For these experiments, we used the Jurkat human T cell lymphoma line as a model and induced necrosis by freeze-thawing, heat, ethanol or high concentrations of hydrogen peroxide, common treatments to kill cells for immunologic studies.28–34
In the results presented herein, we demonstrate striking differences in the in vitro release of DNA and HMGB1 from necrotic cells, depending on the agent used to induce necrosis. Specifically, we found rapid and abundant release of HMGB1 into the media immediately following freeze-thawing at levels higher than that resulting from other forms of necrotic cells death. In addition, while DNA release after freeze-thaw was the greatest, the DNA was subject to nuclease digestion. Together, these results suggest that the pattern of release of DNA and HMGB1 from cells varies during necrosis. While clarifying nuclear dynamics in experimental systems, these findings may have a clinical application, with events following freeze-thaw potentially relevant to ‘cryoshock’ that can occur after cryoablation of tumors.35,36
Materials and methods
Reagents and cell culture
All chemicals were purchased from Sigma-Aldrich (St Louis, MO, USA) except where otherwise indicated. Jurkat (human T cell lymphoma) cells were purchased from the American Type Culture Collection (Manassas, VA, USA) and were cultured in complete RPMI including 20 µg/ml of gentamicin (Gibco, Carlsbad, CA, USA) and 10% FBS (HyClone, Logan, UT, USA). Prior to experiments, Jurkat cells were collected by centrifugation at 500 g for 5 min and re-suspended at a concentration of 2 × 10⁶ cells/ml in serum-free Opti-MEM medium (Gibco) including 20 µg/ml of gentamicin.
Induction of cell death
Necrosis was induced in 3 × 10⁶ Jurkat cells in a volume of 1.5 ml by freeze-thaw treatment consisting of 3 cycles of freezing in liquid nitrogen for 2 min followed by thawing at 37°C for 4 min; incubation at 56°C for 30 min; 0.1% hydrogen peroxide; ethanol at a concentration of 70% for 10 min. After induction of cell death, cells were incubated in six-well plates at 37°C in a humidified atmosphere containing 5% CO2 for indicated time periods. When cell death was induced by ethanol, the cell preparation was centrifuged at 500 g for 10 min and re-suspended in fresh, serum-free medium prior to the incubation. Non-treated, living cells served as controls.
Cell death analysis by FACS
Thirty min and 6 h after induction of cell death, cells and cell remnants were collected by centrifugation at 500 g and re-suspended in Annexin-binding buffer (consisting of 10% PBS, 90% 10 mM HEPES/NaOH, 140 mM NaCl, and 2 mM CaCl2 adjusted to pH 7.4). Three hundred microliters of this cell suspension were incubated with 5 µl of 1 mg/ml propidium iodide (Sigma-Aldrich) and 5 µl FITC-labeled annexin V (BD Biosciences Pharmingen, San Diego, CA, USA) for 15 min, then examined with a BD FACScan flow cytometer. For further analysis, FlowJo flow cytometry software was used (Tree Star, Inc., Ashland, OR, USA). In addition to flow cytometry, cell morphology was examined with an Olympus IX51 microscope (Olympus Optical Co., Ltd, Tokyo, Japan).
Release of HMGB
Cell death was induced in Jurkat cells as described above. At time points indicated, supernatants were collected by centrifugation at 500 g for 5 min. Supernatants were processed immediately or stored at −80°C until use. Supernatants were concentrated ≥12.5-fold using 10-k Amicon Ultra centrifugal filters (Millipore, Billerica, MA, USA) according to the manufacturer’s recommendation. Four microliters of each sample, as well as standards (histidine-tagged recombinant human HMGB1; MyBiosource.com, San Diego, CA, USA), were re-suspended in XT reducing sample buffer (Bio-Rad, Hercules, CA, USA), heated at 93°C for 4 min and electrophoresed on a 26-well Criterion™ XT Precast 4–12% gradient, 1.0 mm thick gel (Bio-Rad) using Bio-Rad XT MOPS SDS running buffer.
Blotting was performed with a PVDF membrane using 20% methanol-192 mM glycine-25 mM Tris. The membrane was blocked with PBS containing 5% w/v blotting grade dry milk and 2% w/v BSA plus 0.1% v/v Tween 20, and incubated for 16–18 h at 4°C with anti-HMGB-1 purified mouse monoclonal Ab (clone 115603; R&D Systems, Minneapolis, MN, USA) at a final concentration of 2 µg/ml in block buffer. The membrane was washed with PBS including 0.05% Tween 20 (PBS-T), then incubated with 10 ng/ml stabilized goat anti-mouse HRP-conjugated secondary Ab (Thermo Fisher Pierce, Rockland, IL) at room temperature (22°C) for 1 h. After washing with PBS-T, bound Ab was detected by enhanced chemiluminesence using Supersignal West Femto maximum sensitivity substrate (Pierce, Rockford, IL, USA) following the manufacturer’s instructions, and imaged on a Fluorchem 8900 instrument (Alpha Innotech, San Leandro, CA, USA).
PicoGreen DNA assay
At indicated time points after induction of cell death, supernatants were collected by centrifugation at 500 g for 5 min. Cleared supernatants were diluted 1/10 with TE buffer (10 mM Tris plus 1 mM EDTA, pH 8.8). A standard curve of calf thymus DNA was prepared. Samples and standards were placed in black 96-well microtiter plates (Greiner Bio-One, Monroe, NC, USA) and mixed 1:1 with Quant-iT™ PicoGreen dsDNA Reagent (Molecular Probes, Eugene, OR, USA) diluted 1/200 with TEN buffer (TE buffer pH 8.8 containing 100 mM NaCl). After 5 min of incubation, the fluorescence was measured with a Tecan GENios microplate reader (Salzburg, Austria) at an excitation wavelength of 485 nm and emission wavelength of 535 nm.
Nuclease inhibition
Induction of cell death followed the protocols described above. Prior to cell death induction, however, either EDTA (to a final concentration of 25 mM), ZnCl2 (final concentration 0.1 mM), Pierce Protease Inhibitor Cocktail (according to the manufacturer’s instructions) or z-VAD-fmk (final concentration 100 µM) were added. After inducing cell death, cells and cellular remnants were removed via centrifugation at 500 g for 5 min. Supernatants were incubated at 37°C in a humidified, 5% CO2 atmosphere and finally used for PicoGreen staining at indicated time points.
Detection of particles by FACS analysis
Thirty min or 2 h after cell death induction, media were centrifuged at 500 g for 5 min to remove cells and larger debris. Supernatants including particles were further diluted 1:1 with fresh medium. Three hundred microliters of diluted supernatants were labeled with 12 µl of Syto® 13 Green (SYTO13) fluorescent nucleic acid stain (Invitrogen; diluted 1:1000 in PBS) for 15 min. After labeling, 100 µl samples were further diluted 1:4 with serum-free medium. Particle samples were detected by side scatter (SSC threshold = 175) or fluorescence staining (FL1 threshold = 350). Particle counts were calculated from the number of counts/time and the flow rate of the instrument. 37
Electron microscopy
For transmission electron microscopy, particles were generated by either freeze-thaw treatment or, as a control for apoptosis, staurosporine (5 µM for 24 h), in serum-free Optimem media. Following centrifugation at 500 g for 5 min to remove cells and larger debris, MPs were isolated by centrifugation at 20,800 g for 30 min and were then fixed with 2.5% glutaraldehyde in cacodylate buffer solution (pH 7.4, containing sucrose) for 2 h at room temperature. MPs were washed with cacodylate buffer solution and post-fixed with 1.0% osmium tetroxide in cacodylate buffer for 1 h at 4°C. Particles were washed with deionized distilled H2O and dehydrated by ethanol. During dehydration, the particles were post-fixed with 1.0% uranyl acetate in 70% ethanol for 1 h at 4°C, followed by embedding in Araldite and cutting with an ultramicrotome (Reichert Ultracut, Vienna, Austria). Sections were examined and photographed with a Zeiss EM10 electron microscope (Carl Zeiss AG, Oberkochen, Germany) and a Gatan SC1000 OriusTM CCD camera in combination with the Digital MicrographTM software (Gatan GmbH, Munich, Germany). Images were adjusted for contrast and brightness using Adobe Photoshop CS (Adobe, San Jose, CA, USA).
Results
Induction of necrotic cell death by different physical and chemical inducers
To determine the release of DNA and HMGB1 during necrosis, we used a series of commonly used inducers of necrosis (hydrogen peroxide 0.1% and ethanol 70%) and physical means (freeze-thaw and heat) as models. As determined by flow cytometry after staining with annexin V and propidium iodide, significant cell death occurred in all treatment groups. Upon freeze-thawing, heat and ethanol treatment, virtually all cells died within the first 30 min, as shown by enhanced staining with annexin V and propidium iodide. In contrast, ethanol-treated cells showed only weak staining for annexin V, although these cells bound propidium iodide. In contrast to the other inducers of necrosis, hydrogen peroxide caused a more protracted cell death process although, after 6 h of this treatment, almost all cells showed enhanced annexin V and propidium iodide staining (Figure 1).
FACS analysis of necrotic cell preperations. Jurkat cells in serum-free medium were induced to undergo necrosis by freeze-thaw (FT), heat, H2O2, ethanol (EtOH) or no treatment (controls). Following incubation at 37°C for 30 min or 6 h, cells were collected by centrifugation, stained with propidium iodide (PI) and (FITC) -labeled annexin V for analysis by flow cytometry. Annexin V binding is shown on the x-axis and propidium iodide binding is shown on the y-axis.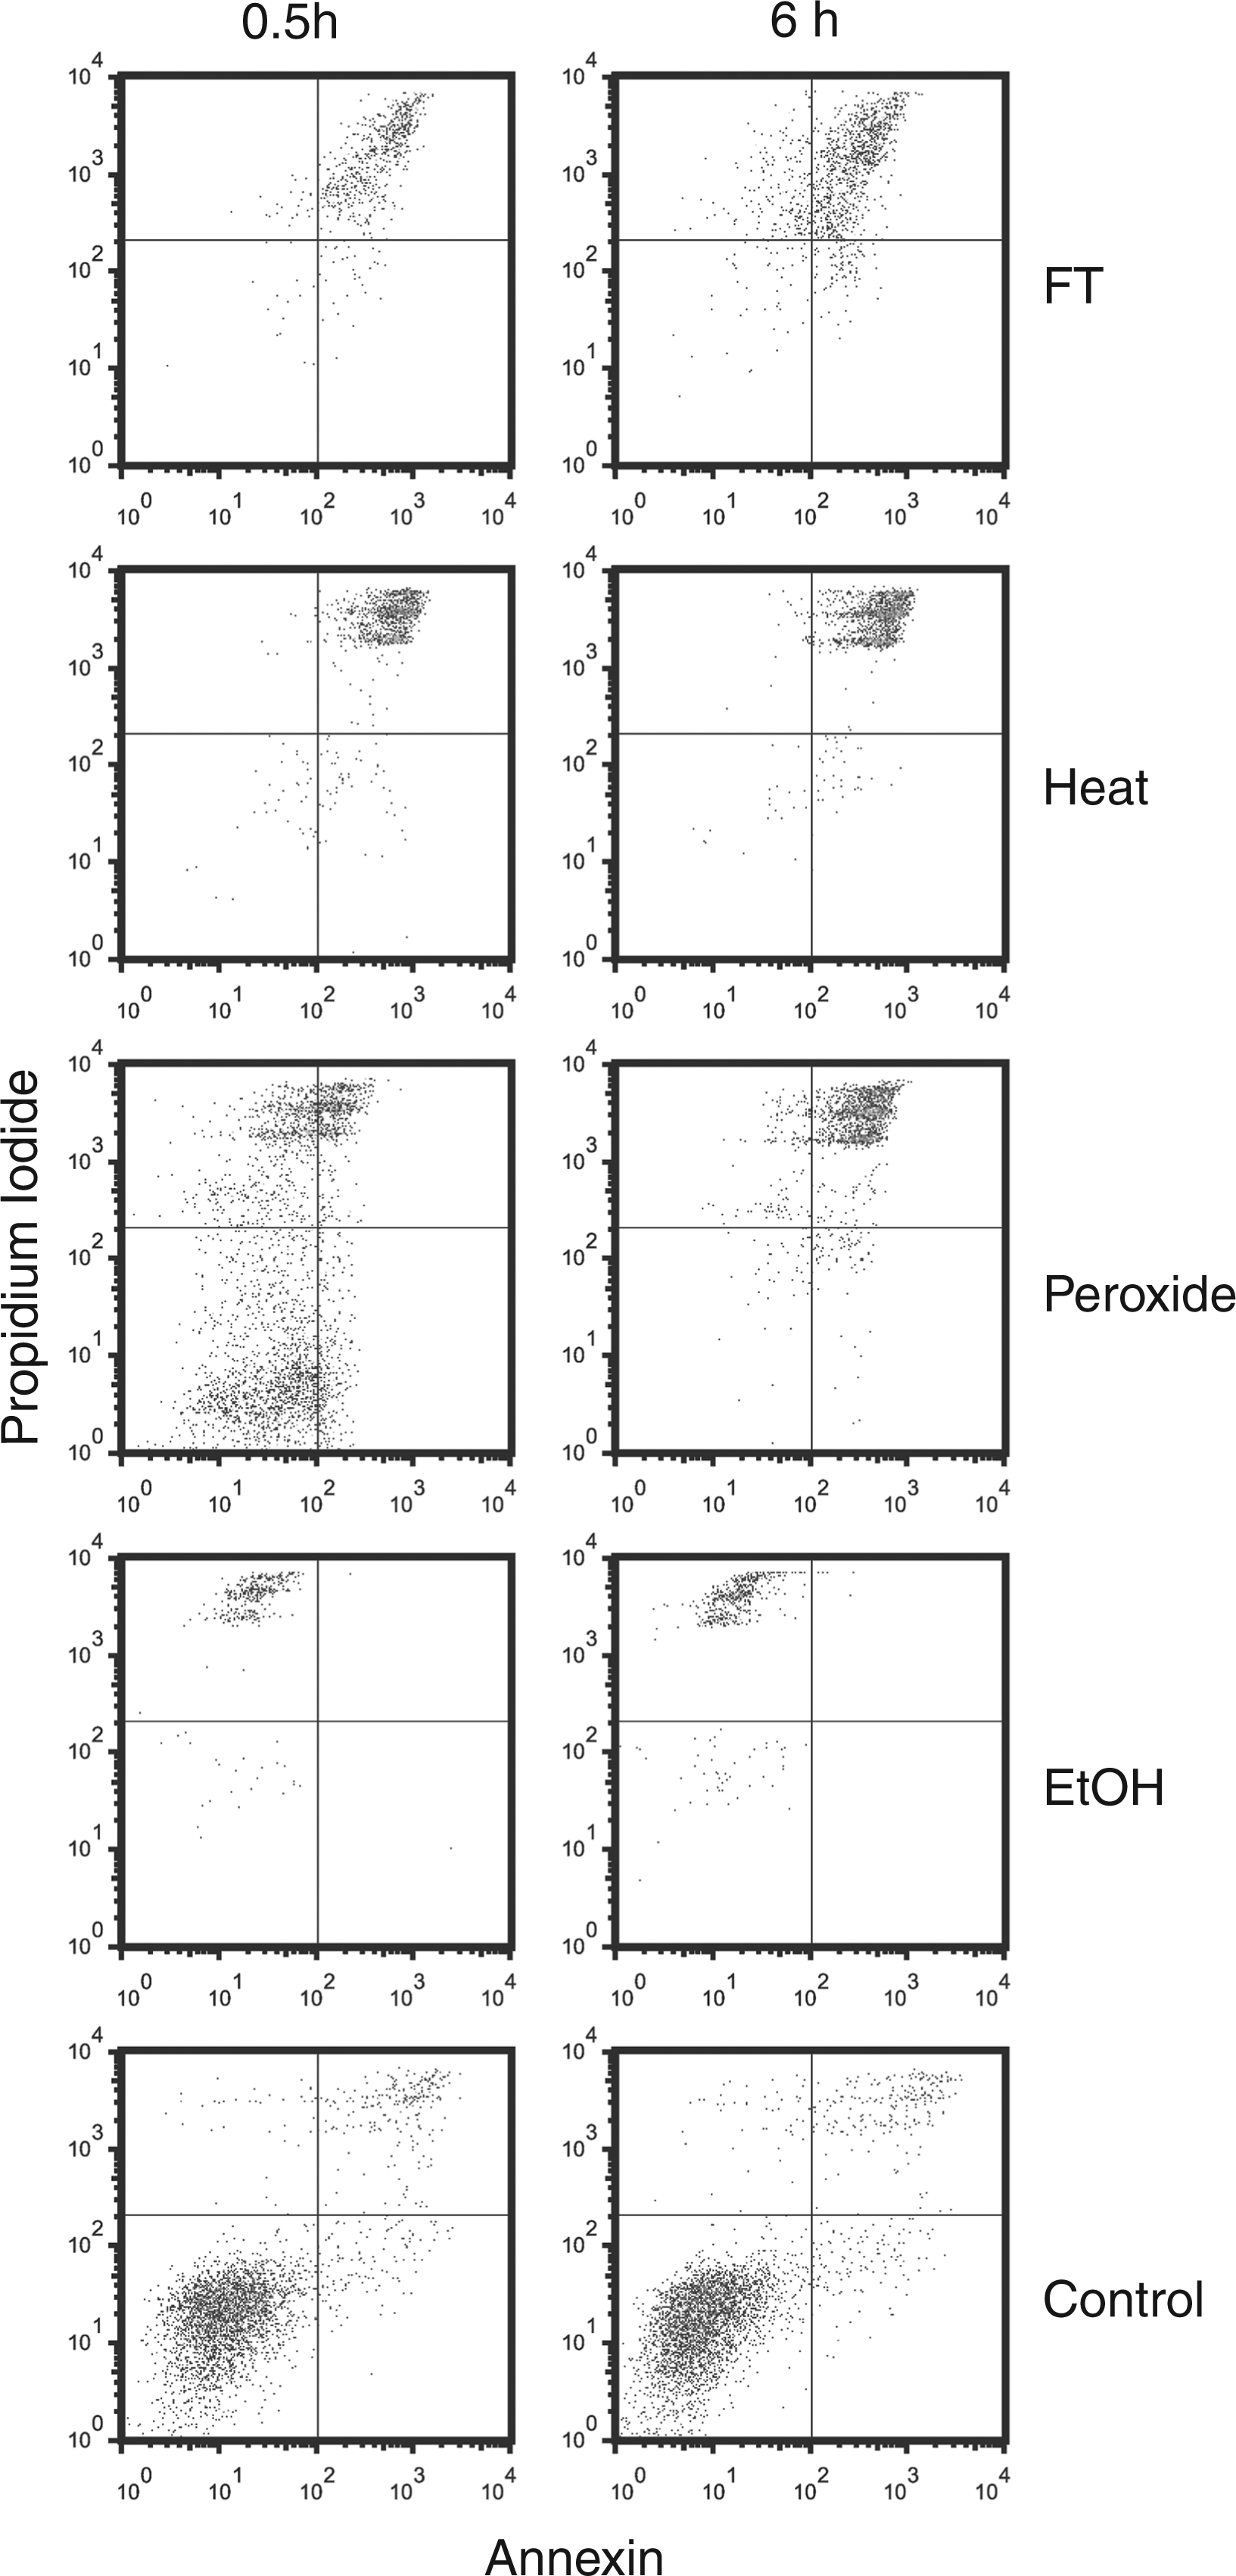
In addition to flow cytometry, we examined treated cells by light microscopy. We found that the overall structure of cells appeared intact upon treatment with ethanol, hydrogen peroxide and heat, whereas freeze-thawing led to extensive fragmentation of cells, as well as loss of intact cells that could be obtained by centrifugation (Figure 2). In addition, aggregates or extended structures were visible in cell preparations subjected to freeze-thaw. These structures may correspond to membrane fusions which have been observed in certain freeze-thaw systems.
38
Microscopic analysis of dead cell preparations. Following treatments to induce necrosis, cell preparations were analyzed by light microscopy. The figure depicts cells treated with freeze-thaw (A and B), heat (C), hydrogen peroxide (D), ethanol (E) and control (F). The bar indicates 200 µm.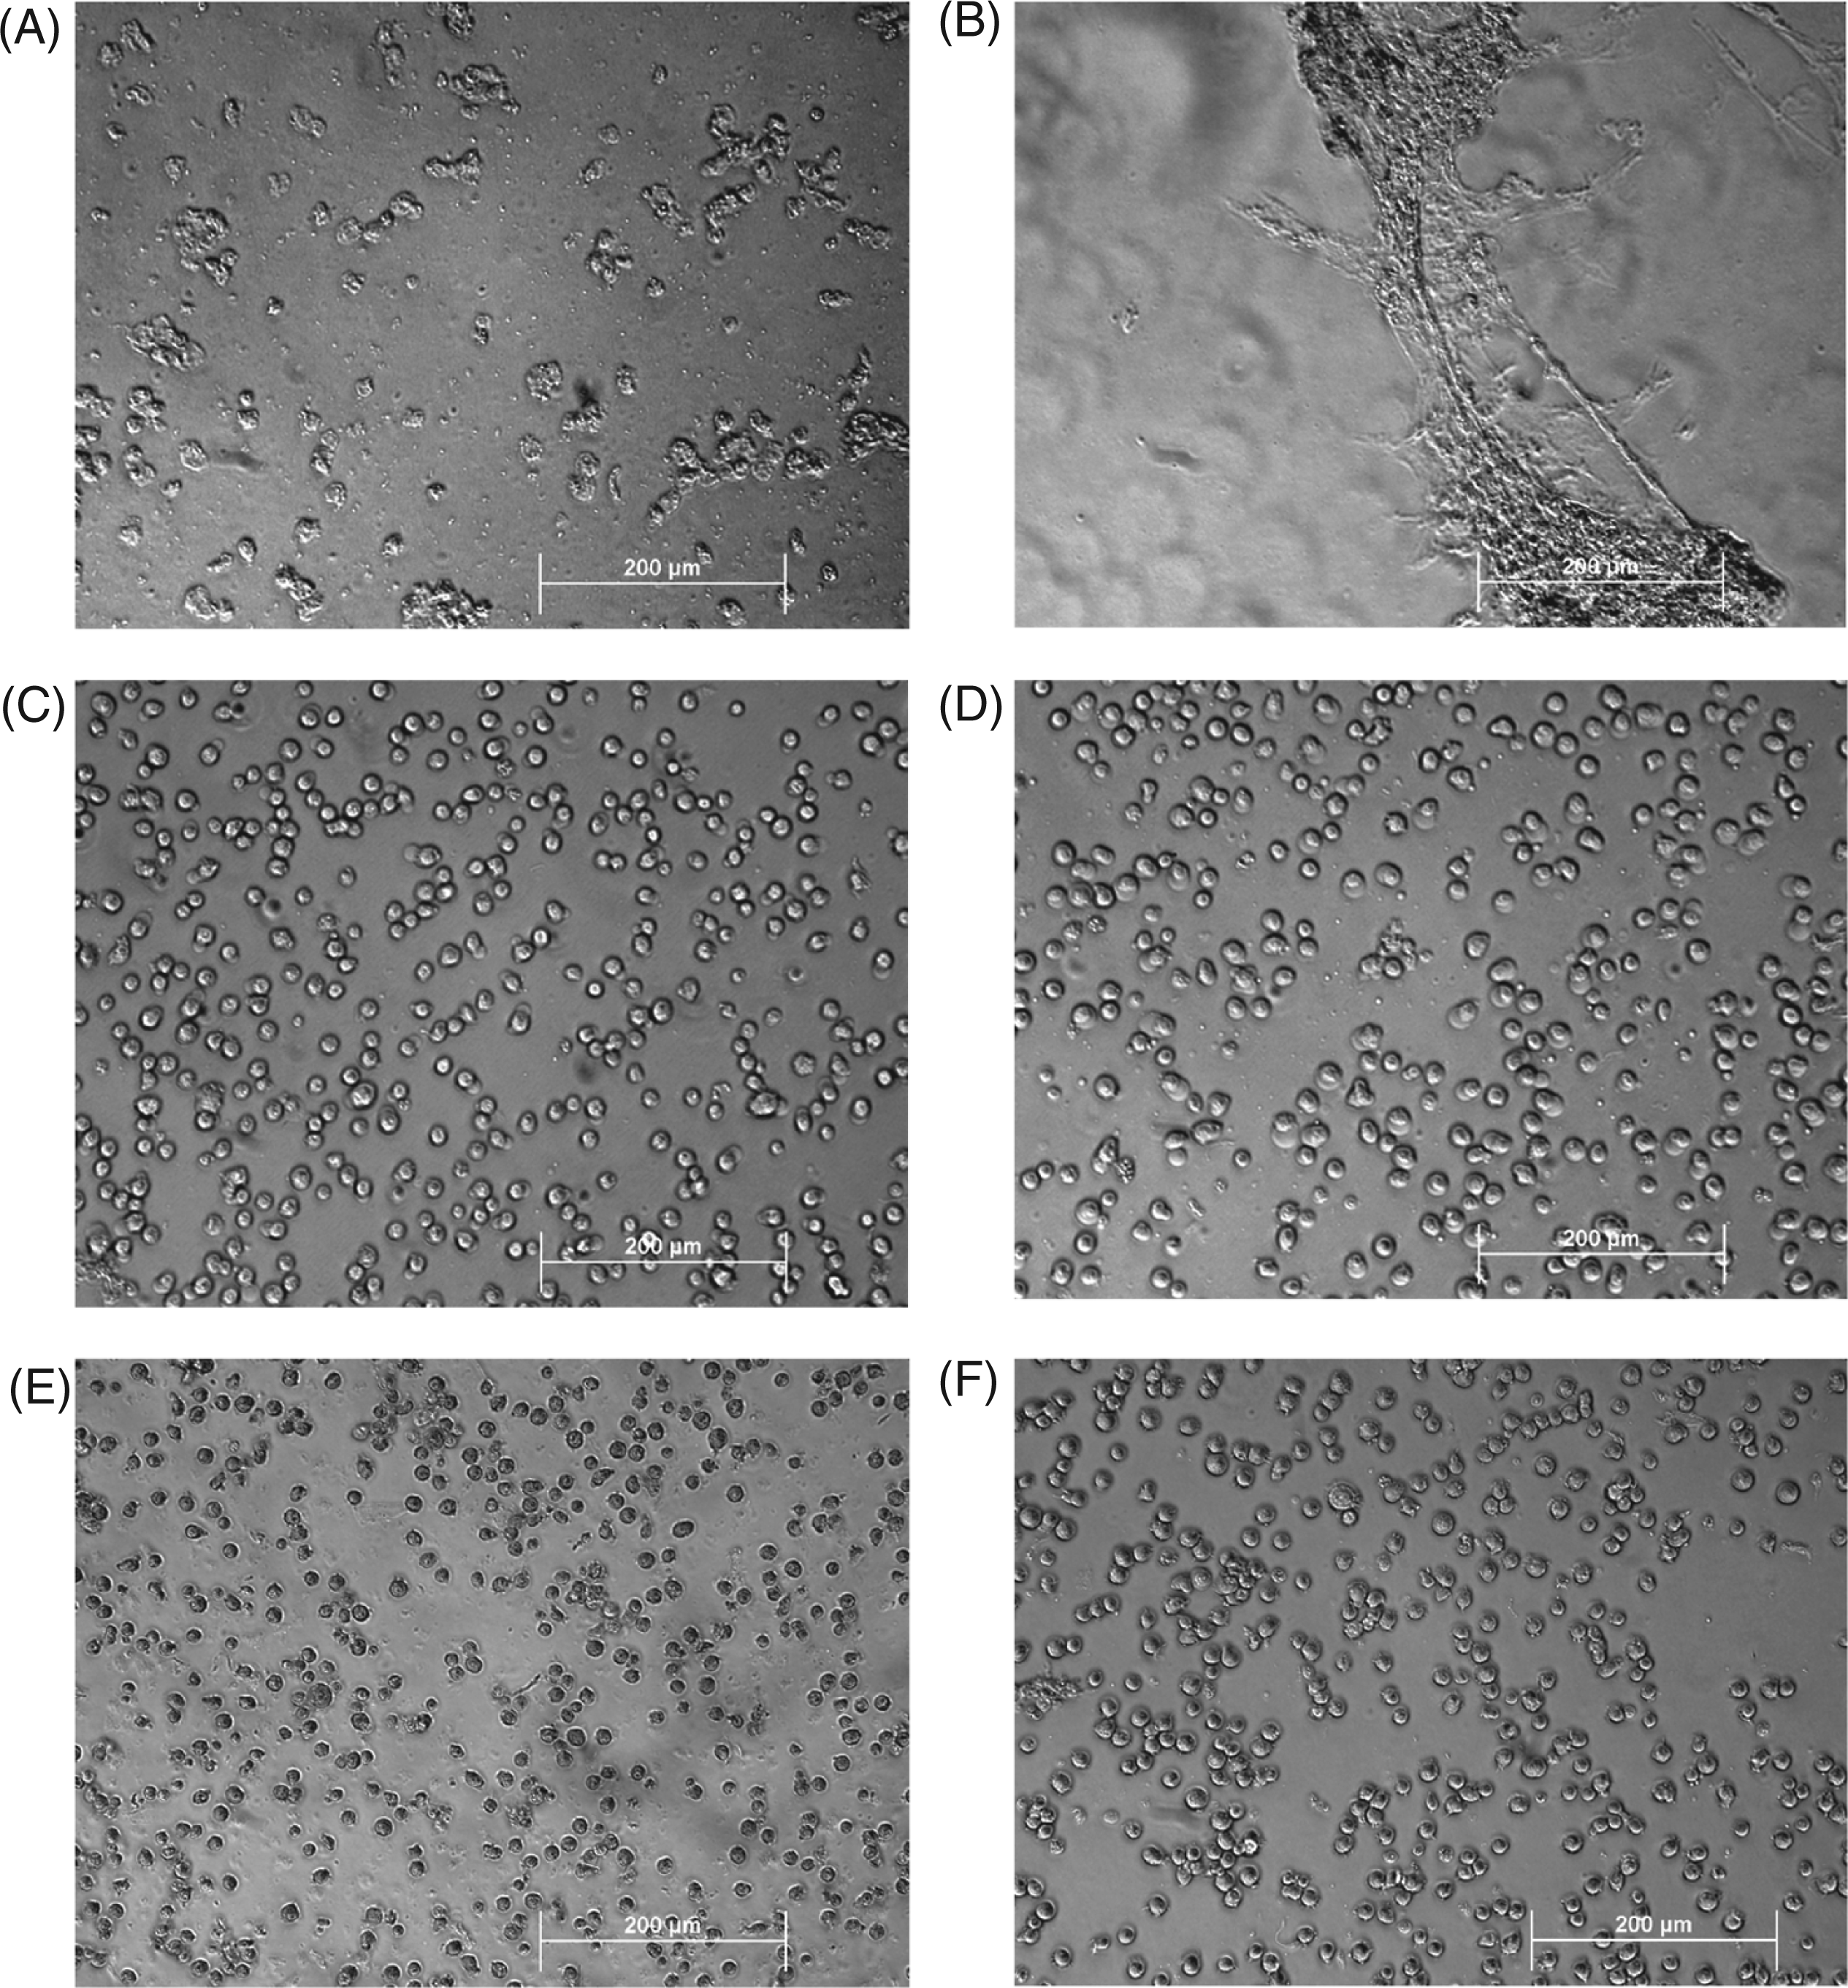
Release of HMGB1
As shown in previous studies, HMGB1 can be released from cells dying by necrosis,23,24 although the effects of different inducers of necrosis have been not studied extensively. In the current studies, we therefore assessed the extent and kinetics of HMGB1 release during necrosis, as well as subsequent stability. As results of these studies showed, the extent of HMGB1 release differed markedly among necrotic death models. Thus, with freeze-thaw treatment, HMGB1 in the media was detectable at the earliest time points analyzed. These levels remained high throughout the period of incubation (Figure 3).
The kinetics of HMGB1 release by necrotic cells. Jurkat cells in serum-free medium were induced to undergo by freeze-thaw, heat, H2O2, ethanol or no treatment (controls), and incubated at 37°C for the times indicated. Culture media were concentrated and then examined by Western blotting with protein detection by ECL. As controls for HMGB1 detection, 100 ng, 50 ng and 25 ng of recombinant hHMGB1-histidine tagged protein were analyzed. Figure is a digital image of a blot taken with an Alpha Innotech digital imager.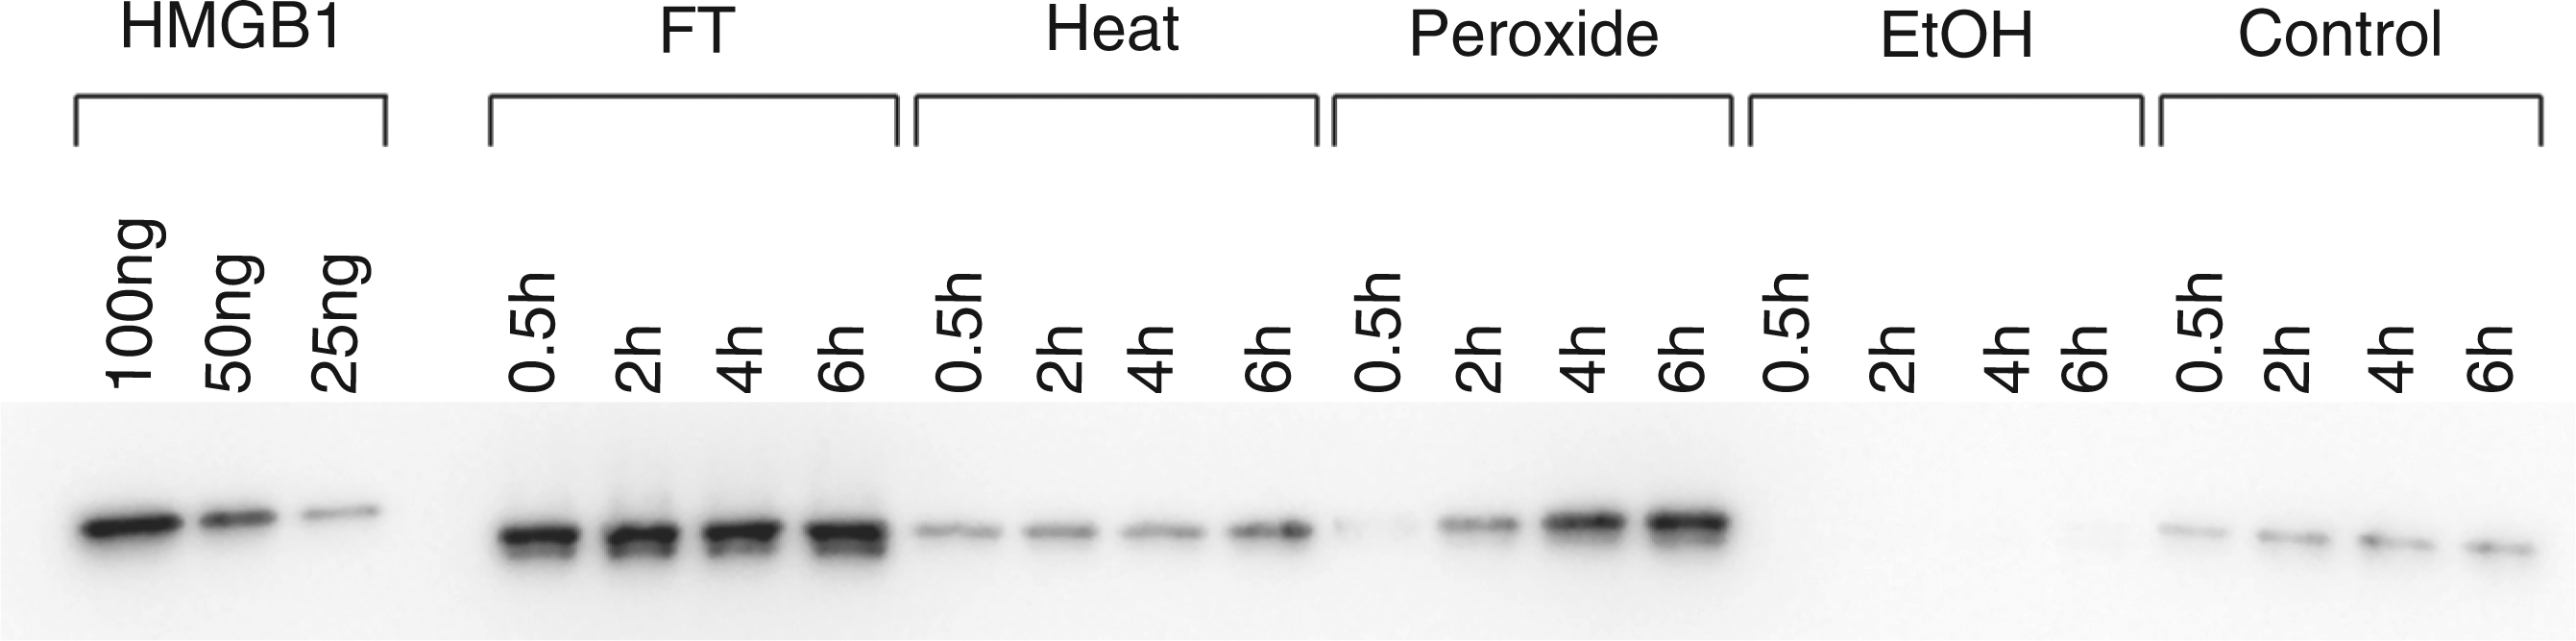
Among other inducers of necrosis, heat and hydrogen peroxide treatment also caused the release of HMGB1, although the amounts were much less than those released by freeze-thawing. With hydrogen peroxide treatment, the HMGB1 concentration in the supernatants gradually increased over time. After treatment with ethanol, however, the amount of released HMGB1 appeared even lower than that released from living control cells. These findings support the idea that macromolecules may be ‘fixed’ by ethanol and show only limited release from the cell.
Release of DNA
We next investigated DNA release from cells during necrosis, measuring DNA in supernatants using PicoGreen which binds primarily to double stranded (ds) DNA. As these studies showed, release and subsequent stability of DNA differed among the models of necrosis. Thus, after freeze-thawing, cells rapidly released high amounts of DNA, which then underwent extensive loss. In the first 2 h, more than 50% of the initially released DNA was no longer detectable with PicoGreen (Figure 4). Subsequent incubation for up to 48 h led to further DNA degradation and a decline of DNA.
Kinetic analysis of DNA release from necrotic cells. Jurkat cells in serum-free medium were induced to undergo necrosis by freeze-thaw, heat, H2O2, ethanol or no treatment (controls), then incubated at 37°C for 30 min, 2 h, 4 h and 6 h. Samples of culture supernatant were cleared of cells, then examined for DNA content in a PicoGreen® DNA assay. Data are representative of experiments performed at least three times. Error bars are present but are visible only for the freeze-thaw treatments.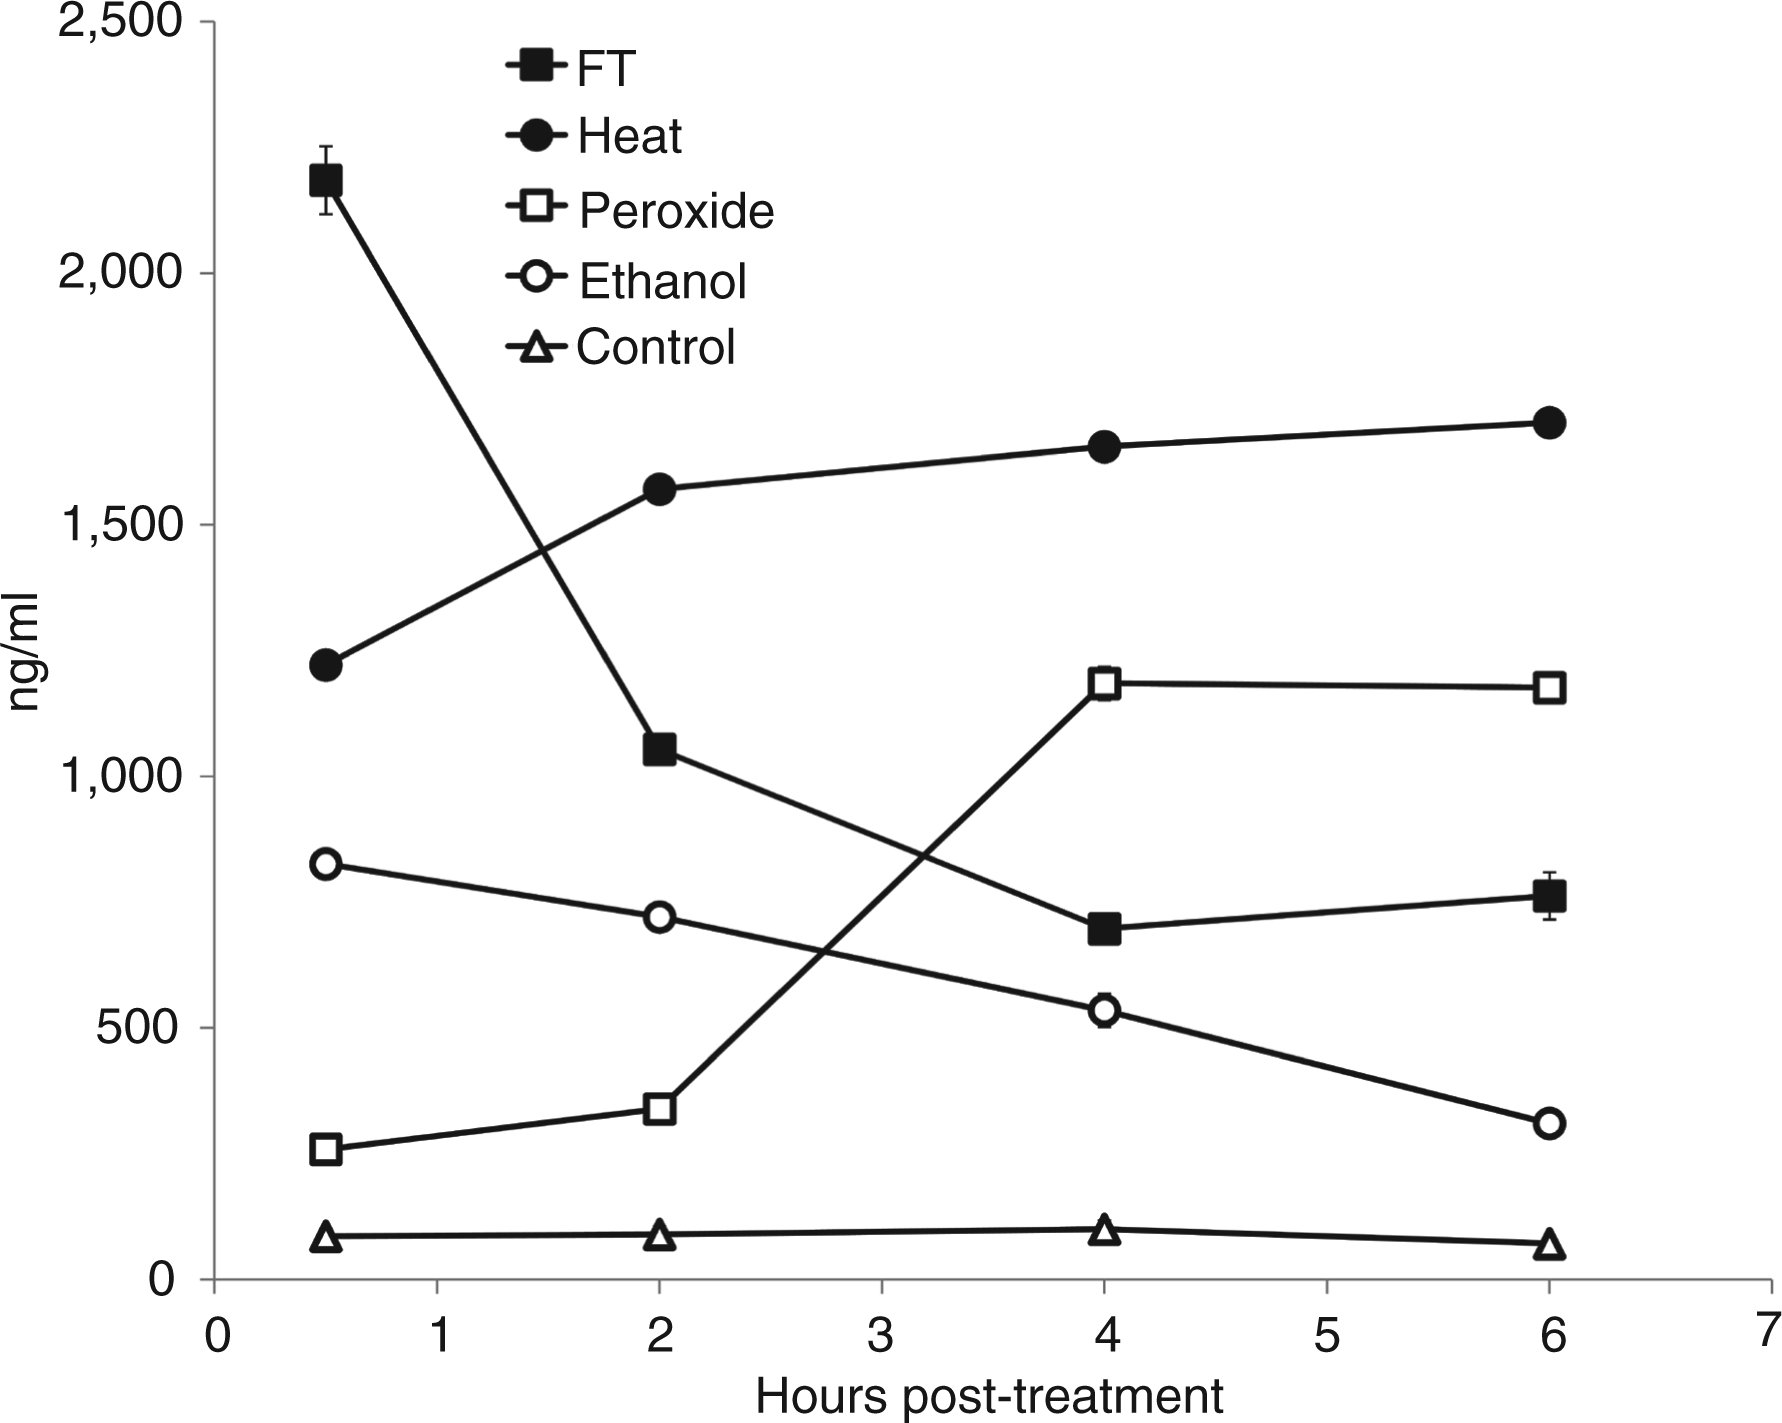
In contrast to the effects of freeze-thaw, heat led to less extensive DNA release but the levels did not decline, whereas ethanol treatment produced lower DNA levels which declined gradually with further incubation (Figure 4). In contrast, DNA release by hydrogen peroxide-treated cells increased after 2–3 h and peaked after 6 h of treatment; this response paralleled the increase of annexin V and propidium iodide-positive cells of the flow cytometer analysis (Figure 1). These results again demonstrate a more prolonged process of cell death. Finally, DNA release from living cells was low and DNA levels in the supernatants stayed relatively stable over time.
Inhibition of DNA degradation
To investigate the nucleases degrading DNA during freeze-thaw, we added different enzyme inhibitors and measured DNA in supernatants over time. In these experiments, we found that EDTA could inhibit DNA degradation; this finding suggests a role of divalent cations on enzyme activity (Figure 5). In contrast, ZnCl2, another DNase inhibitor, did not prevent DNA degradation (data not shown). Similarly, zVAD and the protease inhibitor cocktail did not affect DNA levels in the supernatants (data not shown), suggesting that caspases and proteases did not play a significant role in the induction of a DNase activity or DNA degradation in the preparations.
Effect of EDTA on DNA released from cells following freeze-thaw treatment. Jurkat cells in serum-free medium were subjected to freeze-thaw or to no treatment (controls) with or without the addition of EDTA to a final concentration of 25 mM before treatment. Following this treatment, cells were removed from the media by centrifugation and then incubated at 37°C for 30 min, 4 h or 22 h. Samples of the culture supernatants were then tested for DNA content by the PicoGreen assay. Results presented are representative of at least three experiments.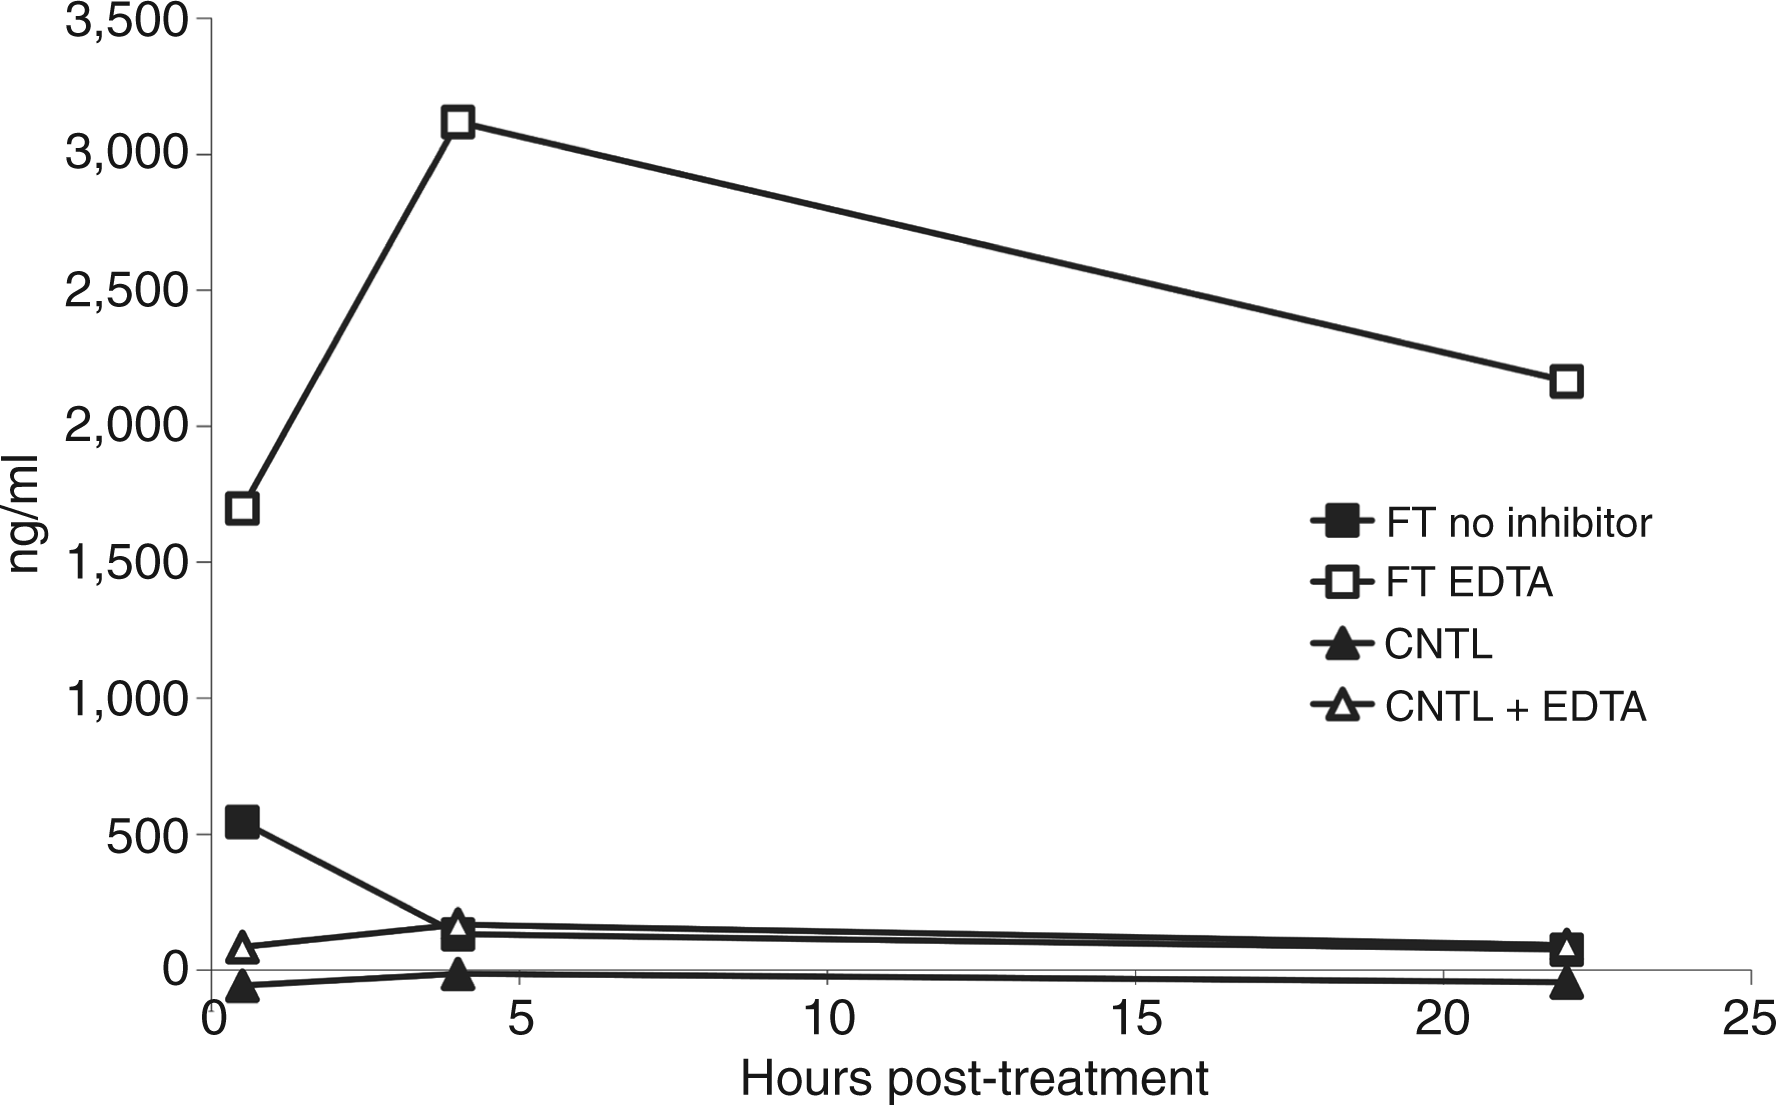
Release of particles
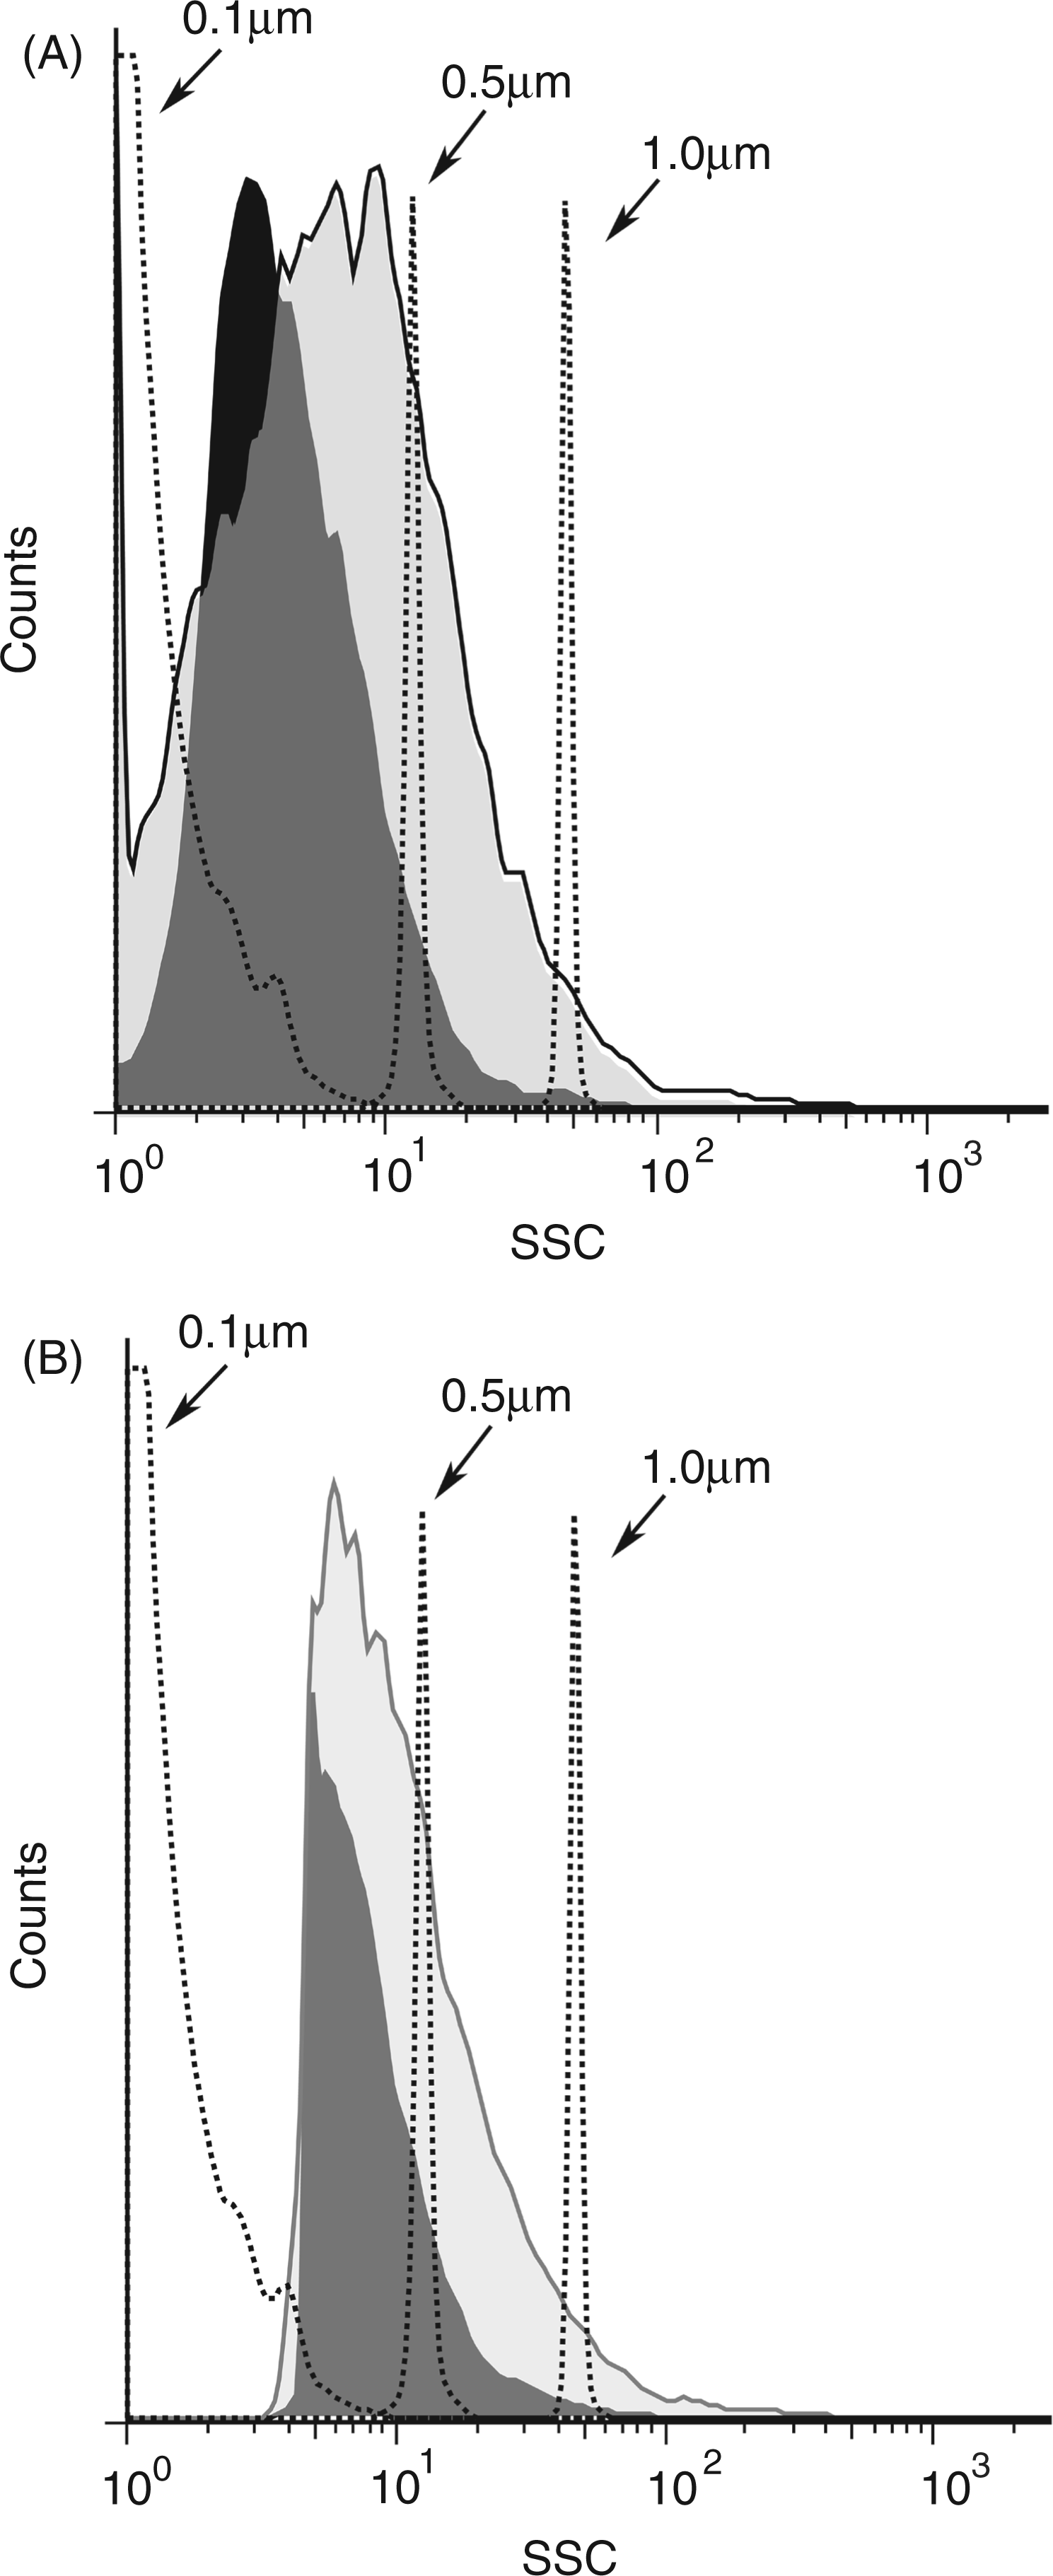
Among other structures that can be released from dead and dying cells, microparticles are small membrane-bound vesicles that can contain both DNA and HMGB1.6,37 To determine whether particles are generated during necrosis, FACS analysis was performed, assaying particles by light scatter, as well as staining with dye SYTO13 which binds nucleic acids and allows detection of a broader array of particles than does light scatter. Controls in these experiments included microparticles from cultures of Jurkat cells treated with staurosporine to induce apoptosis. As data in Figure 6 indicate, freeze-thaw treatment leads to the abundant production of particles detectable by both analytic approaches. These particles are in the size of range of microparticles produced by Jurkat cells undergoing apoptosis although the distribution indicated that particles were, in general, smaller (Figure 7). As the number of particles measured by SYTO13 staining exceeded that detected by light scattering, these findings suggest that many of the particles produced may be below the size range that can be detected by light scattering. As previous studies showed, particles below 0.2 µm cannot be readily measured by light scatter.
37
Production of particles by necrosis. Jurkat cells in serum-free medium were induced to undergo necrosis by freeze-thaw, ethanol, heat, H2O2, or no treatment (controls) and then incubated at 37°C for 30 min or 2 h. The media were centrifuged to remove cells and particles measured by FACS using either side scatter or staining with SYTO13 for particle detection. Size distribution of particles induced by necrosis. Jurkat cells in serum-free medium were induced to undergo necrosis by freeze-thaw or apoptosis by treatment with staurosporine at 1 µM for 18 h. Cells were centrifuged and then analyzed by size distribution by FACS collecting data by fluorescence (A) or side scatter (B). The dark shaded area indicates particles from freeze-thaw while the light shaded area represents particles from cultures treated with stauropsorine.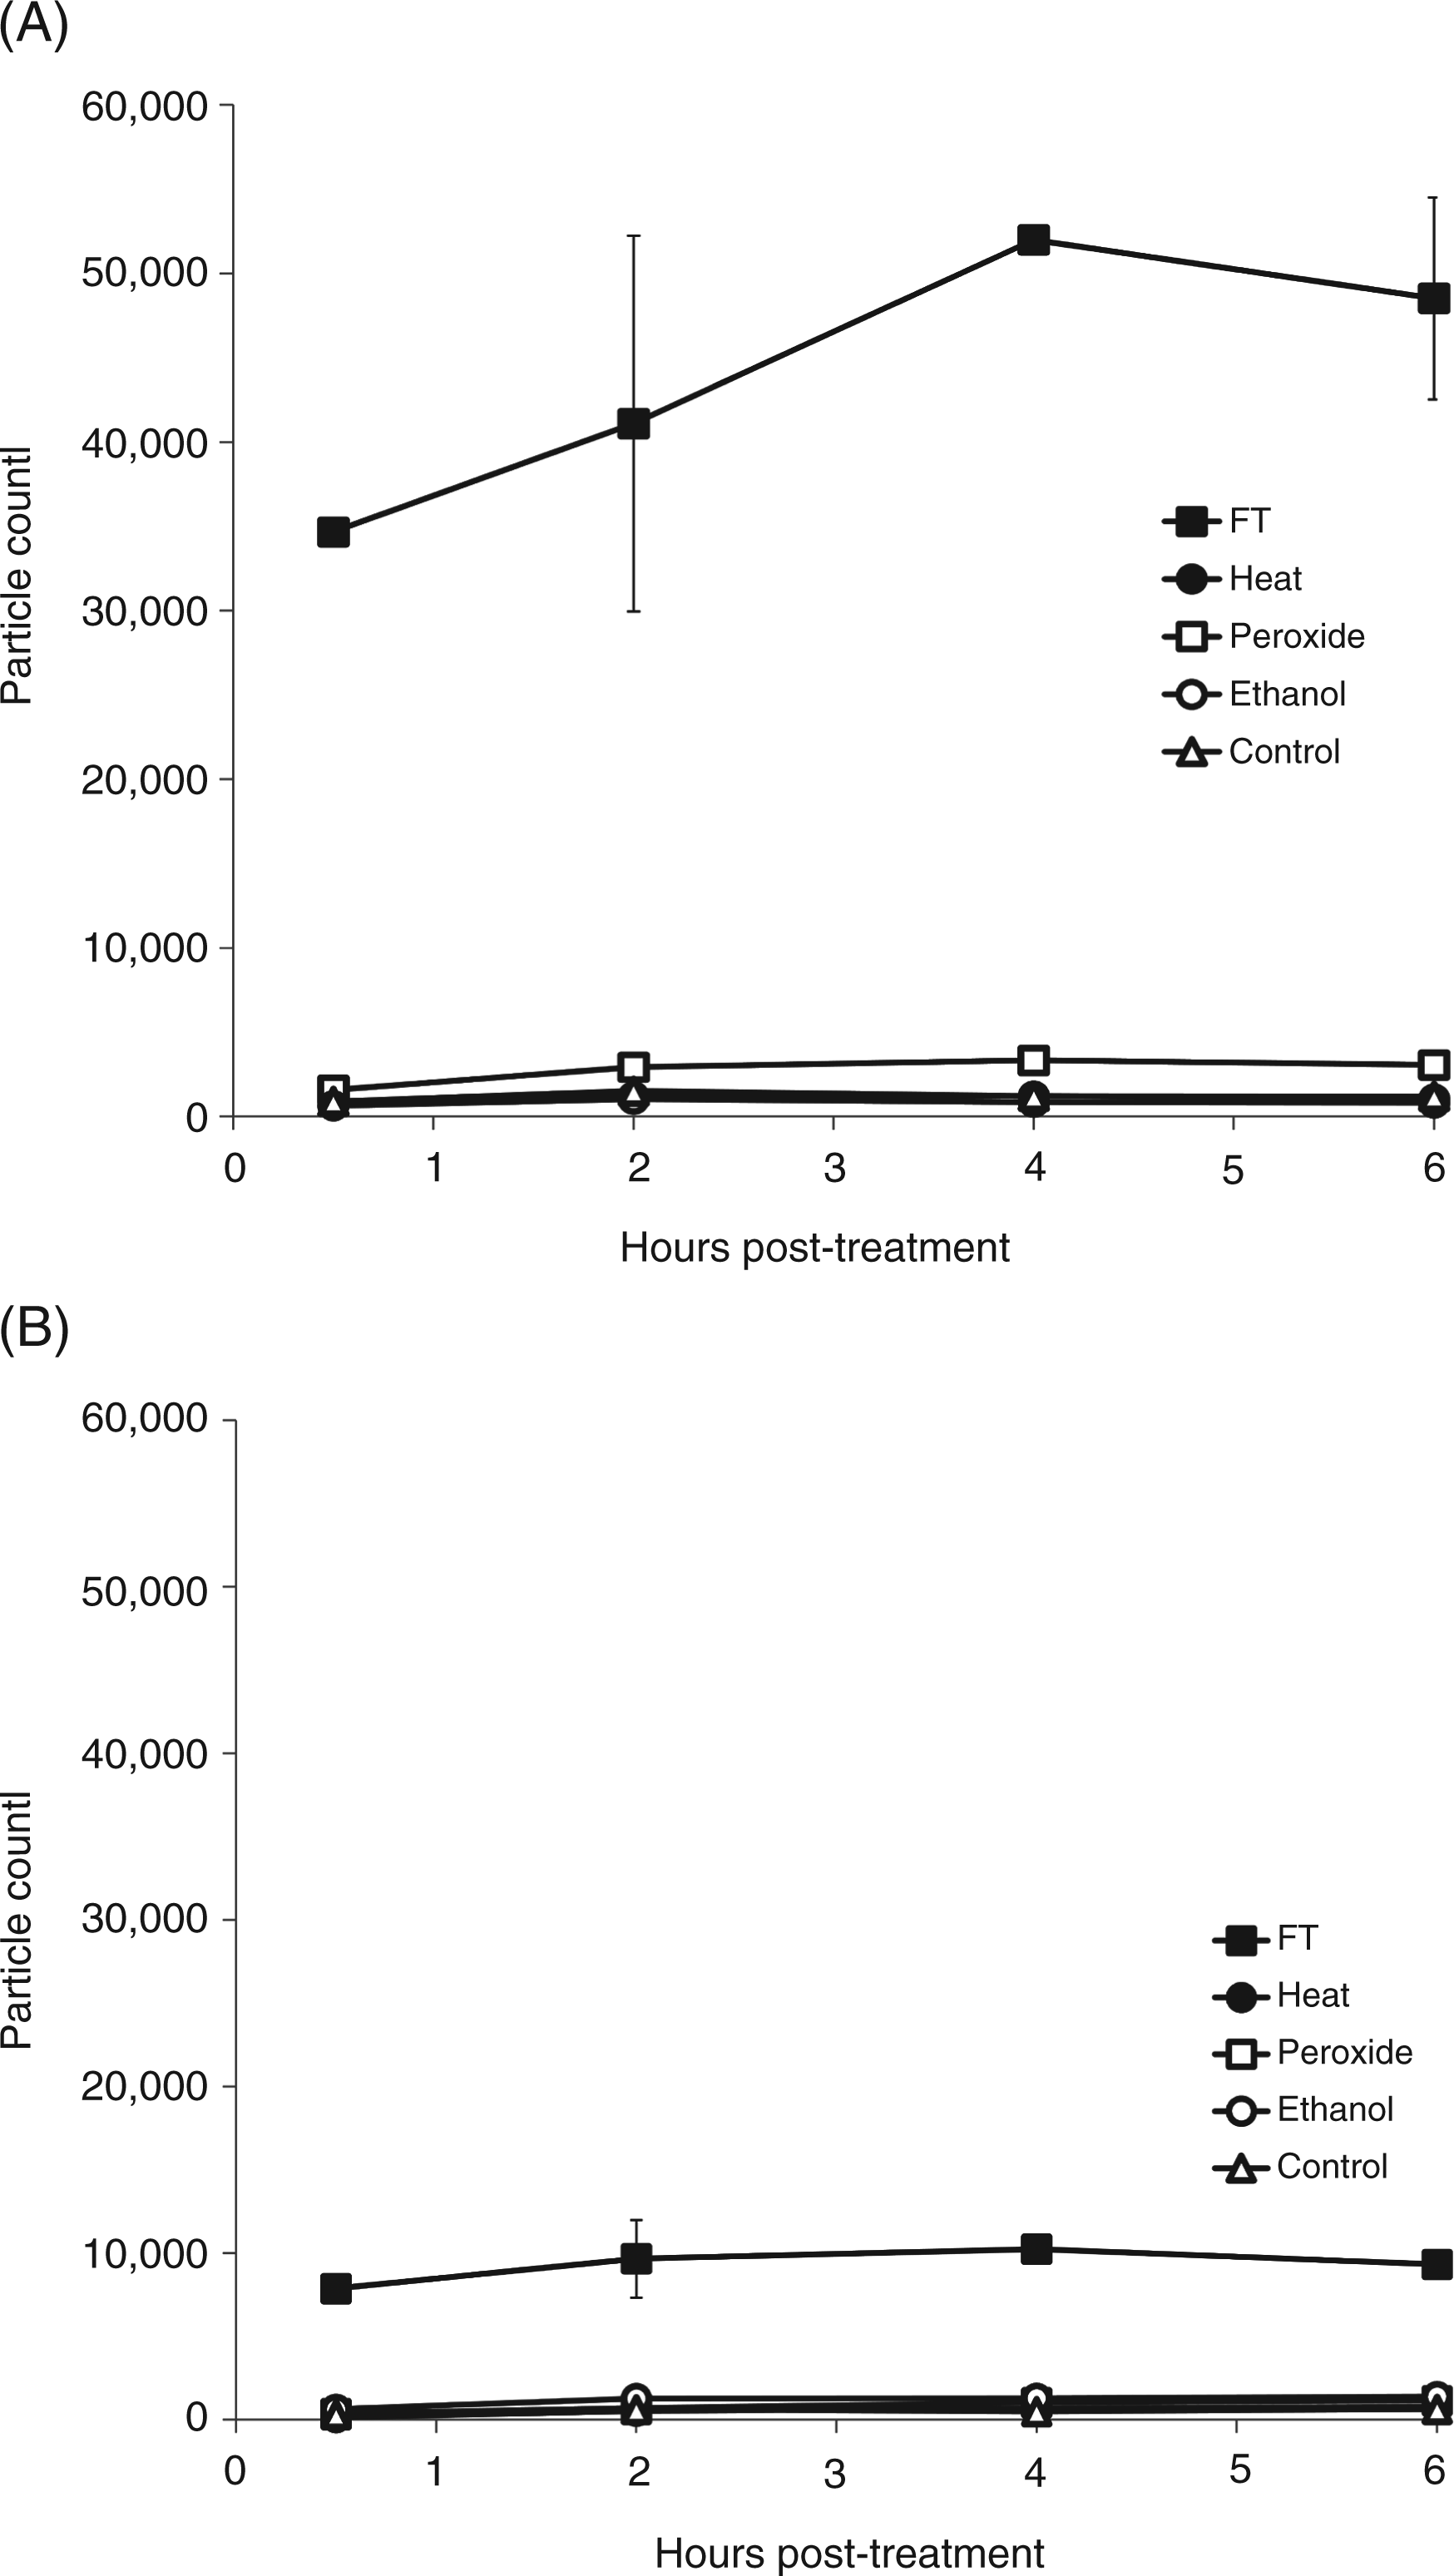
To further characterize the particles produced during freeze-thawing, we performed electron microscopy, using as a comparison particles from Jurkat cells treated with staurosporine to induce apoptosis. As indicated in Figure 8, particle preparations from freeze-thaw treatment showed membrane-bound structures with dimensions of microparticles, despite heterogeneity in size; these particles, however, appeared to have few contents. In addition, these preparations showed granular, electron-dense deposits that appeared outside the particles. In contrast, the particles from Jurkat cells undergoing apoptosis showed evidence of cellular contents. Together, these results indicate that freeze-thawing causes a distinct form of cell death, as evidenced by the magnitude of macromolecule release and the generation of particle structures.
Electron microscopy of particles from necrotic and apoptotic Jurkat cells. Electron microscopy was performed as described in ‘Material and methods’ of particles obtained from either necrotic or apoptotic cells Jurkat cells subjected to either freeze-thaw or treated with staursporine at 5 µM for 24 h. Top panels show particles from freeze-thaw cells, while bottom panels show particles from cells treated with staurosporine. Bars represent 200 nm and 500 nm respectively.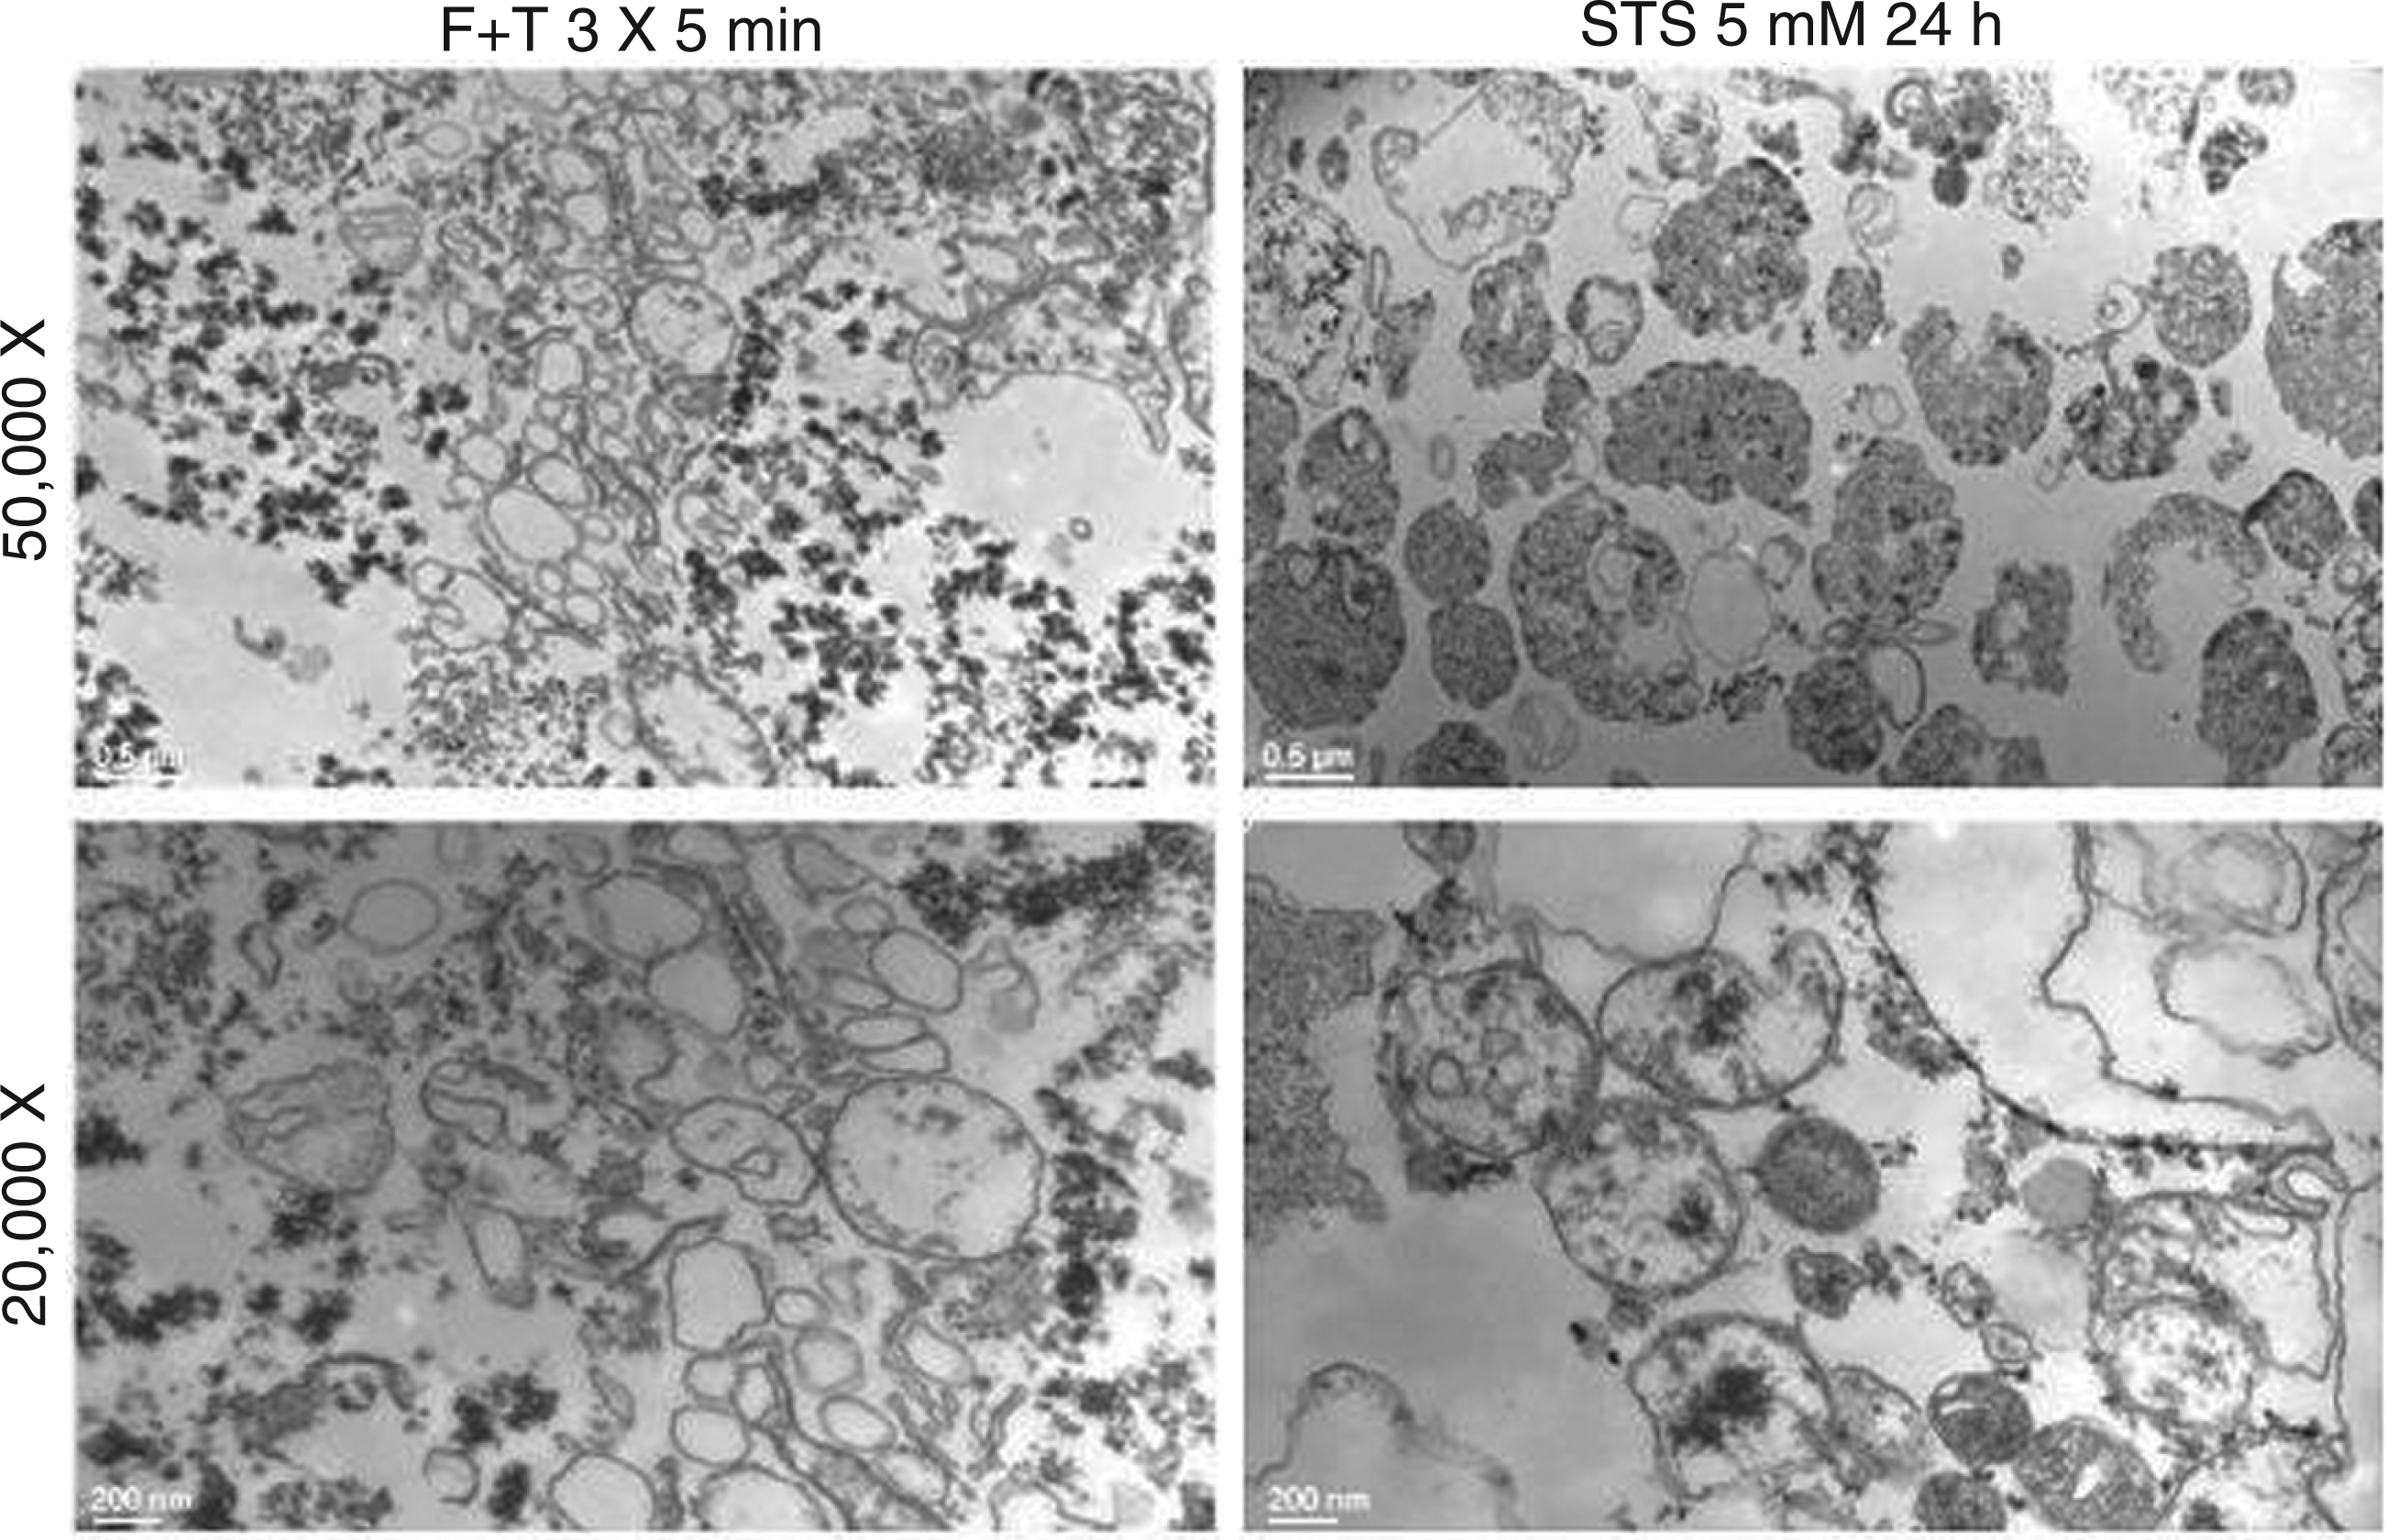
Discussion
Results presented herein demonstrate marked differences in the extent and pattern of nuclear molecule release in models of in vitro necrosis. Thus, with cells subjected to freeze-thawing, a very common method for inducing necrosis, DNA and HMGB1 exit the cells almost immediately, although DNA can be subsequently degraded in a time-dependent process. With other inducing agents, the release of DNA is less extensive although the amounts present in the supernatant are more stable. In contrast to the almost immediate release of HMGB1 with freeze-thawing, the release of HMGB1 with heat and hydrogen peroxide was much more gradual and did not significantly occur following ethanol treatment. Together, these experiments indicate that models for experimental necrosis vary in the processes for the nuclear molecule translocation and extracellular stability.
In contrast to apoptosis, necrosis has been conceptualized as an unregulated event in which death occurs rapidly because of physical or chemical trauma that can disrupt energy production or cell function. With loss of cell membrane integrity, necrosis can lead to an extensive release of intracellular contents, resembling lysis in some situations. These contents include DAMPs and alarmins, with HMGB1 the prototype. HMGB1 can induce inflammation alone or in association with other molecules that include IL-1, LPS and DNA. The activity of HMGB1 by itself depends on its redox state with a thiol at cysteine 106 and a disulfide bond between cysteines 23 and 45.13,14 The extent of this modification may vary depending on how the cell dies, with studies in a model of acetaminophen toxicity in mice showing the metabolic state of the animal (i.e. fed vs starved) affects the modification and therefore the immunologic activity of the released protein. 39
While necrosis can be rapid and cytodestructive, more recent studies suggest that necrosis, like apoptosis, can display a more gradual and regulated course mediated by enzymes.40–42 The occurrence of this form of necrosis may depend on the inducing stimulus and the status of the apoptotic machinery. Thus, with apoptosis blocked, the cell may die via a necrotic pathway, even if that stimulus ordinarily causes apoptosis if the caspase system is intact.43–47 These findings have led to new definitions of the process of necrotic cell death and identification of regulated necrosis as a potential death mechanism. This form of necrosis, which can be mediated by the enzyme RIP1, contrasts with the accidental or non-regulated form of death induced by physical and chemical agents such as those used in this study. 48
The recognition that necrosis is heterogeneous prompted us to explore a major feature of necrotic cell death: the release of nuclear macromolecules. As shown in studies in vivo and in vitro, necrosis can lead to extensive release of DNA and HMGB1. HMGB1 can serve as an alarmin to promote inflammation, either by itself or in association with other molecules that interact with diverse receptors. DNA can also display immunologic activity, although activity as an alarmin may depend on its association with other molecules, in particular, HMGB1.15,49 In contrast to nuclear DNA, mitochondrial DNA may have instrinsic immunologic activity because of structural differences, including patterns of base methylation. While mitochondrial DNA may be released during death, its extracellular presence may also result from organelle extrusion.50,51
In prior studies, the immune activity of released molecules was studied with different necrotic cell preparations, including freeze-thawed or homogenized cells.52–54 These methods can produce almost instantaneous cell death in view of the trauma caused. As our results indicate, freeze-thawing leads to extensive release of both HMGB1 and DNA, with levels that exceed those caused by heat, ethanol or hydrogen peroxide. The release of HMGB1 occurred almost instantly with freeze-thawing, as examination of the media showed the presence of this protein in the first time point measured. This very rapid release of HMGB1 is consistent with the mechanisms of cell death induced by freeze-thawing. The process results from ice crystal formation and is influenced by rates of freezing, temperature, duration of freeze and rate of warming.55,56 These parameters have been extensively explored in the context of tumor cryoablation as freezing can be useful for tumor cytoreduction.
In addition to HMGB1, DNA was present at high levels in the media at the first time point after freeze-thawing. While HMGB1 levels remained constant with further incubation, DNA levels declined rapidly. In contrast, with heat and hydrogen peroxide, the release of DNA and HMGB1 was much less extensive, with HMGB1 release occurring more gradually. With ethanol treatment, however, extracellular HMGB1 release did not occur significantly. Interestingly, cells treated with ethanol did not show annexin V binding, implying a distinct death pattern, differing in phosphatidylserine exposure, as well as HMGB1 release. This effect may reflect a biochemical alteration in lipids induced by ethanol.
A notable feature of death by freeze-thawing was an abundant production of particles. As suggested by FACS analysis, these particles showed some similarities to microparticles released from cells undergoing apoptosis, 57 although their size appeared smaller. In contrast, electron microscopy indicated important differences between particles from freeze-thaw and apoptosis. Thus, particles from freeze-thawing appeared lacking in cellular contents; these preparations also had electron-dense material not observed with preparations from apoptotic cells. The biochemical composition of this material is under investigation at this time.
As DNA can affect the immune activity of DAMPs, including HMGB1 to which it binds, we investigated the stability of this DNA and its susceptibility to nuclease digestion. As our studies showed, this nuclease activity is dependent on divalent cations and can be inhibited by EDTA. The significant disruption of cell structure by freeze-thawing could release nuclease from internal sources. In contrast to the results with freeze-thawing, the levels of DNA after heat treatment were more stable, while levels of DNA released from ethanol-treated cells showed a more gradual decline. Levels of DNA in cells treated with hydrogen peroxide rose throughout the incubation period, consistent with the more gradual pattern of death. These differences may relate to the levels of nuclease released from cells or the destruction of nucleases by the treatment to induce necrosis.
While the basis of these differences is not clear, they indicate that the extent of nuclear molecule release from necrotic cells could vary markedly and potentially influence immune responses. Thus, in studies with either freeze-thawing or mechanical disruption of cells (or both), some investigators utilize the entire preparation as a source of necrotic cells.23,24,53,54,58 In some instances, such preparations may be more appropriately considered extracts given the extensive damage to cells. As our findings indicate, these preparations may be subject to degradation processes and therefore may change in terms of their content and immunologic properties.
While the current study has focused on the molecular characterization of the supernatants of cells undergoing necrosis, we have started to evaluate their immunologic activity. Interestingly, preliminary studies indicate that the supernatants generated from Jurkat cells undergoing necrosis failed to stimulate RAW264.7 murine macrophage cells at levels greater than those of control cells. Thus, in a representative experiment, supernatants (1:25 dilution) from Jurkat cells treated with freeze-thaw induced an average of 5.2 ng/ml of TNF-α in comparison to 3.4 ng/ml from control cells supernatants. Higher concentrations of supernatants led to greater stimulation, but the levels from supernatants remained similar to those of control cells. Under these conditions, 10 ng/ml of LPS induced 37.4 ng/ml of TNF-α. Similar results were obtained with the measurement of nitrite as an index of nitric oxide production. While preliminary, these findings could suggest that RAW264.7 cells do not respond readily to this form of stimulation or that the supernatants (in contrast to either dead cells or dead cell extracts), despite their content of potential immunologically active molecules like HMGB1, lack another active component or may even contain an inhibitor. These issues are under investigation.
Together, our results suggest that the systems studying the immune properties of necrotic cells should use preparations in which macromolecular components have been well characterized and the in vitro stability understood. 59 Furthermore, our preliminary findings suggest that the responding cell type (e.g. macrophage vs dendritic cell, cultured cell line vs isolated cells from a person or animal) may also influence this assessment, perhaps related to content of different receptors. In this regard, although our studies focused on the release of nuclear macromolecules, cytokines such as IL-1 and IL-33 may also exit cells during necrosis, with the kinetics and extent of this process also potentially variable depending on the process by which necrosis occurs.60,61
The amounts and kinetics of macromolecule released from dying cells may have clinical applications, as studies in both experimental models in animals and patients have demonstrated many adverse effects of tumor cryoablation, especially of hepatic cell cancers.35,36 These effects include systemic inflammation, pulmonary inflammation and coagulopathy that have been termed cryoshock. Importantly, cryoablation appears to be more pro-inflammatory and pro-coagulant that other forms of tumor-killing, such as radiofrequency ablation.62–64 While the mediators of cryoshock are not known, our findings suggest that the dramatic release of HMGB1 and particles may contribute to the observed systemic responses. Studies are therefore in progress to characterize the immunologic effects of molecules and structures (i.e. particles) released during necrosis and develop approaches that can attenuate their effects.
Footnotes
Funding
This work was supported by a VA Merit Review grant and NIH grant AI083923.