
Abstract
Escherichia coli Nissle 1917 (EcN) bears a defect in its LPS biosynthesis leading to truncated variable oligosaccharide-antigen chains and a semi-rough phenotype. It is effectively inactivated by complement factors due to resolved serum resistance and is, therefore, safe as a probiotic strain, i.e. for the treatment of inflammatory gastrointestinal diseases. It is unknown whether the modification of LPS in EcN contributes to its probiotic properties. Purified LPS from EcN and wild-type LPS from uropathogenic E. coli W536 together with raw lysates of both strains were analyzed for their gene expression activity with human PBMCs measured by microarrays. Comparing the two LPS molecules and the two lysate variants with each other, respectively, no differences of transcriptional patterns were observed. However, when comparing LPS with lysate patterns, pro-inflammatory cytokine IL-12p40 was up-regulated by both LPS molecules and anti-inflammatory IL-10 by both lysates. The higher the lysate concentration, the higher IL-10 release from PBMCs, clearly exceeding LPS induced IL-12p40 release. Furthermore, inflammatory chemokine CCL24 (eotaxin) was down-regulated by lysates and quantitative real-time PCR revealed that EcN compared to wild-type LPS was 8 times stronger in down-regulation of CCL24. We conclude that truncated LPS may down-regulate CCL24-mediated inflammation and that EcN lysate contains as yet unidentified factors which preferably induce anti-inflammatory activity. Both effects may contribute to the probiotic properties of EcN.
Introduction
Escherichia coli Nissle 1917 (EcN; O6 : K5 : H1) is a non-pathogenic, commensal E. coli strain belonging to the heterogeneous serogroup O6 including also pathogenic variants. 1 This strain is recommended for the treatment of infectious or inflammatory intestinal disorders such as acute enteritis mainly in children 2 and ulcerative colitis 3 as well as Crohn’s disease 4 mainly in adults.
To explain its probiotic properties, EcN was extensively analyzed at the phenotypic, molecular and genetic levels. It shows abilities to compete with pathogenic E. coli isolates in the gut. 5 This competition happens through the release of bactericidal factors such as microcin H47 and microcin M which both utilize iron uptake receptors of other Enterobacteriaceae to enter the cytoplasm and kill these bacteria. 6 Moreover, compared to other E. coli strains, EcN expresses six additional iron uptake systems resulting in superior iron acquisition capacities and leading to a growth benefit. 7 Furthermore, successful colonization of the gut by EcN is favored by the production of type 1- and F1C-fimbriae which increase adhesion to epithelial cells and assure prolonged survival of the probiotics.8,9
Escherichia coli Nissle 1917 further lacks pathogenicity due to the truncated LPS variant also responsible for its semirough phenotype and the length and variability of O-antigen polysaccharide chains as observed in wild-type strains. The complete polysaccharide chain of EcN cannot be synthesized, because of a stop-codon in the ORF of the responsible O-antigen polymerase (wzy). 10 Serum resistance of wild-type E. coli directly depends on the length of the O-antigen chain of its LPS; therefore, truncation of LPS in EcN leads to serum sensitivity and its aseptical nature. 11 Finally, as a danger signal of Gram-negative bacteria, LPS is generally detected by the innate immune system. 12 Triggering of CD14/TLR4/MD-2 receptor complex with LPS will evoke a broad and complex pro-inflammatory (cellular) reaction including the expression of genes related to cytokine activity and antigen presentation.13,14
Taken together, since probiotic treatment may preferably lead to an anti- more than a pro-inflammatory response, we aimed to investigate whether the structural modification of LPS from EcN or other effects are involved in its probiotic property. By inducing cytokines like IL-10 and TGF-β, EcN may be associated with beneficial probiotic effects such as triggering of regulatory T-cells which are responsible for the down-regulation of an excessive immune response. 15
To analyze this, we screened the transcriptional pattern of human peripheral blood mononuclear cells (PBMCs) as a source of immune competent cells with microarrays following stimulation of the cells either with purified LPS from EcN (LPSEcN) or from the uropathogenic W536 (LPSW536), and also with raw lysates from EcN (LysateEcN) or E. coli W536 (LysateW536). Comparing the gene expression pattern following both LPS and lysate variant activation, a number of regulated mRNAs in PBMCs were discovered of which three were further validated by quantitative real-time PCR (qPCR). Two of these mRNAs were found to be IL-12p40 and IL-10. To analyze functional differences, the release of these cytokines from PBMCs after stimulation with the two LPS forms and lysate variants by increasing concentrations was determined.
Materials and methods
Bacterial strains, growth of bacteria and isolation of LPS
The E. coli strain Nissle 1917 (Mutaflor; DSM 6601, serotype O6 : K5 : H1) was kindly provided by Ardeypharm GmbH (Herdecke, Germany). The uro-pathogenic E. coli strain LPSWzy536 (O6 : K15 : H31) used was isolated from a patient with acute pyelonephritis. 16 Growth of the E. coli strains and extraction of respective LPS was done as described elsewhere. 17
Isolation of PBMCs and preparation of cell-cultures
Peripheral blood mononuclear cells were isolated from heparinized whole blood after 1 : 1 dilution with Hanks’ balanced saline solution (HBSS, Biochrom, Germany) by Ficoll/Isopaque (1.077 g/ml; PAN Biotech GmbH, Germany) density gradient centrifugation (460 g, 20 min, 25°C). Cells harvested from the interphase were washed twice in HBSS at 180 g for 8 min at 4°C and the pelleted cells were resuspended in RPMI-1640. The cell counts were performed using a Sysmex cell counter F-820 (Sysmex Medical Electronics, Germany).
All cell cultures were set up in RPMI-1640 medium supplemented with penicillin G (100 U/ml), streptomycin (100 µg/ml),
Extraction of mRNA
Total RNAs from PBMCs were extracted using the RNeasy Midi Kit (Qiagen, Germany) following the manufacturer’s recommendations. Poly(A)+ mRNA for microarray and qPCR analysis was isolated using the Dynabeads mRNA Purification Kit (Dynal, Germany) according to the manufacturer’s protocol.
Fluorescent labeling of hybridization probes
Using the CyScribe First-Strand cDNA-labeling Kit (GE-Healthcare Bio-Science, Germany), mRNA was reverse transcribed into cDNA and fluorescence labeled by incorporation of Cy3- or Cy5-dCTP. Briefly, 900 ng Poly(A)+ mRNA was transcribed after annealing of anchored oligonucleotides and random nonamers for 1.5 h at 42°C with 100 U CyScribe reverse transcriptase, 10 m
Hybridization of microarrays
Hybridization was carried out on MWG human 10K A-Arrays (MWG Biotech, Germany). The microarray consisted of a total of 9850 oligonucleotides (50mer) including known genes, human expressed sequence tags and control spots. For each hybridization, cDNA with 50 pmol of incorporated Cy3 or Cy5 was mixed in 240 µl of a standard hybridization solution (MWG Biotech) and then heated for 3 min at 95°C. Then, the probe was applied onto the microarray for hybridization bordered by an adhesive frame and sealed with a polyester cover slip (GeneFrame, MWG). The arrays were placed in a wet hybridization chamber left in a water bath for 24 h at 42°C. After hybridization, microarrays were once washed in 2 × SSC containing 0.1% SDS followed by twice washing in 1 × SSC and finally once in 0.5 × SSC, each for 5 min at 30°C. The slide was dried by centrifugation at 840 g for 3 min.
Normalization and determination of fluorescence ratios
Arrays were scanned on an Axon GenePix 4000B scanner (Axon Instruments, USA) at a 10 µm resolution and raw data were processed by GenePix software (v4.0, Axon Instruments). The spots were measured by manual overlaying of a spotting grid and performing a feature detection algorithm. The effective fluorescent intensities (EFCy5 and EFCy3) of each feature were automatically calculated by subtracting the corresponding background fluorescent intensities. To compensate for possible imbalances between the total Cy3- and Cy5-fluorescent intensities (F(Cy3) or F(Cy5)) the EFCy3 values were corrected with a coefficient (CRM = median of total F(Cy5)/median of total F(Cy3)) provided by the GenePix software. Multiplication of EFCy3 with CRM led to the EF(Cy3)corr-value for each feature finally permitting its comparability with the Cy5-signal. The ratio (Rfeature = EF(Cy5)/EF(Cy3)corr) represented the relative expression levels of the respective feature. According to Murphy’s recommendation, 18 an Rfeature lower 0.33 or greater than 3 was classified as the threshold for significant down- or up-regulation. According to a statistical evaluation of our arrays by applying the standard deviation and a confidence interval of 99.9%, all ratios above 0.33 and below 3 were defined to be only weakly regulated and thus called non-regulated. Further correlation analyses as suggested by Tsuchiya et al. 19 to find biphasic or acute-stochastic modes could not be performed because the dataset of genes measured in our experiments was too small as to get statistically reliable data.
cDNA synthesis
Each 60 ng of Poly(A)+ mRNA was reverse transcribed in a final volume of 30 µl using components from the TaqMan RT kit (Applied Biosystems, Germany). cDNA synthesis and extraction were performed as described earlier. 20
Quantitative real-time PCR analysis (qPCR)
The relative quantification of IL-10, IL-12p40, CCL24 and the housekeeping gene β-glucuronidase (GUS-β) was performed with the ABIprism 5700 sequence detection system (Applied Biosystems) according to the manufacturer’s instructions and as described earlier. 20
Interleukin-10 primer and probe were designed with Primer Express program and synthesized by Applied Biosystems as described ealier. 21 For all other targets, the pre-developed primer/probe mixes from Applied Biosystems were used (IL-12p40, Hs00233688_m1; CCL24, Hs00171082_m1; GUS-β, Hs99999908_m1). Amplification protocol was performed as described elswhere.20,21
ELISA
The determination of human IL-12p40 and IL-10 concentrations in the cell-culture supernatants were performed with IL-12p40 and IL-10 specific OptEIATM ELISA Sets (BD Biotech, Germany) following the manufacturer’s recommendations.
Results
The LPSEcN and LPSW536 induce similar gene expression pattern in human PBMCs
Significantly regulated genes after stimulation of PBMCs with 10 ng/ml LPSEcN for 10 h
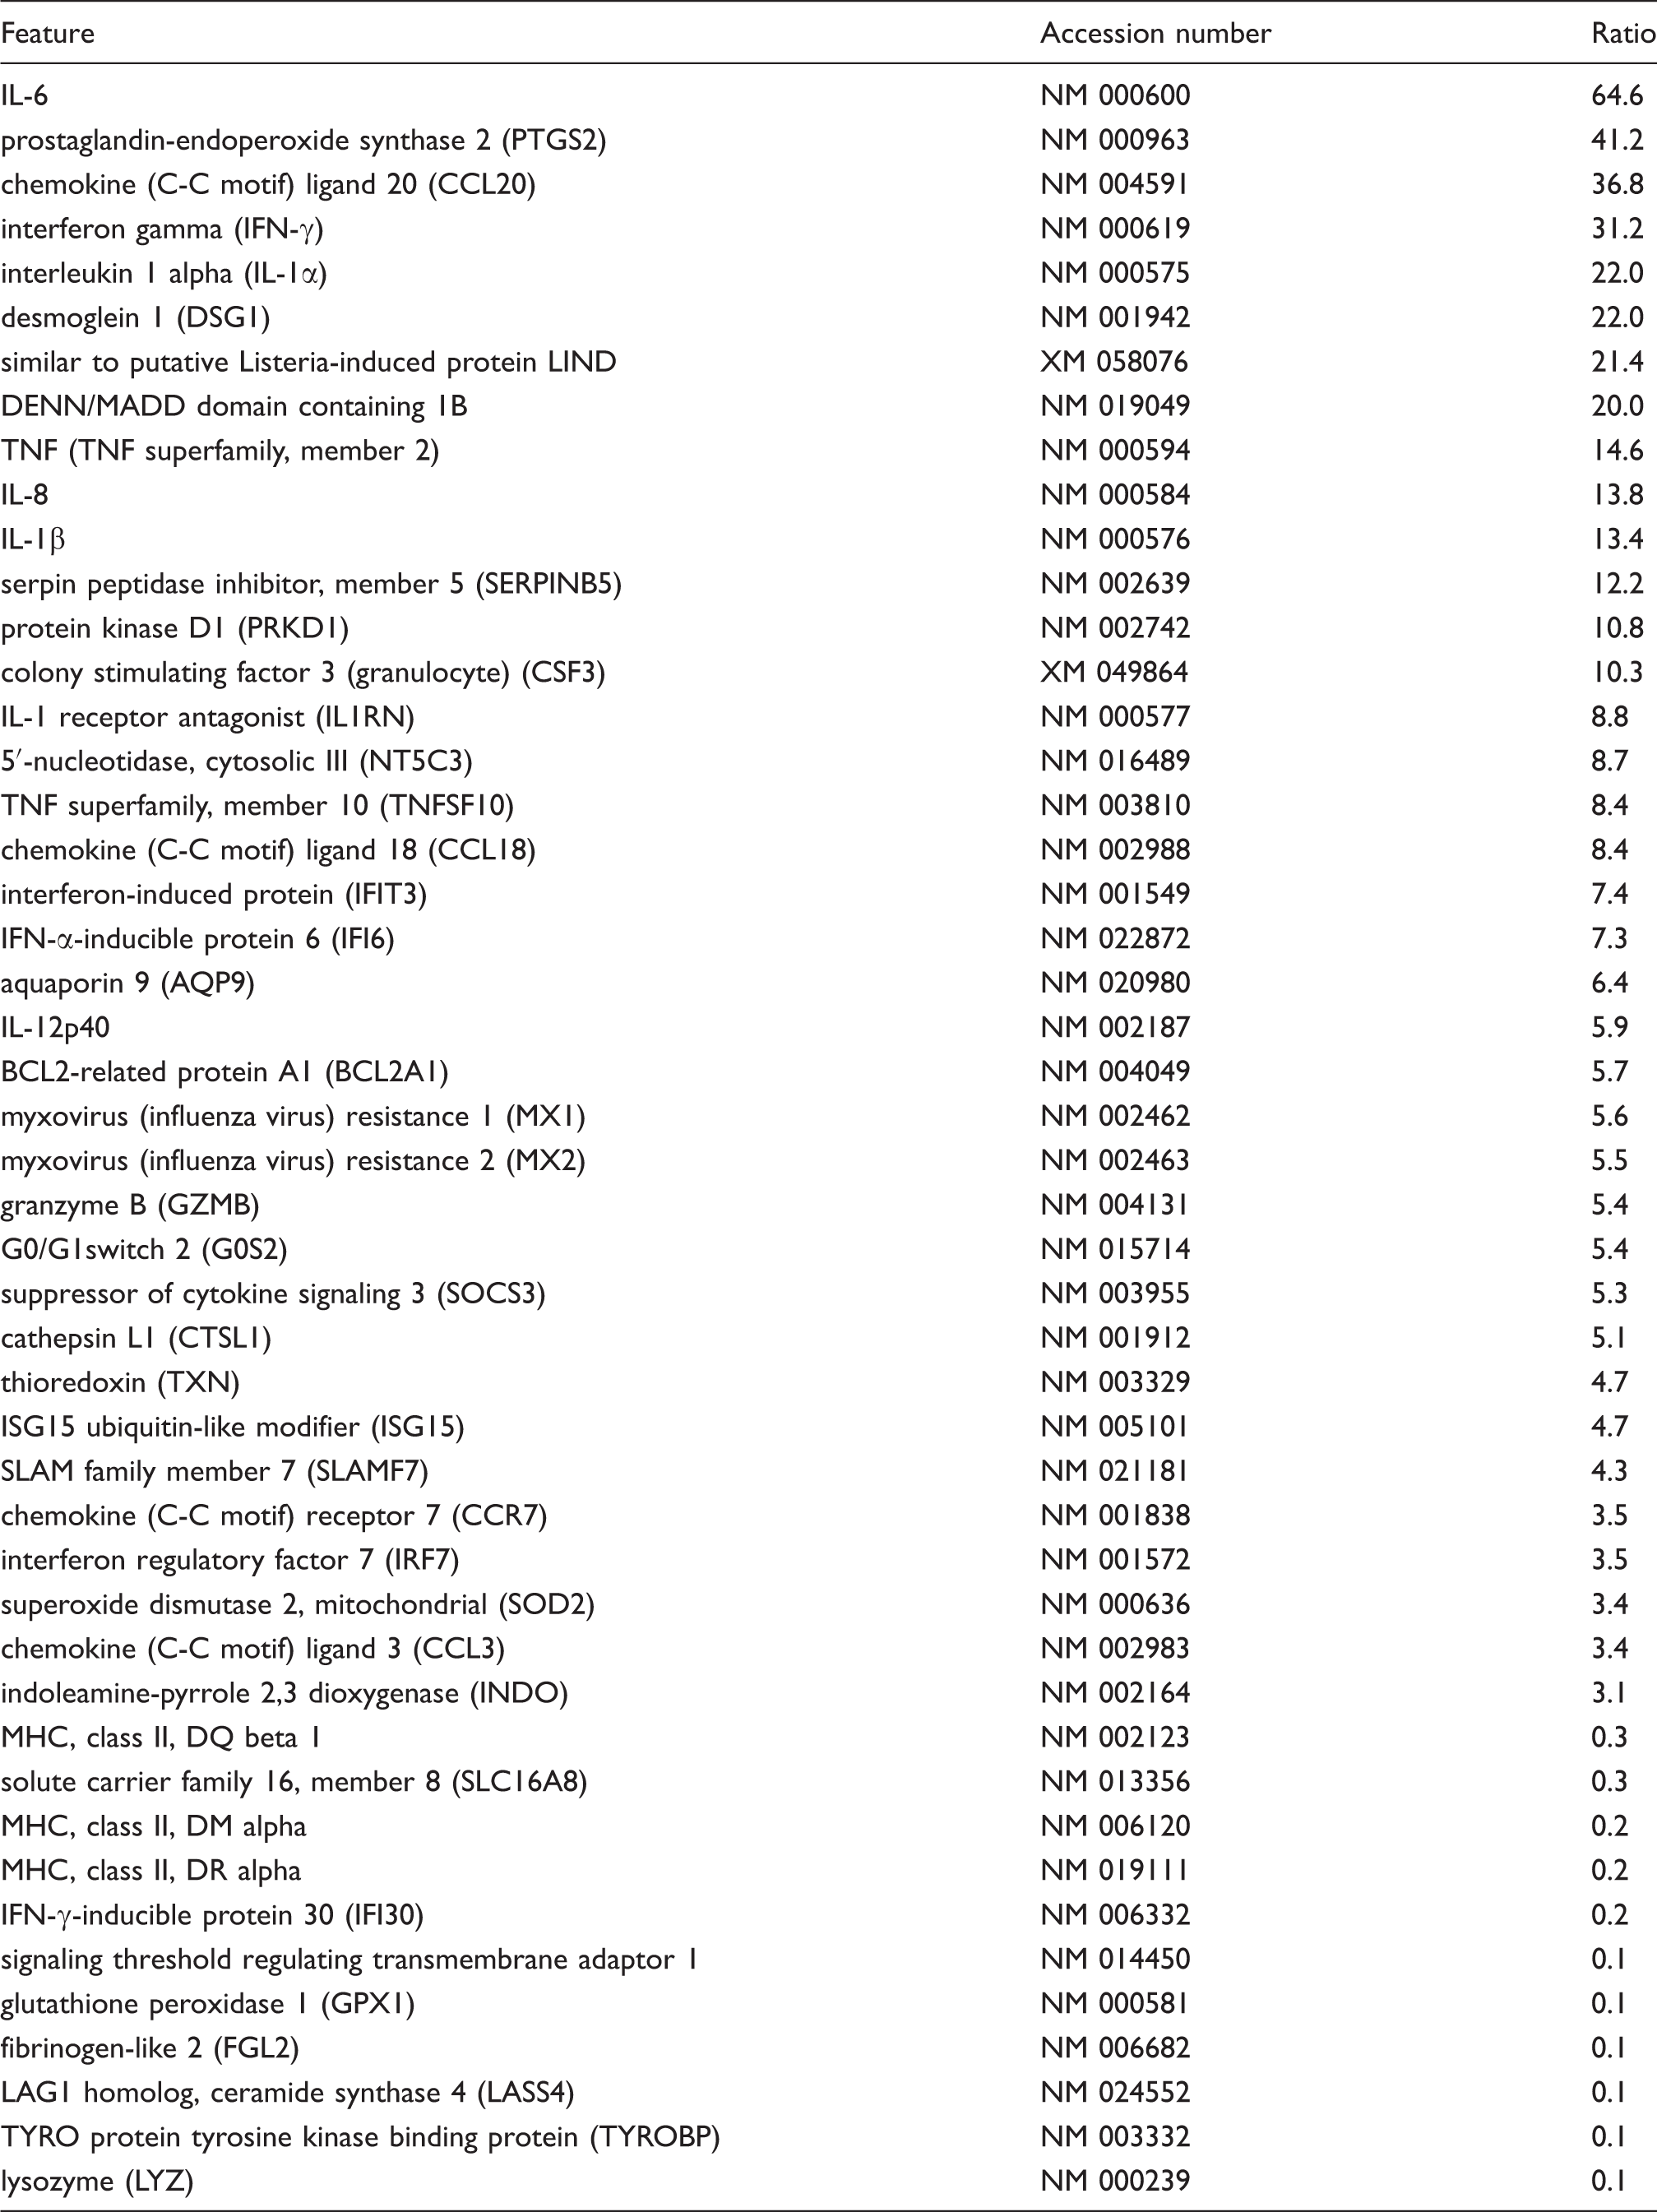
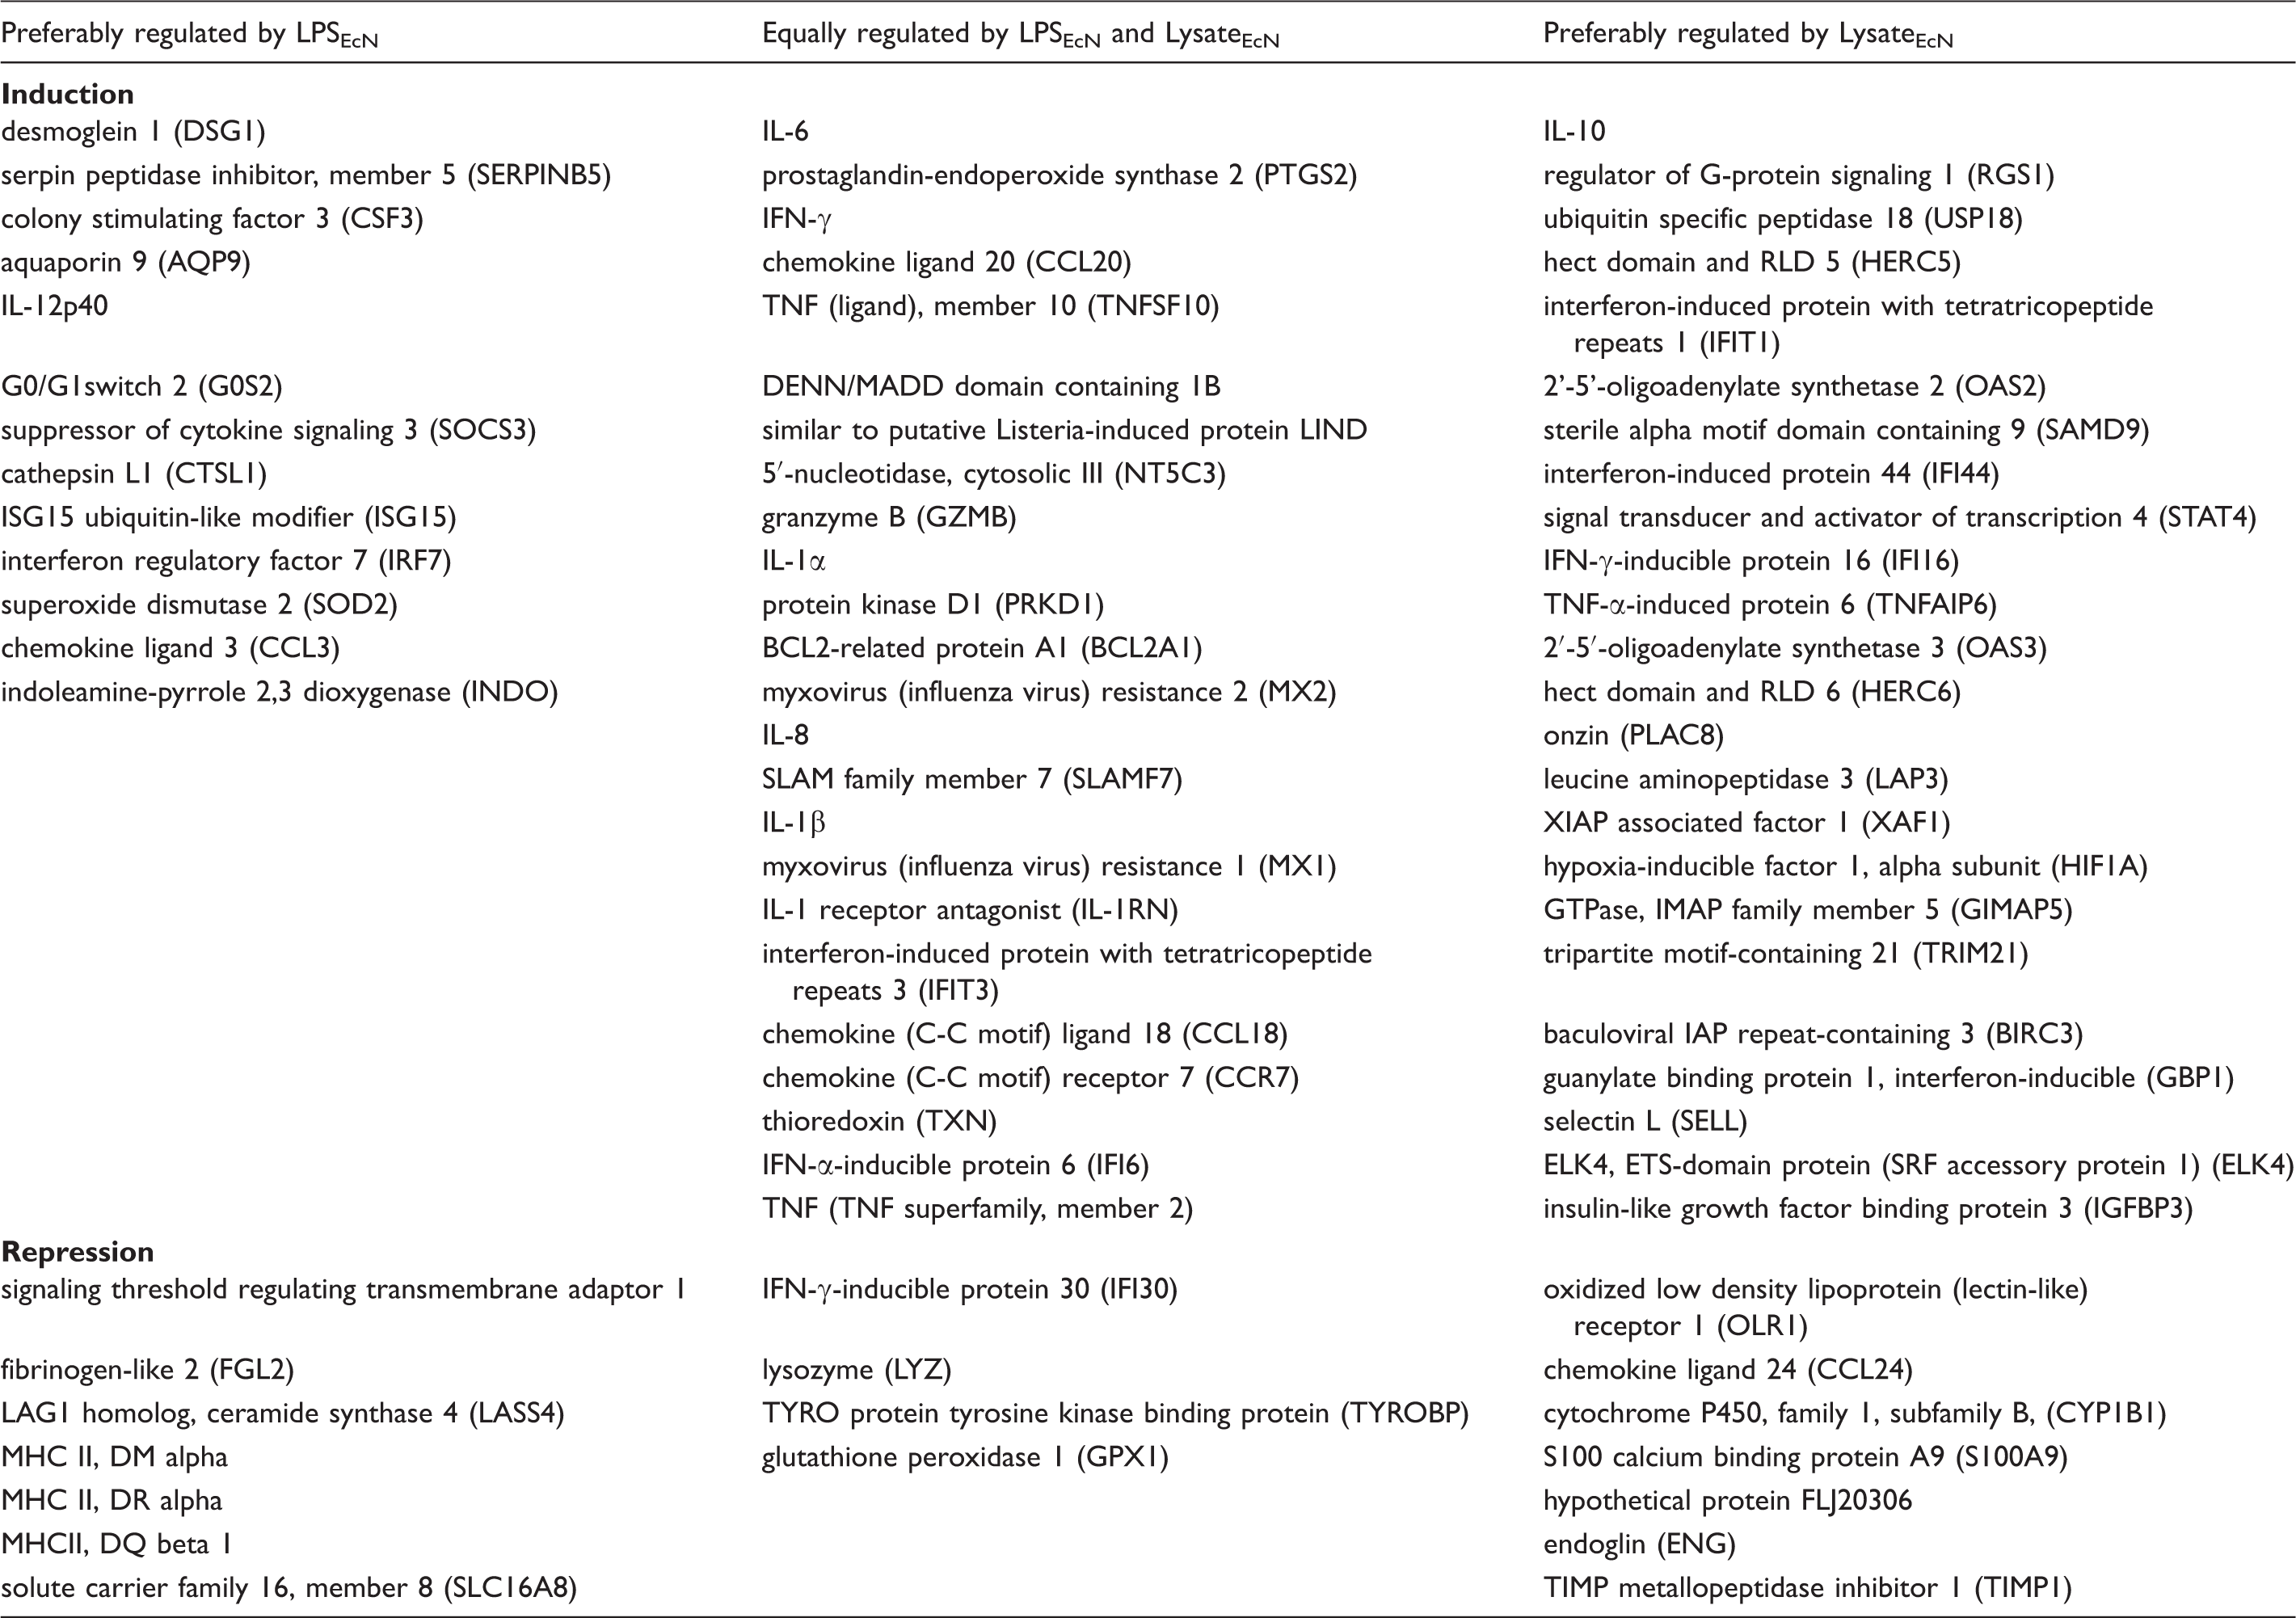
Comparison of genes preferably modulated by LPSEcN, LysateEcN or equally by both
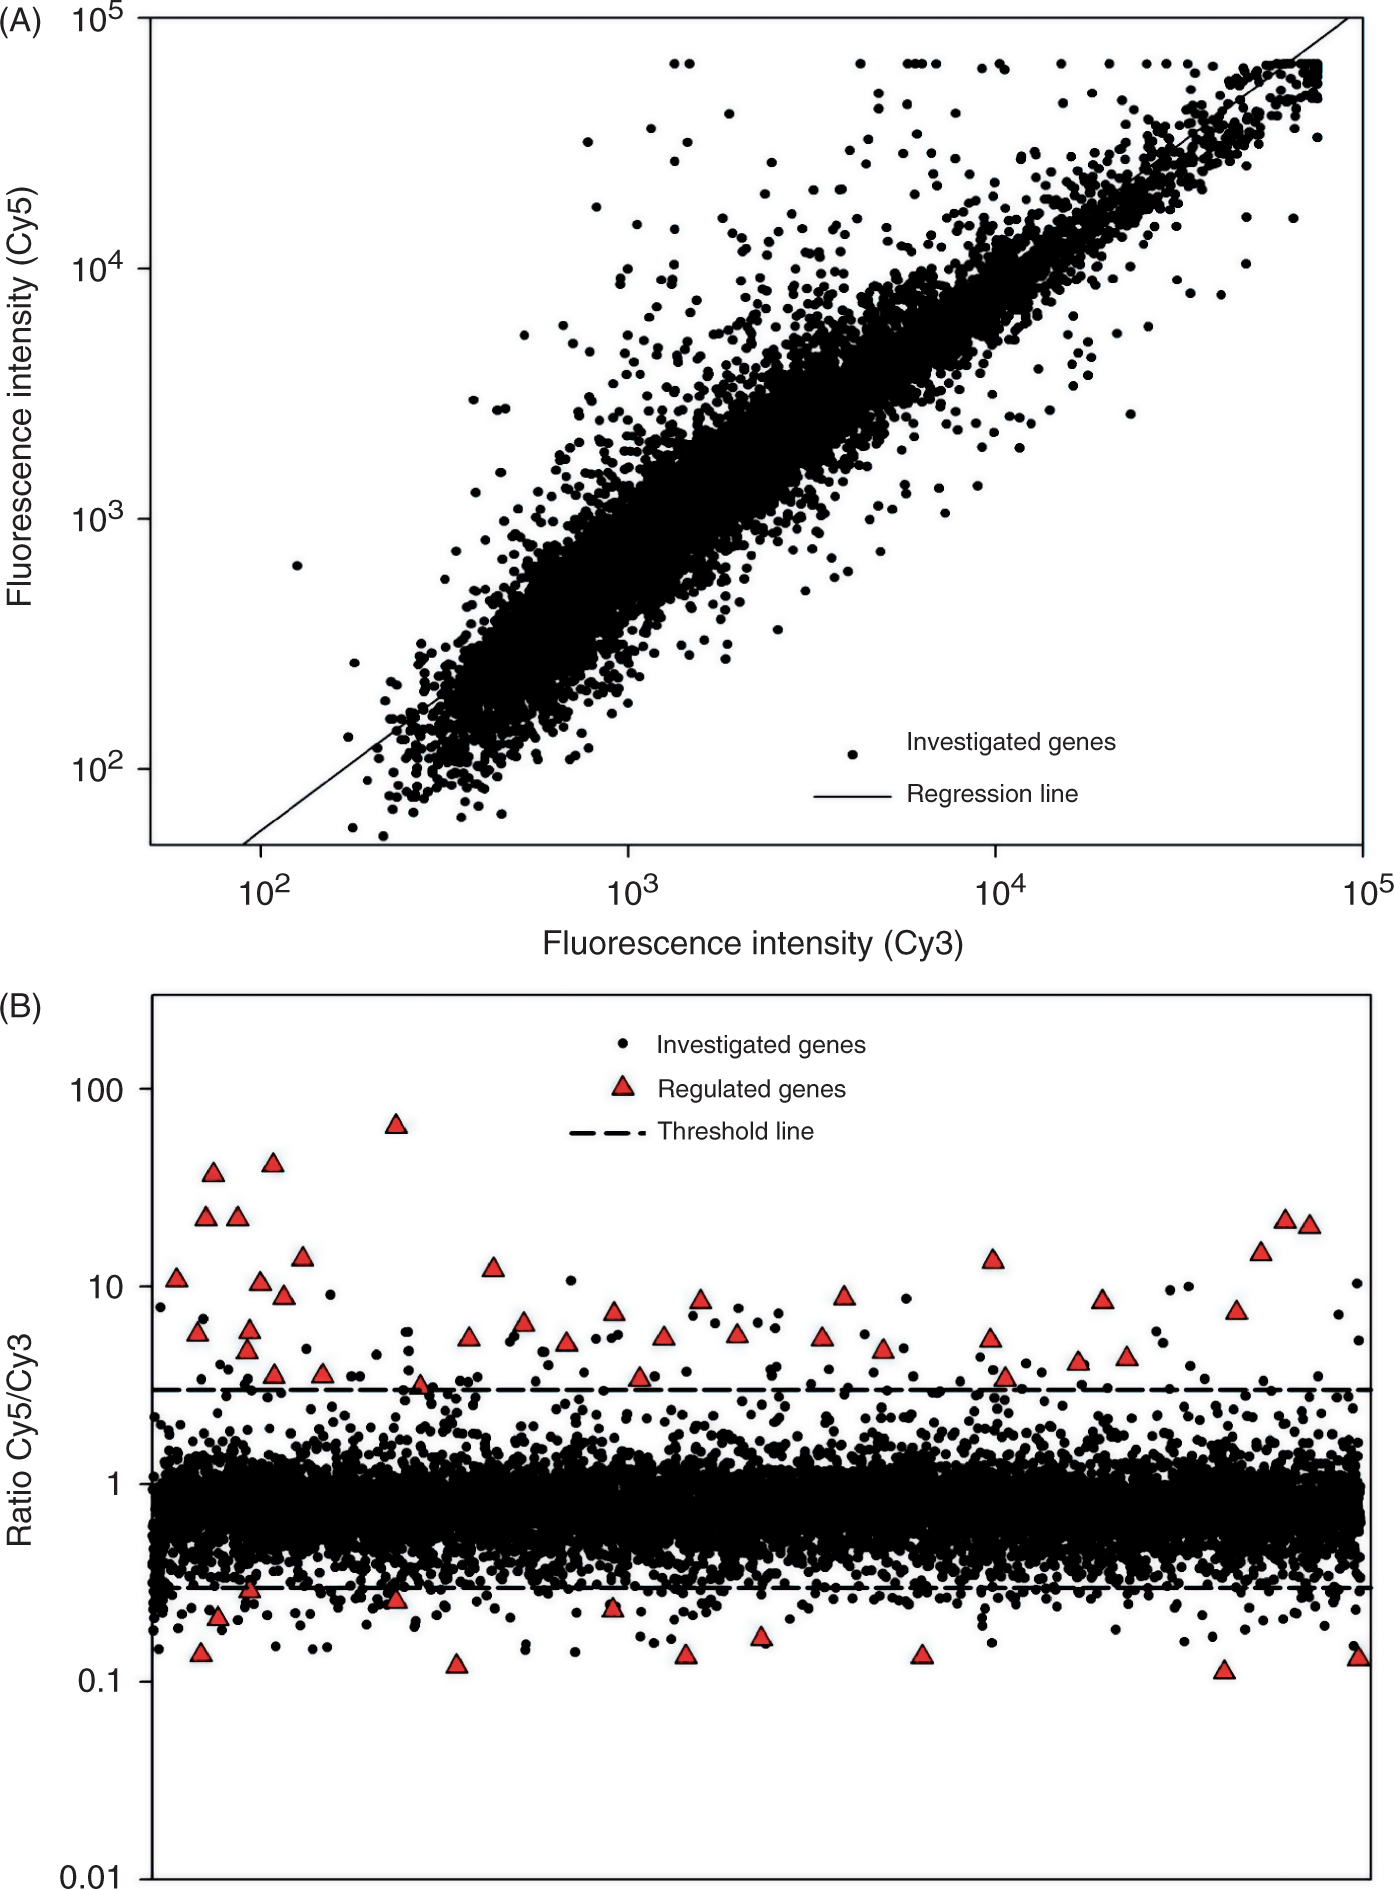
Transcriptional pattern of human PBMCs after stimulation with LPSEcN. Cy5-labeled cDNA from PBMC cultures stimulated for 10 h with LPSEcN (10 ng/ml) was competitively hybridized against Cy3-labeled cDNA from PBMCs of the corresponding unstimulated cultures on a 10K-microarray. Raw data were normalized and evaluable spots were calculated. (A) Normalized Cy3 and Cy5 fluorescence were plotted against each other. (B) Dots represent calculated Cy5/Cy3 ratios of all reliable spots. Regulated spots with ratios <0.3 or >3 that also fulfil the 99.99% confidence interval are indicated with. Ratios >3 (▴) represent an induction and ratios <0.3 indicate a repression of transcripts compared to the not stimulated control.
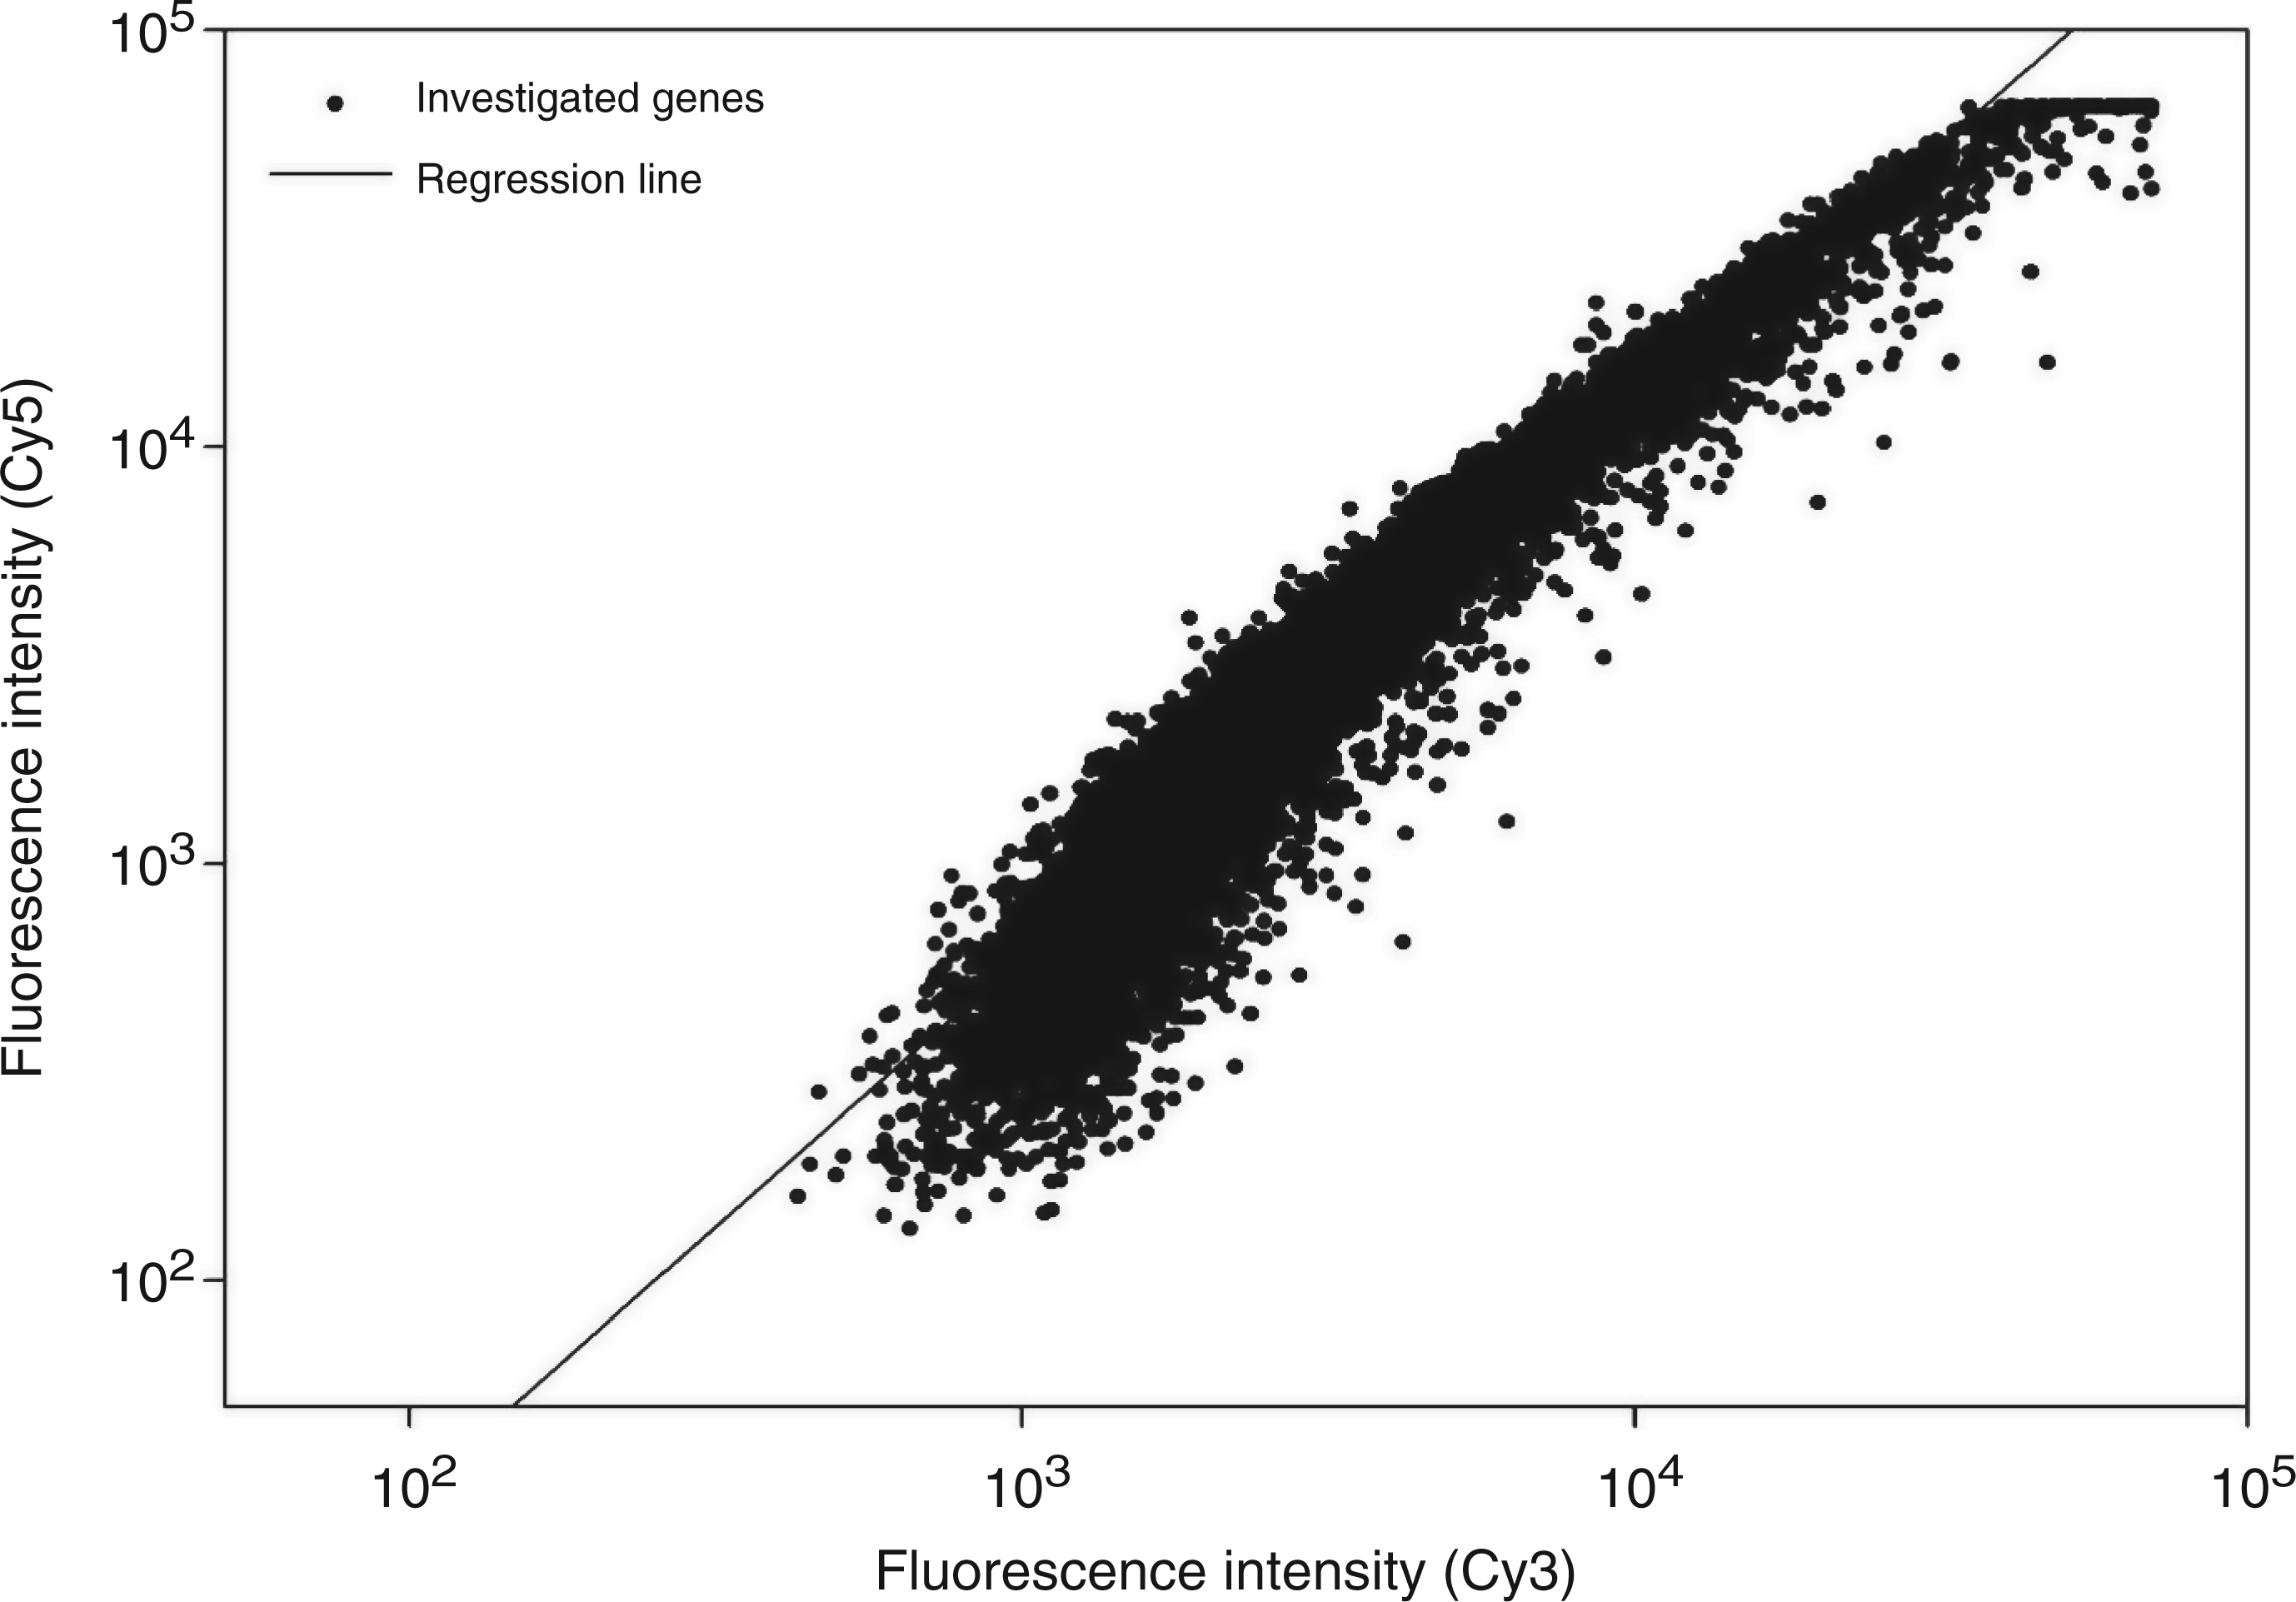
Comparative analysis of the influence of LPSEcN or LPSW536 on transcriptional pattern. Cy5- or Cy3-labelled cDNAs from PBMCs stimulated with 10 ng/ml of LPSEcN or LPSW536 for 10 h were competitively hybridized against each other on one 10K-microarray. Normalized Cy3 and Cy5 fluorescence were plotted against each other. Data were obtained from PBMCs of the same blood donor.
LysateEcN regulates more genes than LPSEcN alone
To further understand whether more genes are regulated by the complete bacteria in contrast to LPS alone, the cells were first stimulated by standardized lysate from EcN (LysateEcN, 1 µg protein/ml) for 10 h compared to non-stimulated PBMCs of the same donor (Figure 3). Fifty-nine transcripts could be identified which were significantly regulated. Among these, 48 were up- and 11 down-regulated, showing that the LysateEcN regulated 23% more transcripts than LPSEcN. To understand this difference, results of microarrays from the same donor PBMCs after stimulation with LPSEcN and LysateEcN were directly compared. Of the genes, 40% (n = 31) were equally regulated by both stimuli, 35% (n = 28) preferably by LysateEcN and 25% (n = 20) preferably by LPSEcN. Importantly, activation of the genes was independent of the tested stimuli, but the strength of alteration depended on the stimulus itself.
Transcriptional pattern in PBMCs after stimulation with LysateEcN. Labeled cDNA from PBMC cultures stimulated for 10 h with LysateEcN (1 µg/ml) was competitively hybridized against labeled cDNA from PBMC of the corresponding non-stimulated cultures on a 10K-microarray. Raw data were normalized and valuable spots were calculated. (A) Normalized Cy3 and Cy5 fluorescence was plotted against each other. (B) Dots represent calculated Cy5/Cy3 ratios of all reliable spots. Regulated spots with ratios <0.3 or >3 that also fulfil the 99.99% confidence interval were indicated with a filled triangle.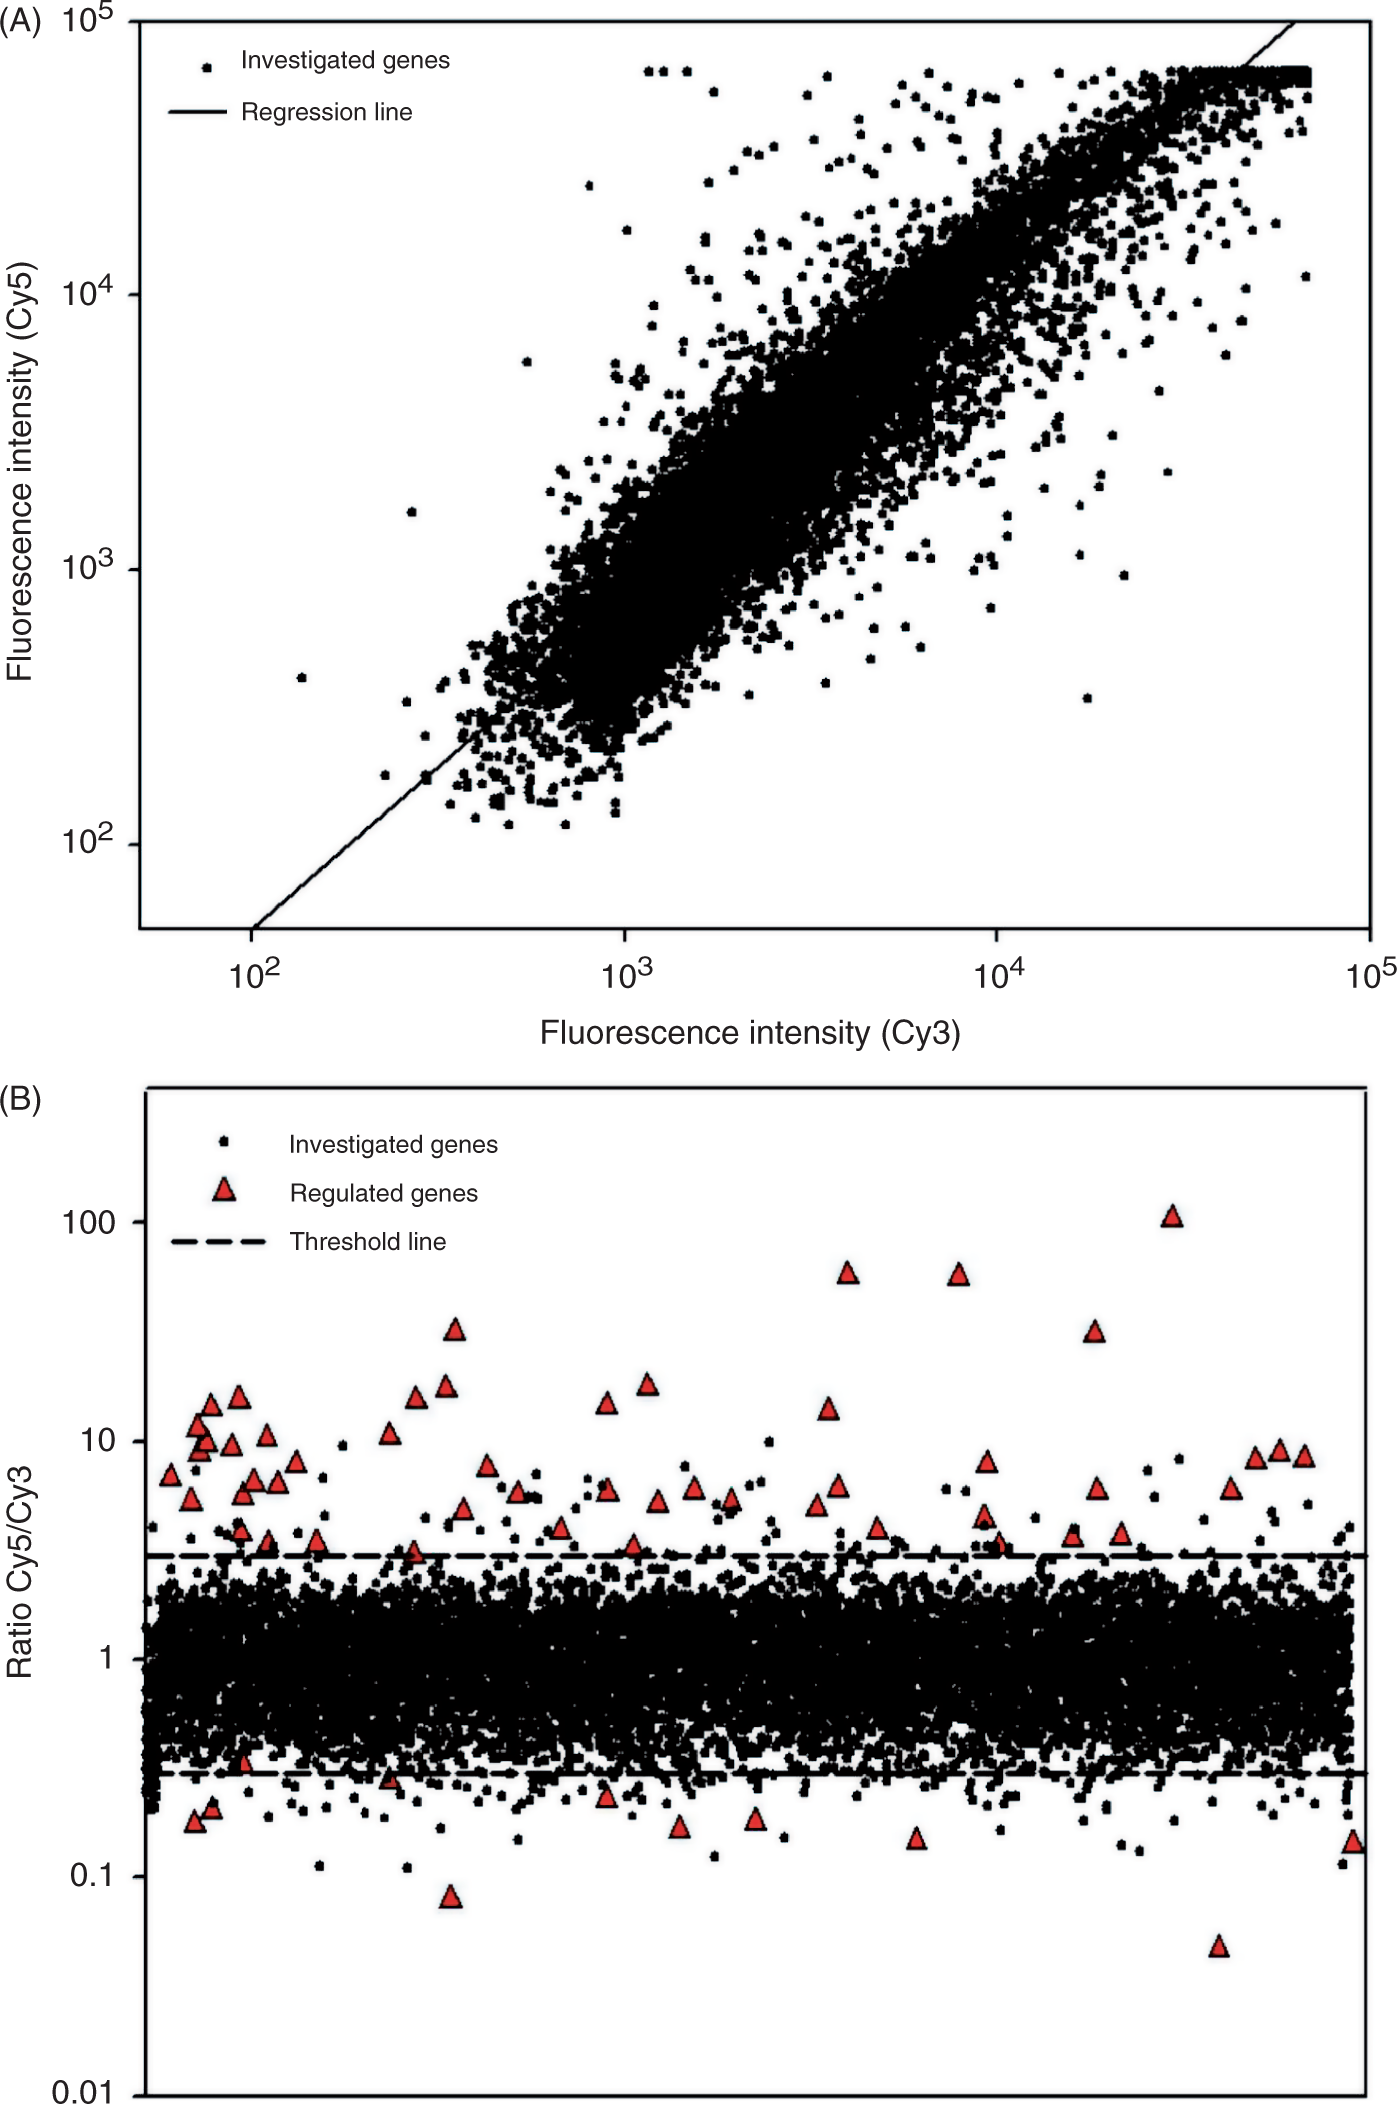
Based on the observation that LysateEcN led to a higher up-regulation of IL-10 than the LPSEcN, we wanted to find out whether both lysates showed the same stimulatory capacity. In order to analyze this, stimulation of PBMCs with LysateEcN was directly compared with LysateW536 by microarrays. The results indicated comparable transcriptional pattern of both variants, as demonstrated in Figure 4.
Comparative analysis of the influence of LysateEcN or LysateW536 on transcriptional pattern. The Cy5- or Cy3-labelled cDNAs from PBMCs stimulated with LysateEcN or LysateW536 (1 µg/ml for 10 h) were competitively hybridized against each other on 10K-microarrays. Data represent means of two independent experiments with PBMCs from the same donor.
Identification of potentially anti-inflammatory genes after validation of microarray results by qPCR
It turned out from microarray analysis that the cytokine IL-12p40 was more up-regulated by the LPS from EcN, IL-10 more by its lysate. Moreover, a pronounced down-regulation of the CCL24 (eotaxin-2) transcript level was observed following stimulation with LysateEcN. Since these genes are known to be relevant regulators of pro- and anti-inflammatory immune responses, the microarray results were selectively validated by qPCR after stimulation of PBMCs with the LPS or lysate variants. The qPCR results correlated well with the microarray data confirming a strong up-regulation of IL-10 transcripts by LysateEcN, IL-12p40 transcripts by LPSEcN and a significant down-regulation of CCL24 transcript levels by LysateEcN (Figure 5A). In accordance with the microarray results, both lysates showed the same inhibitory capacity for CCL24 transcription levels but stronger than the LPS variants (Figure 5B). Surprisingly, qPCR revealed an 8-fold stronger down-regulation for CCL24 by LPSEcN than by LPSW536.
Quantification of IL-10, IL-12p40 and CCL24 transcripts by qPCR. Changes in the transcription rates of IL-10, IL-12p40 and CCL24 were quantified with real-time PCR. Normalized ΔCt-values were compared to the unstimulated reference by calculating the ΔΔCt-values (ΔCtreference – ΔCtstimulus). (A) PCR results from PBMCs stimulated with 10 ng/ml LPSEcN for 10 h. (B) PBMCs were treated for 10 h with LPSEcN, LPSW536 (10 ng/ml), LysateEcN or LysateW536 (1 µg/ml). Changes in CCL24 transcription levels caused by the different stimuli were quantified.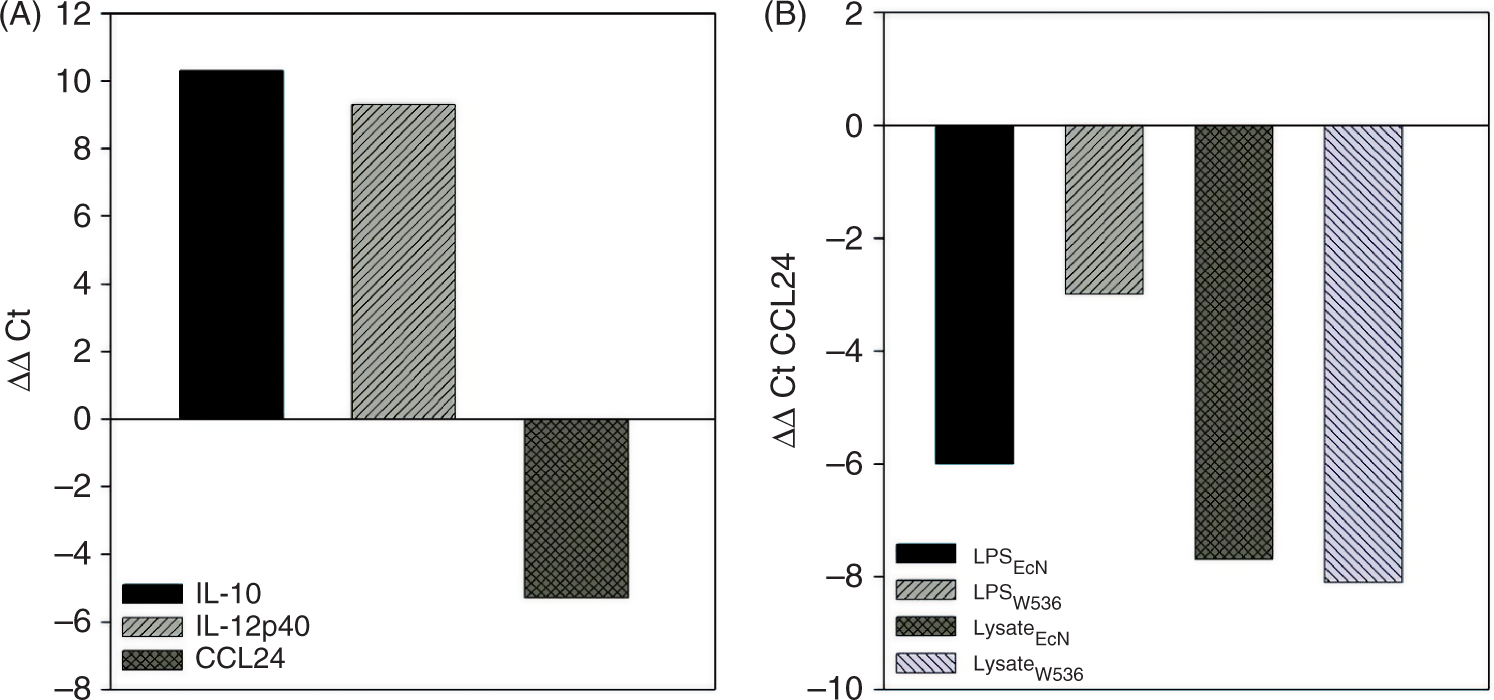
Interleukin-10 and IL-12p40 release of PBMCs stimulated with LPS or lysates
Taking into account that the microarray based results represented a distinct time-point and that the sensitivity for minor changes in transcript levels is relatively low, we were convinced that the cellular release of IL-12p40 and IL-10 proteins as quantified by ELISA would give a better resolution of putative differences in the stimulatory capacities of both stimuli.
Therefore, PBMCs of five individual blood donors were stimulated with increasing doses of LPS or lysates from both variants for 24 h and the release of IL-12p40 and IL-10 was quantified in the culture supernatants by ELISA (Figure 6). No difference of the mean IL-12p40 release could be observed with increasing concentrations of both LPS variants (Figure 6A) with the lowest doses of LPS (0.1 ng/ml) triggering a maximum of IL-12p40 response which remained stable over a wide range of concentrations. Furthermore, LPS-induced IL-10 release was nearly identical for both preparations (Figure 6B). Only the concentration of 1 µg/ml LPSEcN led to a slightly higher IL-10 induction than wild-type LPSW536. For LysateEcN and LysateW536, results were different. With both preparations, highest IL-12p40 release was already achieved at low concentrations of lysate (1 ng/ml) although LysateEcN generally tended to release higher IL-12p40 levels (Figure 6C). At increasing concentrations, both curves equalized and a dose-dependent reduction of IL-12p40 release was observed for both preparations. In contrast to IL-12p40, LysateEcN induced significantly more IL-10 in high concentrations than LysateW536 (Figure 6D). The higher the LysateEcN concentration, the higher the IL-10 release observed, especially when comparing it to IL-12p40. This difference was not seen with LysateW536. Taken together, both LPS variants showed a comparable release pattern for IL-12p40 and IL-10, the latter still increasing in the highest concentration. Compared to LysateW536, stimulation with LysateEcN induced a higher release of both cytokines whereas the maximum for the release of IL-12p40 was already reached in low concentrations, the maximum for IL-10, instead, only at 100 times higher protein concentration. Interestingly, cytokine release induced by the lysates was more of a bell-shaped curve than that of the LPS variants.
Interleukin-12p40 and IL-10 release by PBMCs stimulated with LPS or lysates. Peripheral blood monocyte cell cultures (2 × 10⁶/ml) were incubated with increasing concentrations of the two LPS preparations (0–1000 ng/ml) or lysates (0–100 µg/ml) for 24 h. Produced IL-12p40 and IL-10 were quantified by ELISA in the supernatants. (A,C) IL-12p40 dose response curves after stimulation with LPS or lysates. (B,D) IL-10 dose response curves after stimulation with LPS or lysates. Results represent mean of three independent experiments with different individual blood donors.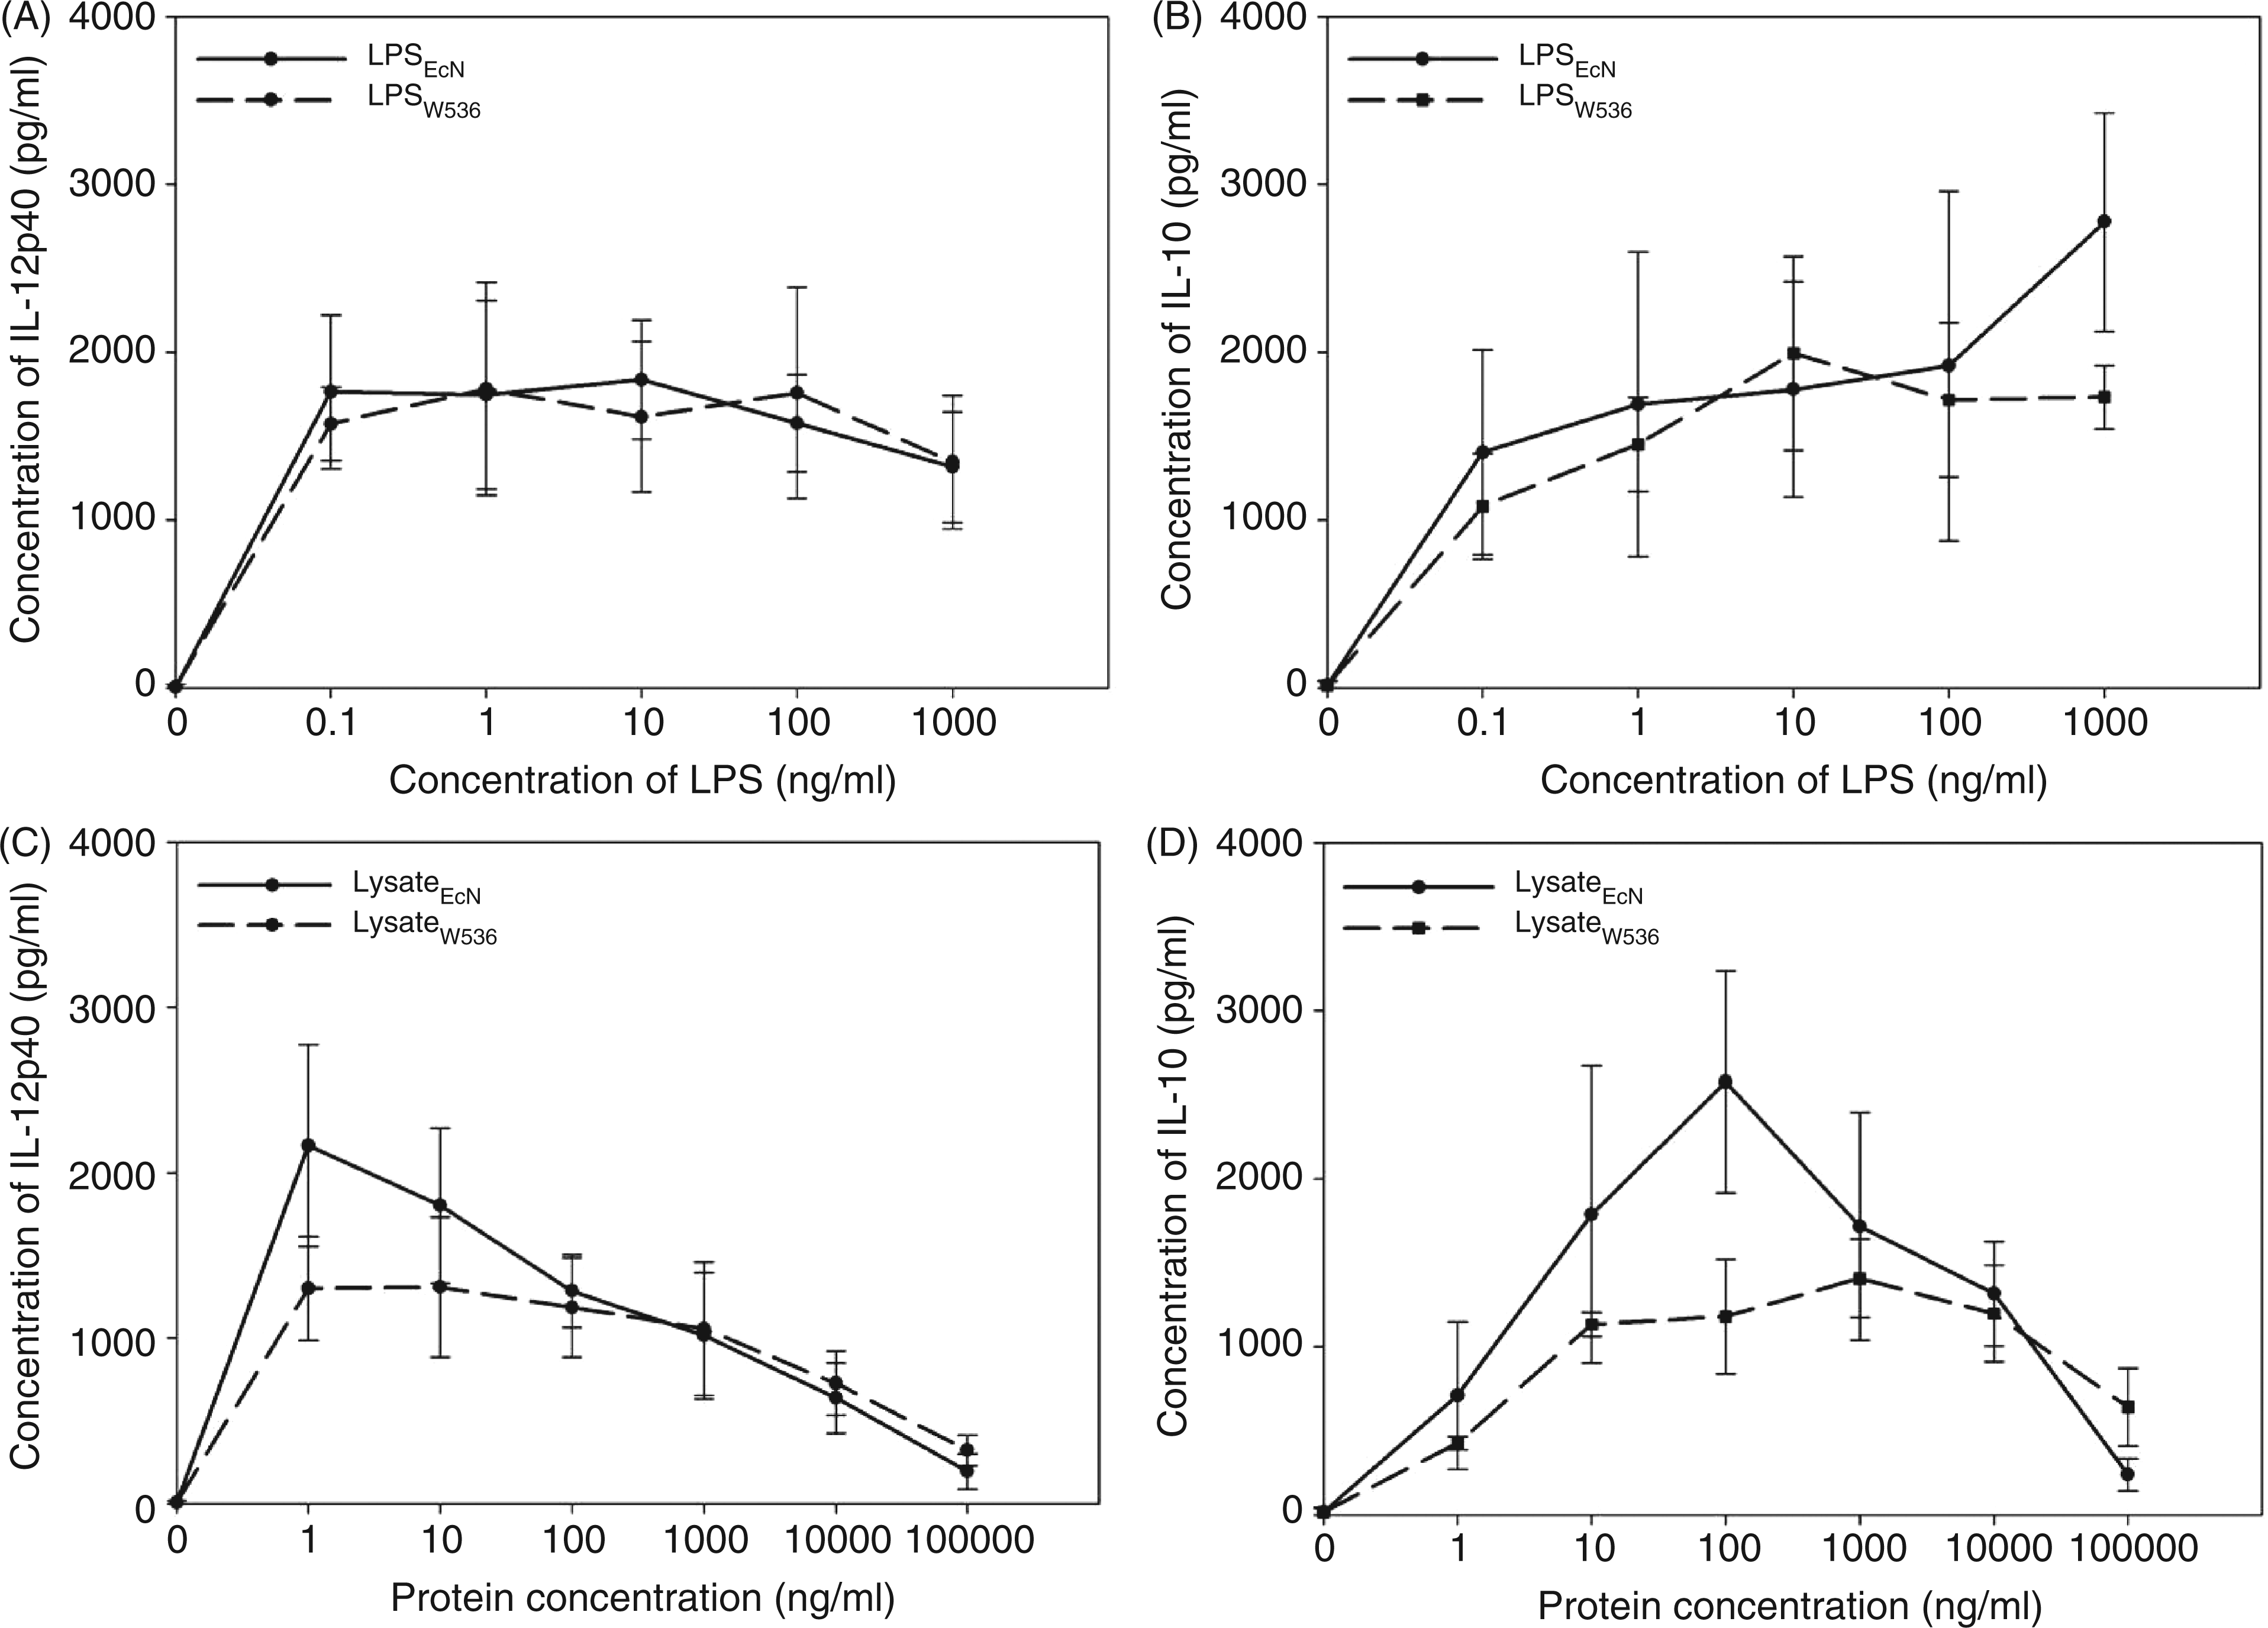
Modified IL-10 induction capacity of LysateEcN after heat-treatment and no modification by proteinase K
To understand better the difference between LPSEcN and LysateEcN concerning the IL-10 induction capacity, both preparations were exposed to different temperatures prior to stimulation of PBMCs. Interleukin-10 release following LPSEcN stimulus was independent of heat treatment (Figure 7). In contrast, pretreatment of LysateEcN at +56°C and +80°C led to an even higher dose-dependent increase of IL-10 release compared to the non-treated control at concentrations of 100 µg/ml and more. The results demonstrate that the LysateEcN contains molecules other than LPS that affect IL-10 release from PBMCs. Incubating the LysateEcN with proteinase K did not influence the IL-10 releasability of PBMCs indicating that an eventual protein part of the IL-10 inducer in the probiotic strain is not involved in this functional activity (data not shown).
Modulation of IL-10 induction by heat-treated LPSEcN or LysateEcN. PBMC cultures (2 × 10⁶/ml) were incubated with increasing concentrations of LPSEcN (0–1000 ng/ml) or LysateEcN (0–100 µg/ml) for 24 h. The LPSEcN and LysateEcN were used native or heat-treated at 56°C or 80°C for 15 min prior to stimulation. Interleukin-10 release by PBMCs was quantified by ELISA in supernatants. Data represent mean of two independent experiments with different individual blood donors.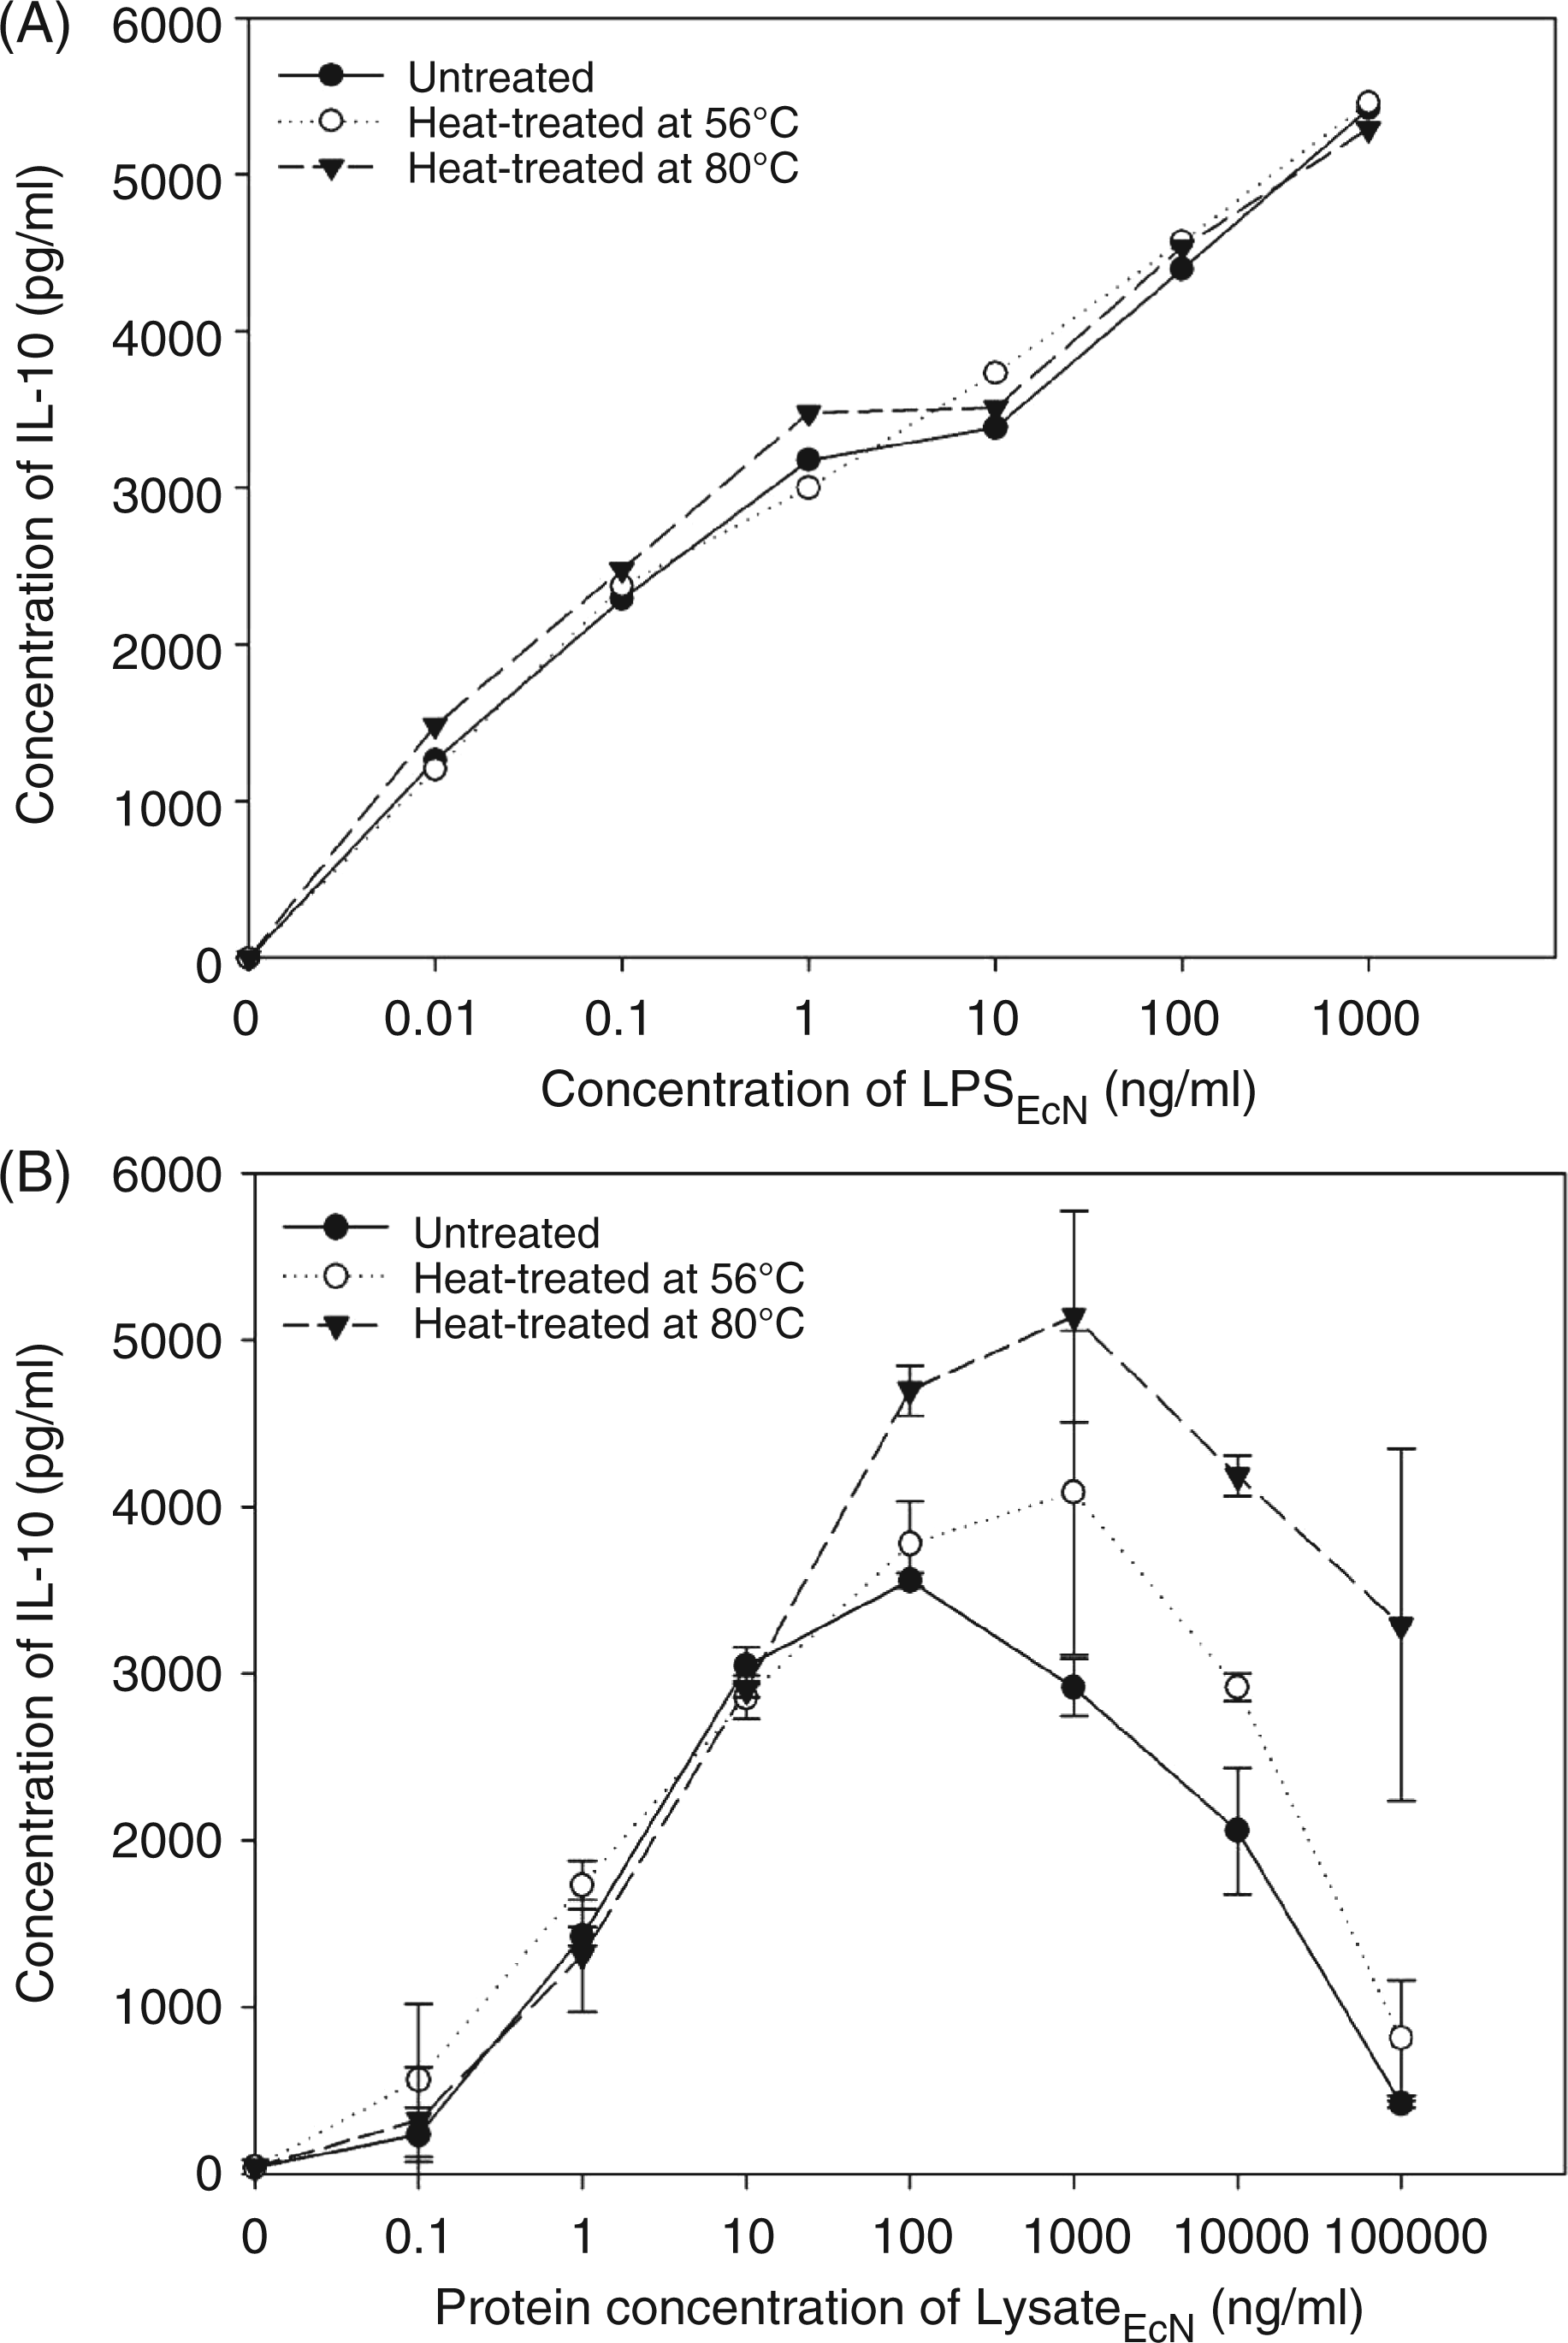
Discussion
We here demonstrate that truncated LPS as isolated from probiotic EcN does not differ from wild-type LPS in its capacity to up- or down-regulate gene expression in human PBMCs. This confirms that modulation of human blood cell response to LPS depends on the structurally identical parts of both LPS preparations. Presumably, it is the fatty acid part of LPS found in lipid A which is well known to be the ligand of CD14/TLR4/MD-2 receptor-complex on human blood monocytes. More evidence to this observation comes from our results showing that both LPS preparations induce a similar IL-12p40 and IL-10 release in PBMCs in vitro. This indicates that the interaction of LPS with CD14/TLR4/MD-2 receptor-complex is independent of the O-antigen chain length. 22
Interestingly, probably due to better resolution of qPCR, we could demonstrate that CCL24 expression was 8 times more down-regulated by LPSEcN as compared to LPSW536. Therefore, in contrast to the up-regulation of IL-12p40 and IL-10 expression, the difference in down-regulation of CCL24 expression could be due to differences in LPS composition. Gangloff et al. 23 found a correlation between high carbohydrate content of LPS and its ability to activate macrophages in the presence of CD14, demonstrating that truncated LPS-variants could not activate cytokine release although CD-14 was present. Furthermore, inhibition of CD14 in human whole blood cells can abolish CCL24 activation stimulated by Gram-negative bacteria. 24 These observations indicate that binding of the two LPS molecules to CD14 in our experiments also depends on the differences in their carbohydrate composition.
We, therefore, assume that down-regulation of CCL24 expression by the truncated LPS of the probiotic strain may be due to a dampening of activation of CCL24 as normally seen by wild-type LPS. 25 Interestingly, this difference is not seen when comparing the two lysates showing that the strongest down-regulation of CCL24 expression in our model is independent of LPS. Since CCL24 and eosinophils were reported to be increased in inflammatory bowel disease, such as colitis-ulcerosa, it is tempting to speculate that the ability of probiotic EcN to act as an anti-inflammatory agent in this disease could be associated with its shortened carbohydrate chain of LPS, lacking the repeating units of the O-chain completely.10,26
Another finding of our study indicates that lysate of probiotic EcN compared with those of the wild-type contains molecules other than LPS, which regulate a more anti-inflammatory response in vitro. Based on our cytokine release experiments, it may be assumed that, especially at low lysate concentrations, IL-12p40 is mainly induced by LPS as one molecule in the lysate. With increasing amounts of lysate, IL-12p40 is down-regulated, possibly due to counteracting factors from the lysate. One such IL-12 inhibitory factor could be IL-10 itself, as shown ealier, 27 since it had its peak at higher lysate concentrations than IL-12p40. Our data further indicate that the LysateEcN must contain additional IL-10 inducing molecules besides LPS since it activated a more potent IL-10 release than LysateW536.
Relevant and common components of Gram-negative and Gram-positive bacteria with known IL-10 stimulatory capacities are TLR agonists such as unmethylated CpG motifs, lipoproteins containing Pam3CSXXXX or Pam2CSXXX residues, peptidoglycan and lipoteichoic acids. 28 – 30 Beside such common IL-10 inducing molecules, strain-specific factors with IL-10 inductive properties were reported; for example, the filamentous hemagglutinin of Bordetella pertussis or the virulence antigen LcrV of Yersinia spp. all shown to escape the host immune response.31,32
Although we have yet not identified these additional IL-10 activating anti-inflammatory factors in LysateEcN, we present some evidence that these factors increase their solubility when heated. This could mean that they are either of protein origin, be related to proteins or only act unspecifically as aggregates. They either inhibit IL-10 release being inactivated by heat or activate IL-10 inducers showing better bioavailability at higher temperatures. Interestingly, a potential protein part of the yet unindentified molecule does not seem to be functionally relevant for IL-10 induction because an effective proteinase K treatment of the LysateEcN did not modify the response. Additionally, secondary effects that indirectly influence cellular IL-10 production must be taken into account. For instance, a yet unidentified heat-labile modulator of cytokine expression in EcN was reported to suppress TNF-α triggered inflammatory processes. 33 It is postulated that binding or activation of transcriptional factors or perhaps chromatin remodelling such as phosphorylation or acetylation of histones is involved in this suppression. One could speculate that such interventions of a heat-labile modulator in EcN could also influence the IL-10 transcription.
Conclusions
Truncation of the O-antigen in the semi-rough LPS variant from EcN is not responsible for its immune modulatory effect but is mainly due to the lipid A moiety. Both LPS variants show similar transcriptional patterns and IL-10- as well as IL-12p40-induction in human PBMCs. However, our study revealed that the truncated LPS shows less activation of CCL24 (eotaxin) expression probably due to its low carbohydrate content. Furthermore, our data indicate that other stimulatory components are present in EcN which induce enhanced IL-10 release by LysateEcN as compared with LysateW536. Finally, since the inhibition of CCL24 expression is even more prominent when cells are activated by both lysates compared to LPS alone, this demonstrates that the probiotic mechanisms of EcN depend on the synergistic effects of several substances which still have to be identified in further studies.
Footnotes
Funding
This work was kindly supported by Ardeypharm GmbH (Herdecke, Germany).
Acknowledgements
Anne-Katrin Güttsches and Stefan Löseke contributed equally to this study. The authors thank A. Friedrichs from the Department of Medical Microbiology, Institute for Hygiene and Microbiology, as well as Sandra Werner from the Department of Experimental Pneumology, both University of Bochum, Germany for their support and excellent technical assistance. Special thanks to Ursula Schombel, Research Center Borstel, for skilful extraction and purification of LPS preparations.