
Abstract
Dyslipidemia and hepatic overproduction of very low density lipoprotein (VLDL) are hallmarks of the septic response, yet the underlying mechanisms are not fully defined. We evaluated the lipoprotein subclasses profile and hepatic VLDL assembly machinery over 24 h in fasted LPS-treated rats. The response of serum non-esterified fatty acids (NEFA) and glucose to endotoxin was biphasic, with increased levels of NEFA and hypoglycemia in the first 12 h-phase, and low NEFA and high glucose in the second 12 h-phase. Hypertriglyceridemia was more marked in the first 12 h (6.8-fold), when triglyceride abundance increased in all lipoprotein subclasses, and preferentially in large VLDL. The abundance of medium-sized VLDL and the increase in the number of VLDL particles was higher in the second phase (10-fold vs 5-fold in the first phase); however, apoB gene transcript abundance increased only in the second phase. Analysis of putative pre-translational mechanisms revealed that neither increased Apob transcription rate nor increased transcript binding to mRNA stabilizing HuR (Hu antigen R) protein paralleled the increase in apoB transcripts. In conclusion, endotoxin challenge induces increases in plasma NEFA and large, triglyceride-rich VLDL. After approximately 12 h, the triglyceride-rich VLDLs are replaced by medium-sized, triglyceride-poor VLDL particles. Hepatic apoB mRNA abundance also increases during the second period, suggesting a role for apoB protein expression in the acute reaction against sepsis.
Keywords
Introduction
Gram-negative sepsis is an increasingly clinical syndrome triggered by exposure to bacterial LPS or endotoxin. To fight the infection and restore homeostasis, the organism produces a systemic reaction controlled by pro-inflammatory cytokines and Kupffer cell products, the so-called acute-phase response (APR), that can ultimately lead to pathological condition. 1 In addition to modifications in circulating acute-phase proteins 2 and altered glucose homeostasis, 3 increased plasma lipid levels provide a well-known marker in septic patients, clinically defined as ‘lipemia of sepsis’ (reviewed by Khovidhunkit et al. 4 ). The rise in circulating lipids is mainly caused by a rapid accumulation of triglycerides (TG) within very low density lipoprotein (VLDL), although other lipids such as non-esterified fatty acids (NEFA) coming from peripheral tissue lipolysis4,5 or cholesterol, in the case of rodents, can also be elevated. 6
It is increasingly believed that sepsis-induced hypertriglyceridemia represents an innate immune reaction against infection.4,7,8 Both in vitro9,10 and in vivo 11 studies have demonstrated that all lipoprotein classes are able to bind LPS, through their phospholipid 11 or apolipoprotein10,12 components, in such a way that lipoprotein-bound LPS is subsequently cleared from the circulation. 8 Most of the LPS-binding ability corresponds to high density lipoprotein (HDL) particles; 10 however, when levels of VLDL are increased and HDL diminished, as may occur in endotoxemia, the binding appears to shift towards VLDL12,13 and partially depends on interacting with apolipoprotein B (apoB). 12 Therefore, higher secretion levels of VLDL of any size may be regarded as a protective mechanism against infection.
The sepsis-associated increase in plasma VLDL–TG levels is ascribable both to inhibited peripheral clearance 4 and increased hepatic secretion of VLDL.14,15 The assembly and secretion of VLDL in hepatocytes seems to occur in two steps (reviewed by Gibbons et al. 16 ). First, during translocation across the endoplasmic reticulum membrane, nascent apoB associates with lipids provided by the essential chaperone microsomal triglyceride transfer protein (MTP). Second, additional lipids, primarily TG, and other apoproteins are added to form the nascent fully lipidated VLDL particles. The Apob gene has been considered to be constitutively expressed 17 and VLDL assembly regulation as a post-transcriptional event. However, numerous studies have shown changes in hepatic apoB mRNA levels under a variety of inflammatory conditions.18,19 In rats, we found that apoB mRNA levels increased in periportal and perivenous hepatocytes in response to LPS injection14,20 and that exposure of primary hepatocytes to LPS-stimulated Kupffer cell-conditioned medium 15 or to individual or combined pro-inflammatory cytokines led to augmented apoB mRNA expression.15,21,22 We hypothesized that, during the APR, transcriptional or post-transcriptional regulation affecting apoB mRNA levels might occur supplying more apoB competent for VLDL assembly, given that apoB secretion was enhanced in all cases. One aspect of this regulation could be the modulation of mRNA stability through cis-regulatory elements residing in the 5-′ and 3′-untranslated regions (UTR) and adequate RNA binding proteins. HuR is one of the most important proteins with a described role in stabilizing inflammatory AU-rich elements (ARE)-bearing RNAs. 23 Interestingly, and supporting our hypothesis, it was found that the human apoB mRNA contains ARE at 5′ and 3′ UTR. 24
Although extensive studies have been carried out to clarify the involvement of sepsis-promoted changes in lipid and lipoprotein metabolism in the APR, changes in lipoprotein-subclass lipid profiles and the impact of the metabolic background on the mechanisms underlying hepatic VLDL overproduction have not been fully established. We show that there are two metabolic phases during acute endotoxemia which are characterized by systemic fuel switching, specific lipid transport profiles and VLDL features. We also show for the first time that the elevation in the hepatic apoB transcript encompassing the late response is secondary neither to a higher transcription rate of apoB gene nor to a superior binding of apoB mRNA to the stabilizing HuR protein.
Materials and methods
Chemicals
Lipopolysaccharide from Escherichia coli O11:B4 and BSA were purchased from Sigma-Aldrich (St Louis, MO, USA). [α-32P]-dCTP (3000 Ci/mmol) and [α-32P]-UTP (3000 Ci/mmol) were obtained from Amersham Biosciences (UK). ApoB cDNA was provided by Dr M.P. Sowden (University of Rochester Medical Center, Rochester, NY, USA) and the MTP cDNA was synthesized as described previously. 14
Animals
Female Sprague–Dawley rats (180–200 g), obtained from Charles River Laboratories (Barcelona, Spain), were housed in temperature controlled rooms with a 12-h light–dark cycle and provided standard AO4 rodent chow (Panlab, Barcelona, Spain) and water ad libitum. After 1 wk of acclimatization, at the end of the dark period of the light–dark schedule, rats were randomly divided into 16 groups and injected intraperitoneally with LPS (1 mg/kg body weight in 0.3 ml saline) or with saline alone. Food was withdrawn at the time of injection since LPS alters food intake in rodents. 25 After 2, 4, 6, 8, 12, 16, 18 and 24 h of treatment, rats were anesthetized, blood samples were collected by superior vena cava puncture and centrifuged (1300 g, 15 min, at 4°C) to obtain serum. Livers were removed, rinsed in ice-cold PBS, weighed and either used immediately or stored at –80°C until analysis. All animal procedures were approved by the Institutional Ethics Committee.
Serum biochemistry
Serum was used immediately to measure triglycerides, cholesterol, HDL-C, glucose and albumin (M. Lafita, Getxo, Spain). NEFA and ketone body concentrations were determined using commercially available kits (Wako Chemicals Inc., Richmond, VA, USA). Insulin concentration was measured at Reference Laboratory (Barcelona, Spain) by immunoradiometric assay.
Analysis of serum lipoprotein lipid profile
Serum lipoproteins were analysed by a computer-assisted online dual enzymatic method for the simultaneous quantification of total cholesterol and triglycerides in 20 HPLC-separated lipoprotein fractions at Skylight Biotech Inc. (Akita, Japan) according to the procedure described by Usui et al. 26 The HPLC system consisted of an AS-8020 autoinjector, CCPS and CCPM-II pumps, and two UV-8020 detectors (Tosoh, Japan). An SC-8020 system controller (Tosoh) was used for instrument regulation and data collection. Aliquots (10 µl) of serum, were injected into two tandem connected TSK gel LipopropakXL columns (300 × 7.8-mm; Tosoh). The column effluent was split equally into two lines by a Micro-Splitter P-460 (Upchurch Scientific Inc., Oak Harbor, WA, USA) in order to achieve simultaneous determination of lipids from a single injection. Concentrations of total cholesterol and triglyceride were calculated by comparison with total area under the chromatographic curves of a calibration standard of known concentration. The particle size of lipoproteins was estimated by the elution time of the column and appropriate size markers. 26
Isolation of serum VLDL and VLDL–apoB determination
The VLDLs were isolated from fresh serum by centrifugation at a density of 1.006 g/ml as described previously. 20 ApoB100 and apoB48 were resolved by SDS-PAGE, the protein bands were stained with Gelcode Blue Stain reagent (Pierce, Rockford, IL, USA), and apoB100 and apoB48 were quantified by optical densitometry using Quantity One software (Bio-Rad, Hercules, CA, USA) and phosphorylase b as a standard.
Determination of triglyceride transfer activity of the MTP
After liver perfusion with saline to remove blood, microsomes were prepared from homogenates as described by Athar et al. 27 The TG transfer activity was determined using fluorescence-labelled donor and unlabelled acceptor vesicles provided by Chylos, Inc. (Woodbury, NY, USA). Assays were carried out in triplicate in 96-well, microfluor 2 black, U-bottom microtiter plates (Thermo Labsystems, Franklin, MA, USA), using 15 µg of protein as the MTP source, in a total volume of 100 µl. Blanks and positive controls were also carried out with the supplied purified MTP. Fluorescence was recorded, both immediately after adding the MTP source and after 75 min of incubation at room temperature, using a fluorescence plate reader (Synergy HT, Bio-Tek Instruments, Inc.) with 460 nm excitation and 525 nm emission wavelengths. The MTP TG transfer activity was calculated as percentage TG transfer/h/mg protein after correction using the blank values.
Determination of ApoB, MTP and α-2 macroglobulin transcript expression
Total RNA was extracted from fresh liver (100 mg) using TRIzol reagent (Invitrogene Life Technologies, Barcelona, Spain) and a Polytron homogenizer and was quantified using a NanoDrop ND-1000 spectrophotometer (NanoDrop Technologies, Wilmington, DE, USA). The RNA purity was determined by the A260/A280 ratio (all samples > 1.8). The transcript levels of apoB and MTP were determined by Northern blotting as described earlier. 22 Since LPS alters hepatic mRNA levels of common housekeeping genes, 28 we used non-normalized data sets for comparisons between groups, taking extreme care in RNA quantification and loading. The α-2 macroglobulin mRNA expression, a positive APR control, was determined by quantitative real-time PCR. First-strand cDNA was synthesized from 1 µg RNA using the SuperScript III system (Invitrogen) and PCR analysis was conducted by the SYBR Green method using the ABI 7000 Sequence Detection System (Applied Biosystems, Foster City, CA, USA). The relative amounts of mRNA were calculated from the CT data using calibration curves and normalized using 18S and acidic ribosomal phosphoprotein P0 (ARBP) and GeNorm 3.5 software. The GeneBank accession numbers and primers are: α-2 macroglobulin, NM_012488, forward: CTTCTCCTCAGTCCCTTTG, reverse: GGCGAGTACAGGATTCCATT; 18S, X01117, forward: AAGTCCCTGCCCTTTGTACACA, reverse: TCCGAGGGCCTCACTAAACC; and ARBP, NM_022402, forward: CGACCTGGAAGTCCAACTAC, reverse: ATCTGCTGCATCTGCTTG.
Nuclear run-on measurement of Apob transcription rate
Preparation of transcriptionally active nuclei and measurement of the Apob gene transcription rate were performed as described by Jover et al.
29
Pieces of liver (2 g) from 16 h saline- and LPS-treated rats were homogenized in a 0.3
Determination of apoB mRNA binding to HuR
Binding of apoB mRNA to HuR was evaluated in livers from 18-h LPS-treated rats by immunoprecipitation followed by quantitative real-time PCR. Liver homogenates were centrifuged at 16,000 g for 30 min and supernatants used for immunoprecipitation of RNA-protein complexes by incubation (1 h, 4°C) with a 50% (v/v) suspension of Protein A–Sepharose beads (Sigma-Aldrich, St Louis, MO, USA) precoated (overnight) with 30 µg of either IgG1 (BD Pharmingen, San Diego, CA, USA) or anti-HuR (Santa Cruz Biotechnology Inc., Santa Cruz, CA, USA) antibodies. Beads were washed using NT2 buffer (50 m
Protein and statistical analysis
Proteins were determined by the dye-binding Coomassie technique (Pierce, USA) using BSA as standard. The results are expressed as mean ± SEM of n independent animals or experiments. Differences between the individual values of control and LPS-treated groups were determined by using the unpaired Student’s t-test. Trends along the time for each condition were evaluated by ANOVA repeated measurements followed by the Duncan post hoc test. A P-value of ≤0.05 was considered statistically significant.
Results
Characterization of the metabolic background of LPS-induced sepsis over 24 h in fasted rats revealed a biphasic response with systemic fuel switching
We observed that serum albumin, a negative acute-phase protein, decreased by 10% from 16 h onwards and that the hepatic mRNA levels for the positive acute-phase protein α2-macroglobulin was 215-fold times higher after 24 h of LPS injection than in control animals (data not shown), confirming that LPS had induced the septic reaction. Figure 1A shows that LPS led to a rapid and sustained rise in serum TG levels. The TG concentration increased about 2-fold as early as 2 h after treatment, it peaked at 8 h with more than a 6-fold rise and maintained nearly 2-fold differences up to 24 h. Moderate (∼20%), though significant, decreases in HDL-C were registered at 18 h and 24 h of LPS challenge (Figure 1B), although total cholesterol concentration was not altered at any of the test times (data not shown). It has been reported that endotoxin activates adipose tissue lipolysis
4
and impairs glucose homeostasis.
3
Serum NEFA levels tended to increase from 2 h (Figure 1C). The rise was effective at 8 h (∼70%) and was paralleled by hypoglycemia (Figure 1D). Both substrates returned to baseline at 12 h (Figure 1C,D), and from 16 h onwards and at least until 24 h, NEFA always remained below control levels although hyperglycemia was recorded. The level of ketone bodies was significantly decreased by LPS compared with their corresponding fasted control from 12 h (Figure 1E). The concentration of insulin was higher in LPS-treated animals from 8 h onwards (Figure 1F). An ANOVA statistical analysis of data revealed that, except for HDL-C, all the serum parameters in study were affected by LPS treatment (P ≤ 0.001; Figure 1). Two different metabolic backgrounds are, therefore, associated with the initial septic response in fasting rats: switching from NEFA to glucose after 12 h of endotoxin contact, with low levels of ketone bodies and elevated insulin in the second phase.
Time-course effects of LPS on serum levels of lipids, insulin, glucose and on hepatic index. Rats were injected with LPS (1 mg/kg body weight; filled circles) or saline (open circles), and food-deprived immediately after injection. At the times indicated, blood was collected and serum samples analysed for triglycerides (A), HDL-C (B), NEFA (C), glucose (D), ketone bodies (E) and insulin (F) as described in Materials and Methods. Hepatic index, expressed as relative percentage of liver to body weight, is shown in (G). Data are the mean ± SEM from 3–10 animals per group. Differences between control and LPS-treated individual values were determined by using the unpaired Student’s t-test. Statistical differences between LPS and time-matched controls are denoted by *P ≤ 0.05, **P ≤ 0.01 and ***P ≤ 0.001. Trends along the time for each condition were evaluated by ANOVA repeated measurements followed by the Duncan post hoc test. Differences between the two series are denoted by aP ≤ 0.001, bnot significant (ANOVA).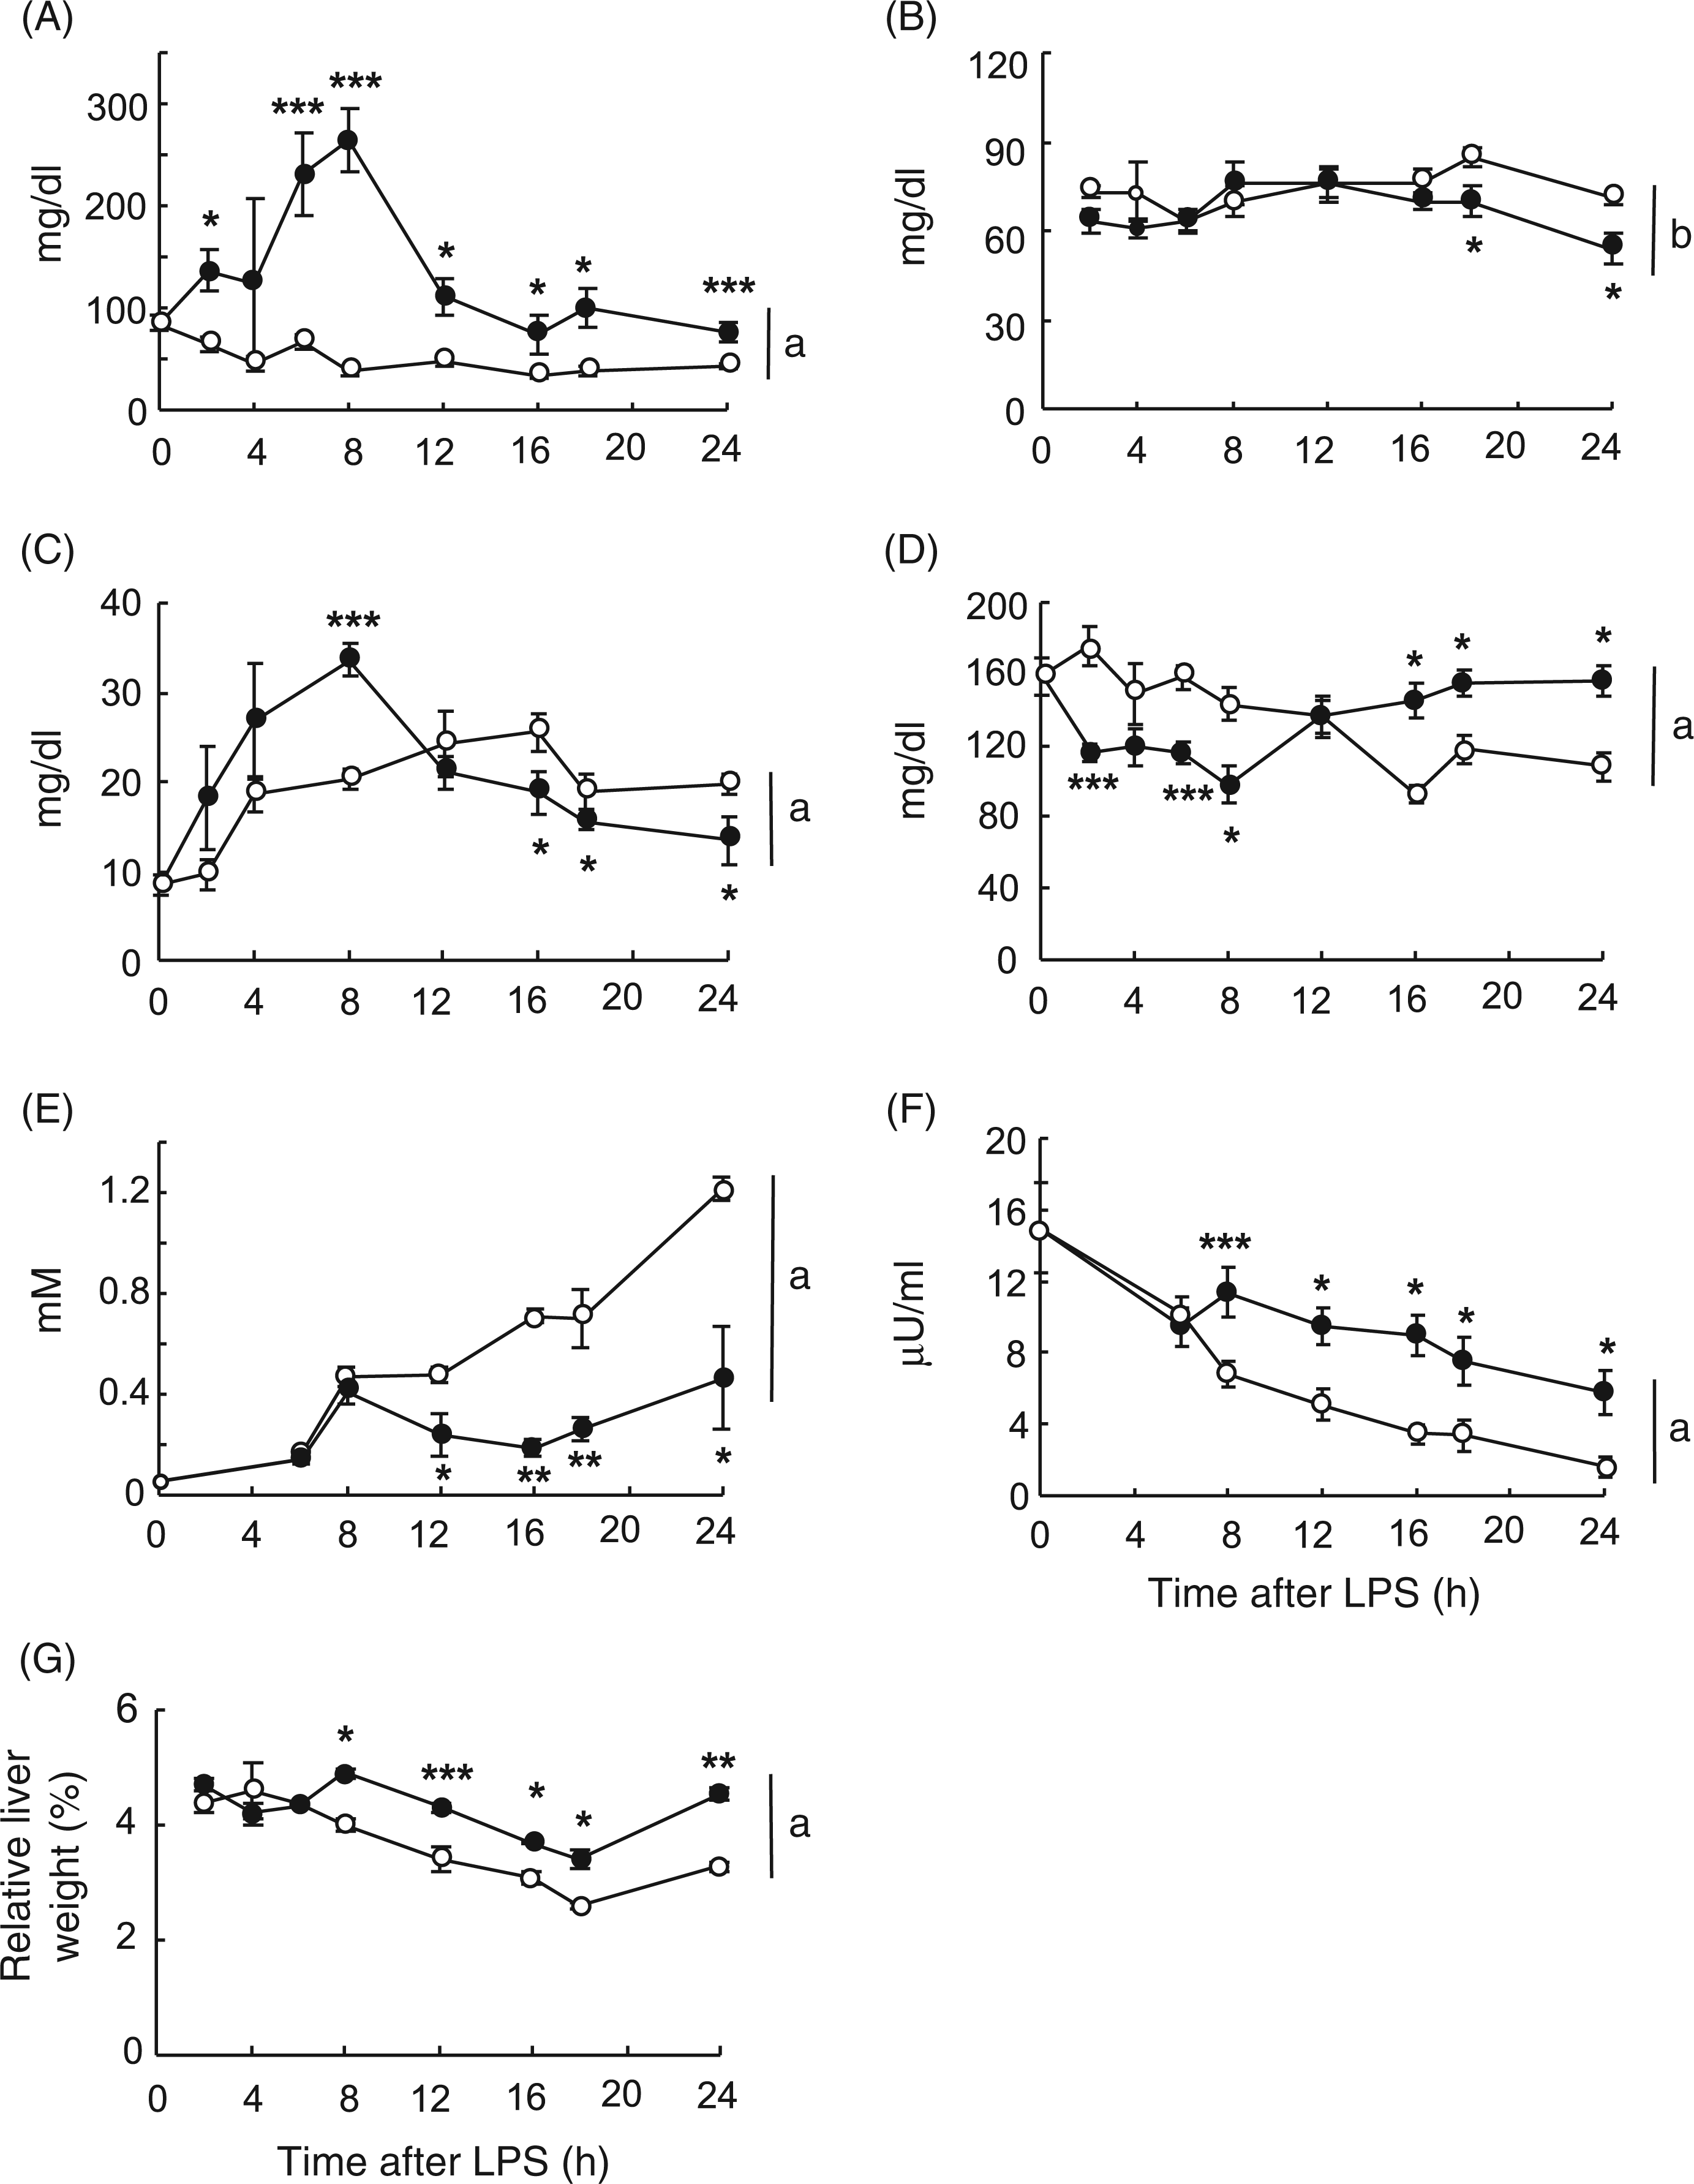
From 8 h onwards, the hepatic index was higher in LPS- than in vehicle-treated rats, with increases of 20–30% in the liver-to-body ratio (Figure 1G). The liver-to-body weight ratio exhibited its maximum and minimum values at 8 h and 18 h, respectively. These two time-points were chosen for further analysis as representative of the two different metabolic conditions we found in the acute sepsis response with either high NEFA (NEFA-phase, 8 h) or high glucose (glucose-phase, 18 h; Figure 1C,D).
Lipopolysaccharide alters lipid transport in definite VLDL, LDL and HDL subclasses and there is a time-differential pattern in VLDL–TG
Although there are some studies characterizing the lipoprotein lipid profiles in sepsis,
11
further research is needed in this area. We used Liposearch methodology and concomitant terminology to analyse LPS-induced alterations in triglyceride and cholesterol distribution in 20 HPLC-separated lipoprotein fractions after 8 h and 18 h of endotoxin challenge. Figure 2 shows the LPS effect on the concentration of total cholesterol and TG in each lipoprotein fraction (Figure 2A). The lipid fold-change for each serum lipoprotein fraction was calculated as the ratio between the lipid concentration in pair-matched fractions from LPS- and vehicle-treated rats (Figure 2B). Three subclasses were defined for VLDL (large, medium and small), four for LDL (large, medium, small and very small) and five for HDL (very large, large, medium, small and very small). The TG level increased in all lipoprotein classes, and, as expected, VLDL particles were the major contributors to hypertriglyceridemia with rises of 8.2-fold and 3.2-fold at 8 h and 18 h, respectively. However, there were differences in the peaking fraction. In the NEFA-phase (8 h), the greatest VLDL-TG increase was found in large VLDL (9.2-fold; Figure 2B). After 18 h of LPS treatment, the peak shifted to medium and small VLDL particles (∼4.2-fold; Figure 2B). Likewise, the increase in LDL–TG was associated with all LDL subclasses, at both times peaking in the largest lipoprotein subclass (Figure 2B). Note that the so-called ‘large LDL’, together with ‘small VLDL’, corresponds, by density, to intermediate-density lipoproteins. Triglycerides also rose in all HDL lipoprotein subclasses. The largest increase, 7.3 times at 8 h corresponded, once more, to very large HDL (Figure 2B). At 18 h, similar rises of around 2-fold were recorded in very large, large and small HDL.
Lipopolysaccharide-promoted changes in triglyceride and cholesterol transport in lipoprotein subclasses under the two defined metabolic conditions. Animals were injected with LPS (1 mg/kg body weight; filled circles) or saline (open circles), food-deprived immediately after treatment, and blood collected 8 h or 18 h following injection. Serum samples were analysed for lipoprotein lipid by Liposearch using HPLC separation coupled with a dual enzymatic analysis for lipid quantification. (A) Lipoprotein TG and total cholesterol profiles. (B) Fold-change induced by endotoxin administration in the TG and cholesterol contents in each lipoprotein subclass. Data are the mean ± SEM from 3 animals per group. Statistical differences between LPS and the control group are denoted by *P ≤ 0.05, ** P ≤ 0.01 and ***P ≤ 0.001.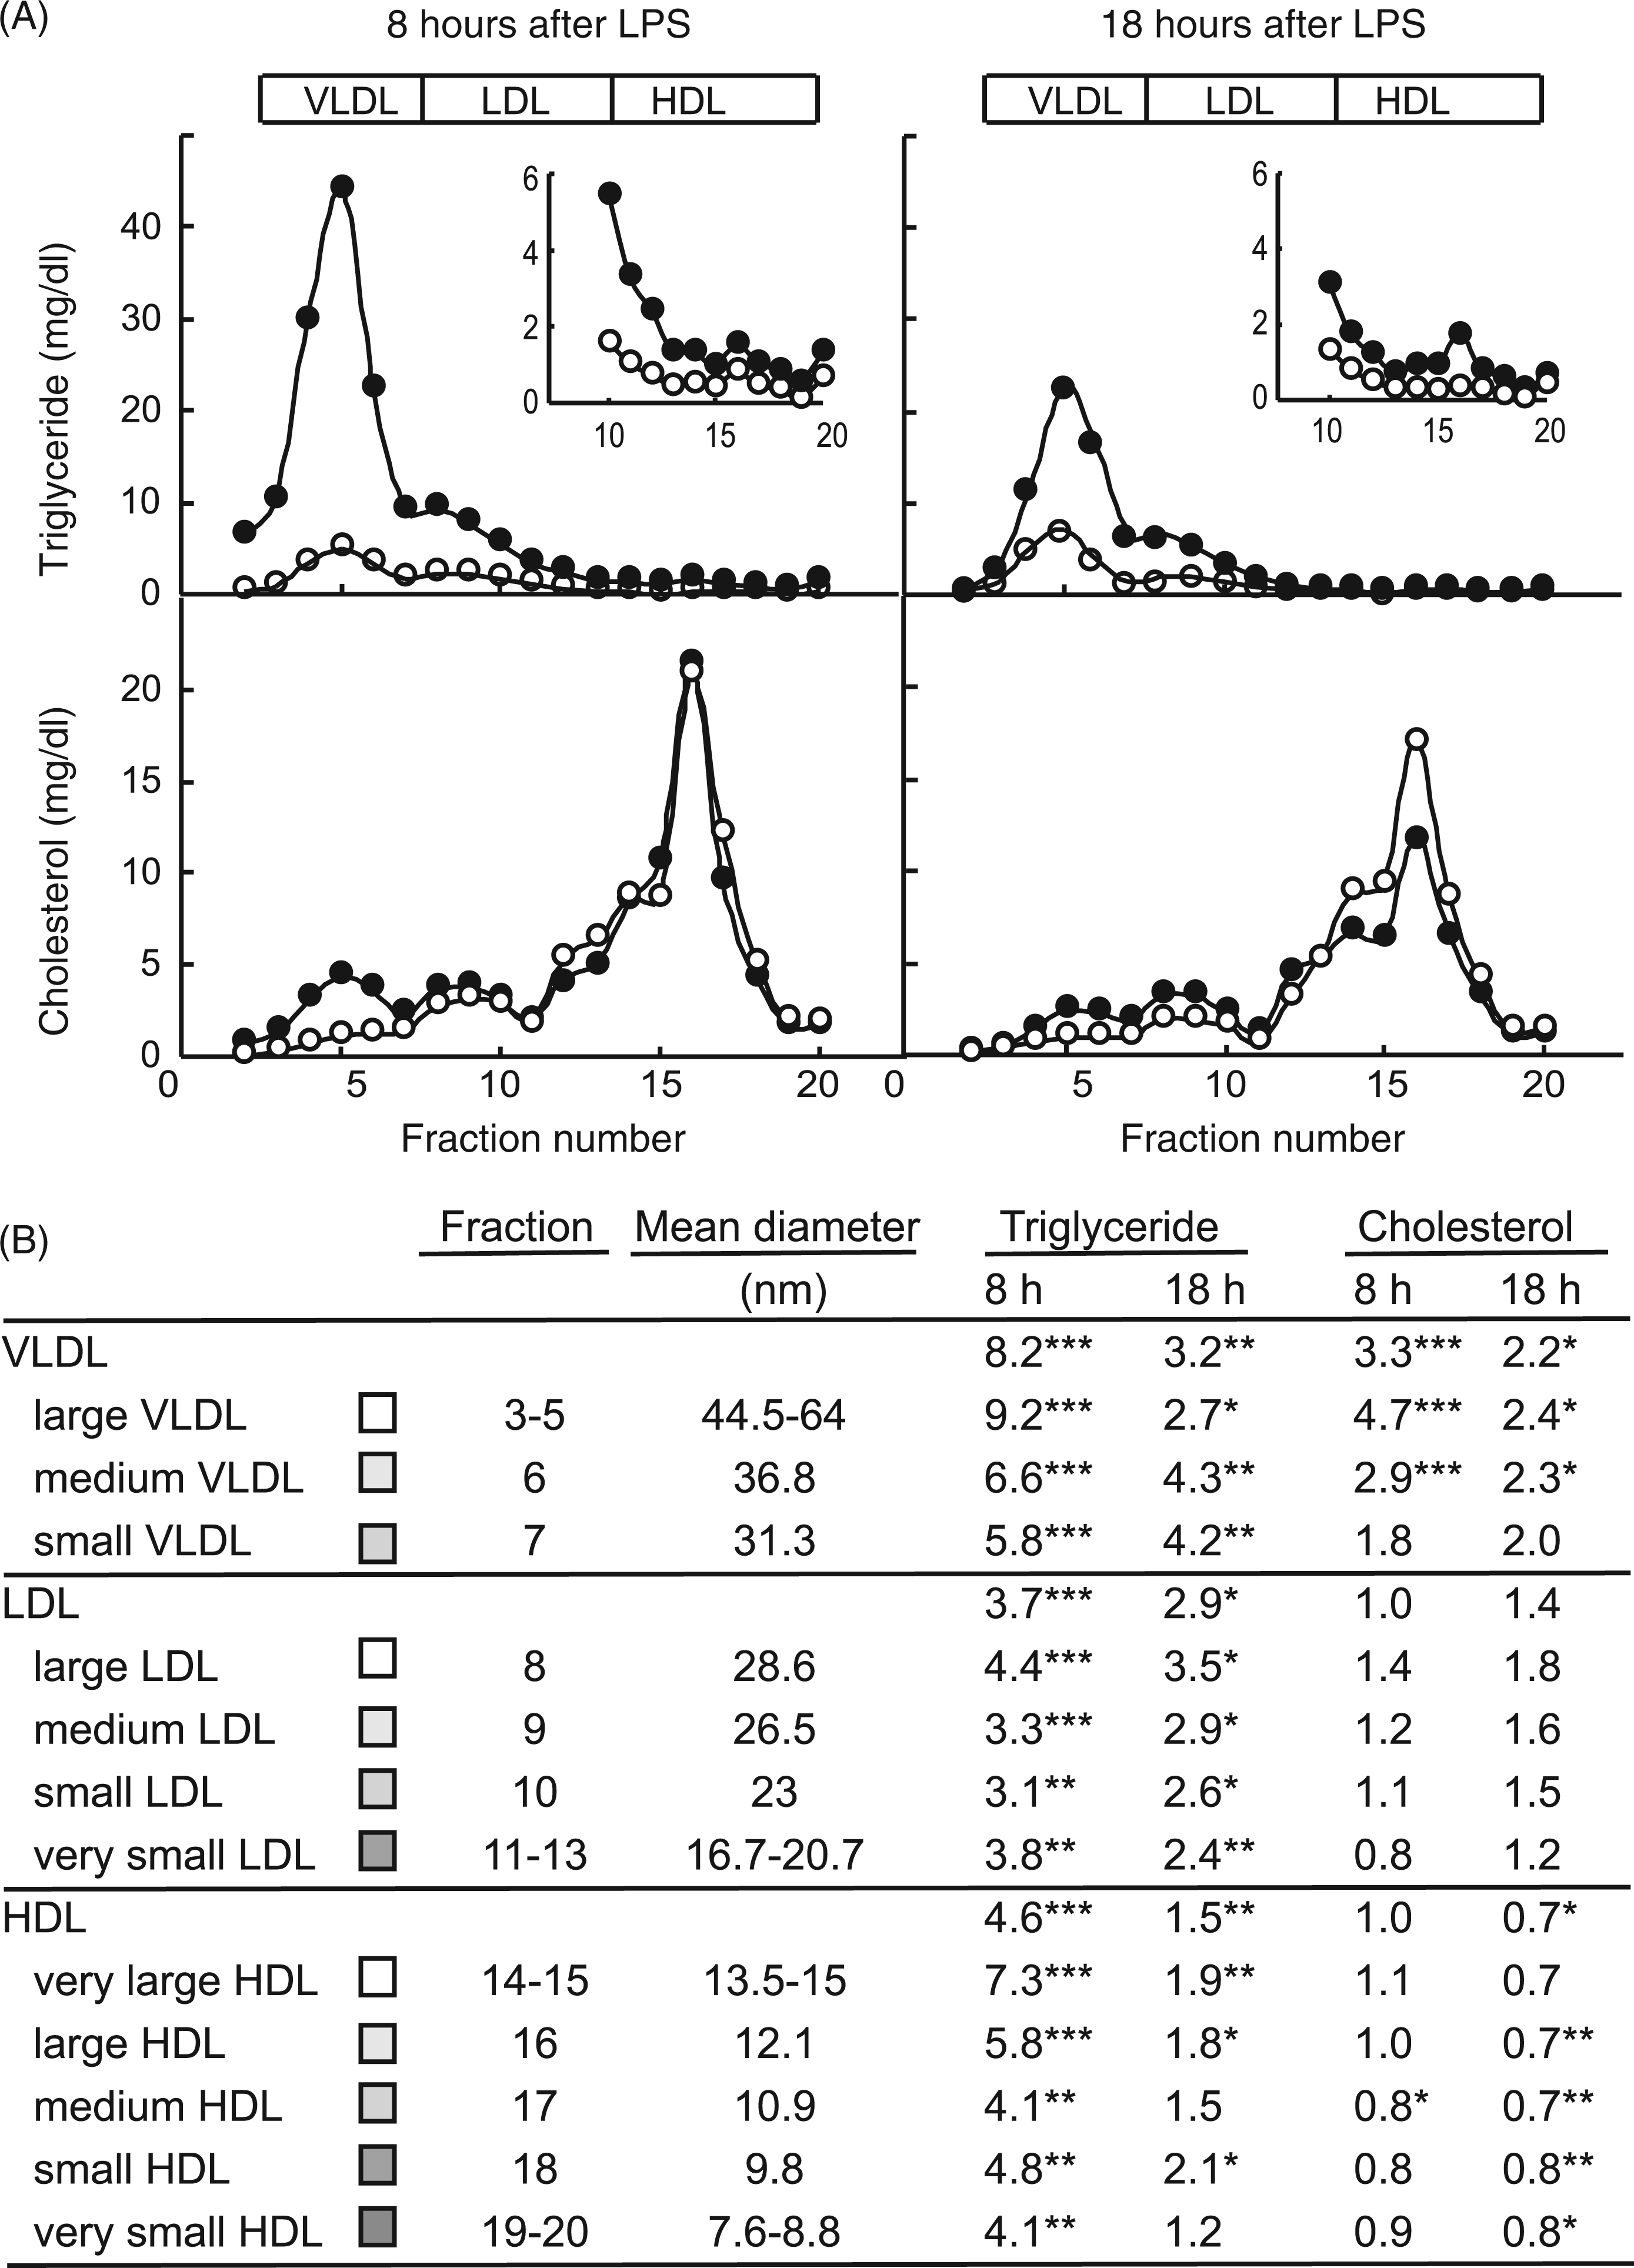
Total cholesterol increased in large and medium VLDL both in the NEFA- and glucose-phases, with the largest rise (4.7-fold and 2.7-fold after 8 h and 18 h) being associated with large VLDL. As shown by serum biochemistry, HDL-C levels fell, concomitant to decreases in all HDL subclasses. Results obtained from analysing the lipoprotein lipid profile indicate that hypertriglyceridemia is associated with lipoprotein subclasses of different sizes during the course of the APR. The highest TG increase was found in the NEFA-phase associated mainly to 44–64 nm VLDL and small-dense LDL, while the rise observed in the glucose-phase, was less pronounced and peaked in smaller 31–37 nm VLDL particles.
Lipopolysaccharide leads to a more marked rise in the number of circulating VLDL particles after 18 h than after 8 h and apoB100 is more affected
Based on apoB quantities in isolated (d < 1.006 g/ml) serum VLDL, the 8.2-fold rise in VLDL–TG was linked to a 5-fold elevation in the number of circulating VLDL particles at 8 h (Figure 3A). Increases were recorded both in apoB48 (4.5-fold) and, to a greater extent, in apoB100 (8-fold); whereby the apoB48:apoB100 ratio decreased from 3 in controls to 1.8 in LPS-injected rats. At 18 h, the number of VLDL particles increased 10-fold; the increase was also higher in VLDL containing apoB100 (14-fold) than in apoB48 (8-fold), the apoB48:apoB100 ratio dropped from 2.7 in controls to 1.5 in LPS-treated animals. Interestingly, the lipid mass carried by each endotoxic VLDL particle is phase-specific, as can be inferred from Figures 2 and 3. The VLDL particles are TG-rich and slightly depleted in cholesterol in the NEFA-phase, whereas in the glucose-phase the content of triglycerides and cholesterol per particle diminishes substantially.
Effects of LPS on serum VLDL–apoB amounts and on hepatic parameters related with apoB mRNA availability. Rats were injected with LPS (1 mg/kg body weight) or saline and fasted, and 8 h or 18 h later (16 h in transcription assays) blood was collected and livers excised. (A) VLDL were isolated from serum and VLDL–apoB isoforms determined. The results are mean ± SEM of three experiments performed in duplicate. (B) Total RNA was extracted from liver samples and apoB mRNA levels were measured by Northern blotting using a
32
P-labeled cDNA probe. The results are given as percentage control and expressed as mean ± SEM of three experiments performed in duplicate. A blot corresponding to one experiment in which samples from two different animals were run for each state (control-fasted or LPS-fasted) is shown at the bottom of the histogram. (C) The hepatic Apob transcription rate was measured by run-on assays in isolated liver nuclei as described in Materials and Methods. The results are given as percentage control and are expressed as mean ± SEM of three transcription reaction per group, each one containing nuclei from two rats. (D) Binding of apoB mRNA to HuR protein in the liver (18 h) was assessed as described in Materials and Methods. The figure represents replicates in one experiment representative of three performed. Statistical differences between LPS and the control group are denoted by *P ≤ 0.05, **P ≤ 0.01 and ***P ≤ 0.001.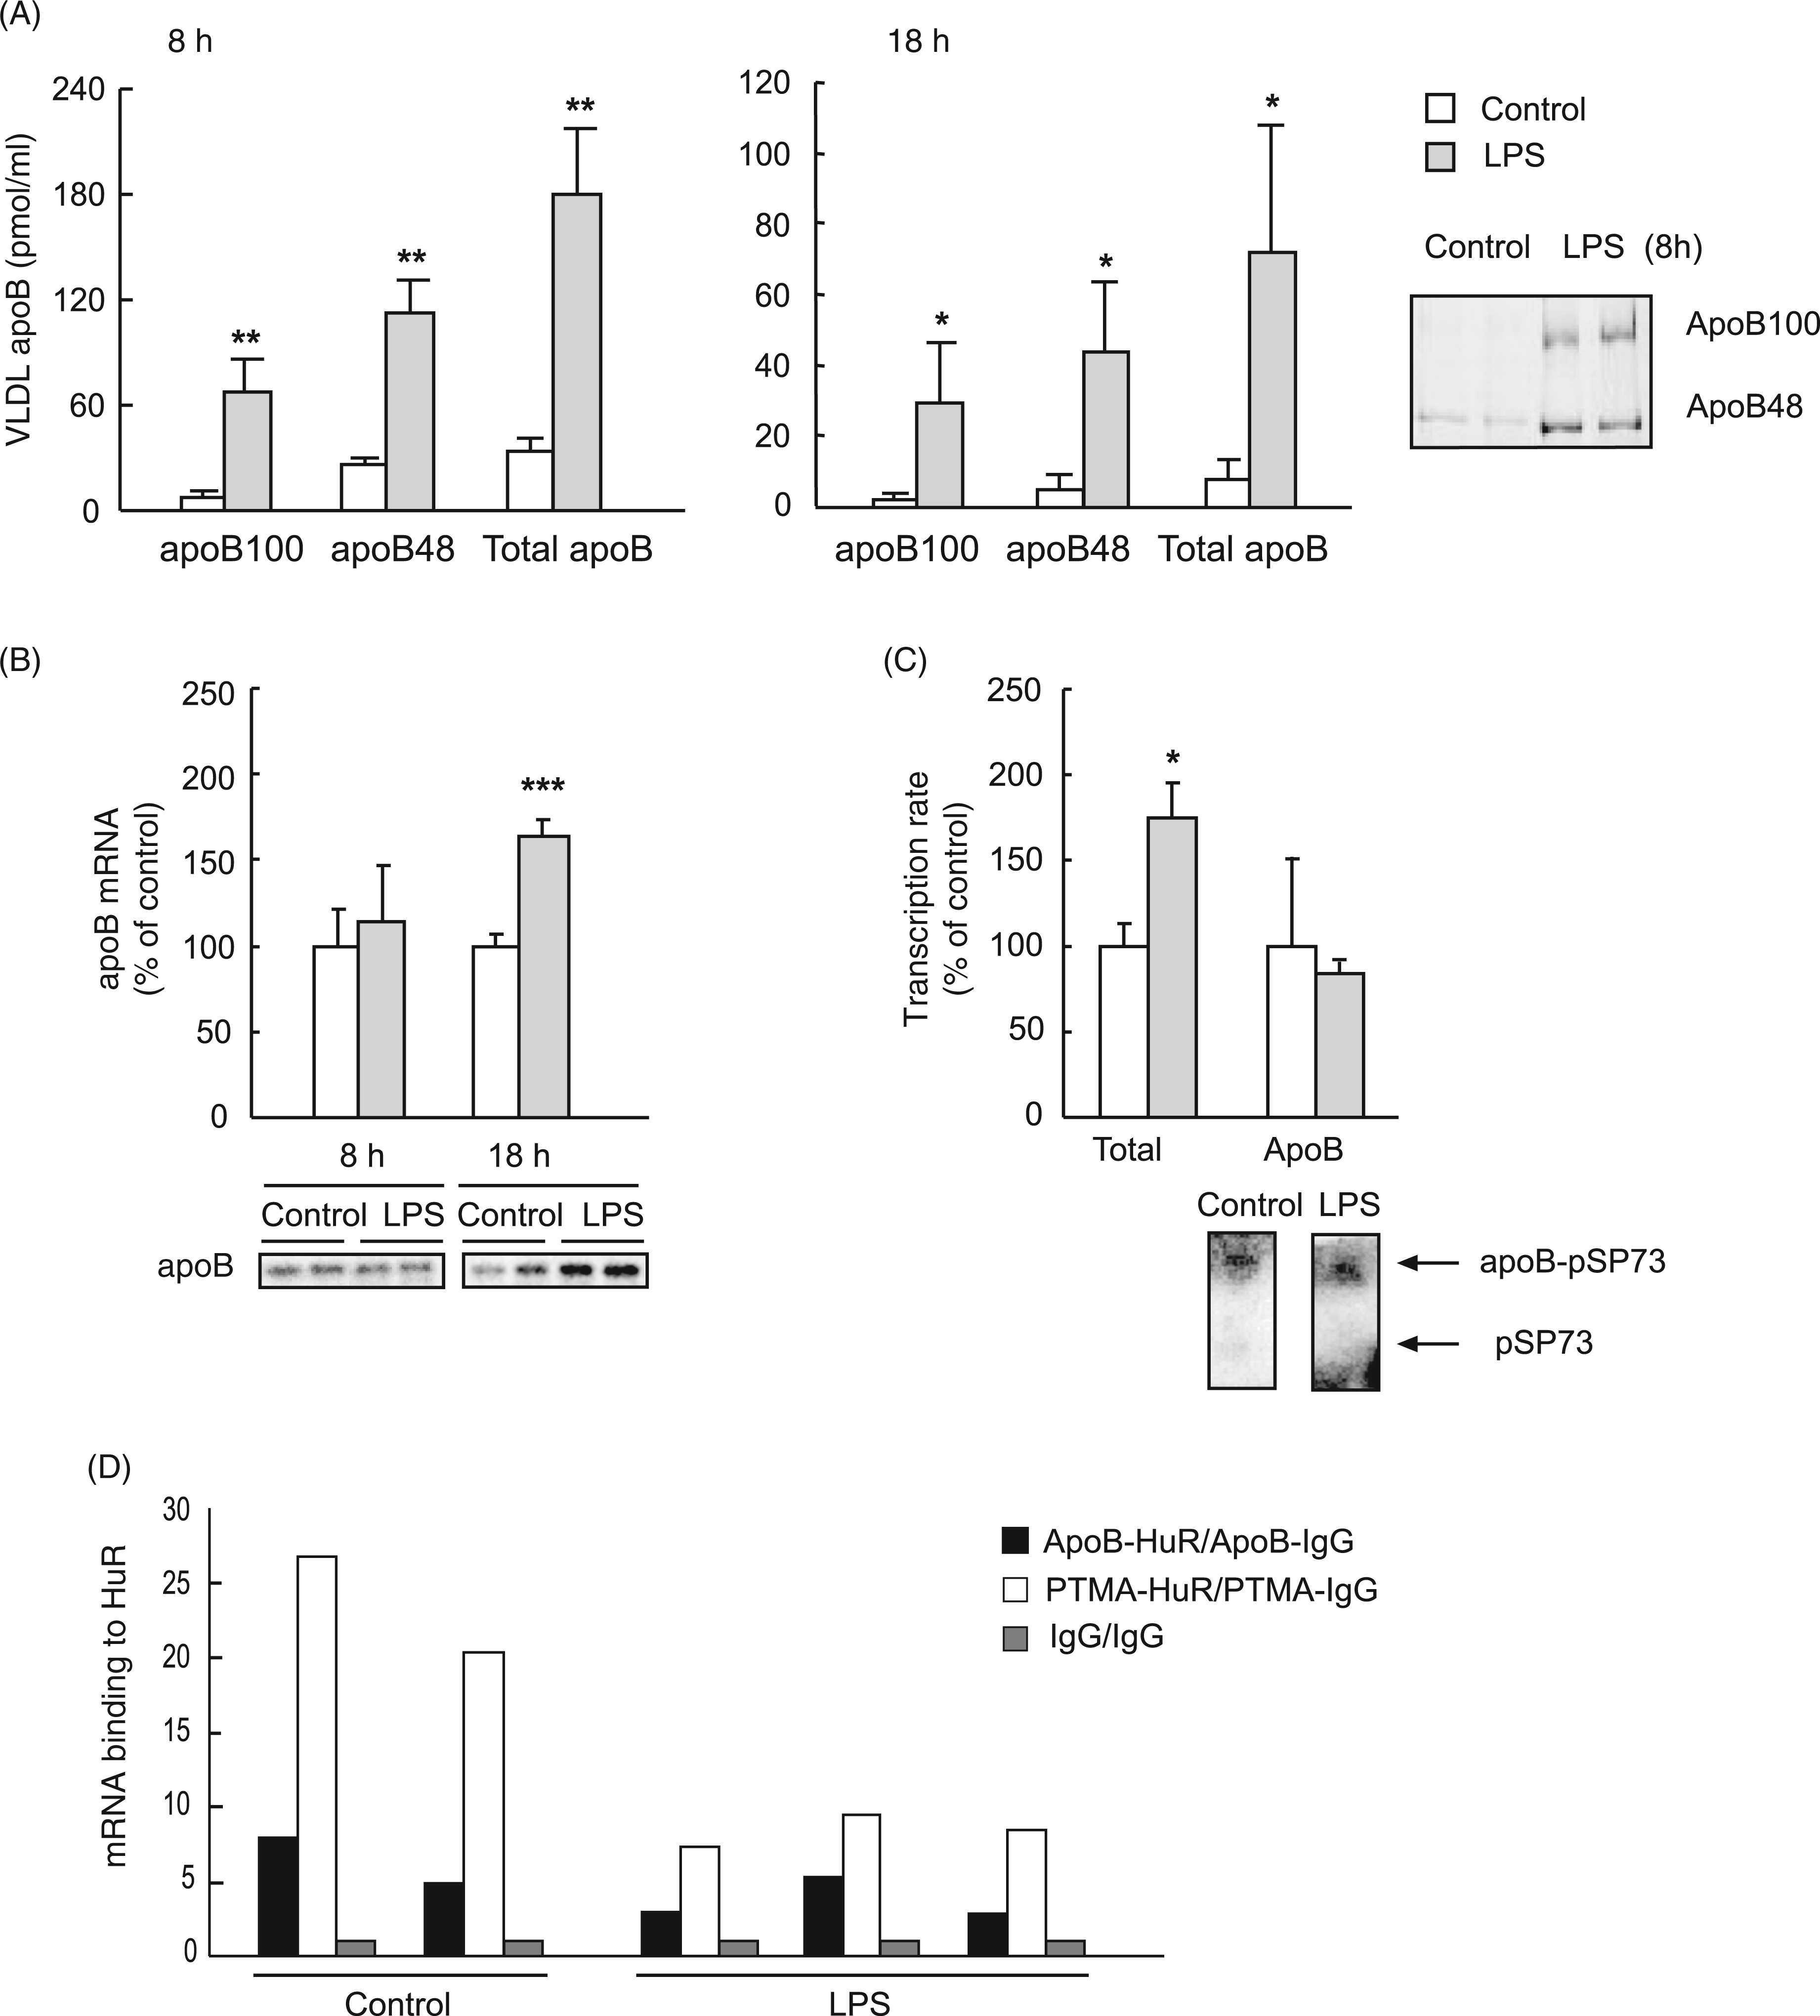
Endotoxin leads to a late liver apoB mRNA level rise without altering Apob gene transcription rate or apoB mRNA binding to HuR protein
We next addressed whether the increases in serum VLDL apoB were accompanied by changes in hepatic levels of apoB mRNA by measuring transcript levels 8 h and 18 h after administering LPS. Although no change was observed in the NEFA-phase, the level of apoB mRNA was 60% above time-matched controls after 18 h (Figure 3B), which might be expected to provide a greater apoB supply for VLDL assembly. The apoB transcript half-life is reported to be ∼16 h in HepG2 cells. 17 Thus, the increase in apoB mRNA could be due to a higher transcription rate at an earlier time. To test this hypothesis, we measured the incorporation of 5′-[α-32P]-UTP into newly synthesized RNA in liver nuclei from 16 h LPS-treated rats. Figure 3C shows that the global transcription rate in endotoxic liver was nearly two times higher than in controls although the apoB transcription rate was unaffected. We then considered whether the rise in hepatic apoB transcript levels could be due to increased mRNA stability by binding to the stabilizing HuR protein. ApoB mRNA was able to bind HuR specifically, but no differences in binding capacity between control and endotoxic animals were observed (Figure 3D). As far as we are aware, this is the first report in which the effect of endotoxin on HuR binding to apoB mRNA has been addressed.
Lipopolysaccharide did not modify hepatic MTP triglyceride transfer activity and its mRNA expression
Microsomal TG transfer protein is a crucial chaperone for VLDL assembly. In this animal model of sepsis, neither the MTP transcript levels nor the triglyceride transfer activity of this protein differed from controls at any studied time (Figure 4).
Lipopolysaccharide effects on MTP mRNA and specific activity. Rats were injected with LPS (1 mg/kg body weight) or saline and 8 h or 18 h later livers were obtained. The RNA was extracted and MTP mRNA levels were measured by Northern blotting with a
32
P-labeled cDNA probe as specified in Materials and Methods. The results are given as percentage of control and expressed as mean ± SEM of three experiments performed in duplicate. A blot corresponding to one experiment in which samples from two different animals were run for each state (control-fasted or LPS-fasted) is shown at the bottom of the histogram. The TG transfer activity of liver MTP was determined by a fluorescence assay as detailed in Materials and Methods. Data are mean ± SEM from three animals per group using two liver pieces from each animal which were assayed in triplicate.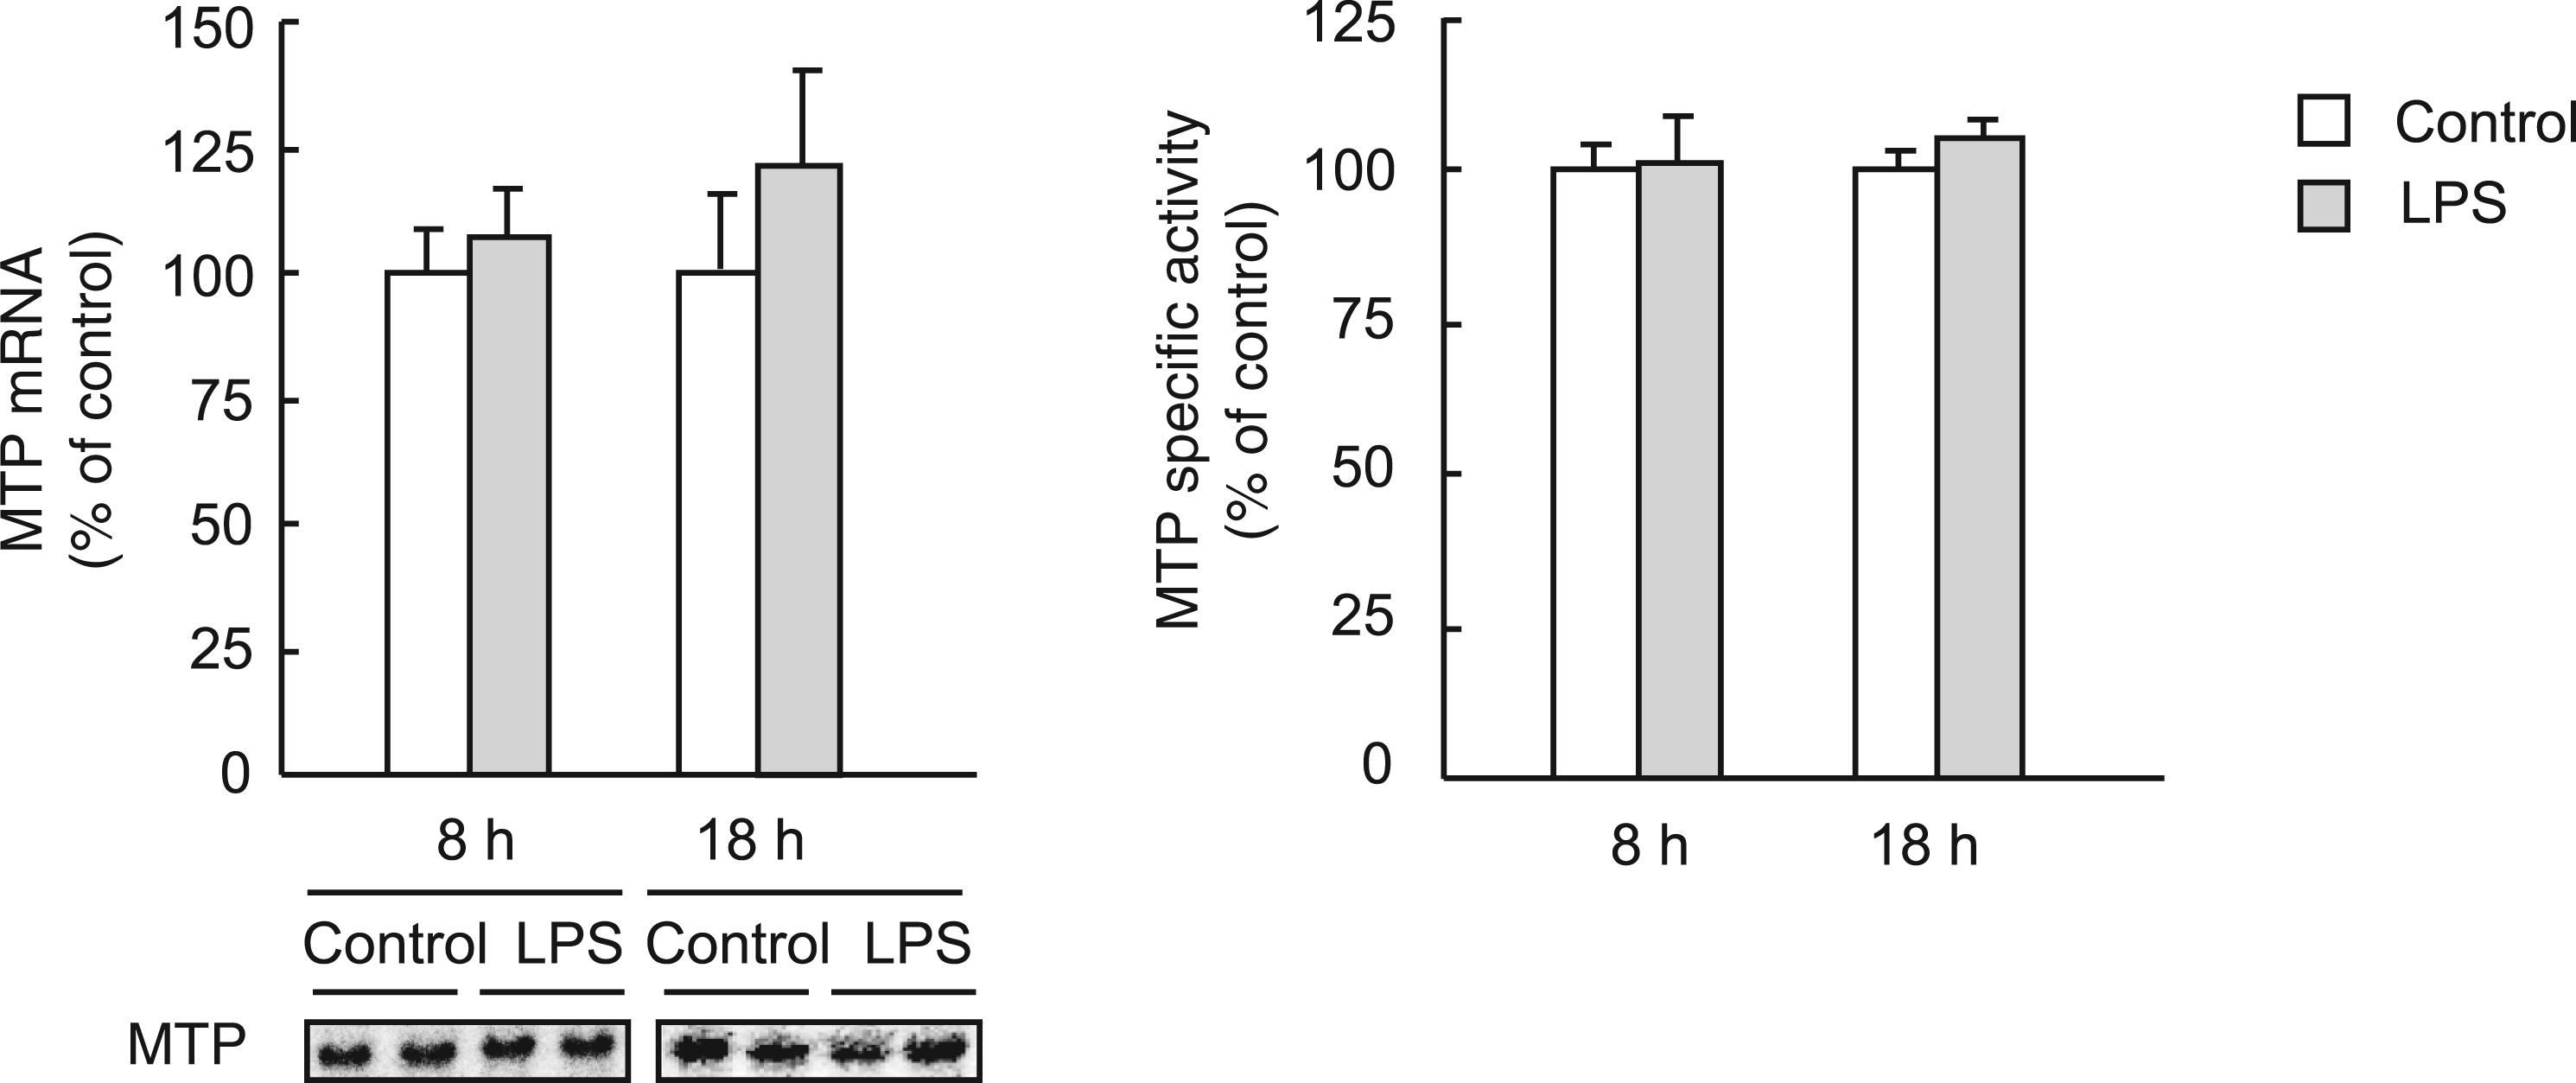
Discussion
Sepsis leads to a wide spectrum of endocrine and metabolic alterations including drastic changes in lipid and lipoprotein metabolism, which are considered to be part of the innate reaction against infection. Our aim was to asses the metabolic background and factors contributing the sepsis-promoted VLDL abundance and to analyse specific changes in lipoprotein subclass profiles and the hepatic VLDL assembly machinery. We show that there is a biphasic response to endotoxin in systemic fuels: a NEFA-abundant phase with 5-fold increases in circulating VLDL particles and 8-fold increases in VLDL-TG is followed by a glucose-abundant period with higher increases, 10-fold, in the number of VLDL particles in blood, each one carrying much less TG.
Both hypoglycemia and hyperglycemia have been reported to occur in response to endotoxin. As a dose- and time-dependent change, both carbohydrate utilization and glucose production are activated. 3 The marked hypoglycemia registered in our study between 2–8 h in rats (Figure 1D), which was also found in septic mice, 32 may indicate that hepatic glycogenolysis/gluconeogenesis compensate insufficiently for enhanced glucose uptake and utilization by peripheral tissues in this extreme situation. In parallel to hypoglycemia, there was a sustained rise in the serum NEFA pool, most likely as a result of the well-known sepsis-associated adipose tissue lipolysis.4,5 Afterwards, blood glucose levels increased. It has been recognized that both stimulation of gluconeogenesis and reduced uptake of glucose by peripheral tissues are behind septic hyperglycemia. 3 We detected increases in insulin levels during the second 12-h period (Figure 1F) that, together with increased glucose levels, represent the well-documented sepsis promoted insulin resistance. 33 An increased use of fatty acids, together with poor lipolysis activation could lead to the low NEFA levels observed in the second 12-h period. The low level of ketone bodies present in the plasma of endotoxic rats in the second period (Figure 1E) possibly points to diminished hepatic β-oxidation rates, in agreement with the reported suppressed acyl-CoA synthetase mRNA, mitochondrial activity and carnitine acyltransferase I expression by endotoxin treatment. 34 As a result, the available NEFA are directed away from mitochondrial oxidation and are used for TG synthesis for VLDL secretion.
Circulating NEFA and hypertriglyceridemia peaked after 8 h of endotoxin contact (Figure 1). As expected, this was associated with a rise in VLDL-TG (Figure 2A). Circulating NEFA pool is the major contributor to hepatic VLDL–TG secretion in postprandial (61%) and fasting (81%) states. 35 During acute inflammation, adipose tissue lipolysis is activated by pro-inflammatory mediators providing NEFA for increased hepatic triglyceride synthesis and, therefore, promoting VLDL secretion.4,36 Thus, in the first hours of our study using fasting animals, increased NEFA delivery to the liver is likely to be one of the main drivers behind hepatic VLDL overproduction and, hence, septic hypertriglyceridemia.
The 8-fold increase in circulating VLDL-TG in the NEFA-phase, was mainly associated to large, TG-rich VLDL (Figure 2B). Hussain et al. 37 proposed that the N-terminus of apoB acquires neutral lipids in the endoplasmic reticulum membrane forming nucleation sites, whose number can be increased by augmented TG synthesis and MTP. Accordingly, whenever large amounts of TG are synthesized in the liver, as is likely to occur in septic hepatocytes during the NEFA-phase, more nucleation sites are expected to be generated in apoB. Moreover, lipid abundance is known to protect apoB from degradation. 38 This would result in an increased hepatic secretion of triglycerides in TG-rich VLDL particles, which would accumulate in the circulation (Figure 2B), even in the absence of augmented levels of hepatic apoB mRNA (Figure 3) and MTP mRNA and activity (Figure 4).
Two findings mark differences in the second, glucose-abundant phase of endotoxemia: (i) that apoB gene transcript expression increases (Figure 3B), which would provide the additional apoB moiety necessary to enhance even more VLDL-apoB secretion; and (ii) that a low NEFA pool (Figure 1) would produce decreases in the TG synthesis rate and, therefore, in VLDL–TG secretion. The liver might then be expected to secrete TG-poor VLDL particles actively. In line with this consideration, we found a substantial decrease in TG content per circulating VLDL particle (as inferred from Figures 2 and 3), which suggests an accumulation of small, TG-poor VLDL. In previous studies, we stated that hepatocytes isolated from 18-h LPS-treated rats secreted TG-poor VLDL, and, although secretion was highly stimulated, global triglyceride secretion in VLDL remained unchanged.14,20 We suggest that, in the second period of the APR, one major, but not the only, mechanism contributing to septic VLDL-associated hypertriglyceridemia was a reduction in the VLDL–TG clearance rate due to lipoprotein lipase inhibition. Several reports have shown suppressed mRNA levels, protein mass and activity of lipoprotein lipase in peripheral tissues at 24 h after induction of sepsis in rats;39,40 a situation comparable to our study at 18 h with respect to the metabolic background.
In none of the periods studied did LPS modify MTP mRNA levels or TG transfer activity (Figure 4). Despite the crucial role played by this apoB chaperone in VLDL assembly, 16 MTP appears in this study as a non-target protein for Gram-negative sepsis. Therefore, in sepsis, hepatic oversecretion of VLDL particles does not seem to be dependent on the TG-transfer capacity of MTP but points more to the availability of triglycerides or apoB in the liver.
In order to ascertain whether the increase in the apoB transcript mass in the glucose-phase was due to a higher transcription rate, we measured the de novo synthesis of apoB mRNA. Indicative of critical up-regulation of acute phase positive proteins, endotoxic rats exhibited an almost 2-fold greater global transcription rate in the liver, but the transcription rate of the apoB gene after 16 h of LPS challenge was similar to that of untreated control animals (Figure 3C). It cannot be ruled out, however, that transcriptional activation occurred transiently during other stages of the APR.
We then evaluated whether post-transcriptional events could be responsible for raising hepatic apoB transcript levels in the glucose-period of sepsis. One mechanism for modulating mRNA stability is the binding of some proteins to ARE sequences. It has been reported that the ubiquitously expressed RNA-binding protein HuR stabilizes several ARE-containing inflammatory transcripts, such as those of TNF-α and IL-8.23,41 It has been stated that 3′-UTR of human apoB mRNA includes ARE sequences. 24 By means of bioinformatic analysis, we found that rat apoB transcript (Refseq: NM_019287) also contains some AU-rich regions also present in pro-inflammatory mRNAs such as those of TNF-α and IL-8.23,41,42 Here, we demonstrate for the first time that HuR binds specifically to rat apoB mRNA, although the specific binding was not enhanced by endotoxin treatment. Consequently, it seems unlikely that apoB mRNA half-life was extended by HuR binding. Regardless of this observation, it may be possible that apoB mRNA is stabilized by binding proteins other than HuR.
Considering that neither apoB transcription rate nor apoB mRNA stability increased in the second 12-h period, the rise in apoB mRNA levels could be attributed to changes in degradation; however, further analysis would be needed to confirm this hypothesis.
Conclusions
The data suggest that there may be a difference in the mechanisms and fuels that lead to the increase in serum TG and VLDL levels in different time-phases of the septic response, since we identified biphasic changes in lipoprotein metabolism coinciding with alterations in the metabolic background. Specifically, septic hypertriglyceridemia is accompanied by increased NEFA levels and a rise in large TG-rich VLDL in the early phases of the septic reaction, and by elevated apoB transcript levels and TG-poor VLDL accumulation in a second glucose-rich phase. We have also shown for the first time that endotoxin induced apoB mRNA elevation is not associated with a higher transcription rate or HuR binding in rats.
Footnotes
Abbreviations
Acknowledgements
The authors thank M. Busto for technical support, M.P. Sowden for kindly providing rat apoB cDNA and M. Lafita for performing the serum biochemical analysis. Research was supported by grants from the Spanish Ministry of Education and Science (SAF2007/60211) and the Basque Government (IT-325-07 and IT-336-10). CIBERehd is funded by Instituto de Salud Carlos III. NB was a recipient of a fellowship for graduate students from the Basque Government. Begoña Ochoa and Yolanda Chico shared senior authorship.