
Abstract
High fat diet-induced endotoxaemia triggers low-grade inflammation and lipid release from adipose tissue. This study aims to unravel the cellular mechanisms leading to the lipopolysaccharide (LPS) effects in human adipocytes. Subcutaneous pre-adipocytes surgically isolated from patients were differentiated into mature adipocytes in vitro. Lipolysis was assessed by measurement of glycerol release and mRNA expression of pro-inflammatory cytokines were evaluated by real-time PCR. Treatment with LPS for 24 h induced a dose-dependent increase in interleukin (IL)-6 and IL-8 mRNA expression. At 1 µg/ml LPS, IL-6 and IL-8 were induced to 19.5 ± 1.8-fold and 662.7 ± 91.5-fold (P < 0.01 vs basal), respectively. From 100 ng/ml to 1 µg/ml, LPS-induced lipolysis increased to a plateau of 3.1-fold above basal level (P < 0.001 vs basal). Co-treatment with inhibitors of inhibitory kappa B kinase kinase beta (IKKβ) or NF-κB inhibited LPS-induced glycerol release. Co-treatment with the protein kinase A (PKA) inhibitor H-89, the lipase inhibitor orlistat or the hormone-sensitive lipase (HSL) inhibitor CAY10499 abolished the lipolytic effects of LPS. Co-treatment with the MAPK inhibitor, U0126 also reduced LPS-induced glycerol release. Inhibition of lipolysis by orlistat or CAY10499 reduced LPS-induced IL-6 and IL-8 mRNA expression. Induction of lipolysis by the synthetic catecholamine isoproterenol or the phosphodiesterase type III inhibitor milrinone did not alter basal IL-6 and IL-8 mRNA expression after 24 treatments whereas these compounds enhanced LPS-induced IL-6 and IL-8 mRNA expression. Both the inflammatory IKKβ/NF-κB pathway and the lipolytic PKA/HSL pathways mediate LPS-induced lipolysis. In turn, LPS-induced lipolysis reinforces the expression of pro-inflammatory cytokines and, thereby, triggers its own lipolytic activity.
Introduction
Chronic, low-grade, systemic inflammation is associated with obesity and is assumed to contribute to the risk of obesity-related metabolic complications such as type 2 diabetes mellitus. 1 An increased release of pro-inflammatory molecules and free fatty acids (FFAs) from adipose tissue particularly contribute to vascular and metabolic complications of obesity. 2 – 4
Erridge et al. 5 showed that a high-fat meal induces postprandial low-grade endotoxaemia. Cani et al. 6 further showed that metabolic endotoxaemia initiates obesity and insulin resistance, and identified bacterial lipopolysaccharide (LPS) from the gut microbiota as a triggering factor linking inflammation to high fat diet-induced metabolic syndrome. Fat is more efficient than other nutrients in transporting bacterial LPS from the gut lumen into the bloodstream. 7 Conversely, the influence of endotoxin on plasma lipid concentrations was attributed to its effects on human adipose tissue. 8 The presence of functional Toll-like receptor (TLR)4 activated by LPS in human adipocytes was recently shown and may impact lipid metabolism. 9
Adipocyte lipolysis is acutely regulated by metabolic signals (e.g. inhibited by insulin or stimulated by catecholamine) converging at the level of protein kinase A (PKA) activation. In turn, PKA phosphorylates and, therefore, activates the hormone sensitive lipase (HSL). This triggers the translocation from HSL to the lipid droplets whereby lipolysis occurs. 10 Besides this classical lipolytic pathway, another triacylglycerol (TAG) lipase called adipose TAG lipase or ATGL participates. This enzyme initiates lipolysis by specifically removing the first fatty acids (FAs) from the stored TAG and thereby producing diacylglycerol, which is further hydrolysed by HSL and the monoacylglycerol lipase. 11
Data obtained in murine adipocytes showed recently that neither the inflammatory nuclear factor kappa B (NF-κB) nor the metabolic PKA pathways were involved in endotoxin-regulated lipolysis. 12 We aimed to confirm these findings in human adipocytes. Primary cultures of human pre-adipocytes surgically isolated from patients and differentiated in vitro represent an attractive tool to characterize the intracellular mechanisms involved in LPS-induced lipolysis.
Subjects and methods
Cell culture and treatment
The study was approved by the local Ethics Committee and informed consent was obtained from patients. Subcutaneous fat tissue samples were surgically obtained from lean (body mass index, BMI < 25 kg/m 2 ) and obese (BMI > 30 kg/m 2 ) donors (males and females, aged 31–65 years, mean 47 years) during elective abdominal surgery performed for various non-malignant conditions. The stromal-vascular cell fraction containing pre-adipocytes was isolated from fat tissue samples. The pre-adipocytes were expanded in vitro in DMEM containing 10% FCS and 2 ng/ml 2-FGF (Lubio Science, Luzern, Switzerland) until confluence and subjected to an adipogenic differentiation medium for 14 d as previously described. 13
For experimental purposes, cells were washed twice with warm phosphate-buffered saline (PBS) and kept for 48 h in a low-glucose medium (1.8 g/l glucose): DMEM (Lonza, Verviers, Belgium) supplemented with nutrient mixture F-12 (Lubio Science), gentamycin (50 µg/ml),
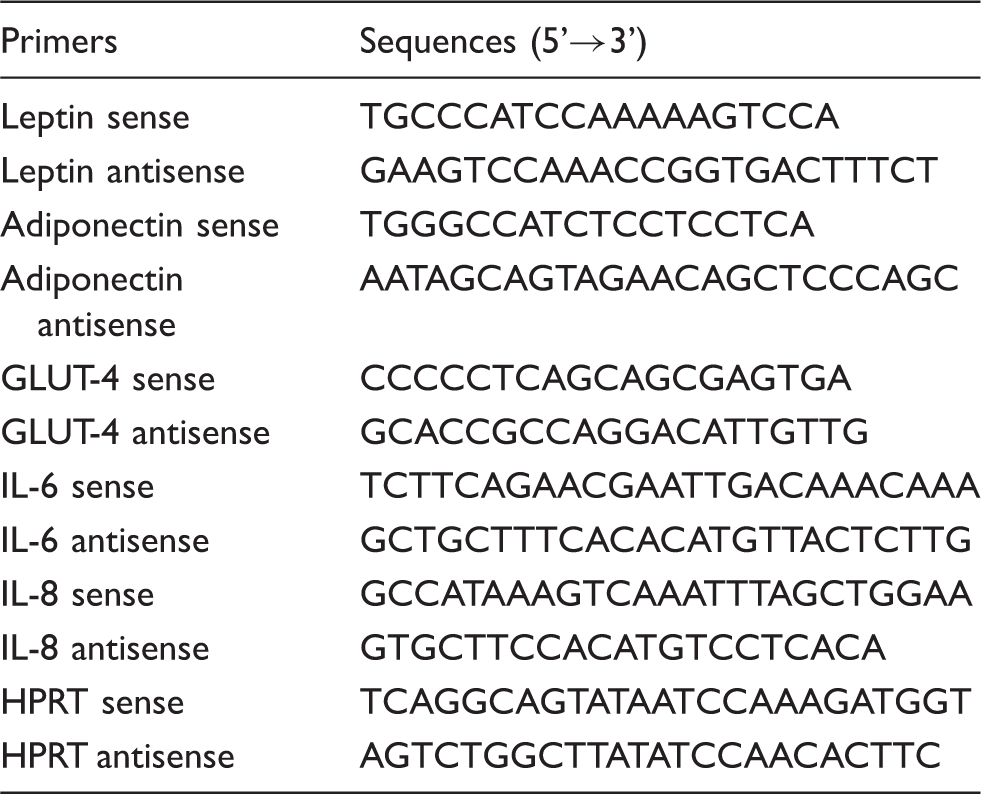
Quantitative analysis of mRNA expression
Sets and sequences of primers used for real-time PCR analysis
Western blot analysis
Cells were harvested in a 10 m
Intracellular triglyceride accumulation
Accumulation of intracellular triglycerides was quantified with a fluorimeter (Bucher Biotec, Basel, Switzerland) using the AdipoRed Assay Reagent (Lonza, Verviers, Belgium).
Lipolysis
Glycerol content in the cellular supernatants (i.e. glycerol release) was determined using spectrophotometry and a UV-method kit from R-Biopharm (Darmstadt, Germany) according to the manufacturer’s protocol.
Statistical analysis
Data represent mean ± SD from a minimum of three independent experiments, each done in triplicate. Differences between two groups of not normally distributed data were statistically evaluated using the Mann–Whitney U-test. For multigroup comparisons, one-way analysis of variance was applied with the Tukey’s post-hoc multiple comparison test. Overall, a P value < 0.05 was considered significant.
Results
Characterisation of the human primary cell culture model
Human pre-adipocytes showed a fibroblast-like phenotype, and pre-adipocyte-derived adipocytes were characterized by accumulation of cytoplasmic lipid droplets after 7 d and 14 d of differentiation (Fig. 1A). The glucose transporter-4 (GLUT-4) is a late marker and leptin (like adiponectin) are very late markers of adipocyte differentiation.
15
Leptin mRNA expression (Fig. 1B) increased to 3830 ± 1199- and to 7077 ± 316-fold, respectively, after 7 d and after 14 d of differentiation (P < 0.001 vs pre-adipocytes). Adiponectin mRNA expression increased to 48,593 ± 6169- and to 85,844 ± 24845-fold, respectively, after 7 d and after 14 d of differentiation (P < 0.01 vs pre-adipocytes). GLUT-4 mRNA expression increased to 695 ± 198- and to 1533 ± 428-fold, respectively, after 7 d and after 14 d of differentiation (P < 0.05 vs pre-adipocytes). Western blot of protein content of GLUT-4 corrected for potential loading variations using β-actin confirmed adipocyte differentiation (Fig. 1C). GLUT-4 protein content increased to 2.1 ± 0.2- and to 3.8 ± 0.3-fold, respectively, after 7 d and after 14 d of differentiation (P < 0.05 vs pre-adipocytes). Intracellular triglyceride accumulation was determined using the AdipoRed reagent (Fig. 1D) and increased to 19.2 ± 1.3- and to 71.2 ± 0.9-fold, respectively, after 7 d and 14 d of differentiation (P < 0.001 vs pre-adipocytes).
In vitro differentiation of human pre-adipocytes. (A) Representative fields (magnification × 200) showing subcutaneous (SC) pre-adipocytes before and after 7 d and 14 d of differentiation under light microscopy. (B) mRNA expression of leptin, adiponectin and glucose transporter-4 (GLUT-4) was analysed by quantitative real-time PCR in pre-adipocytes before and after differentiation. For each marker of adipocyte differentiation, data are mean ± SD of three independent experiments given as ratio vs pre-adipocytes before differentiation (*P < 0.05 vs pre-adipocytes or vs adipocytes after 7 d of differentiation; **P < 0.01 vs pre-adipocytes; ***P < 0.001 vs pre-adipocytes or vs adipocytes after 7 d of differentiation). (C) Immunoblots (IB) showing the protein contents of GLUT-4. β-Actin was used as loading control. The quantitative analysis of protein levels given as fold of pre-adipocytes before differentiation and corrected for potential loading variations using β-actin is shown on the histogram. Data are mean ± SD of three independent experiments (*P < 0.05 vs pre-adipocytes; ***P < 0.001 vs adipocytes after 7 d of differentiation). (D) Intracellular accumulation of triglycerides was stained using the AdipoRed Assay Reagent and the relative fluorescence was measured in pre-adipocytes and in pre-adipocyte-derived adipocytes. Data of the histogram are given as ratio vs pre-adipocytes. Data are mean ± SD of three independent experiments (***P < 0.001 vs pre-adipocyte or vs adipocytes after 7 d of differentiation).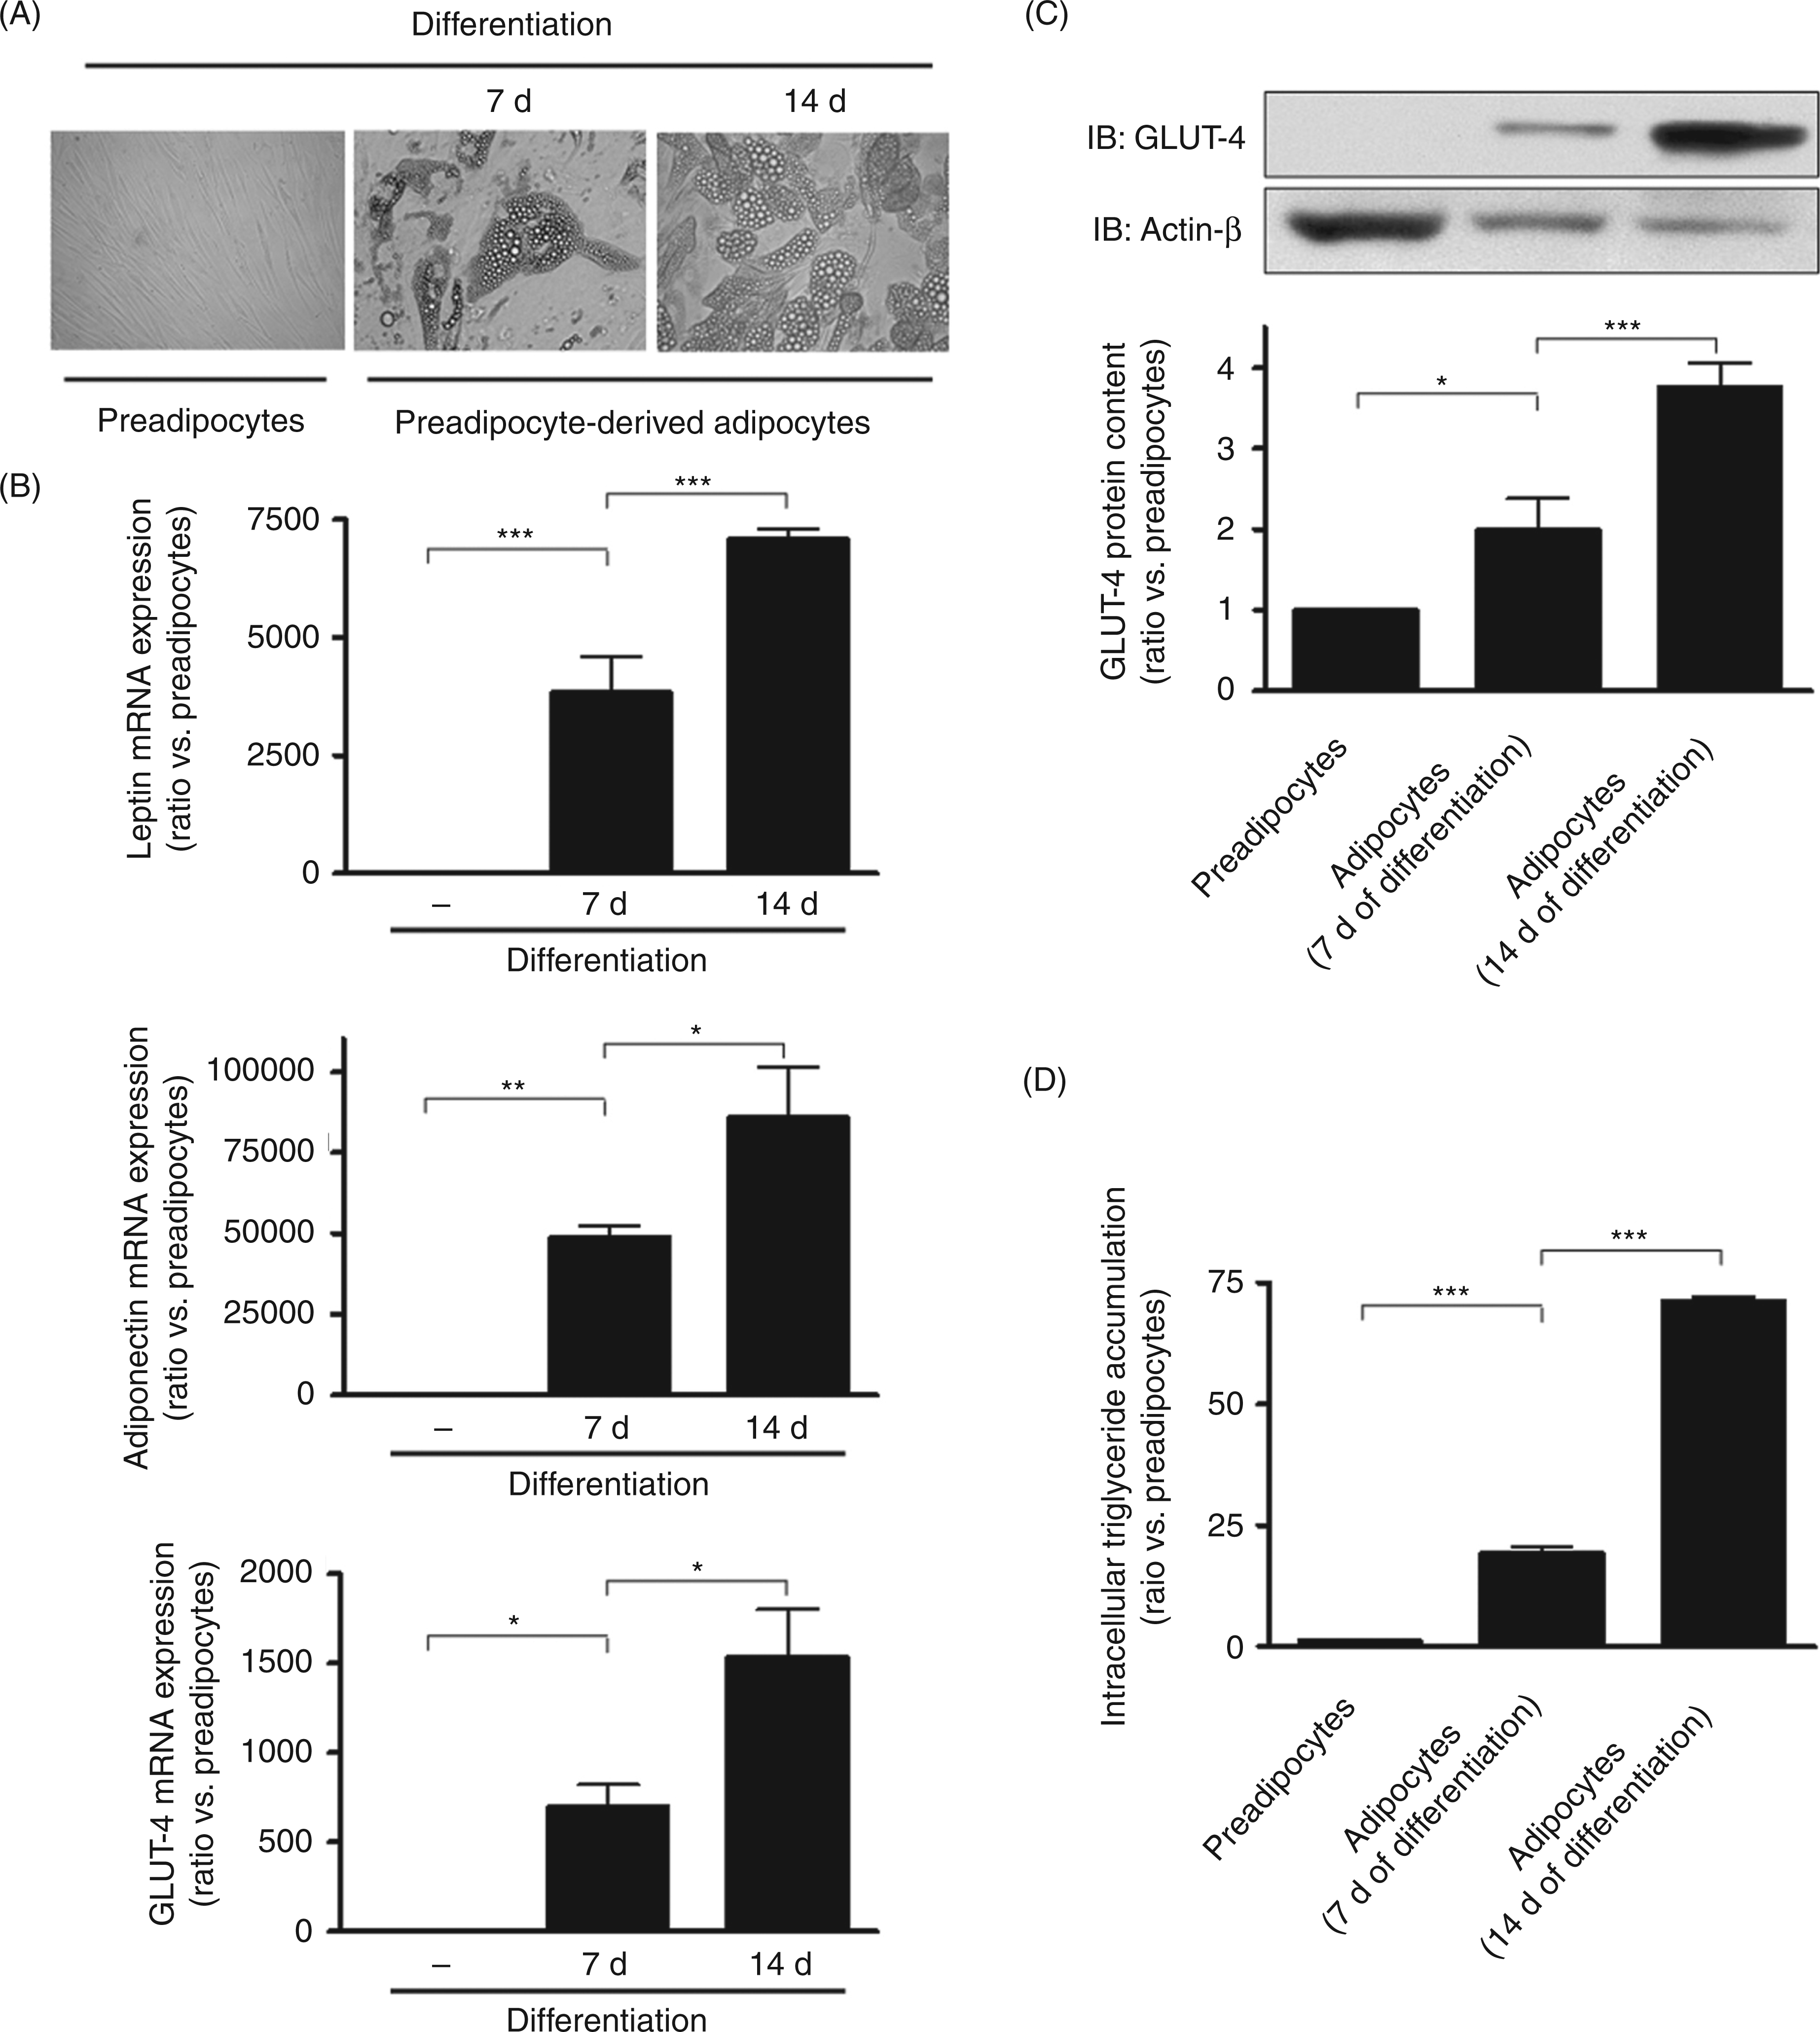
Taken together, these results showed that pre-adipocytes were differentiated in vitro within 7 d and their maturation was highly increased after 14 d of differentiation. Therefore, we performed the experiments described below after 14 d of differentiation.
Lipopolysaccharide induces inflammation and lipolysis in human adipocytes
Treatment with LPS for 24 h induced a dose-dependent increase of IL-6 and IL-8 pro-inflammatory cytokine mRNA expression (Fig. 2A,B). The LPS increased IL-6 expression to 5.9 ± 0.6-fold (P < 0.05 vs basal), 8.0 ± 0.8-fold (P < 0.001 vs basal) and 19.5 ± 1.8-fold (P < 0.001 vs basal), respectively, at 10 ng/ml, 100 ng/ml and 1 µg/ml LPS concentrations, whereas IL-8 expression was not significantly increased at 10 ng/ml LPS and reached 294.5 ± 52.2- fold (P < 0.01 vs basal) and 662.7 ± 91.5-fold (P < 0.001 vs basal), respectively, at 100 ng/ml and 1 µg/ml LPS.
Inflammatory cytokine expression and glycerol release upon LPS stimulation in human adipocytes. Pre-adipocyte-derived adipocytes were treated for 24 h with 1 ng/ml to 1 µg/ml LPS. (A) mRNA expression of IL-6 was analysed by quantitative real-time PCR. Data are mean ± SD of three independent experiments given as ratio vs basal (*P < 0.05 vs basal; ***P < 0.001 vs basal). (B) mRNA expression of IL-8 was analysed by quantitative real-time PCR. Data given as fold of basal are mean ± SD of three independent experiments (**P < 0.01 vs basal; ***P < 0.001 vs basal; P = n.s. or not significant vs basal). (C) Glycerol release was quantified by the measurement of glycerol content in the supernatant of cultured cells. Data are mean ± SD of three independent experiments given as ratio vs basal (***P < 0.001 vs basal; P = n.s. or not significant vs basal).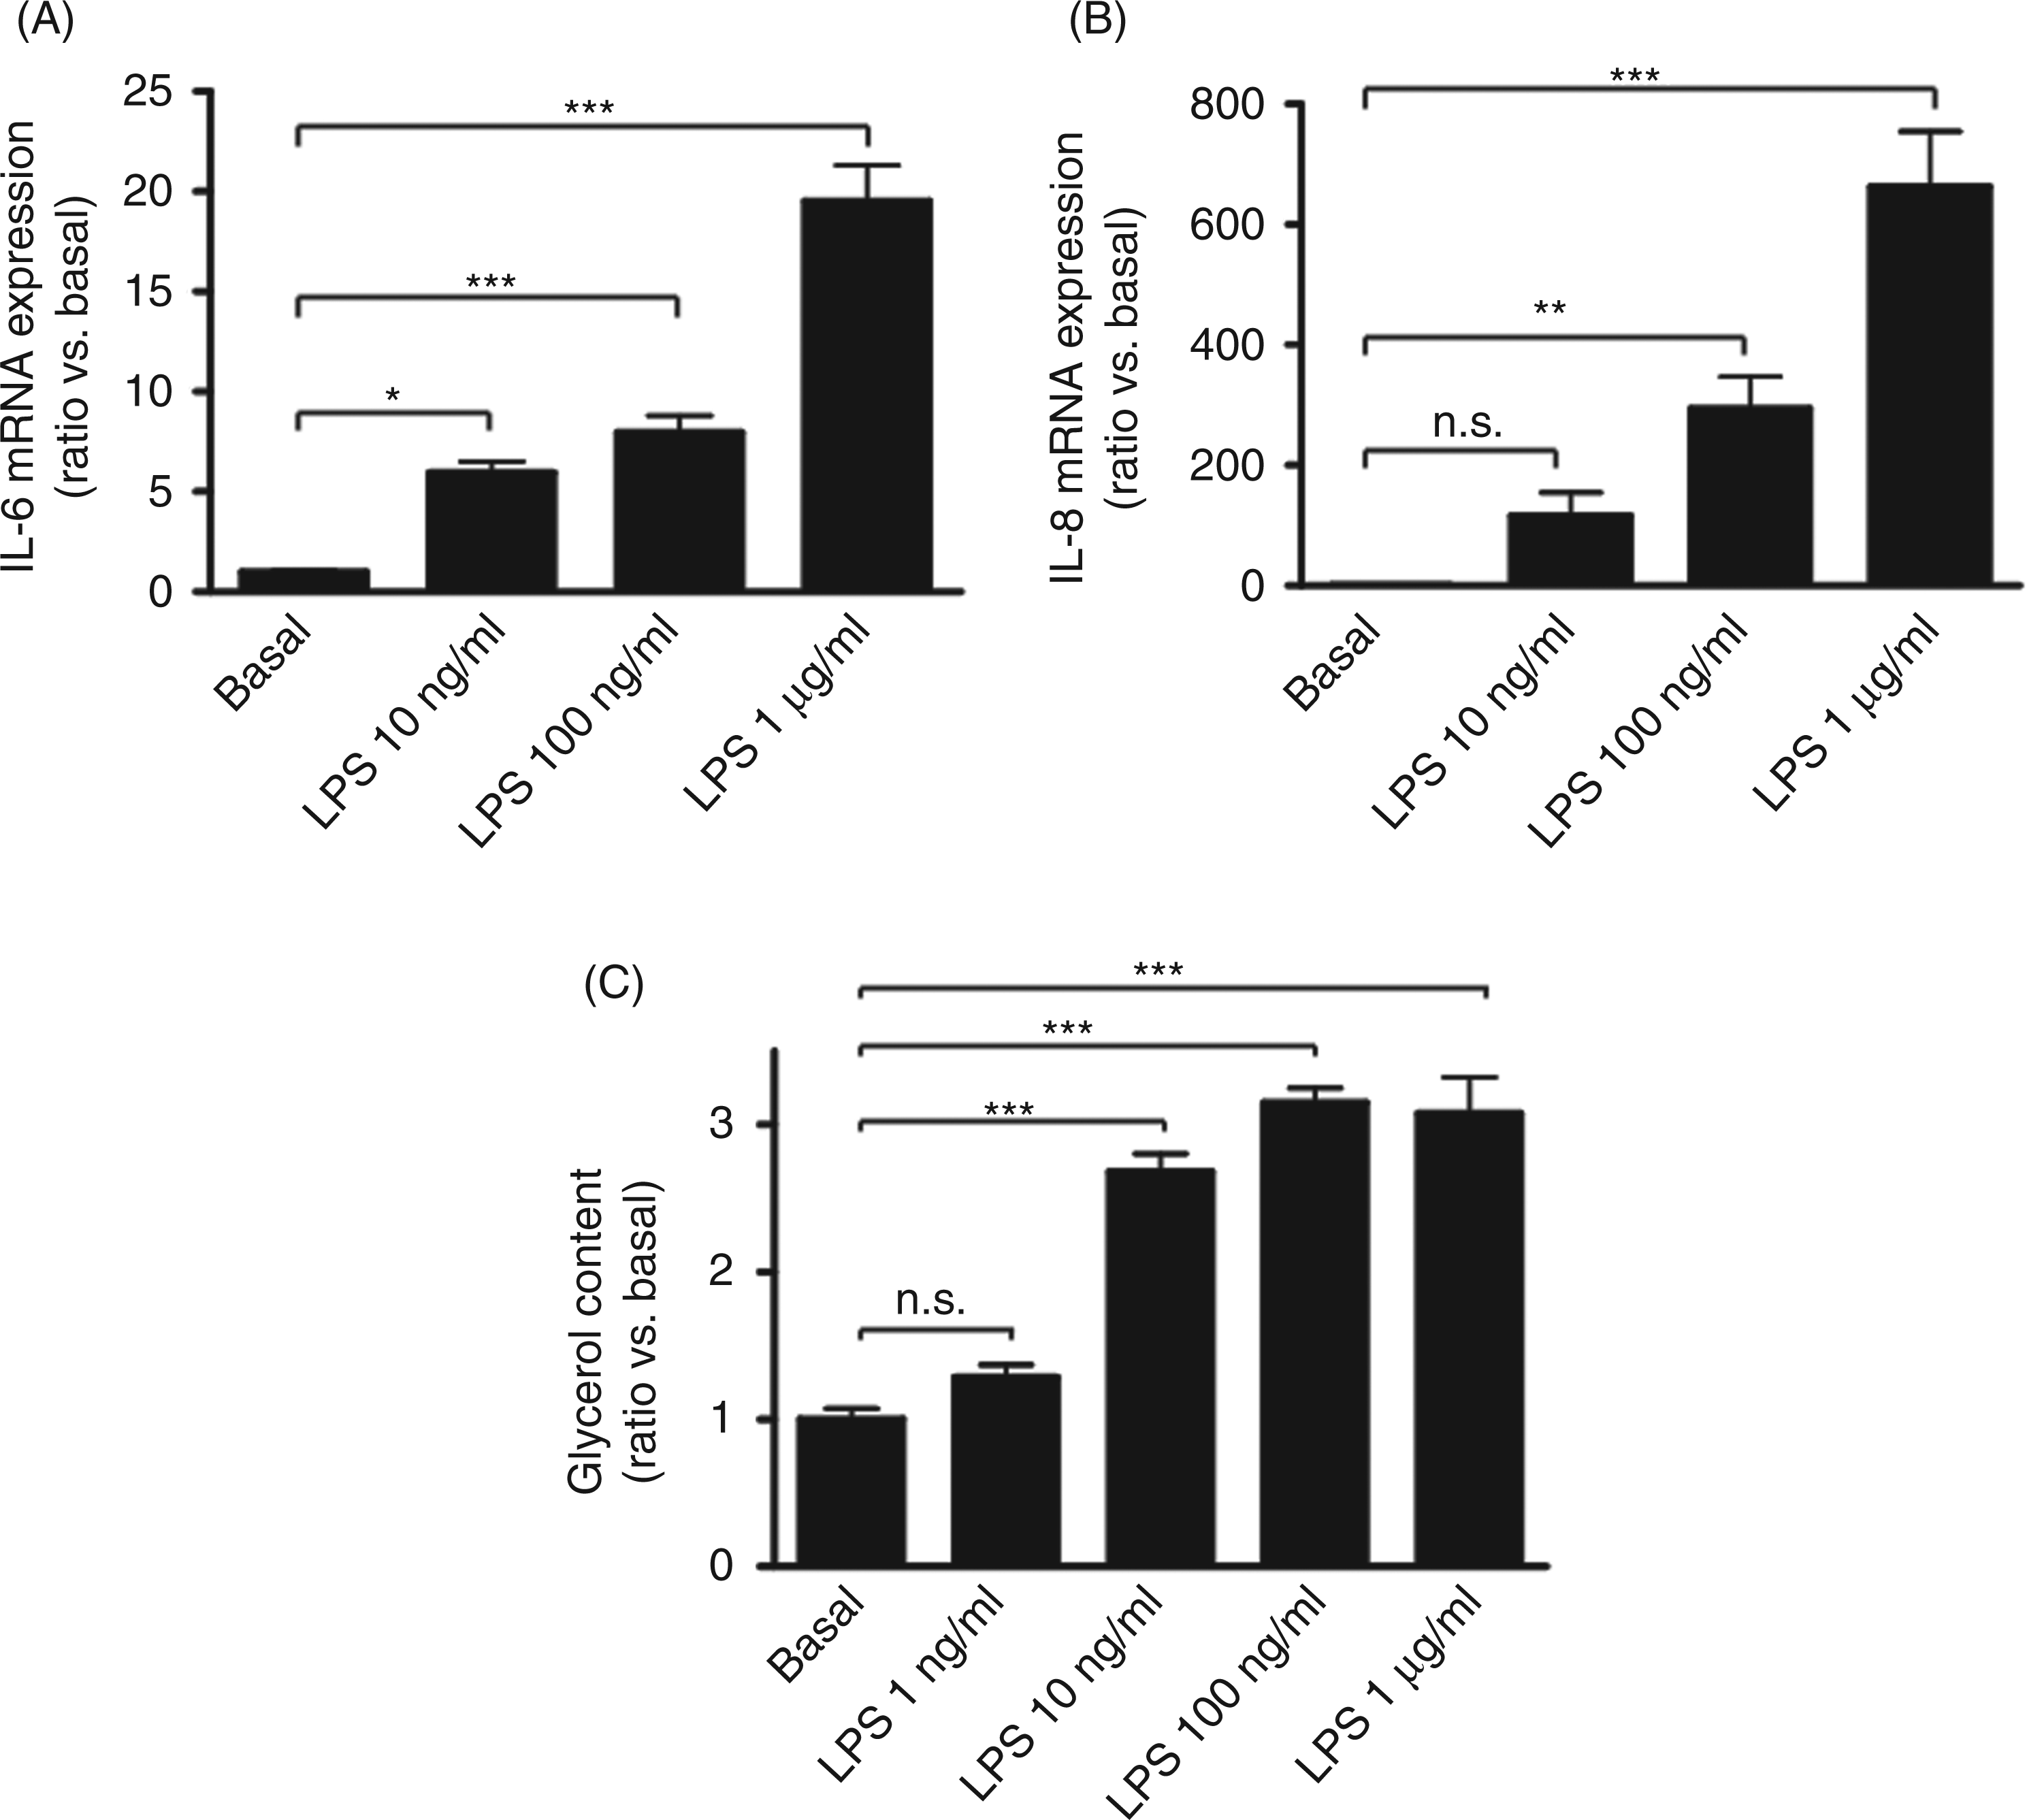
The lipolytic activity assessed by measurement of glycerol release in the supernatant of the cultured cells (Fig. 2C) showed that at 1 ng/ml, LPS was not lipolytic whereas at 10 ng/ml LPS, glycerol release increased to 2.7 ± 0.1-fold (P < 0.001 vs basal). From 100 ng/ml to 1 µg/ml, LPS-induced lipolysis reached a plateau to 3.1-fold (P < 0.001 vs basal). Therefore, we used the 100 ng/ml LPS dose in the experiments described below. Additionally, similar results were obtained in pre-adipocyte-derived adipocytes from lean and obese patients.
Lipopolysaccharide-induced cytokine expression and lipolysis is dependent on the inflammatory IKKβ/NF-κB pathway
The IKKβ inhibitor (sc-514) and NF-κB inhibitor (PDTC) diminished LPS-induced IL-6 and IL-8 mRNA expression (P < 0.05; Fig. 3A,B). Inhibition of IKKβ also abolished LPS-stimulated glycerol release from 82.5 ± 2.5 ng/ml (P < 0.001 vs basal) to 25.7 ± 11.4 ng/ml (P < 0.001 vs LPS alone; Fig. 3C). Co-treatment with the NF-κB inhibitor, PDTC (Fig. 3D), inhibited LPS-induced glycerol release from 80.2 ± 1.9 ng/ml (P < 0.001 vs basal) to 37.7 ± 4.3 ng/ml (P < 0.01 vs LPS alone), a level almost similar to PDTC alone (i.e. 27.1 ± 6.4 ng/ml). The effect of PDTC alone was not statistically significant compared to basal.
The inflammatory NF-κB pathway is involved in LPS-induced cytokine expression and glycerol release. Pre-adipocyte-derived adipocytes were pre-treated for 1 h with 20 µ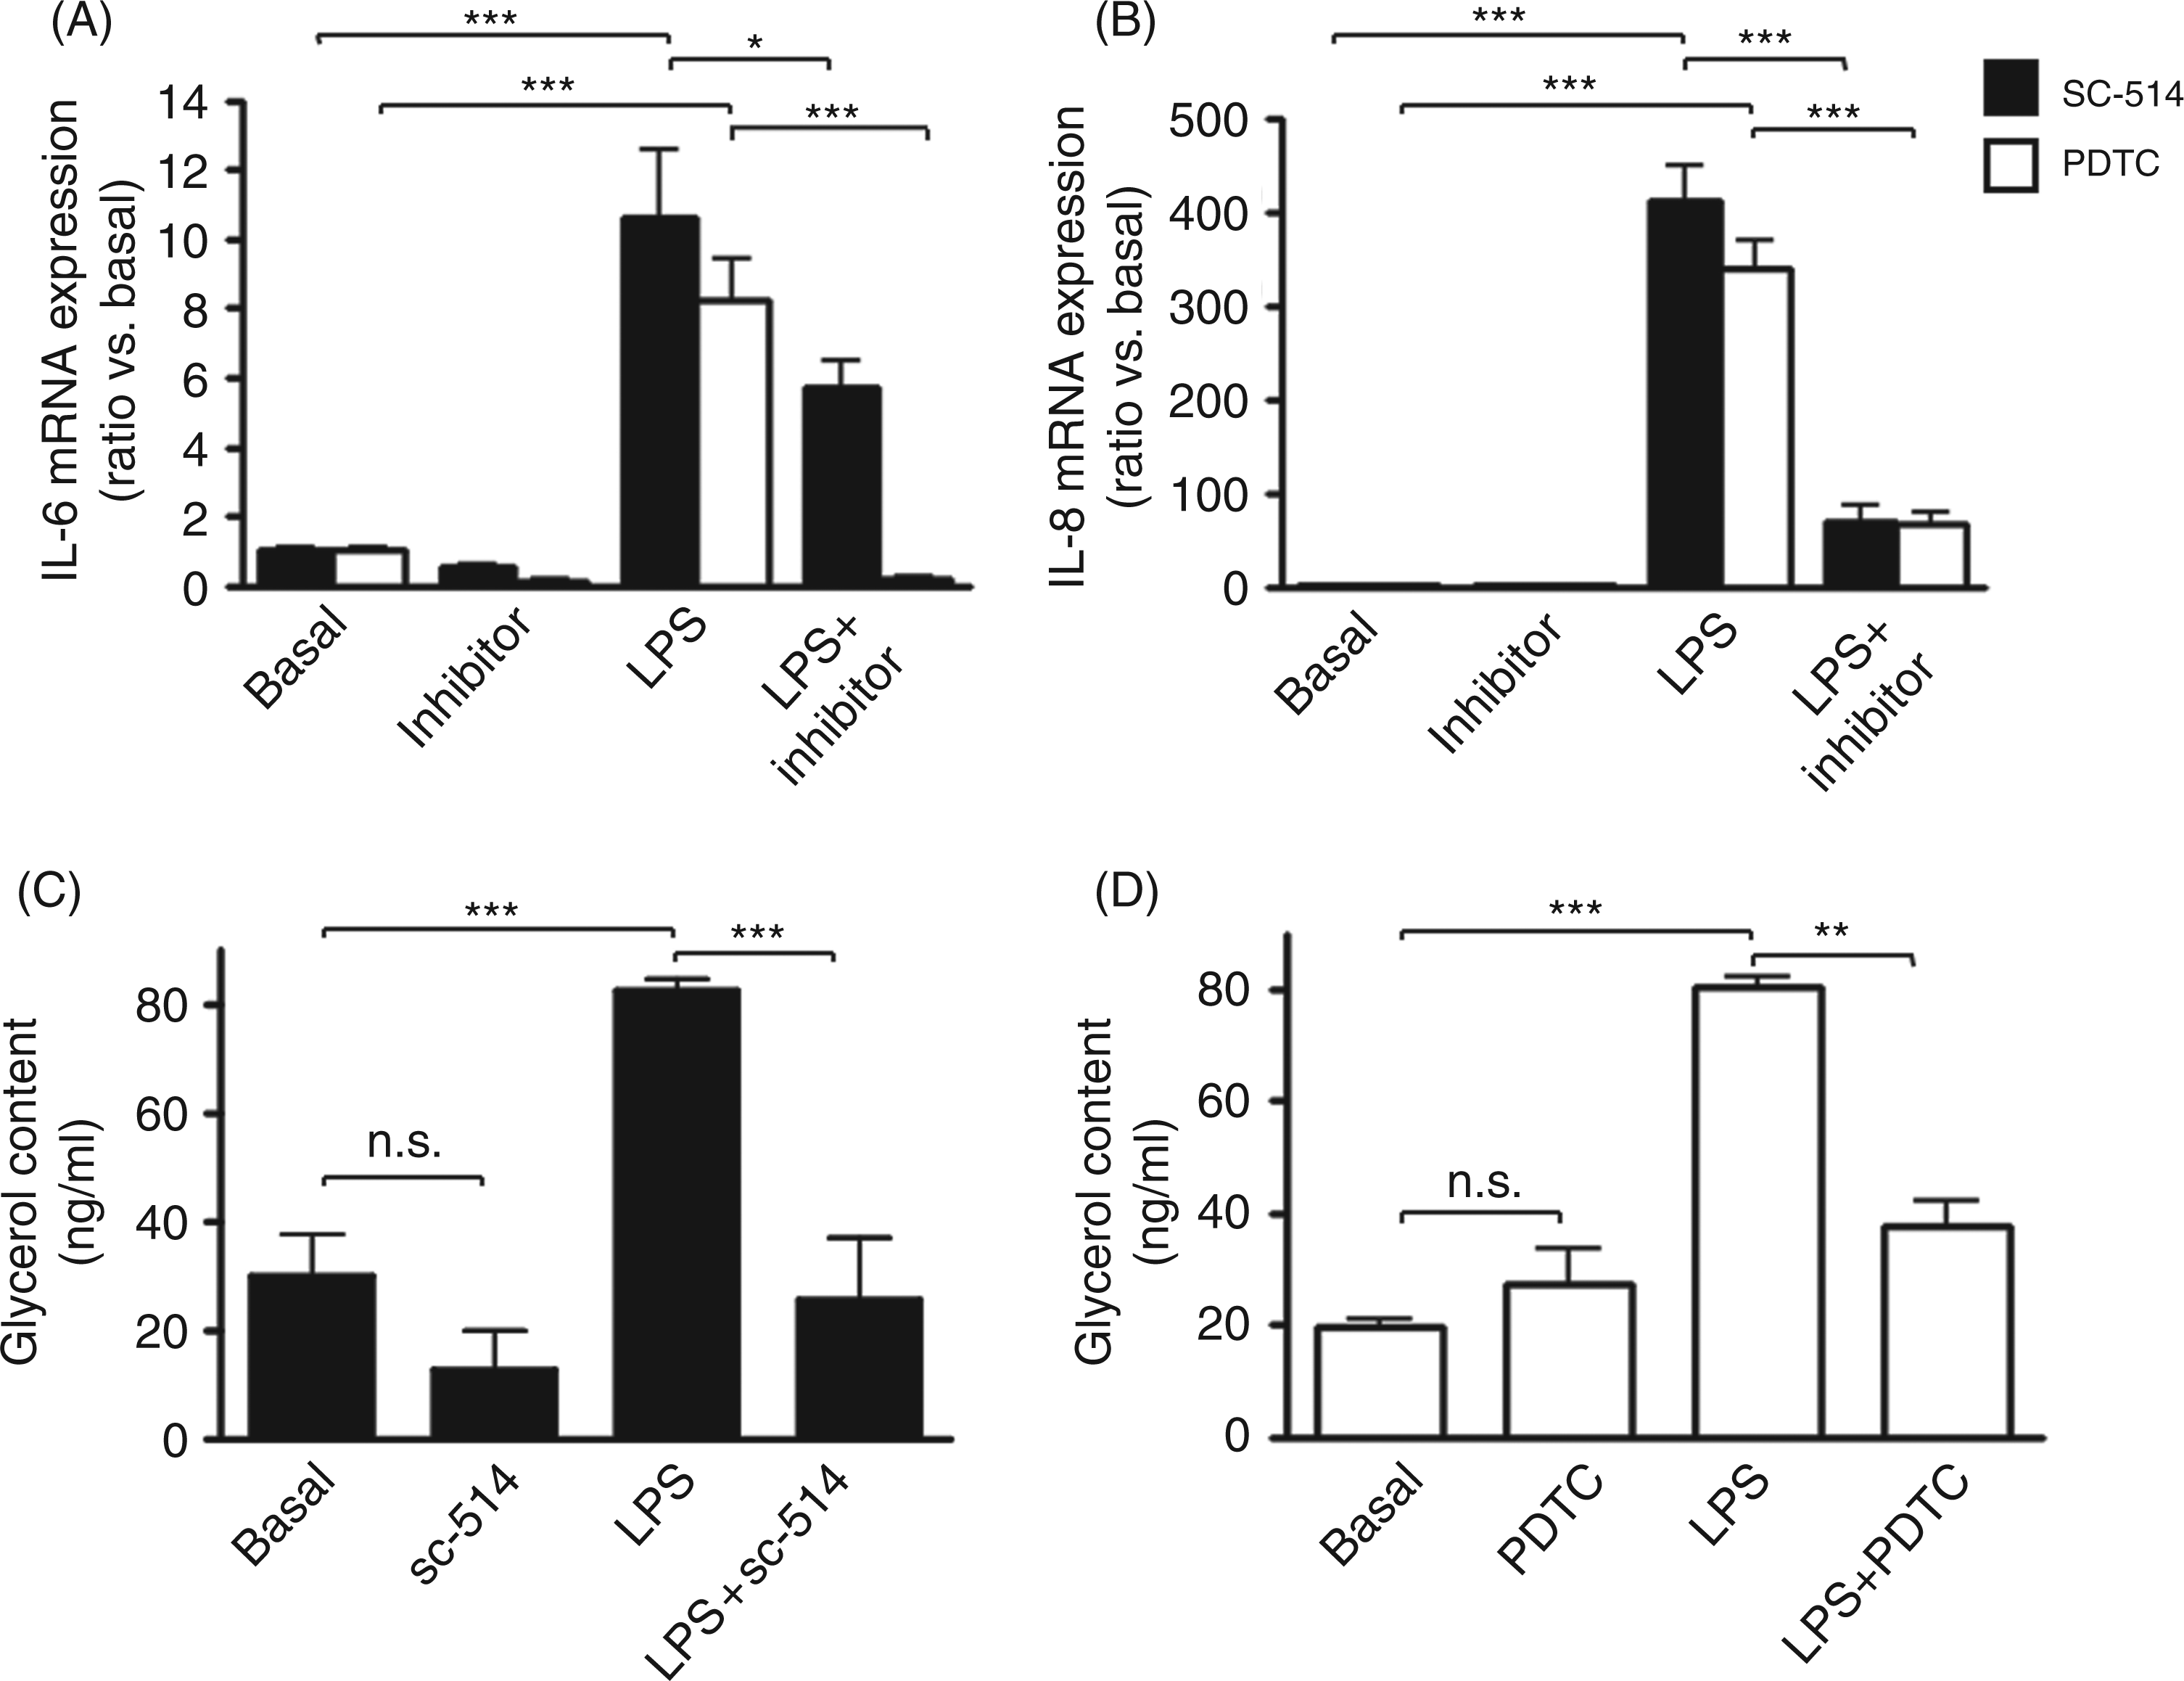
The classical lipolytic PKA/HSL pathway is required in LPS-induced lipolysis
Co-treatment with the PKA inhibitor, H-89 (Fig. 4A), inhibited LPS-induced glycerol release from 72.4 ±2.8 ng/ml (P < 0.001 vs basal) to 26.6 ± 2.4 ng/ml (P < 0.001 vs LPS alone). H-89 did not significantly decrease basal glycerol release. The involvement of lipase was assessed using the lipase inhibitor orlistat or the HSL inhibitor CAY10499 (Fig. 4B,C, respectively). The LPS-induced glycerol release (P < 0.01 vs basal) was inhibited to 21.2 ± 4.1 ng/ml and to 22.7 ± 1.4 ng/ml (P < 0.001 vs LPS alone) in presence of orlistat and CAY10499, respectively.
Involvement of the PKA/HSL pathway in LPS stimulated glycerol release. Pre-adipocyte-derived adipocytes were pre-treated for 1 h with 20 µ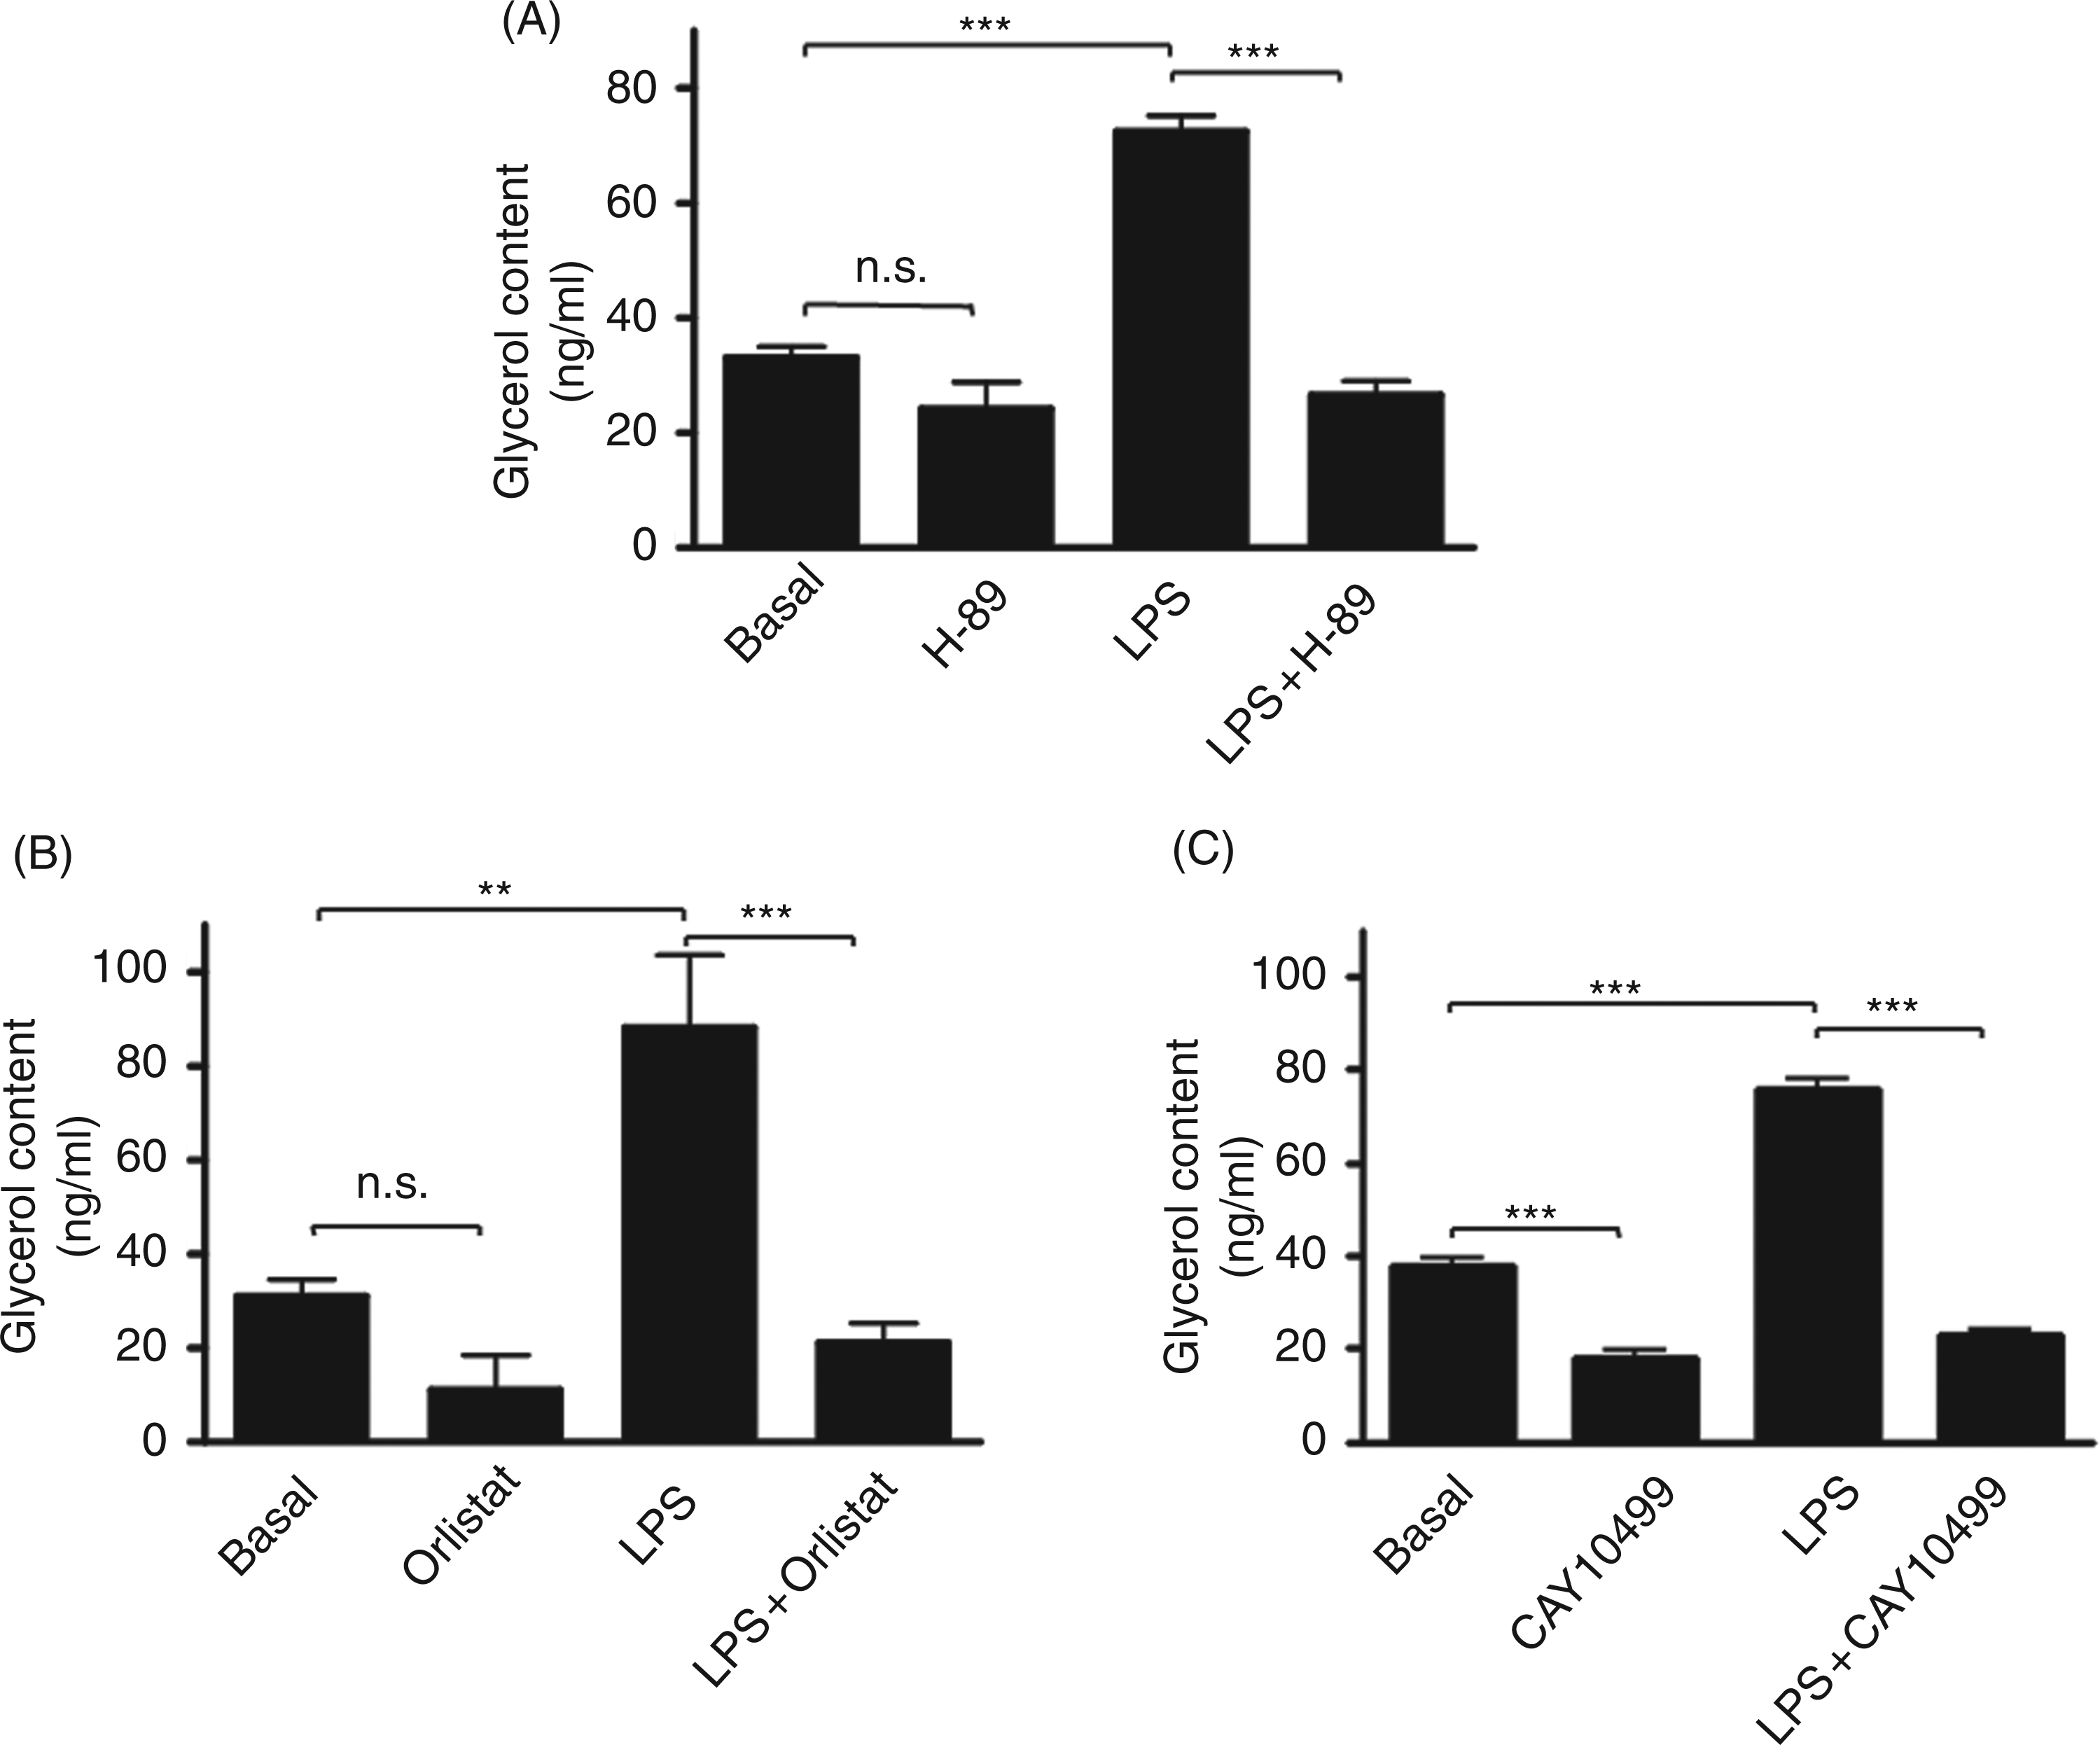
The MAPK pathway is involved in LPS-induced lipolysis
Co-treatment with the MAPK inhibitor, U0126 (Fig. 5), reduced LPS-induced glycerol release from 77.4 ± 2.5 ng/ml (P < 0.001 vs basal) to 47.7 ± 1.5 ng/ml (P < 0.001 vs LPS alone). U0126 did not alter basal glycerol release.
Involvement of the MAPK pathway in LPS-induced glycerol release. Pre-adipocyte-derived adipocytes were pre-treated for 1 h with 10 µ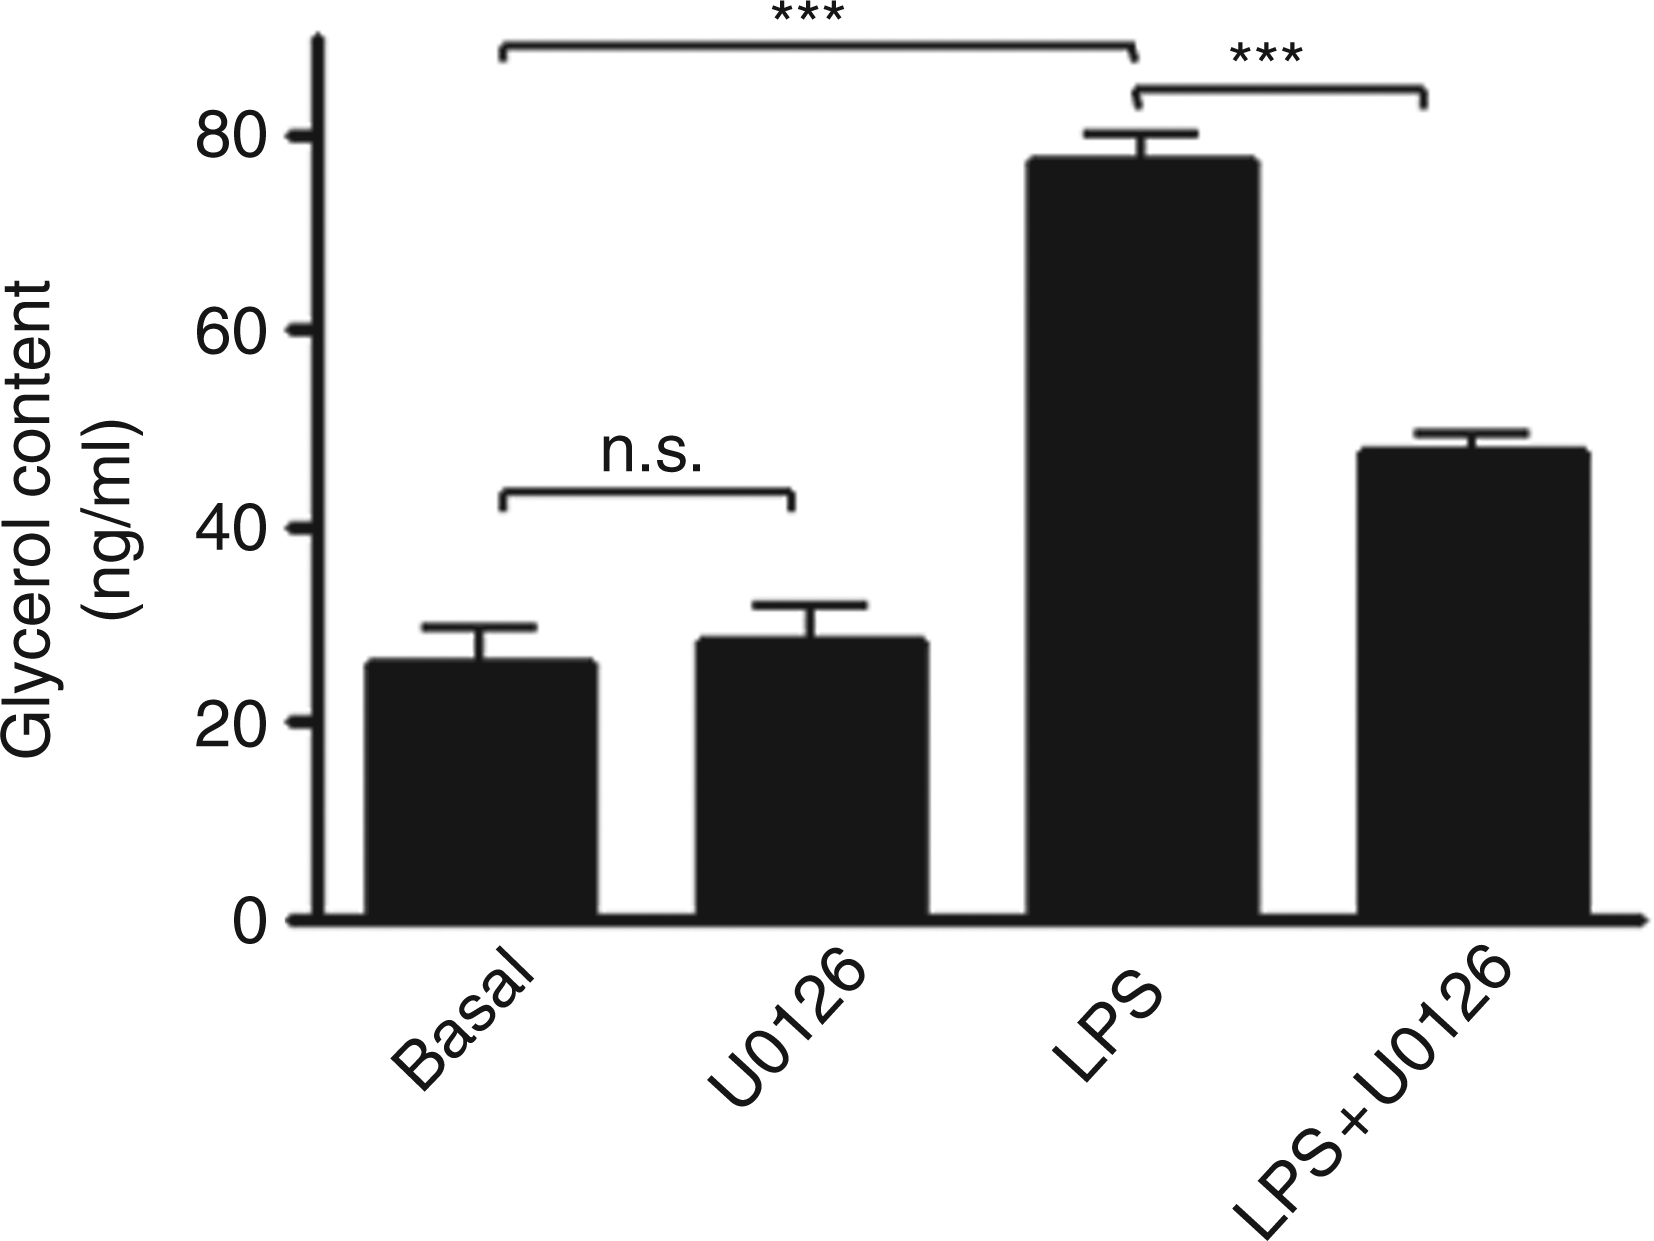
Lipopolysaccharide-induced lipolysis enhanced inflammatory cytokine expression: a positive feedback loop
The synthetic catecholamine isoproterenol and the phosphodiesterase type III inhibitor milrinone increased lipolysis to 100.1 ± 1.6 ng/ml (P < 0.001 vs basal) and 365.0 ± 11.3 ng/ml (P < 0.001 vs basal), respectively (Fig. 6A). Co-treatment with isoproterenol and milrinone enhanced LPS-induced glycerol release to 157.7 ± 7.1 ng/ml and to 578.8 ± 25.0 ng/ml (P < 0.001 vs LPS alone), respectively. Isoproterenol and milrinone did not alter basal IL-6 mRNA expression (P = n.s. vs basal; Fig. 6B). Isoproterenol tended to increase LPS-induced IL-6 mRNA expression (P = n.s. vs LPS) and milrinone enhanced LPS-induced IL-6 mRNA expression (P < 0.001 vs LPS alone). Isoproterenol and milrinone did not alter basal IL-8 mRNA expression (P = n.s. vs basal; Fig. 6C) but enhanced LPS-induced IL-8 mRNA expression to 645.8 ± 128.5-fold (P < 0.05 vs LPS alone) and to 1540.0 ± 144.9-fold (P < 0.001 vs LPS alone), respectively.
Lipolytic compounds enhanced LPS-induced cytokine expression. Pre-adipocyte-derived adipocytes were pre-treated for 1 h with 1µ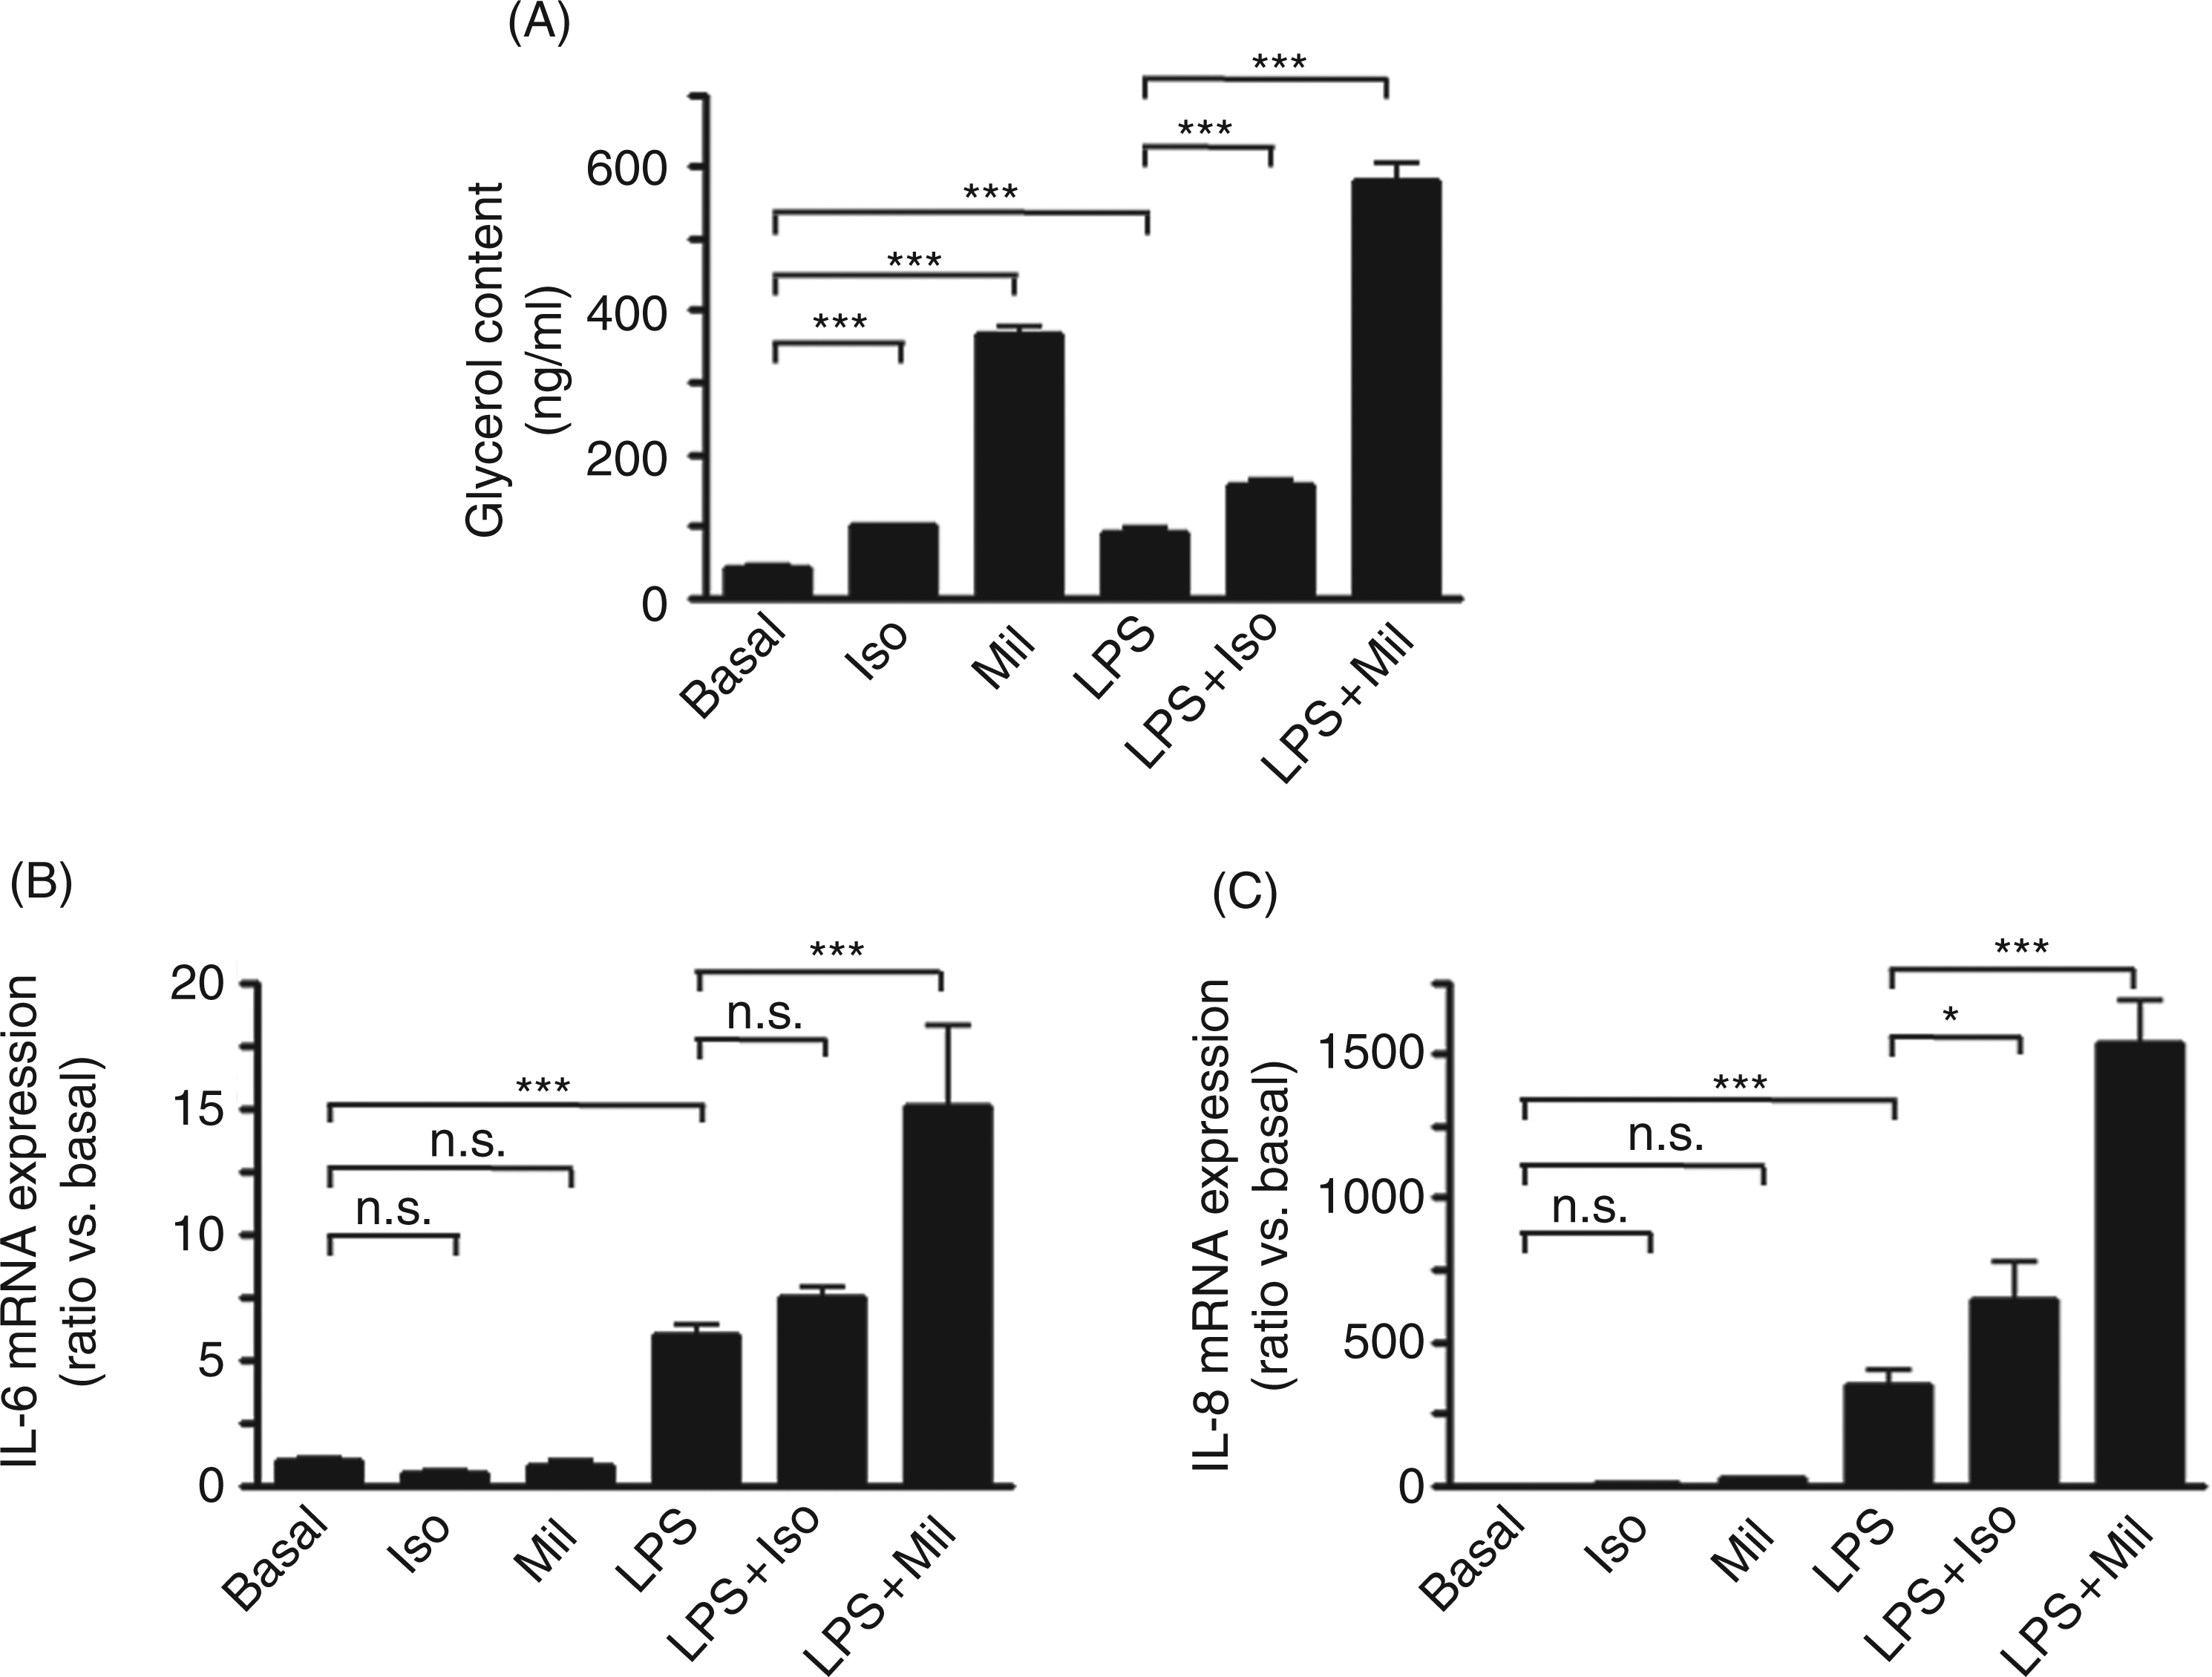
Activation of lipases results from the integration of various intracellular signalling pathways, representing the key downstream effectors of lipolysis. Therefore, we used orlistat or CAY10499 to inhibit LPS-induced lipolysis at its final step. Co-treatment with orlistat or CAY10499 reduced LPS-induced IL-6 mRNA expression (P < 0.01 vs LPS; Fig. 7A). Similarly, co-treatment with orlistat or CAY10499 reduced LPS-induced IL-8 mRNA expression (P < 0.05 vs LPS; Fig. 7B).
Lipopolysaccharide-induced lipolysis reinforced inflammatory cytokine expression: a positive feedback loop. Pre-adipocyte-derived adipocytes were pre-treated for 1 h with 100 µ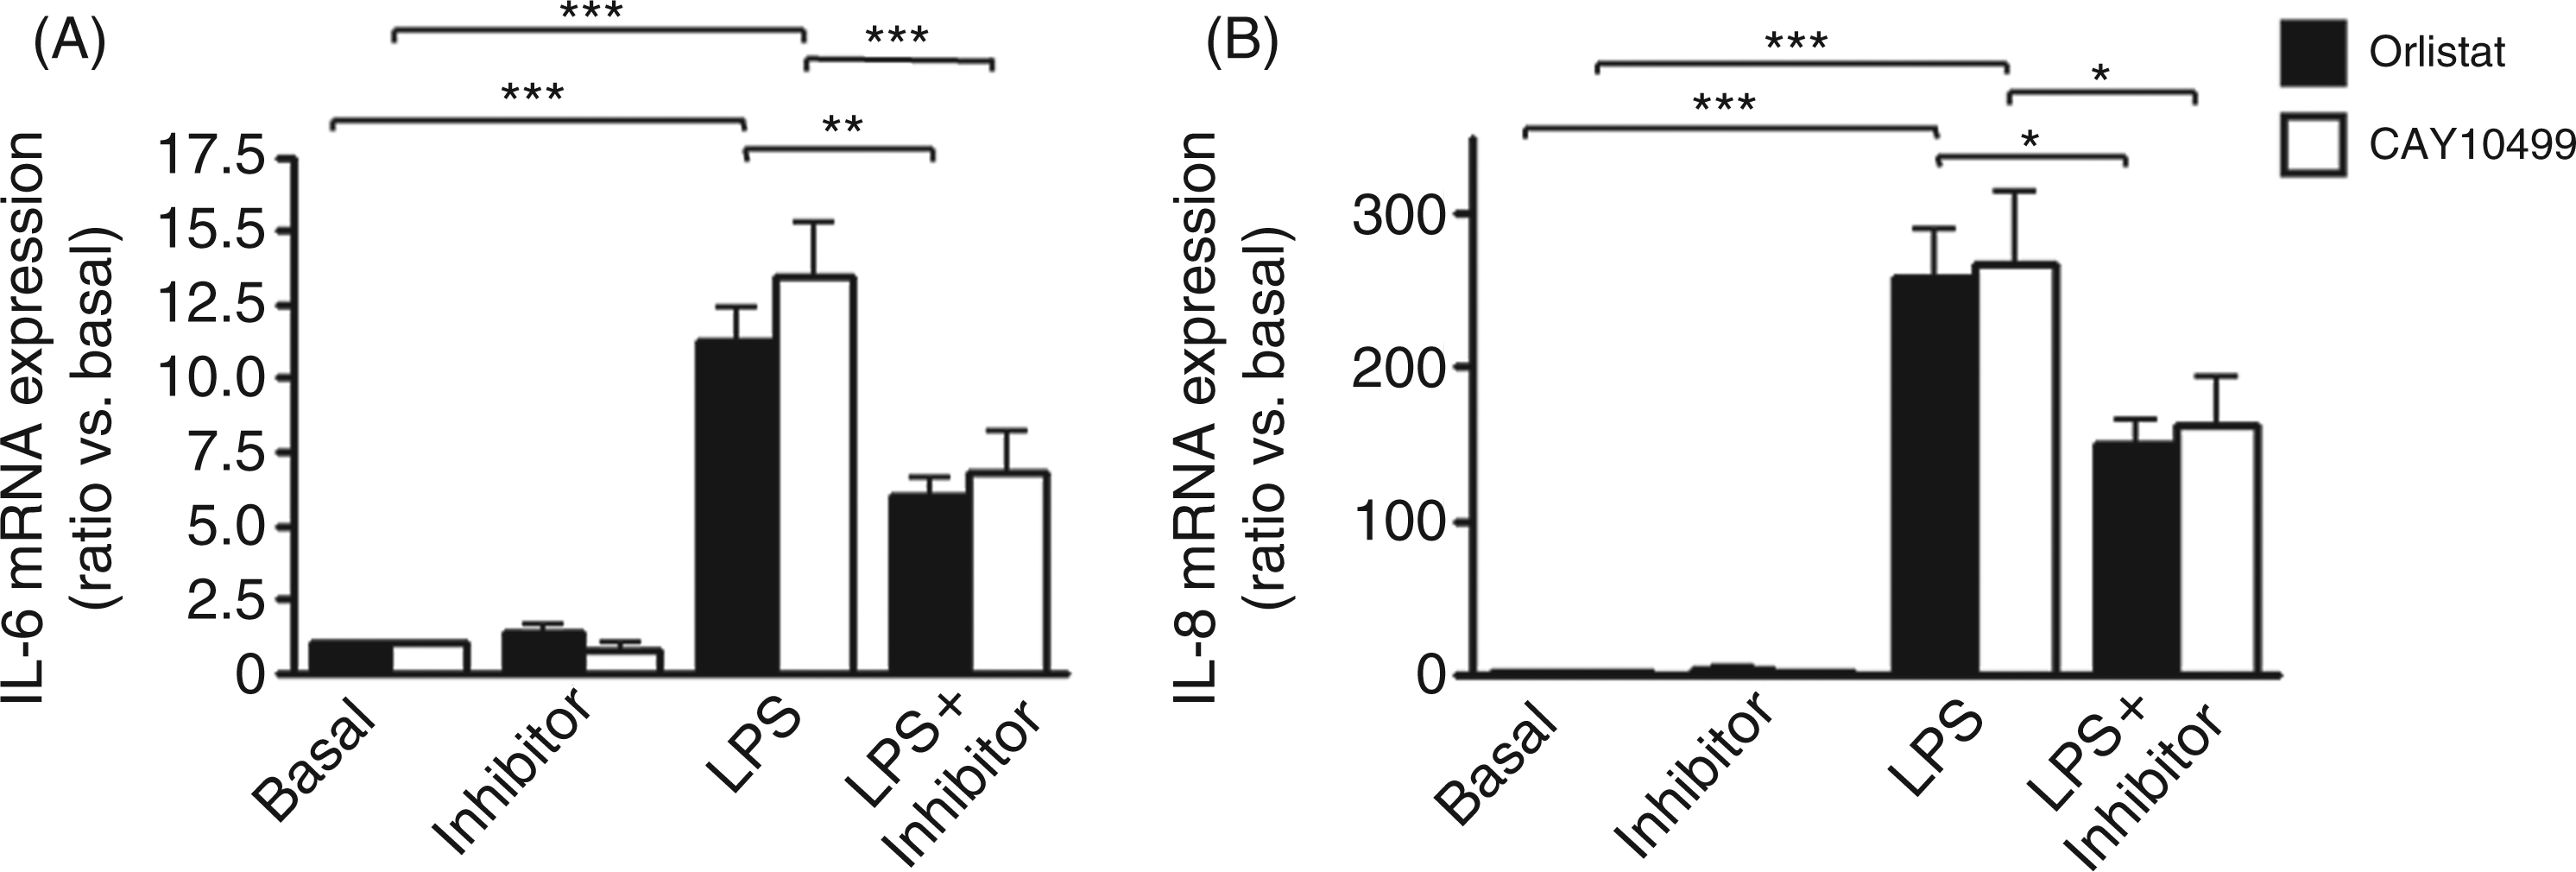
Discussion
In our well-characterized, human, pre-adipocyte-derived adipocytes, LPS induced mRNA expression of the pro-inflammatory cytokines IL-6 and IL-8 and lipolysis (i.e. glycerol release). Co-treatment with inhibitors of IKKβ or NF-κB inhibited LPS-induced lipolysis (Fig. 8A). Co-treatment with the PKA inhibitor H-89, the lipase inhibitor orlistat or the potent inhibitor of human HSL CAY10499 also abolished the lipolytic effects of LPS (Fig. 8B). Therefore, both the inflammatory IKKβ/NF-κB pathway and the classical lipolytic PKA/HSL pathway are involved in LPS-induced lipolysis. The link between these two pathways needs further investigation and may be direct or indirect via cytokines, adipokines or other intermediate pathways. The LPS-induced mRNA expression of pro-inflammatory cytokines is reduced by inhibitors of lipolysis (orlistat, CAY10499) and is enhanced by lipolytic agents (isoproterenol, milrinone), suggesting that LPS-induced lipolysis reinforces the expression of pro-inflammatory cytokines and may contribute to trigger its own lipolytic activity (Fig. 8C).
Model for the intracellular mechanisms involved in LPS-induced inflammation and lipolysis in human adipocytes. Co-treatments with the IKKβ inhibitor sc-514 or the NF-κB inhibitor PDTC inhibit LPS-induced lipolysis (A). Co-treatment with the PKA inhibitor H-89 or the hormone-sensitive lipase inhibitor CAY10499 abolishes the lipolytic effects of LPS (B). However, the link between the inflammatory TLR4/IKKβ/IκB/NF-κB and the classical lipolytic cAMP/PKA/HSL pathways needs further investigations. This link may be direct or indirect via cytokines, adipokines or other intermediate pathways which have to be determined and is represented by (…) in A and B. Inhibition of LPS-induced lipolysis by the MAPK inhibitor U0126 suggests that the MAPK pathway could be one of these intermediate pathways. In turn, orlistat or CAY10499 inhibition of lipolysis (C) reduces LPS-induced mRNA expression of pro-inflammatory cytokines (dashed line). Lipolytic agents such as isoproterenol (synthetic catecholamine) or milrinone (phosphodiesterase type III inhibitor) enhanced the LPS-induced mRNA expression of pro-inflammatory cytokines. Together, this suggests that LPS-induced lipolysis reinforces the expression of pro-inflammatory cytokines (dashed arrow) and may contribute to trigger its own lipolytic activity.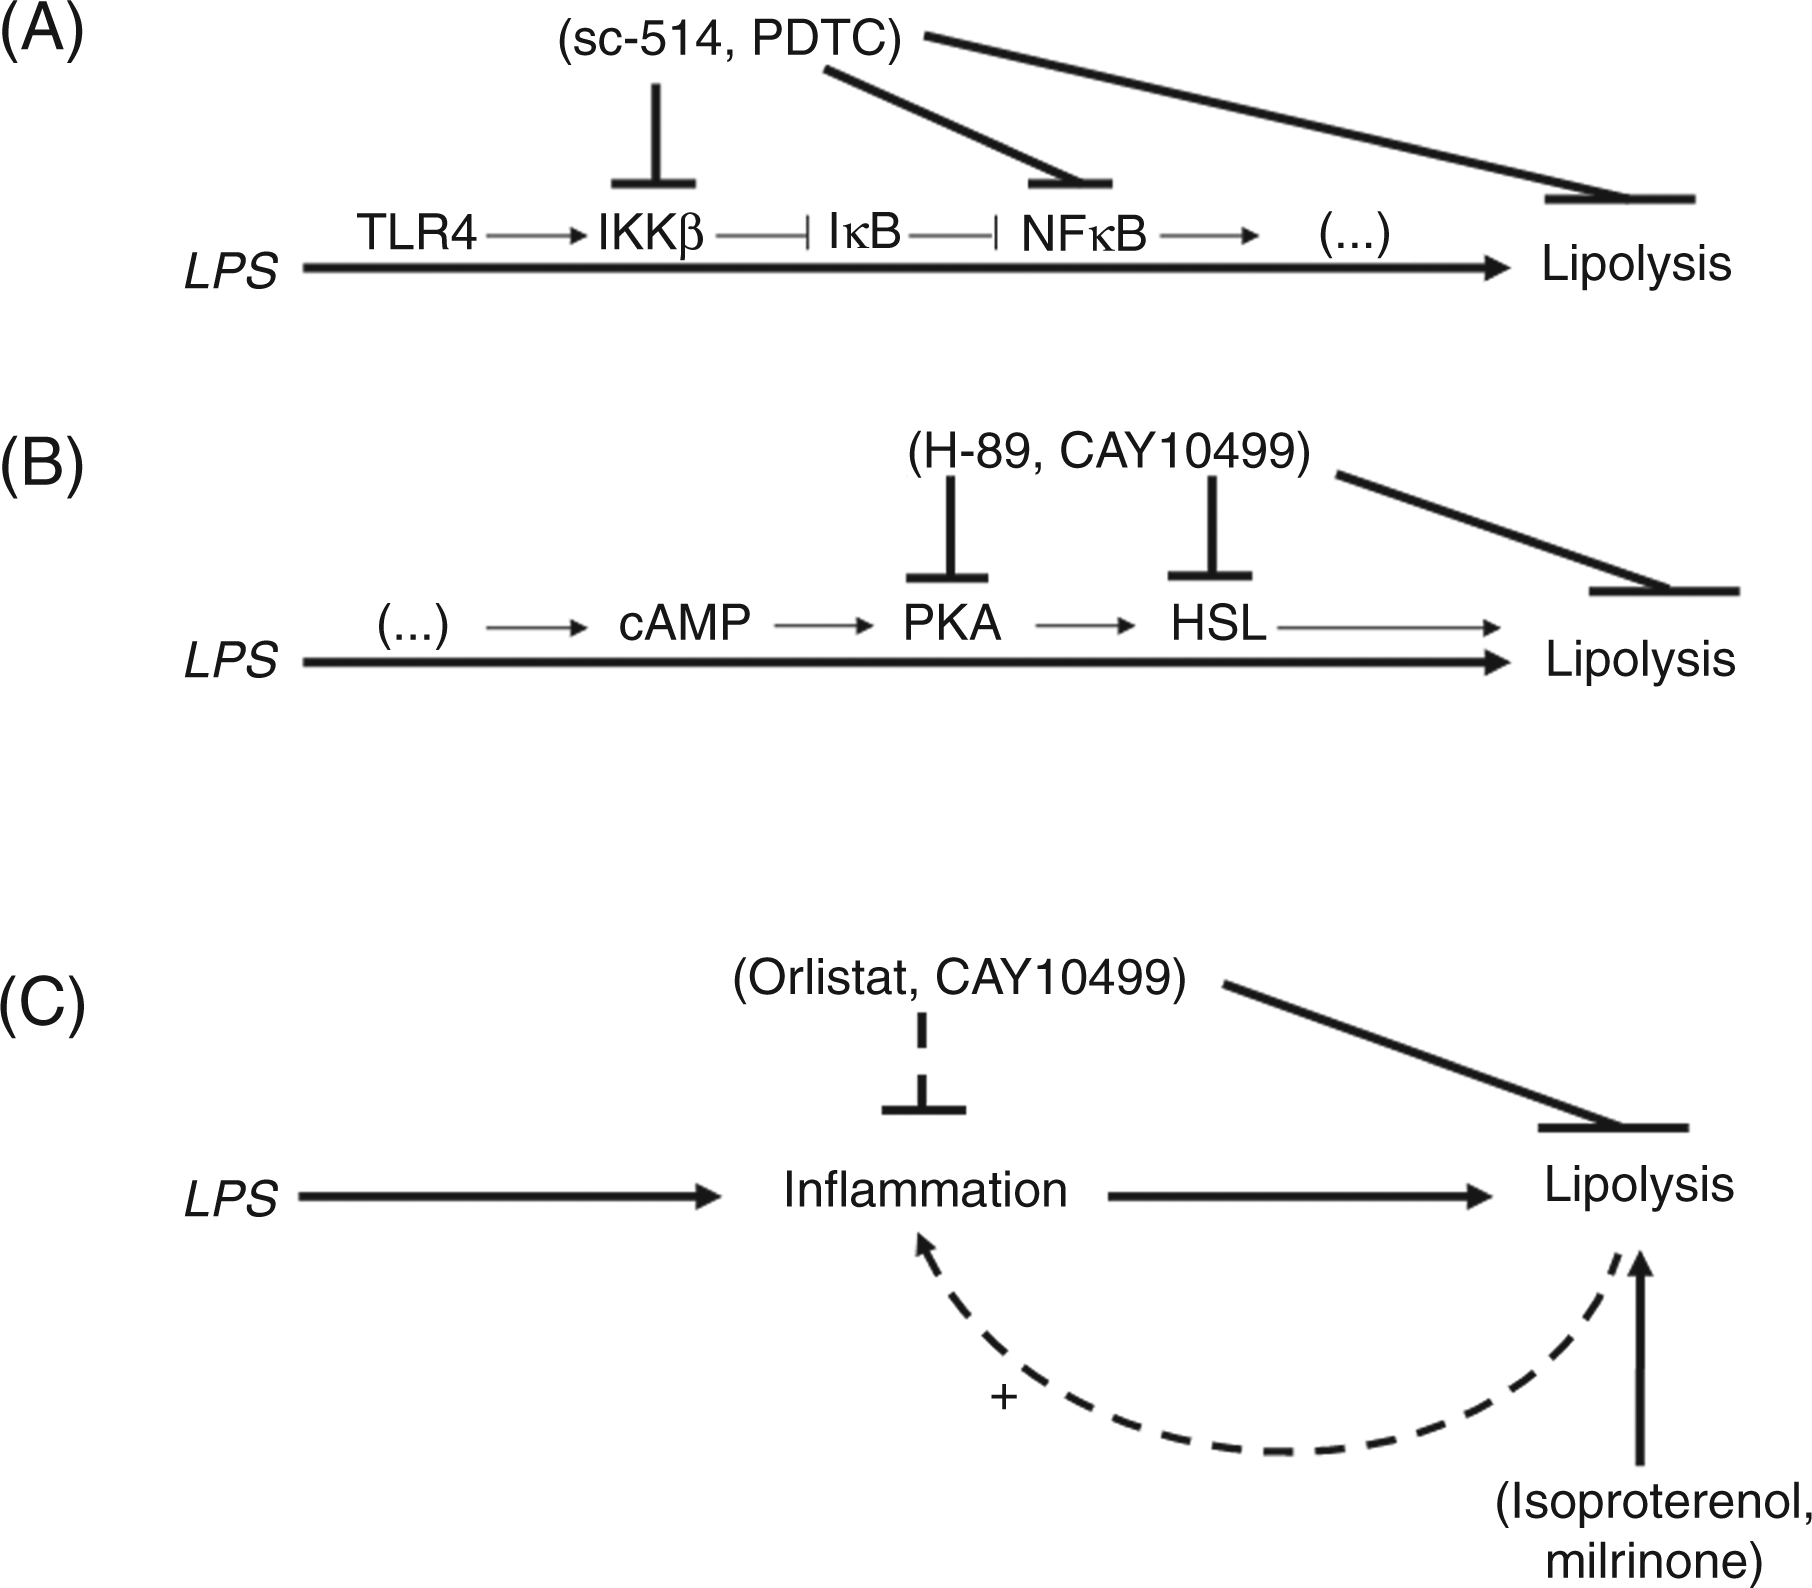
Expression of the pro-inflammatory cytokines IL-6 and IL-8 in human pre-adipocyte-derived adipocytes was increased upon LPS exposure, in agreement with previous data from our group showing that cytokine production and secretion was induced by LPS in adipose tissue explants and with data obtained in LPS-exposed human mesenchymal stem cell (hMSC)-derived adipocytes. 16 However, IL-6 and IL-8 were unable to induce their own mRNA expression in hMSC-derived adipocytes. Additionally, these cytokines could not induce lipolysis in hMSC- or pre-adipocyte-derived adipocytes (data not shown). Interleukin-6 and IL-8 are, therefore, useful markers of inflammation but seem not to represent the missing link between the inflammatory and metabolic pathways inducing lipolysis upon LPS stimulation. Nevertheless, their expression was decreased by an inhibitor of the NF-κB pathway and reduced by the lipase inhibitors orlistat or CAY10499 while lipolysis was abolished by each of them. This suggests that lipolysis is induced by the classical IKKβ/NF-κB inflammatory pathway and exerts a positive feedback loop on inflammation. Indeed, Shi et al. 17 demonstrated that fatty acids (FAs) can activate the receptor for LPS known as TLR4 in monocytes and adipocytes. Their data further showed that the mixture of palmitate and oleate induced IL-6 expression and secretion in adipocyte cell culture and that this inflammatory response depends on TLR4 receptor. Together, the release of FAs upon LPS-induced lipolysis may reinforce TLR4 activation and the increase of pro-inflammatory cytokine expression. Moreover, inducing lipolysis with either isoproterenol or milrinone in the absence of LPS for 24 h did not increase IL-6 or IL-8 mRNA expression in our adipocytes. This suggests that increasing lipolysis potentiated the pro-inflammatory effects of LPS but that increasing lipolysis by itself did not lead to an increased expression of pro-inflammatory cytokines. In comparison with isoproterenol, milrinone was a more potent inducer of lipolysis in our adipocytes, resulting in a more pronounced increase of cytokine expression in LPS-treated cells.
Fatty acid metabolism is regulated by precise control of lipolysis. Fatty acids are stored as TAG in adipocytes and their sequential hydrolysis results in liberation of FAs with the generation of DAG (diacylglycerol), MAG (monoacylglycerol) and glycerol. 10 The indirect measurement of lipolysis by evaluating glycerol content and, therefore, release in the cell culture supernatant allows determining the final result of lipolysis. Indeed, lipolysis in adipocytes produces glycerol and FFAs. Glycerol cannot be re-utilised for TAG re-synthesis due to a lack of glycerol kinase in normal white adipocytes and is released along with FFAs, in the culture medium. 18 Several lipases are involved. ATGL initiates lipolysis, HSL is the intermediate enzyme and the monoacylglycerol lipase performs the final step. 10 However, and unlike HSL, ATGL activity does not appear to be regulated directly by PKA phosphorylation. 19 Our data show that LPS-induced lipolysis is dependent of PKA and inhibited by the potent HSL inhibitor CAY10499. Together, this suggests that HSL is the rate-limiting enzyme in the lipolytic effects of LPS.
These results are at variance with a study published recently reporting that both NF-κB and PKA pathways do not participate in LPS-induced lipolysis in murine adipocytes. 12 The different findings can be explained by the fact that our study was performed in human adipocytes. They also showed that phosphorylation of IKKα/β and IκBα were slightly increased in LPS-stimulated adipocytes and that HSL protein content and lipase activity were increased upon LPS exposure, corroborating our observations. Additionally, their results showed that the MAPK pathway was involved in LPS-induced lipolysis. We, therefore, used the mitogen-activated protein kinase (MAPK) inhibitor U0126 in a similar experimental setting and we could confirm that U0126 only partly reduced LPS-induced lipolysis. Therefore, MAPK signalling pathway is also involved in LPS-induced lipolysis in human adipocytes. Hypothetically, the MAPK pathway may represent one of the missing links between the inflammatory NF-κB and the classical lipolytic PKA/HSL pathways involved in the lipolytic effects of LPS in human adipocytes.
Conclusions
Based on these data, the inflammatory IKKβ/NF-κB pathway and the classical lipolytic PKA/HSL pathways are required in LPS-induced lipolysis. Additional work needs to be performed to understand the mechanisms of interaction between these two pathways. The observation that LPS-induced lipolysis reinforces the expression of pro-inflammatory cytokines and may contribute to trigger its own lipolytic activity further suggests that inflammation is triggering lipolysis and is a key player in its sustained activation in the obese state.
Footnotes
Acknowledgements
The authors thank Prof. Alex Eberle and his group, especially Dr Peter Lindinger, Dr Martine Calame, Estelle Hirzel, Verena Jäggin, Heidi Tanner and Jean Burckhardt (Department of Biomedicine, University Hospital Basel) for their helpful discussion and technical support. Additional thanks to Stephanie Häuselmann, Berit Rosc and Vera Lorenz for helpful technical support.
This study was supported by grants from the University of Basel (Forschungsfonds-Förderung für Nachwuchsforschende der Universität Basel) and the Stiftung der Diabetes-Gesellschaft Region Basel to Jean Grisouard, by a grant from the Novartis Stiftung für Medizinisch-Biologische Forschung (PP00P3_123346/1) to Mirjam Christ-Crain and a grant from Sanofi-Aventis to Beat Müller.