
Abstract
For the past two decades or more, obesity has been increasing in industrialized and affluent countries. This increase has been shown in children, adults and the elderly. The latest statistical studies in Saudi Arabia show that obesity is increasing, with obese Saudi women outnumbering obese Saudi males, and that these numbers are continuously rising. Obesity, which leads to many medical risks, affects the immune system in direct and indirect ways. In this study, the effect of obesity on the immune system of 119 Saudi female university students was investigated. Using a blood sample from each subject, the following immune-related parameters were determined: total and differential white blood cell counts (WBCs), total lymphocyte and sub-lymphocyte cell counts. Two measures of body fat were used: the body mass index (BMI) and the waist-to-hip ratio (WHR) to correlate body weight to the other measured parameters. A significant correlation was present between BMI and WHR each with total white blood cells, neutrophils, and CD4 lymphocyte concentrations. Some other parameters were only affected by the increase in the BMI but not the WHR, such as platelets, while others were affected by the WHR only, such as total T-cells. On the other hand, there were no significant correlations between BMI or WHR and basophil, eosinophil, monocyte, CD8, B-cell, and NK-cell counts. The findings indicate that obesity might seriously affect the innate and adaptive immune systems.
Introduction
Obesity has been on the rise in many industrialized and affluent countries for the last 20 years or more. Data on the Saudi Arabian population confirm that obesity and overweight are increasing, and that obesity is higher in females than in males, with foreseen rises in the levels of several associated diseases and conditions. 1 – 4 Obesity is a known major risk factor for many diseases (such as cardiovascular diseases, tumors, and diabetes) and may lead to a shortened life-span. It has also been shown that the obese have a higher non-specific inflammatory response. 5 Due to the increasing prevalence of obesity and overweight and its associated risks, many scientists are studying the relationship between body weight and general health. The effect of overweight and obesity on immunity is one relationship that researchers are attempting to elucidate. Many studies on humans and animals have inconclusively shown that obesity affects the levels of immune cells and that there is an association between obesity and cellular immunity. 6
There are several ways to judge body weight depending on different parameters, and each method has its advantages and disadvantages. The two most common and accurate methods are body mass index (BMI), and waist-to-hip ratio (WHR). Body mass index reflects a person’s weight in relation to height and thus gives a general indication of the healthy weight for height. 7 The waist-to-hip ratio classifies subjects into three major risk groups for health problems. 8 The WHR is the best indicator of central obesity, which increases the risk of cardiovascular disease.
Both innate and acquired immune responses are activated not only when a pathogen is present, but also in the case of abnormal conditions and malfunctions in the body, such as in the case of obesity. It has been shown that body weight affects the immune system in direct and indirect ways. One way to measure this effect on the immune system is to measure the concentrations of the different cells involved in immune responses.
Platelets play a major role in immunology, especially in inflammatory response. 9 They contain granules with contents that result in leukocyte attraction and an increase in inflammation. It has been shown 10 – 15 that platelet counts and activity are effected by body weight, obesity and WHR. This affect of obesity on platelet counts, in turn, interrupts and affects immunological functions. Platelet counts have been shown to rise in obese women and with increasing WHR.10,11,13
Platelet hyperactivity is associated with atherosclerosis and cardiovascular disease.10,11 Contrary to the findings discussed above, inhibition of platelet activity has been found to be associated with obesity. 12 Studies14,15 on the effects of obesity on platelet counts found that the obese and high WHR groups had higher platelet activation. Systemic inflammation may be related to platelet activation by the inflammatory cytokines released in the process. Thus, this relation between platelet activation, inflammation and obesity is a link between the immune system and cardiovascular disease.
A study by Nieman et al. 16 on a community of obese and non-obese women showed a general increase in leukocytes, monocytes, granulocytes, and neutrophil phagocytosis in obese women. Another study on obese adolescent females found a positive correlation between neutrophils and total white blood cell counts with BMI, while basophil counts were negatively correlated with BMI. 17 An increase in the white blood cell counts is known to be a major risk factor for inflammatory responses, 18 and coronary heart disease. 19
Researchers showed that the leukocyte and lymphocyte subset counts are increased by obesity, except for natural killer (NK) cells and T cytotoxic/suppressor (CD8) cells. 20 Obesity also decreases the cell activity of NK cells, 6 and the proliferation of mitogen-induced B- and T-cells. 20 A major role in the regulation of the immune response is played by NK cells, which are important in innate defense mechanisms and may be considered as a bridge which links innate and acquired immunities. 21
A research study on females found that higher CD4, CD8, WBCs, and total lymphocyte counts were associated with overweight and obesity, while a higher CD8 count was associated with morbid obesity. In addition, no significant relationship was found between percentages of CD4 and CD8 or CD4/CD8 ratio and obesity. 22
In animal studies, obesity was found to affect cell-mediated immune response. It also leads to the enhancement of NK-cell activity. The number of functional T-cells decreased in the obese animals, which resulted in impaired immunity. 6 These animal studies confirm the destructive effects of obesity on the immune system. In another study, 23 obese mice showed a higher sensitivity of antigen-induced T-cell responses.
The aim of this study was to determine the effects of overweight and obesity on cells of the immune system in healthy young females. This is important to better understand the relationship between increasing weight and the immune response in healthy individuals, especially since there are no data on this relationship in the local community. This may help set better guidelines for the ideal weight for a strong immune response.
Subjects and methods
Subjects and categories
A total of 119 randomly chosen Saudi female students (17–26 years old) at King Abdulaziz University (Jeddah, Saudi Arabia) took part in this study. The subjects filled a consent form and a questionnaire concerning their general health state and life style. Subjects with any health problems (such as diabetes and blood abnormalities) or taking any medications (such as anti-inflammatories or hormonal drugs, other than birth control pills) were excluded. Also, none of the subjects were menstruating or pregnant when blood samples were obtained.
Subjects were divided into five groups, or categories, based on their BMI. The underweight group included all subjects with a BMI below 18.9 kg/m2; the average or healthy weight group had a BMI of 18.9–24.9 kg/m2; the overweight group were those with a BMI between 25–29.9 kg/m2; obese subjects had a BMI range between 30–40 kg/m2; and, finally, a BMI above 40 kg/m2 was defined as the highly obese category.
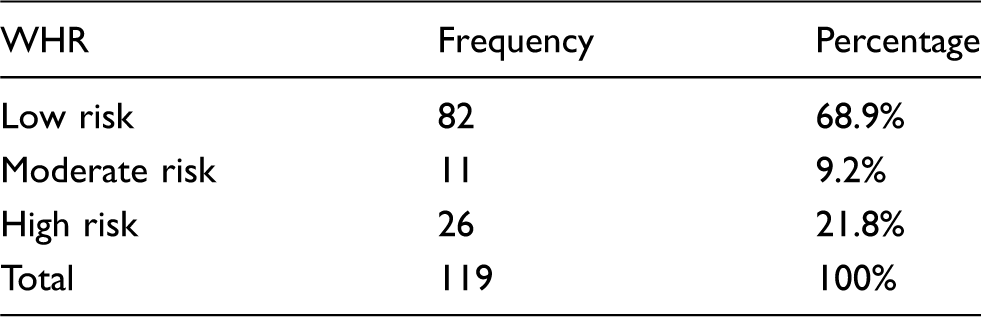
Using the WHR, subjects were also classified into one of three major risk groups. The cut-off points differ for females and males and thus the ones used here are specific for females. Subjects at a low risk for health problems are those with a WHR of 0.8 and below, moderate risk WHR is between 0.81–0.85, while high risk is a ratio above 0.85. 8
Blood collection
Whole blood was collected, from each subject, into EDTA Vacutainer tubes, which were used within 3 h for differential complete blood counts (CBCs). Whole blood was collected into sodium heparin (NH) Vacutainer tubes for the determination of lymphocyte subsets since this allows the blood to be used for up to 3 days.
Concentration of white blood cells and differential complete blood count
Both the total white blood cells and differential CBCs were assayed at the King Abdulaziz University Hospital using a Coulter Counter (LH755; Miami, FL, USA). The total and differential (total lymphocytes, monocytes, neutrophils, eosinophils, and basophils) white blood cell counts were determined using both fluorescence and optical scattering. Also, the platelet counts were determined.
Lymphocyte subset count
The lymphocyte subsets were determined in whole blood using a flow cytometer (FACSCanto II; Becton Dickinson, San Jose, CA, USA) at the King Khalid National Guard Hospital, Jeddah, Saudi Arabia.
To determine the counts of each lymphocyte class and subclass, different class or subclass specific antibodies (all from Becton Dickinson) were used. To determine the total concentration of lymphocytes, peridinin chlorophyll protein (PerCP)-labeled mouse anti-human-CD45 monoclonal antibody was used. The total percentage of T-lymphocytes was determined using a fluorescein-isothiocyanate (FITC)-conjugated mouse anti-human CD3 (FITC-CD3) monoclonal antibody (MAb). For the determination of CD4 cells, the above FITC-CD3 antibody was used in addition to a phycoerythrin (PE)-labeled mouse anti-human CD4 monoclonal antibody. For the determination of CD8 cells, the above mentioned FITC-CD3 was used in addition to a PE-labeled mouse anti-human CD8 monoclonal antibody. A PE-labeled mouse anti-human CD19 monoclonal antibody was used for the determination of B-lymphocytes. PE-labeled mouse anti-human CD16 and CD56 monoclonal antibodies were used for the determination of the concentrations of NK-cells in whole blood.
Staining method
In vitro diagnostic use Becton Dickinson reagents were used for the determination of the major lymphocyte subsets by using three color lymphocyte immunophenotyping. Whole blood (100 µl) was added to the lineage-specific antibodies (as described above) in each tube. After being gently vortexed, the tubes were incubated in the dark for 20 min, to ensure the binding between the antibodies and the cells. A Becton Dickinson FACS lysing solution was added to lyse the red blood cells (RBCs) and the solution was allowed to incubate in the dark for 10 min. Tubes were centrifuged for 3 min at 3000 rpm, the supernatant was decanted and the sample was washed using phosphate-buffered saline (PBS) solution. Subsequently, the tubes were again centrifuged for 3 min at 3000 rpm and the supernatant was decanted. Finally, a Becton Dickinson Cell Fixative solution was added to each tube.
The specimens were run on the above mentioned FACSCanto II flow cytometer. Before running samples, fluidic start-up, threshold adjustment, and voltage setting were performed. These are done to ensure the proper functioning of the instrument and the proper acquisition of data. The immune complexes which resulted from the binding of the cells and the antibodies, in the previous step, deflect the laser light. The degree of scattering depends on the physical properties of the cell, mainly its size and internal complexity.
Gating lymphocytes
The correlation of CD45 and side-scatter (SSC) allows the differentiation of cell types by knowing the general area on the dot plot for lymphocytes, monocytes and granulocytes. The percentage of each cell type was obtained using the instrument’s software. As confirmation, the sum of the percentages of B-, T-, and NK-cells in each gate should be 100 ± 5%.
Statistical analysis
The statistical program SPSS v12 was used to obtain the descriptive and analytical statistics. Mean, SD, SE, and range (minimum–maximum) were calculated for each parameter.
After testing the normal distribution and the homogeneity of the populations, it was found that although the sample (all subjects) follows the normal distribution, since it is a large sample (exceeds 50), the data for some of the parameters are not homogeneous. So, the ANOVA one-way test was used to test the significance in the correlation between the BMI or WHR and each parameter measured for each subject. After using the ANOVA test, the post hoc tests were used for multicomparisons. The Tukey test was used for the homogeneous parameters, while Tamhane’s T2 test was used for the non-homogeneous parameters. The resulting P-values demonstrate significance or lack thereof. The cut-off points used were: P > 0.05 is a non-significant difference (NS), P < 0.05 is a significant difference (S), and P < 0.01 is a highly significant difference (HS).
Results
Subjects, BMI and WHR categories
The 119 female subjects used in this study had an age range of 17–26 years (mean ± SD, 21.68 ± 1.895 years), and a BMI range of 13.77–55.26 kg/m2 (mean ± SD, 28.2480 ± 9.55157 kg/m2). As evident in Figure 1, the age is normally distributed since the data are scattered about the line.
Normal distribution test of the subjects’ ages.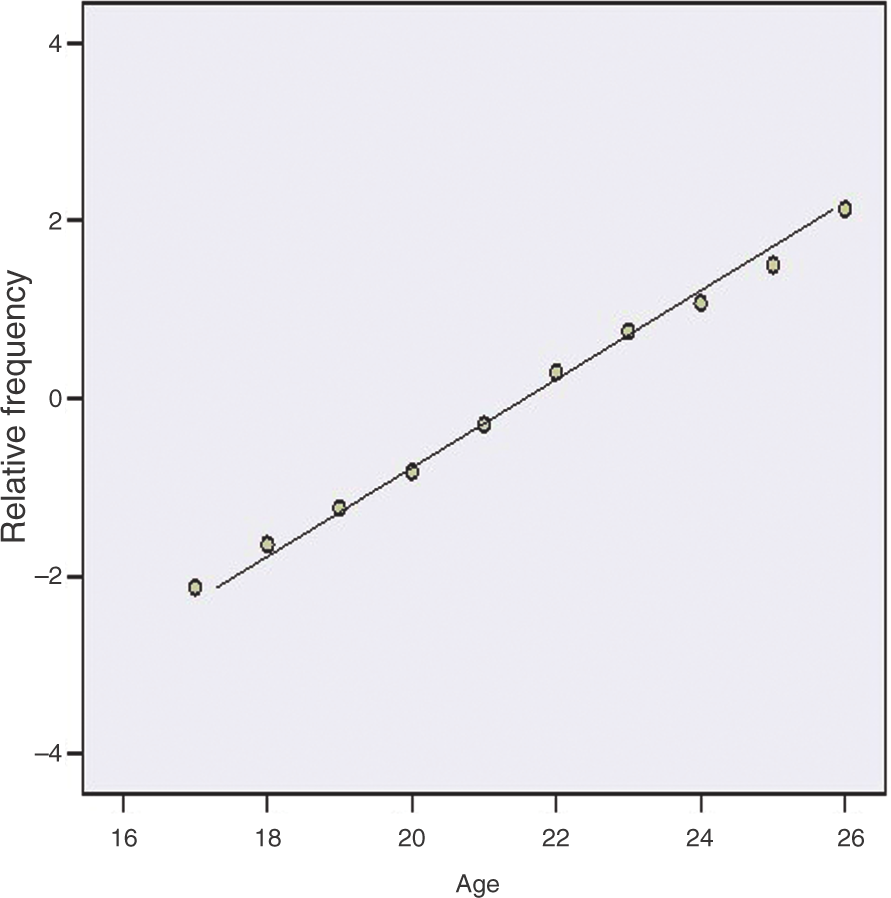
At a confidence level of 99%, it is noted that the mean of the BMI belongs to the confidence interval (26.4513, 30.0447) which means a fairly narrow range of BMI values as appears from the SD (9.55157), so the SE (0.90659) is very small. Subjects were chosen within the specific age interval 17–26 years based on the BMI strata (Fig. 2). That is, each stratum subject was randomly selected so that there are more than 20 subjects per stratum.
Box-plot of BMI strata versus age. The middle horizontal line is the mean for the respective group.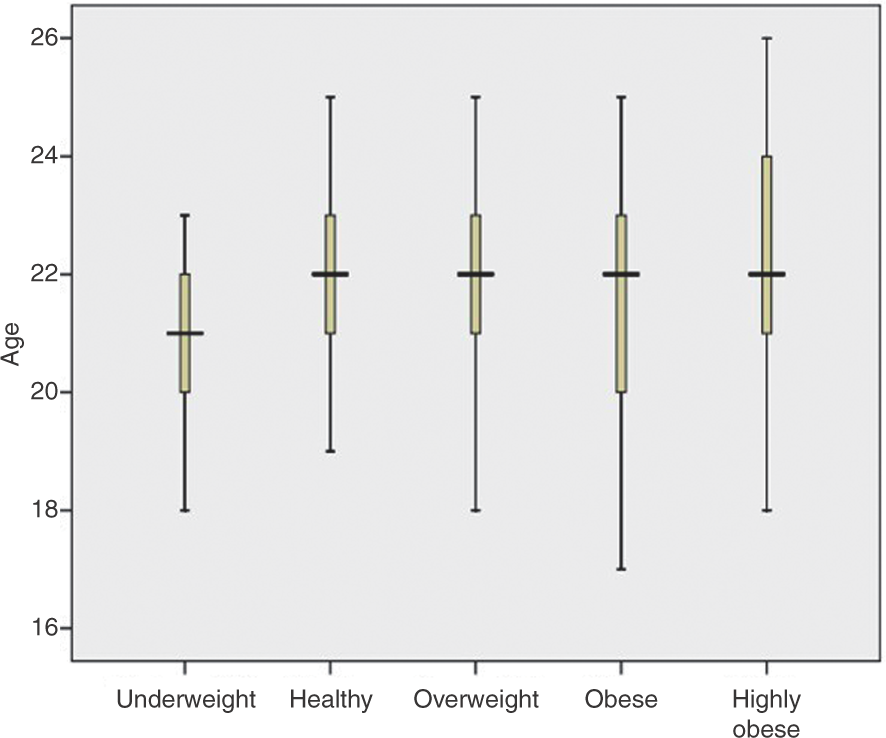
Frequency and calculated percentages of subjects in the five BMI categories
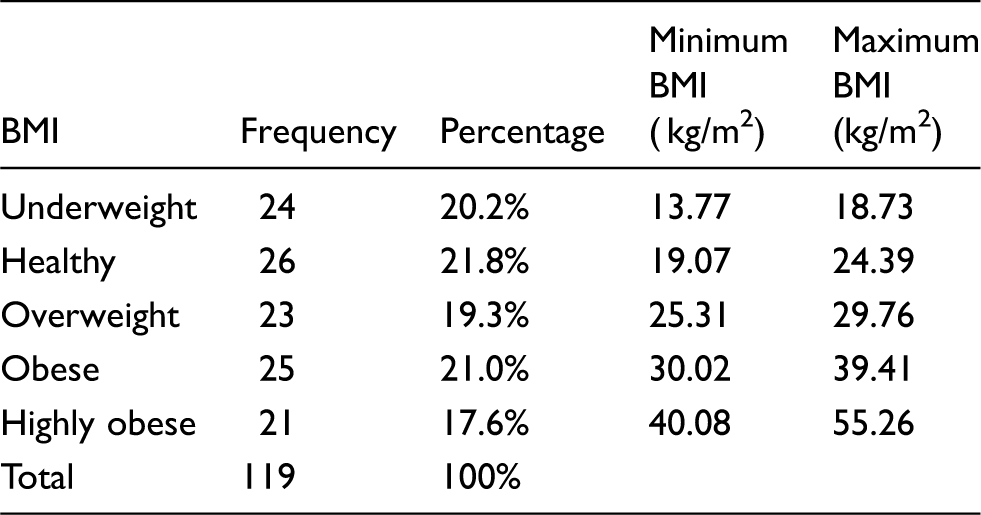
As shown in Table 1, the minimum BMI for the underweight category is 13.77 kg/m2, while the maximum (18.73 kg/m2) is nearly equal to the accepted maximum for the underweight category of 18.9 kg/m2. For healthy subjects, who are considered the control group, the range of BMI for the subjects was 19.07–24.39 kg/m2, nearly encompassing the whole range (18.9–24.9 kg/m2) specified for the healthy category. Also for the overweight subjects, the BMI range is 25.31–29.76 kg/m2, which compares well with the accepted range of 25–29.9 kg/m2. The obese subjects range from 30.02–39.41 kg/m2, compared with the accepted range of 30–40 kg/m2. Finally, the highly obese start with a BMI of 40.08 kg/m2 and reach a maximum of 55.26 kg/m2, which compares with the accepted BMI of above 40 kg/m2 for the highly obese.
Frequencies and calculated percentages of subjects in the five WHR categories
Body mass index categories and immune system cells
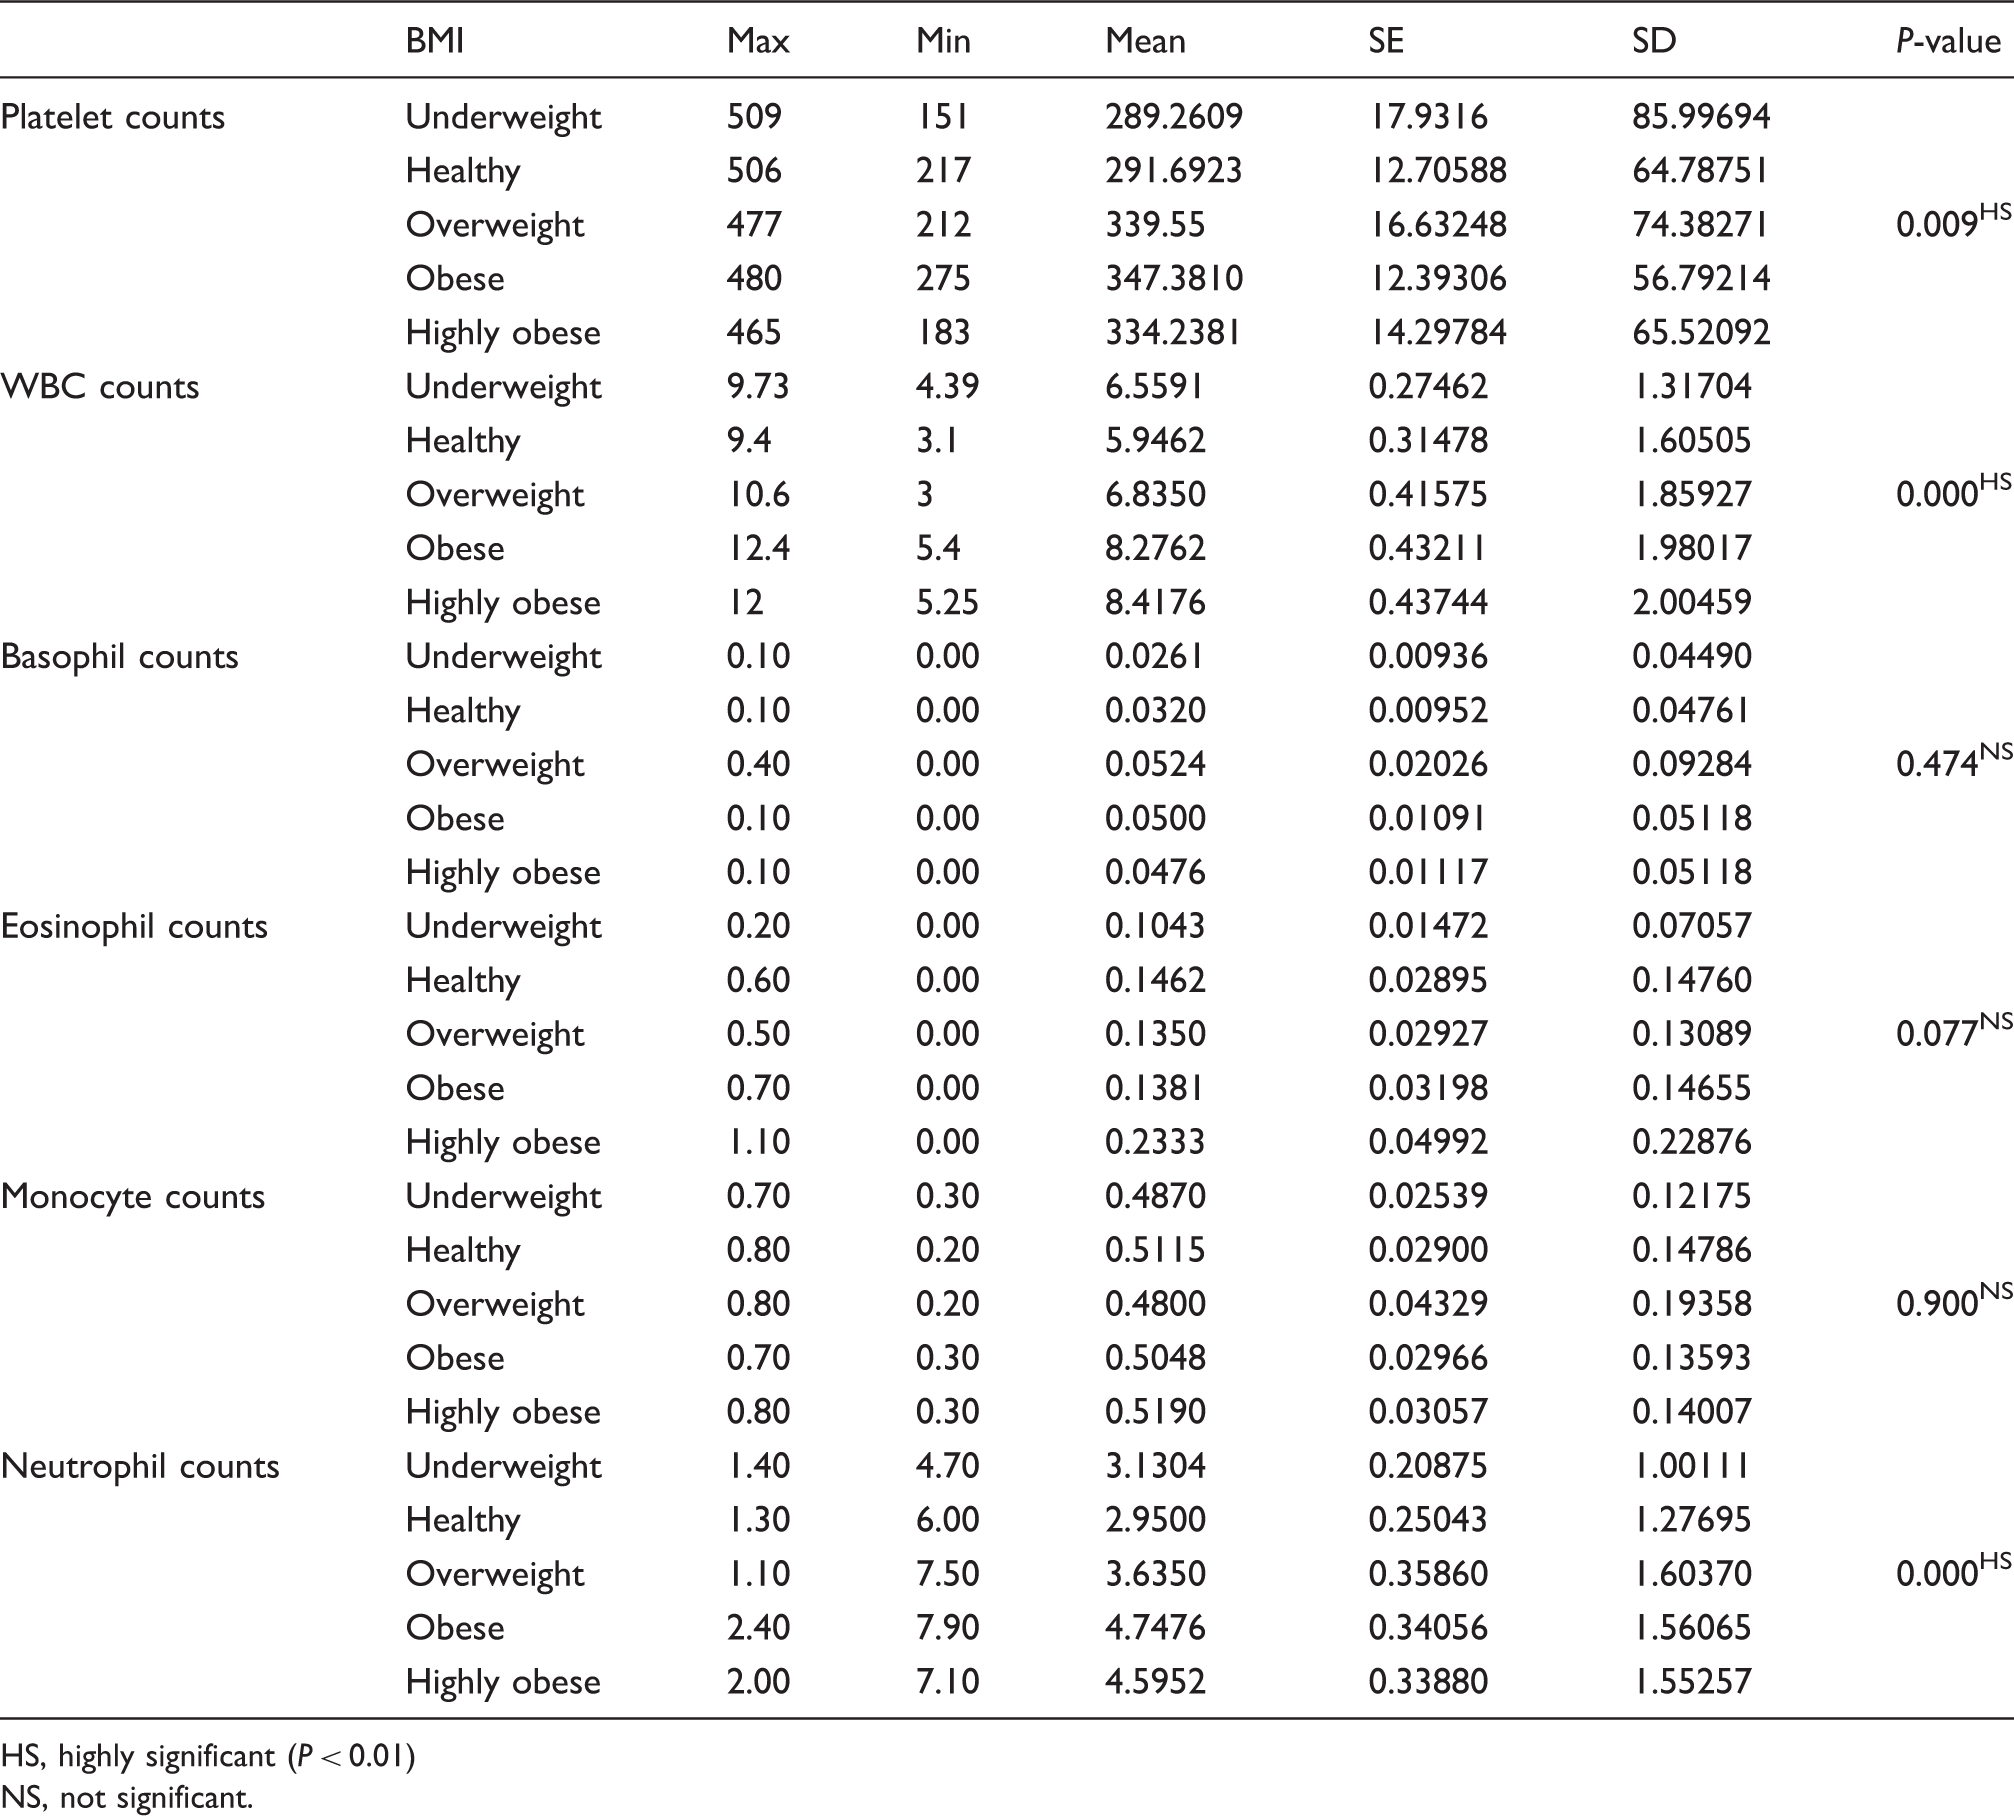
Descriptive statistics and test of significance for WBC, platelet, basophil, eosinophil, monocyte, and neutrophil cells counts for the BMI categories
HS, highly significant (P < 0.01)
NS, not significant.
Multiple comparisons between mean platelet counts for the healthy group and other groups
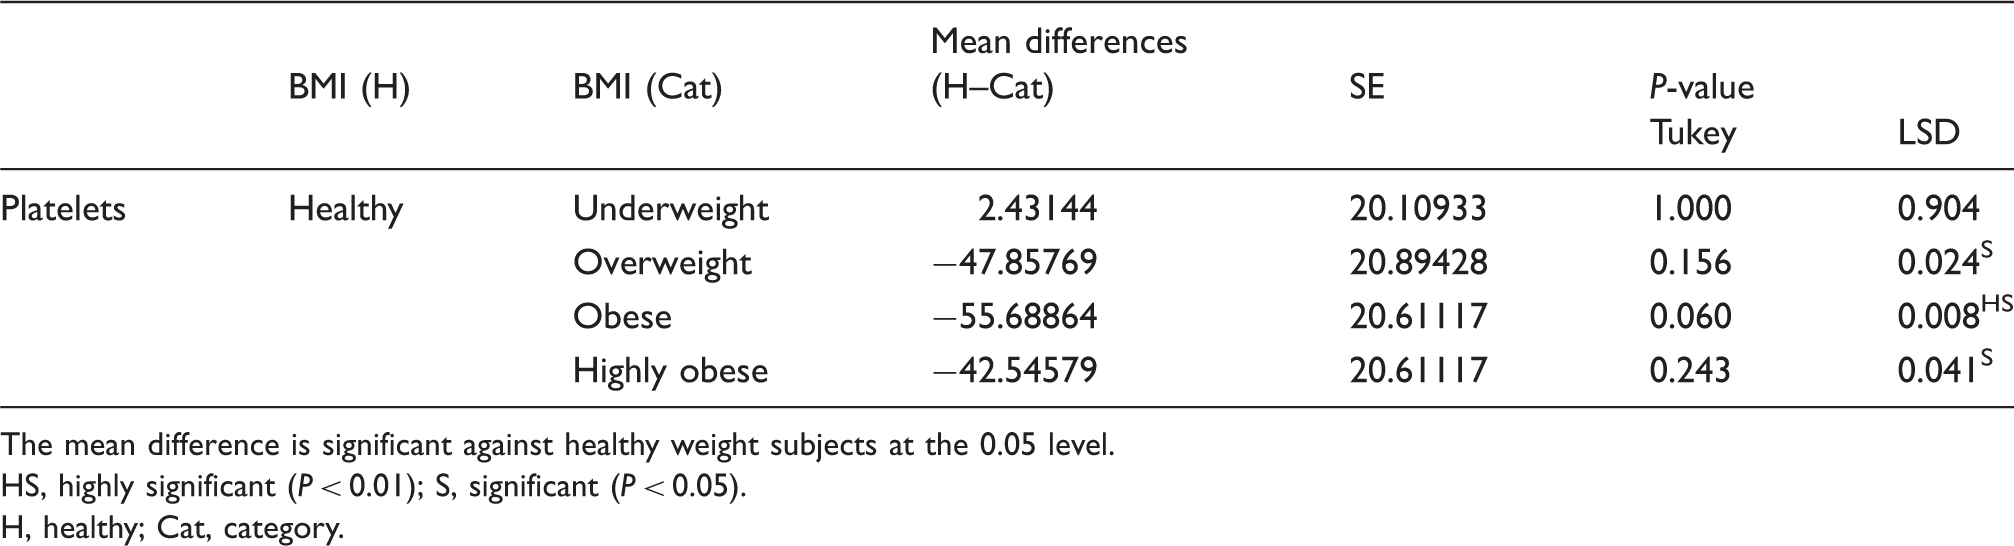
The mean difference is significant against healthy weight subjects at the 0.05 level.
HS, highly significant (P < 0.01); S, significant (P < 0.05).
H, healthy; Cat, category.
Multiple comparisons between the mean WBC and neutrophil counts for the healthy group and other groups
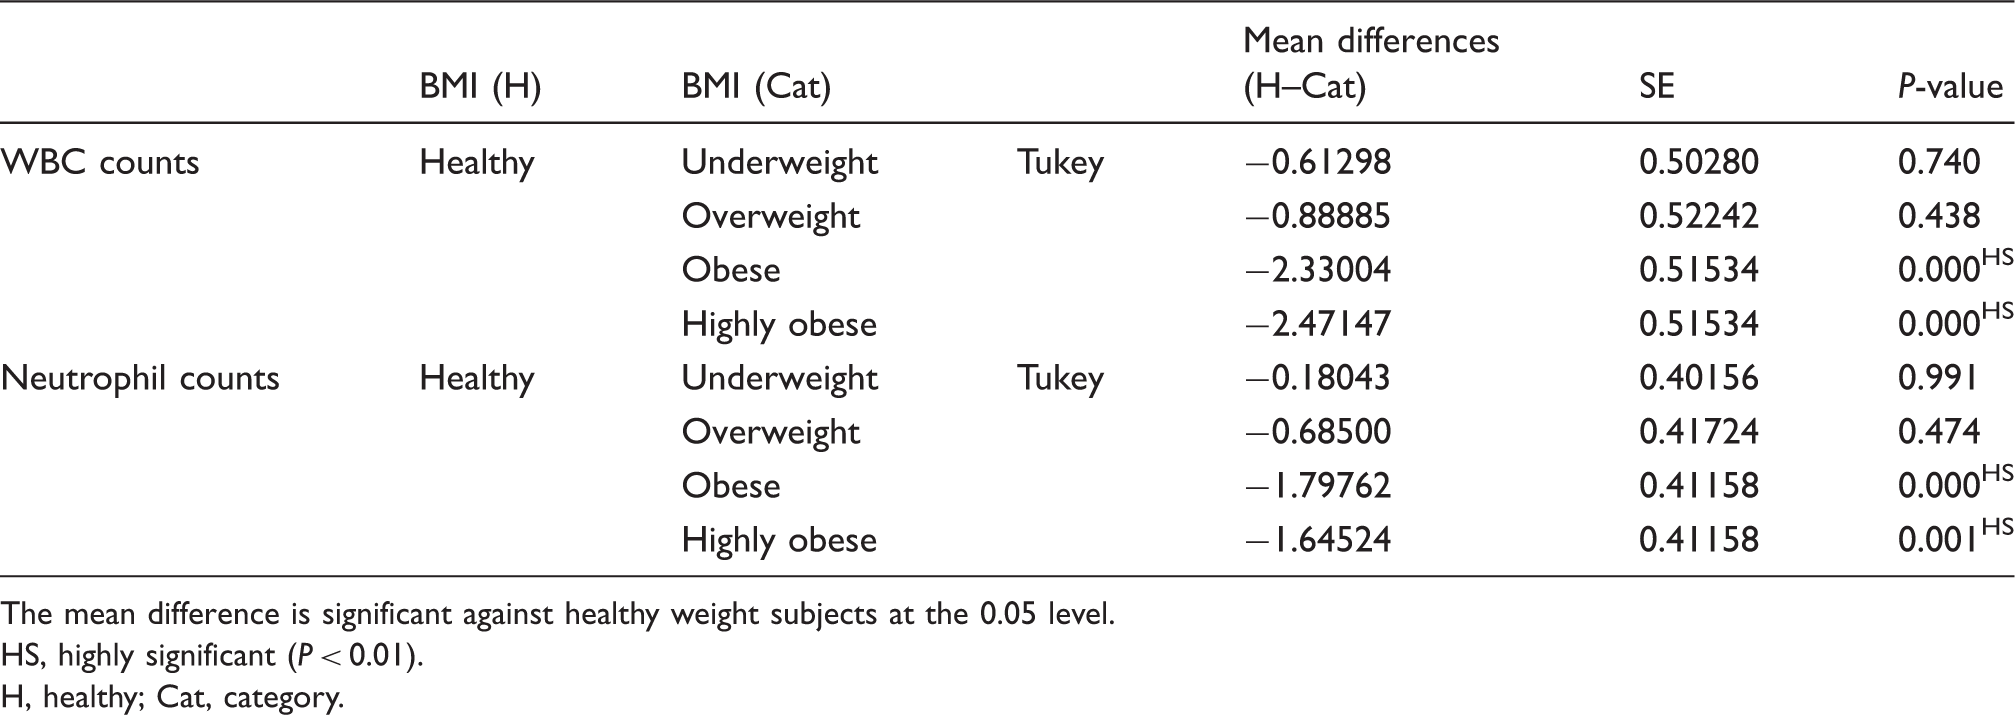
The mean difference is significant against healthy weight subjects at the 0.05 level.
HS, highly significant (P < 0.01).
H, healthy; Cat, category.
Table 3 shows that the mean values of the basophil cell counts for all groups were not significantly different from the healthy group. Thus, the ANOVA one-way test showed that there was no significant correlation between the BMI and the counts of basophils. The differences for the eosinophil and monocyte cell counts compared individually to the healthy group (Table 3) were statistically non-significant.
Finally, Table 3 shows the effect of the BMI on neutrophil cell counts. All categories give higher counts of neutrophil cells compared with the healthy group. The mean reached its maximum value in the obese group. The ANOVA one-way test showed that the correlation between BMI and neutrophil white blood cell counts were highly significant. The Tukey post hoc test was used for multiple comparisons (Table 5) and showed a highly significant increase of the neutrophil white blood cell counts in both the obese and highly obese groups compared to the healthy group.
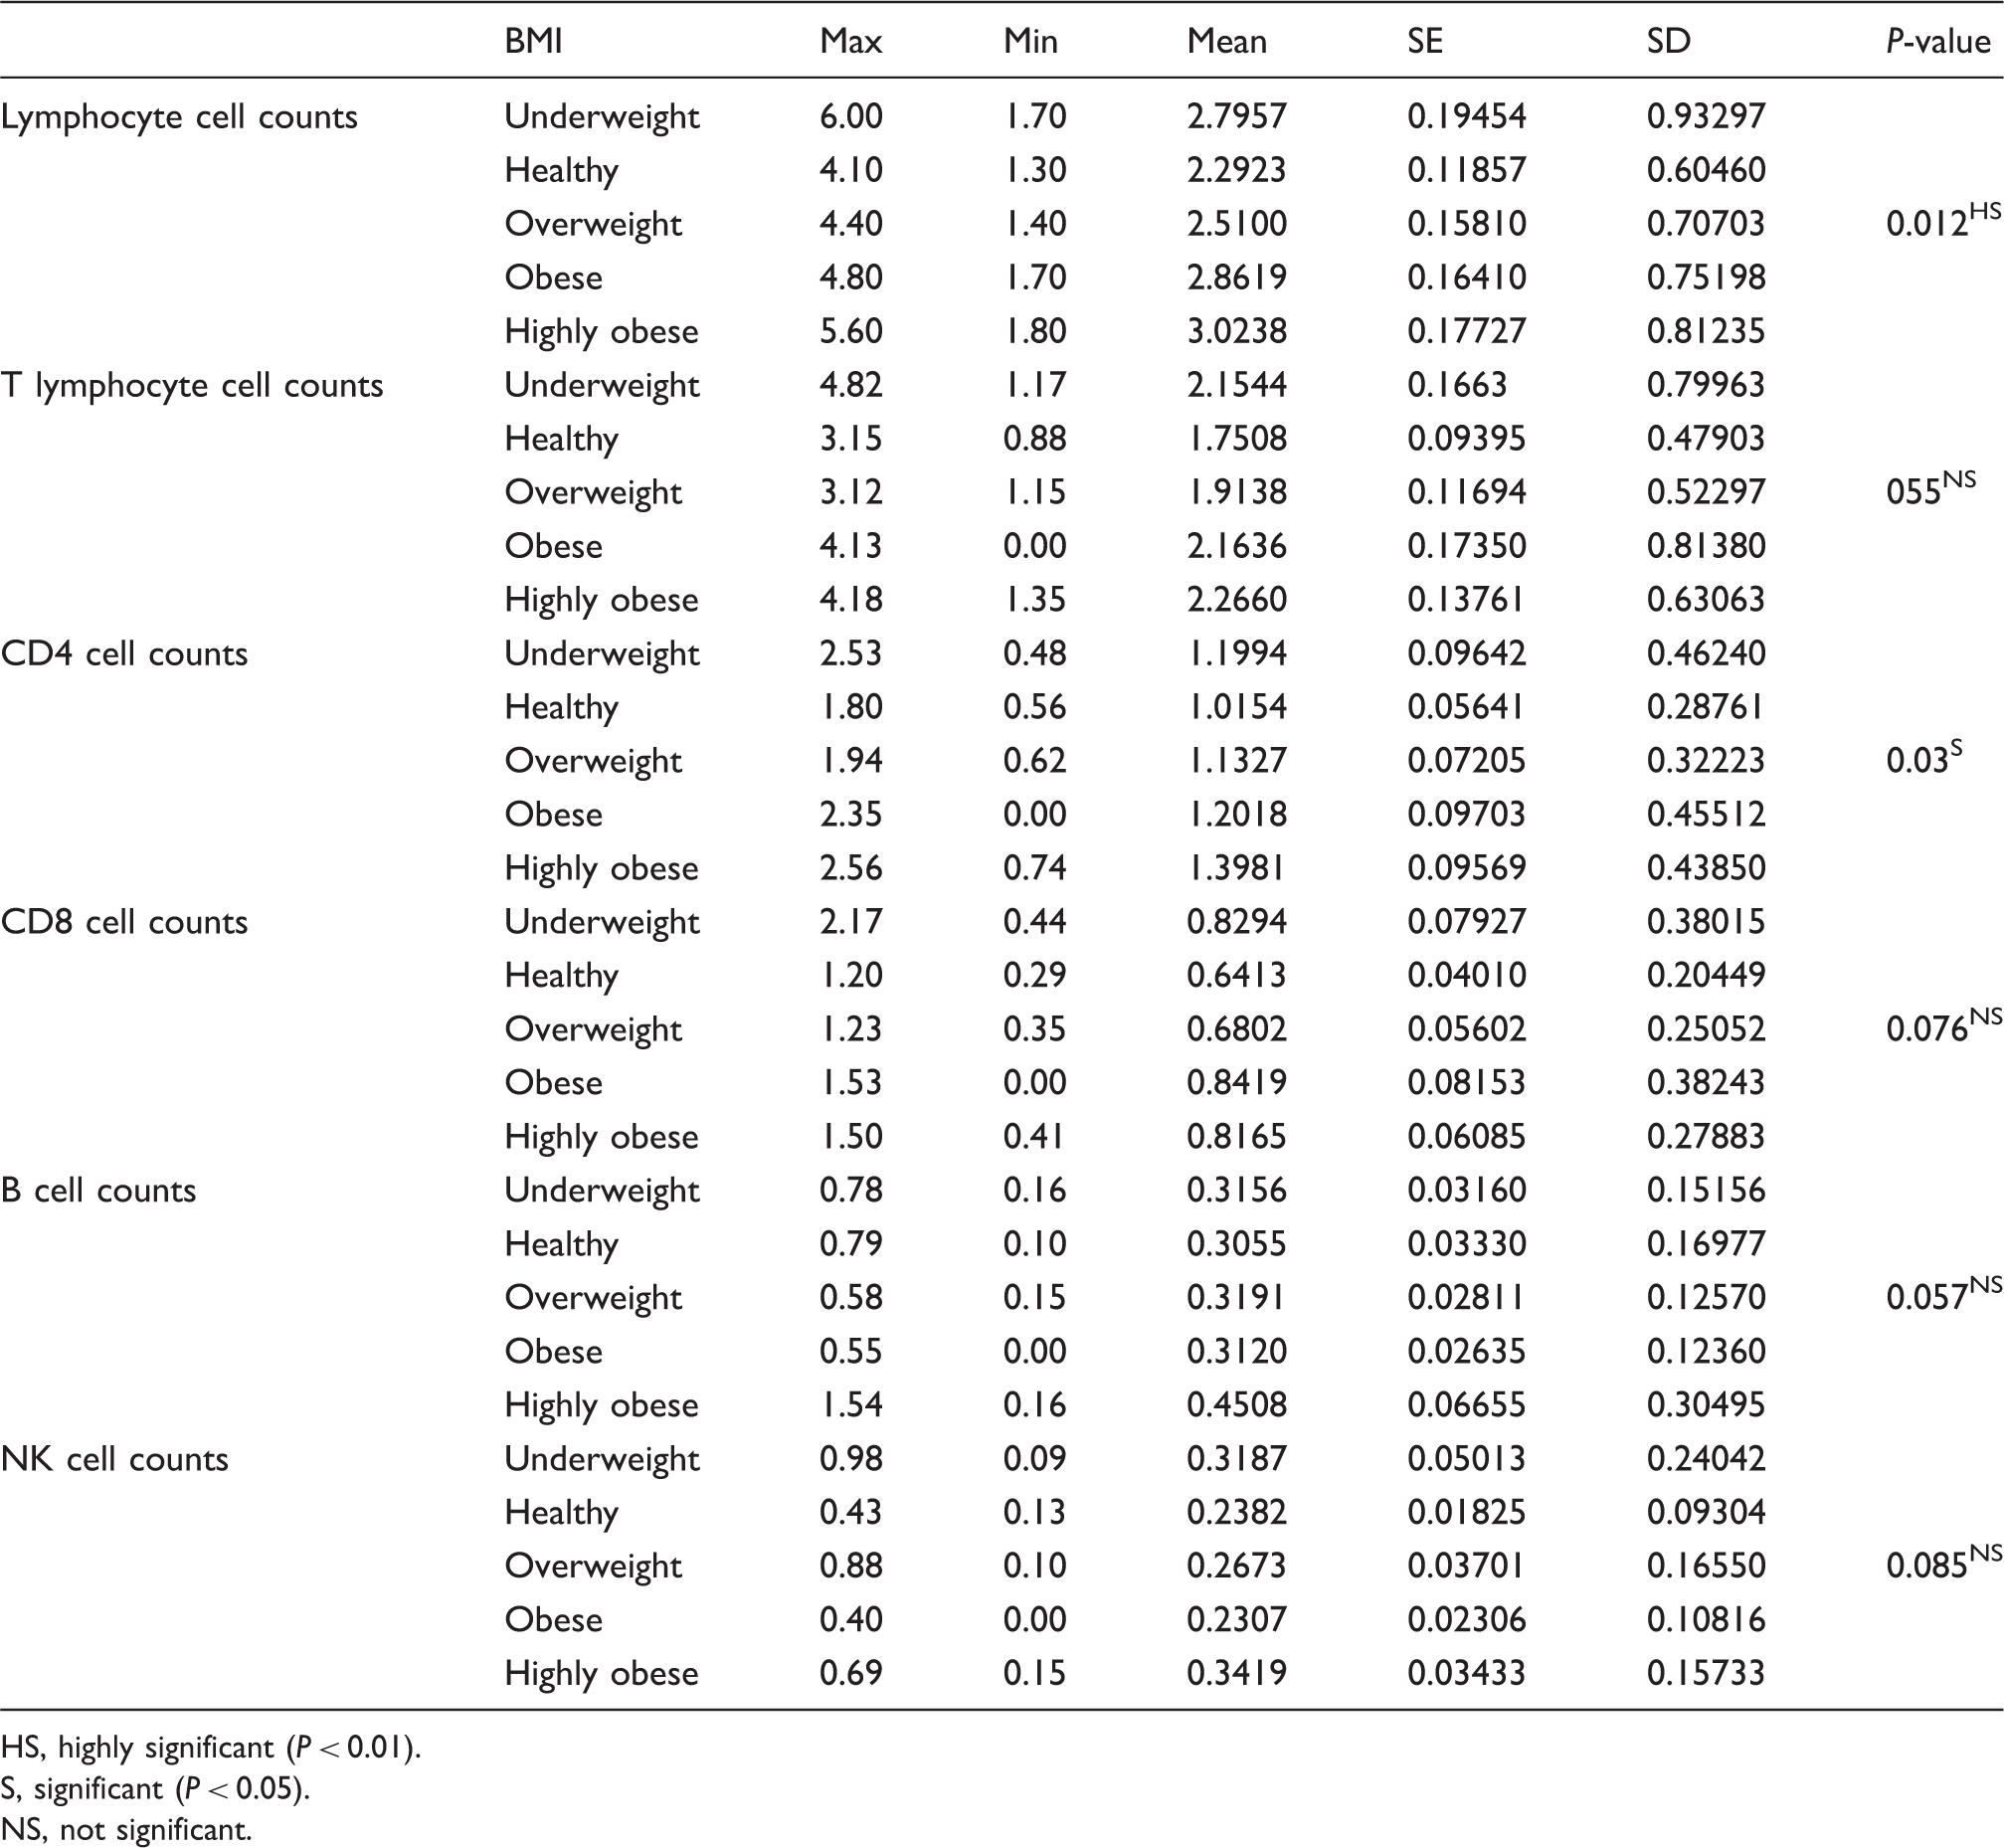
Descriptive statistics and test of significance for lymphocytes, and lymphocyte subsets cells counts for the BMI categories
HS, highly significant (P < 0.01).
S, significant (P < 0.05).
NS, not significant.
Descriptive statistics and test of significance for lymphocyte subset percentages and BMI
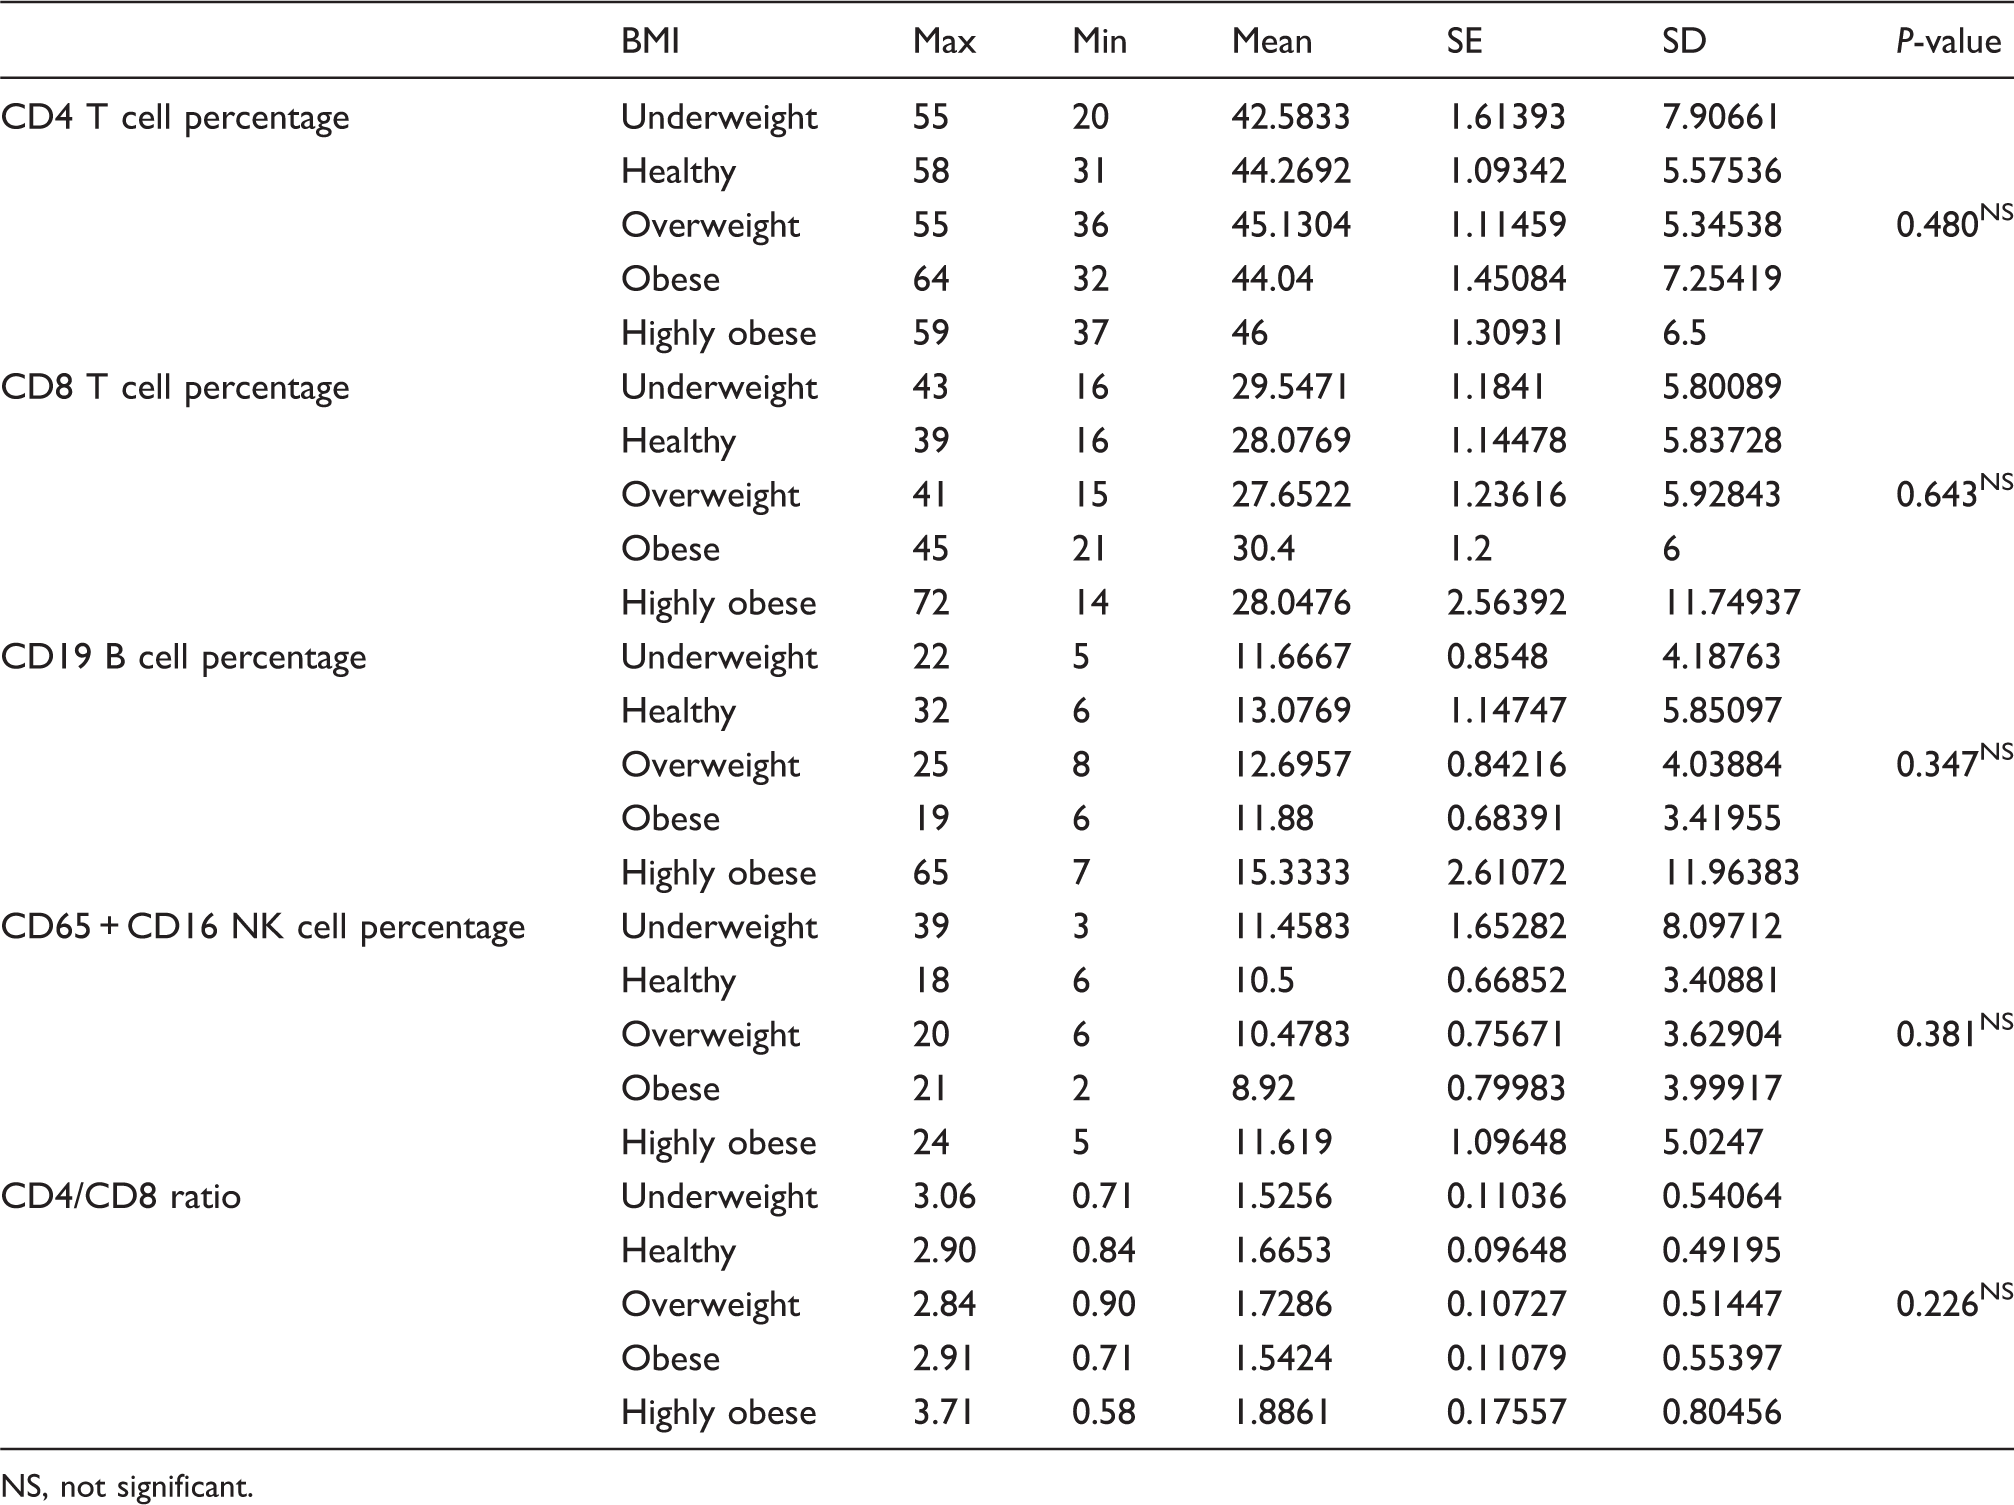
NS, not significant.
The ANOVA one-way test, which was used to test the significance of the correlation between CD4 cell counts and BMI, showed a significant relationship between the CD4 cell absolute counts and the BMI. The Tukey post hoc test showed a significant increase in the CD4 cell counts only in the highly obese group as compared to the healthy group (Table 8).
Waist-to-hip ratio categories and immune system cells
Multiple comparisons between mean lymphocyte and CD4 cells counts for the healthy group and other groups
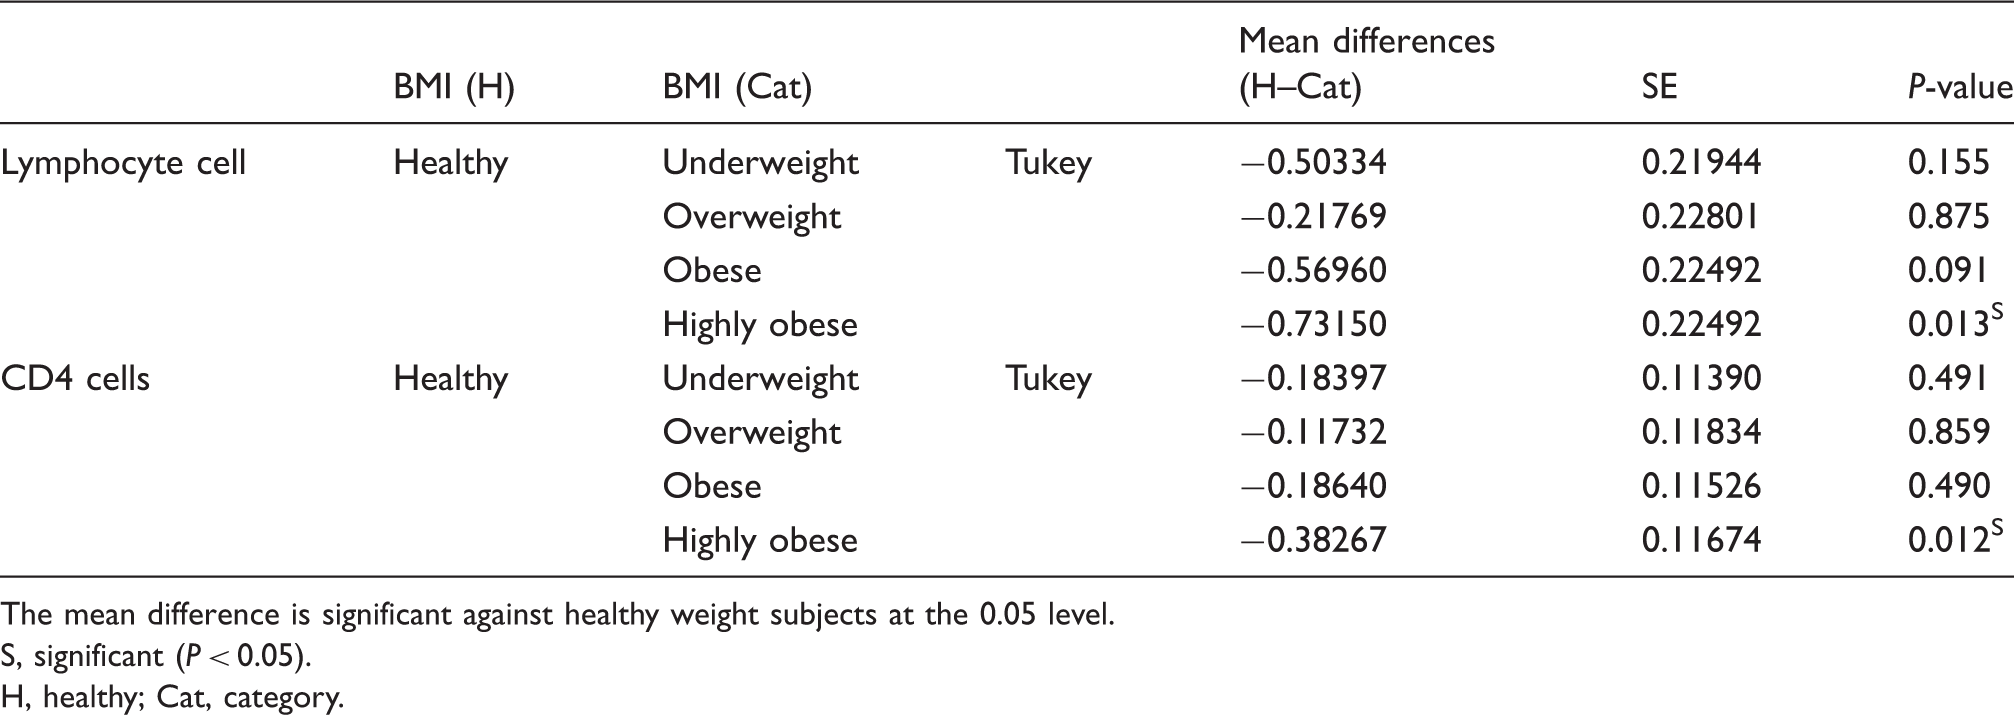
The mean difference is significant against healthy weight subjects at the 0.05 level.
S, significant (P < 0.05).
H, healthy; Cat, category.
Descriptive statistics and test of significance for WBC, platelet, basophil, eosinophil, monocytes, and neutrophil cells counts for the WHR categories
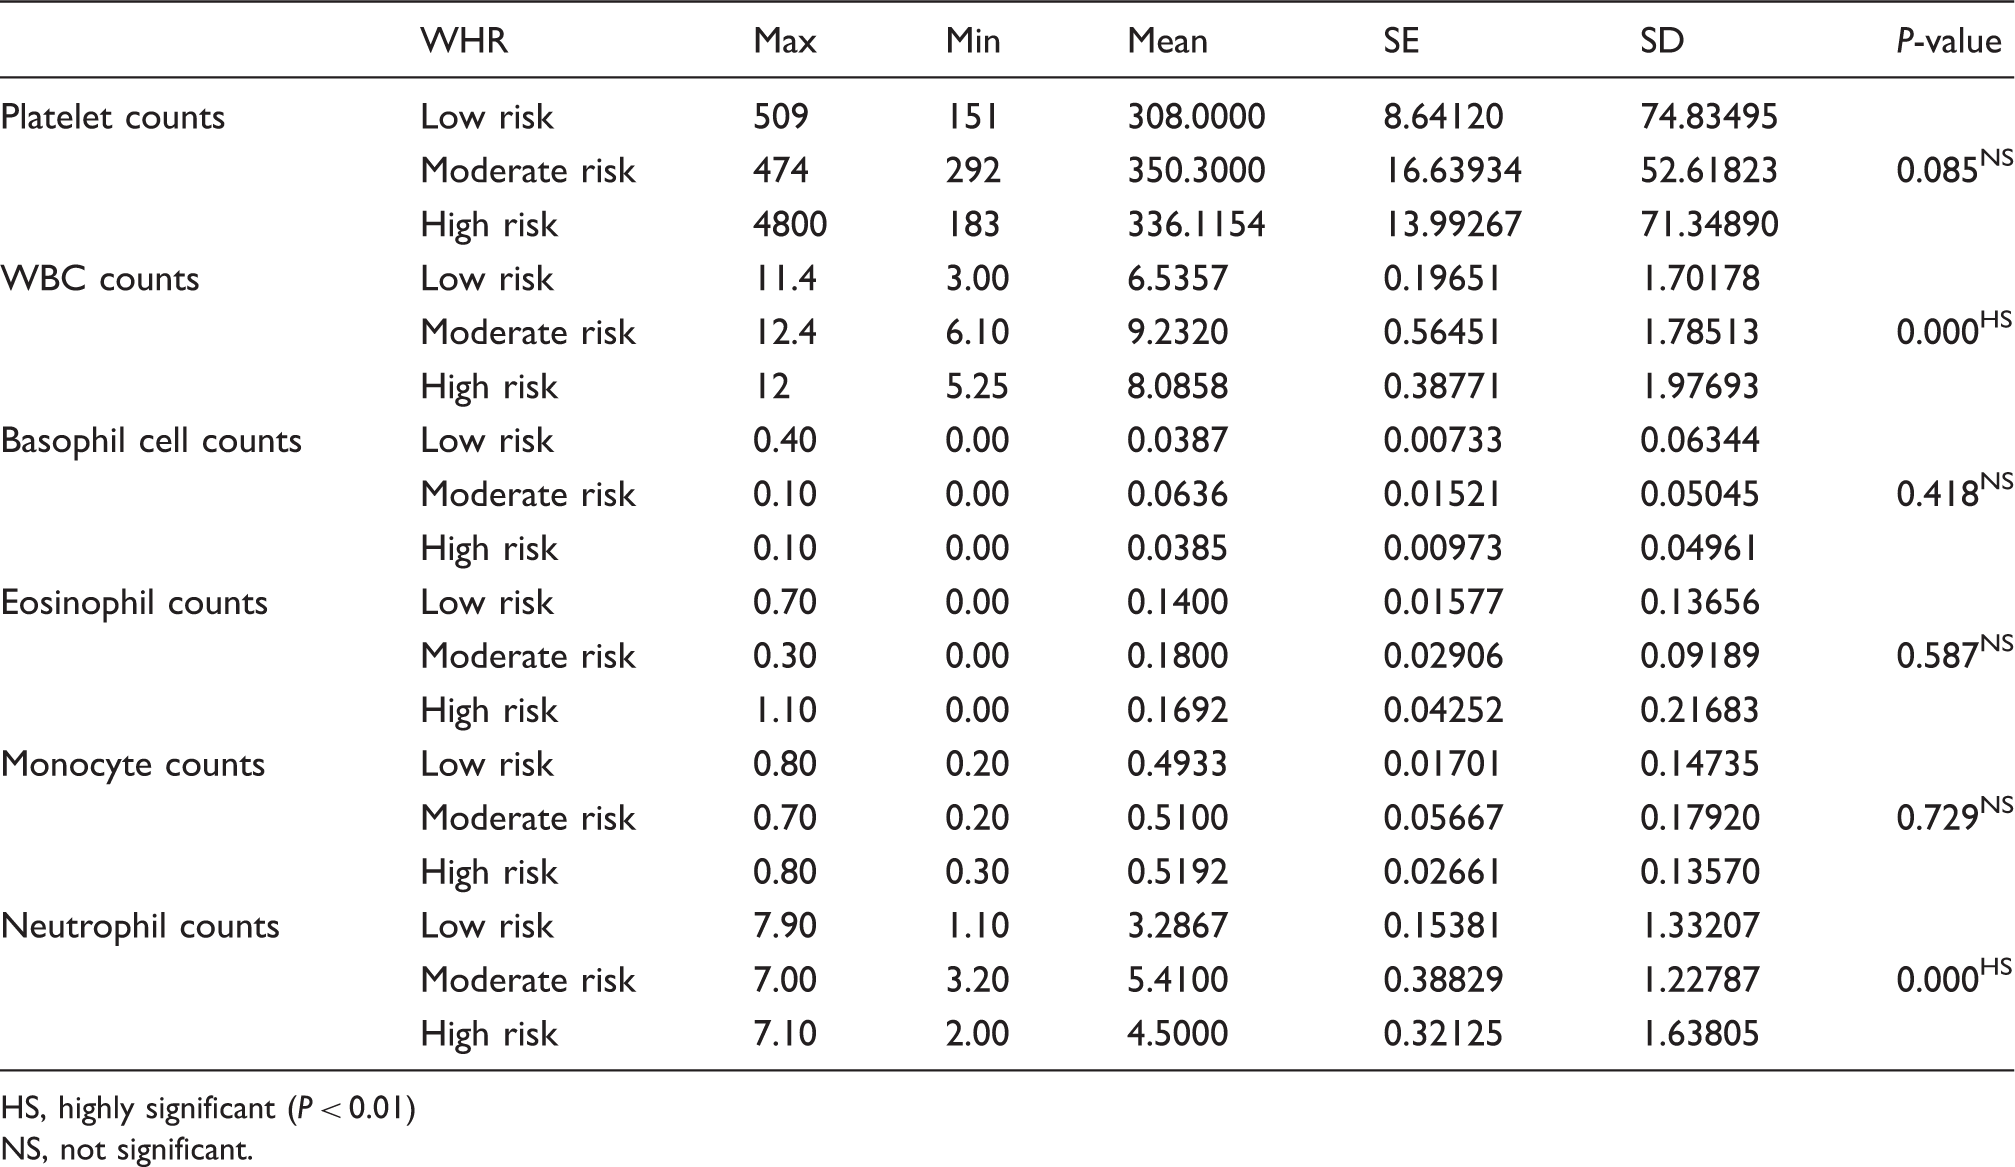
HS, highly significant (P < 0.01)
NS, not significant.
The mean values for blood neutrophil cell counts for both the moderate and high-risk groups (Table 9) showed a highly significant increase compared to the low-risk group. The highest mean neutrophil cell counts are for the moderate risk group (Table 9). The Tukey post hoc multiple comparisons test (Table 10) was used to compare the neutrophil mean values of the WHR groups; there was a highly significant difference in the results for the three risk groups.
Multiple comparisons between the low risk group and other groups for WBC and neutrophil counts
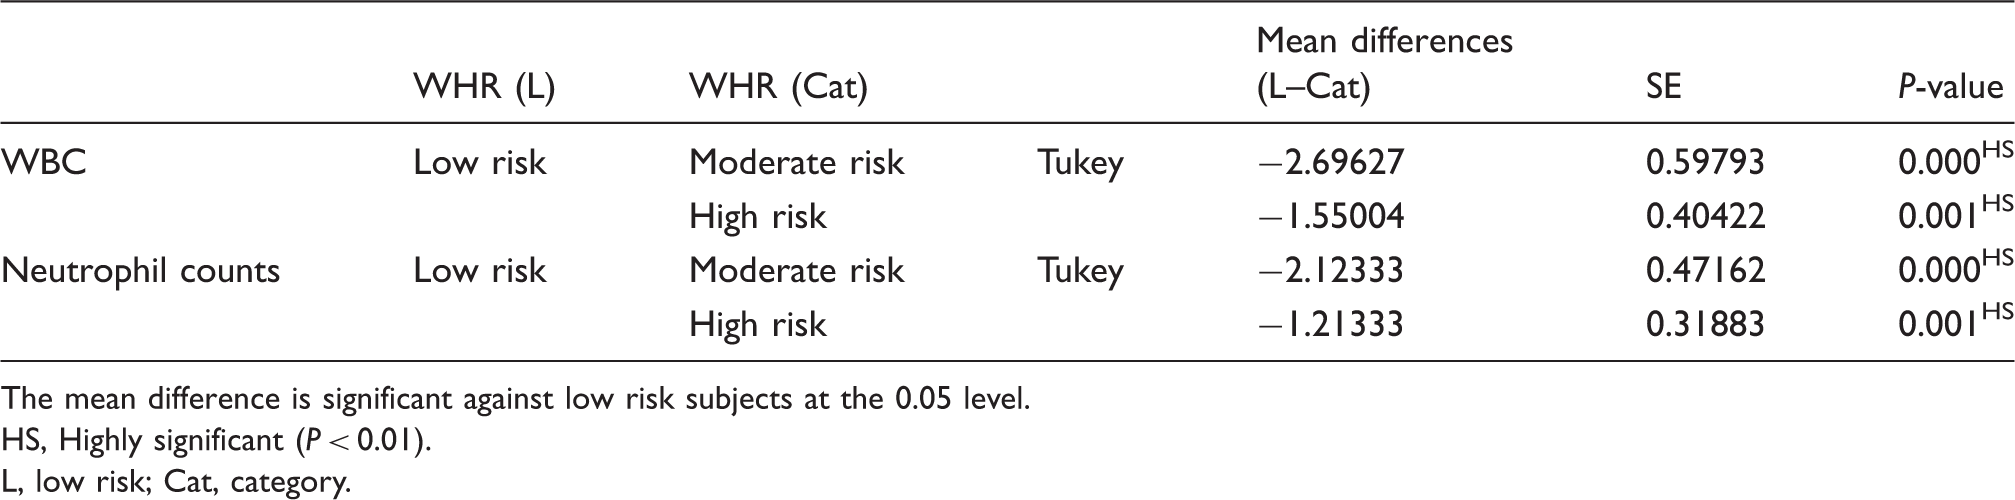
The mean difference is significant against low risk subjects at the 0.05 level.
HS, Highly significant (P < 0.01).
L, low risk; Cat, category.
Descriptive statistics and test of significance for lymphocytes, and lymphocyte subsets cell counts for the WHR categories
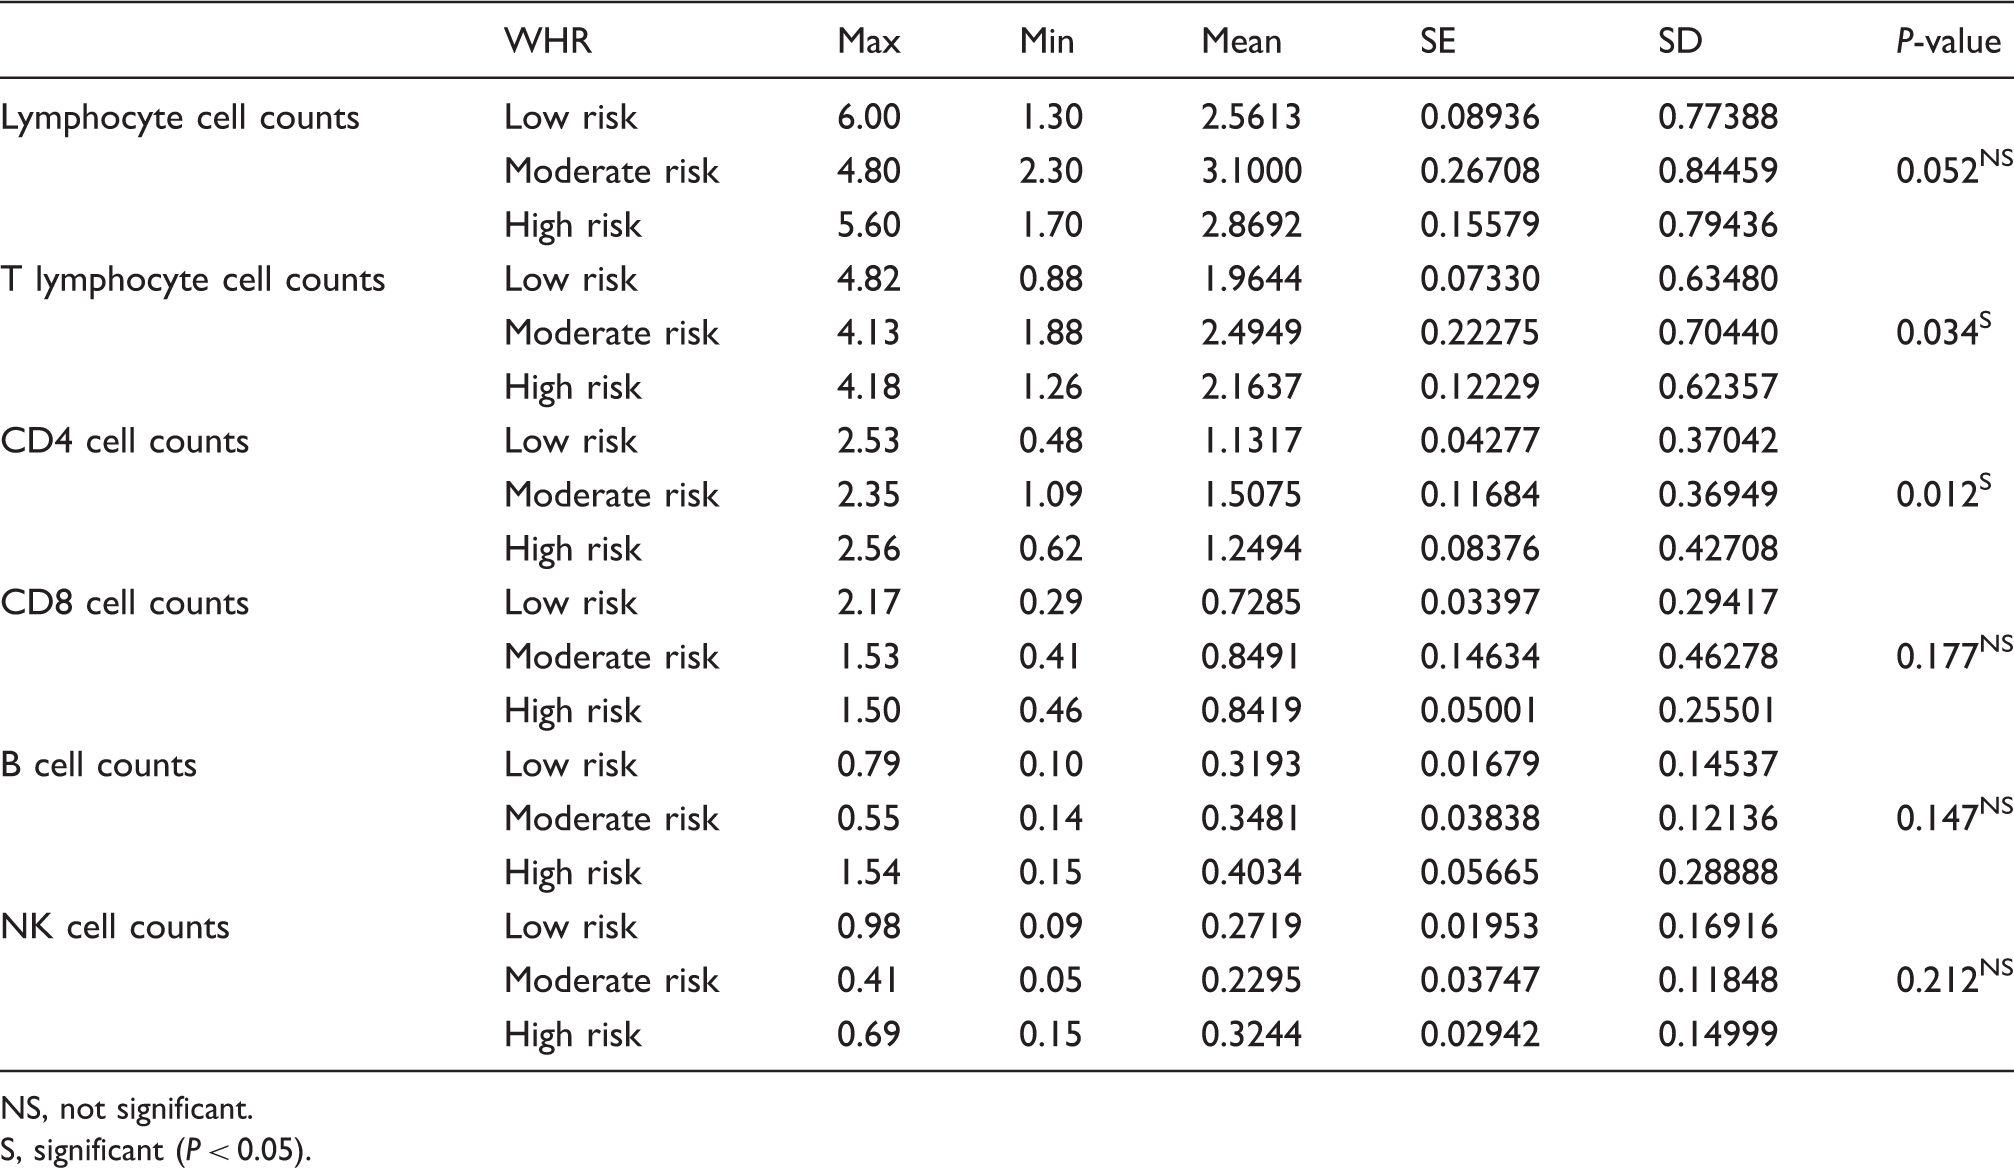
NS, not significant.
S, significant (P < 0.05).
Descriptive statistics and test of significance for lymphocyte subset cell percentages
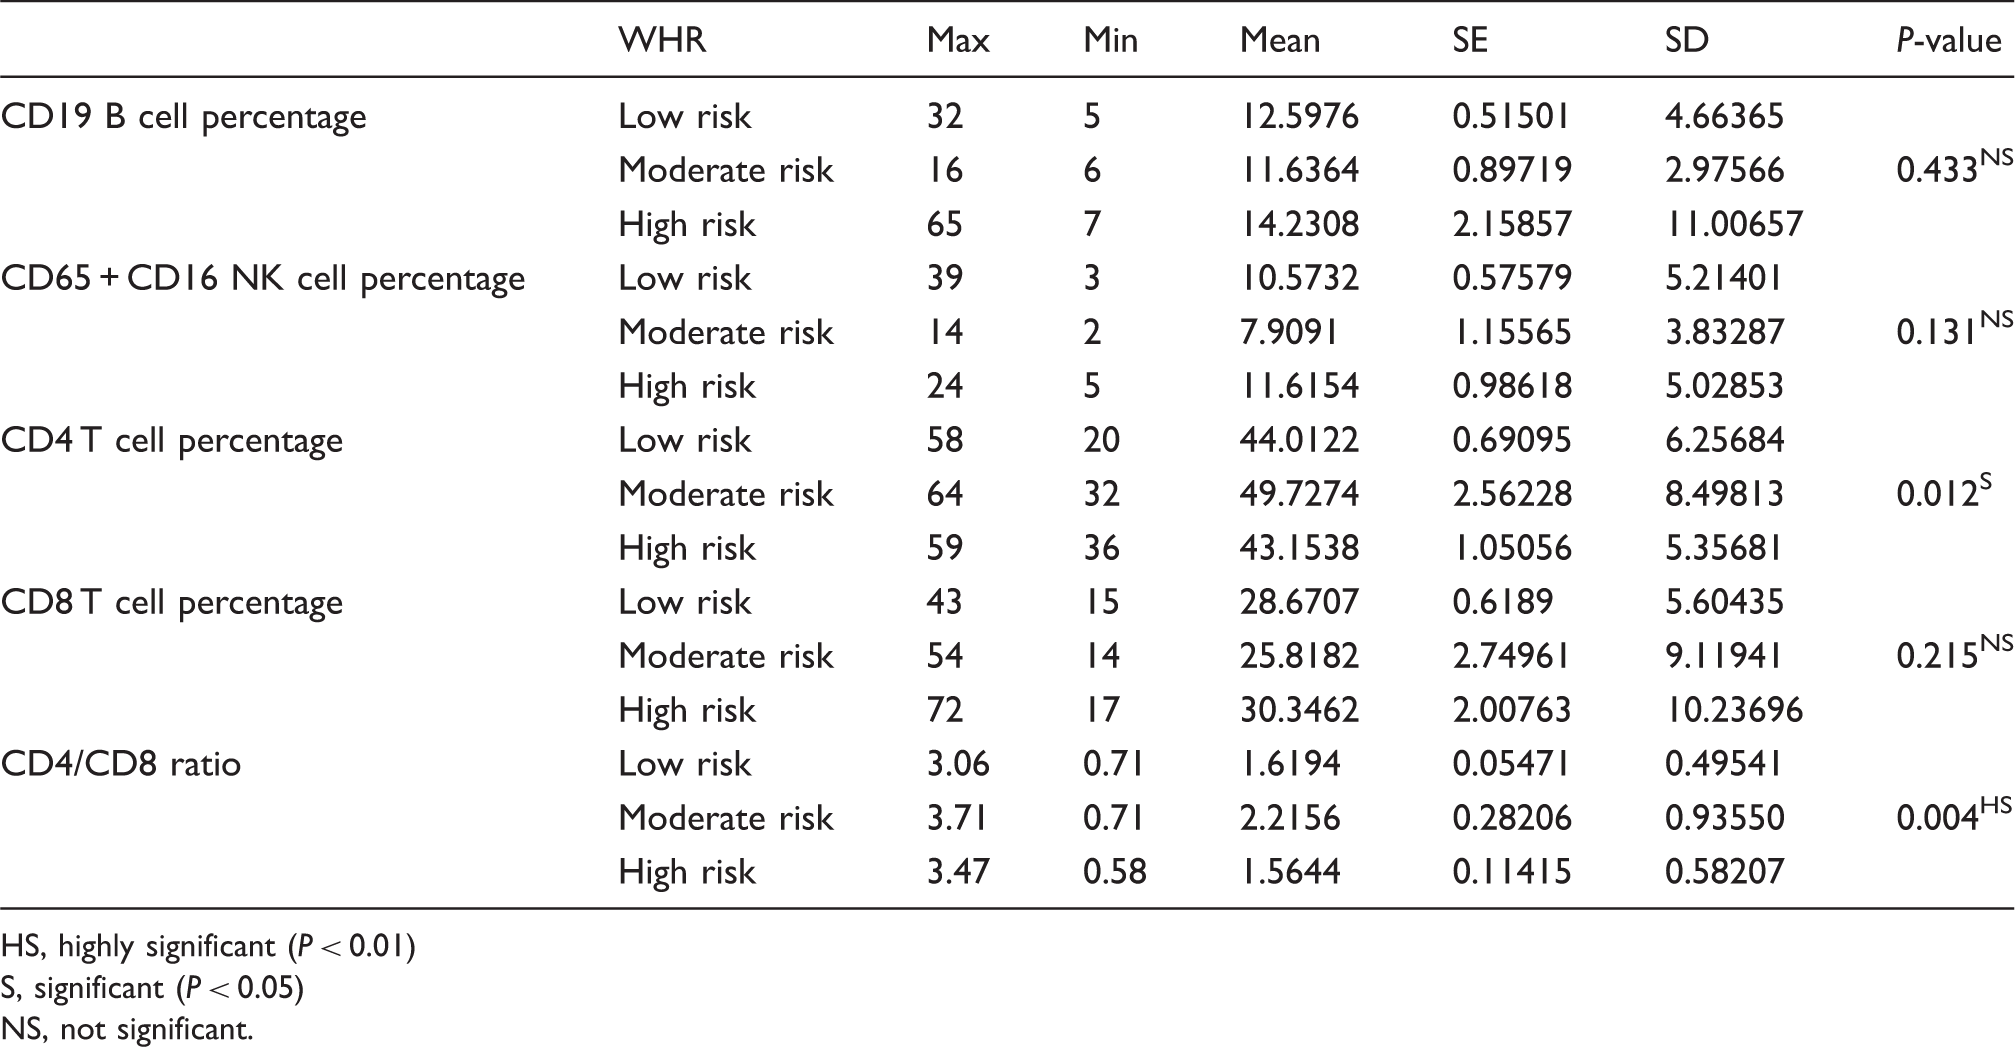
HS, highly significant (P < 0.01)
S, significant (P < 0.05)
NS, not significant.
Multiple comparisons between the low risk group and other groups for T and Th lymphocyte counts
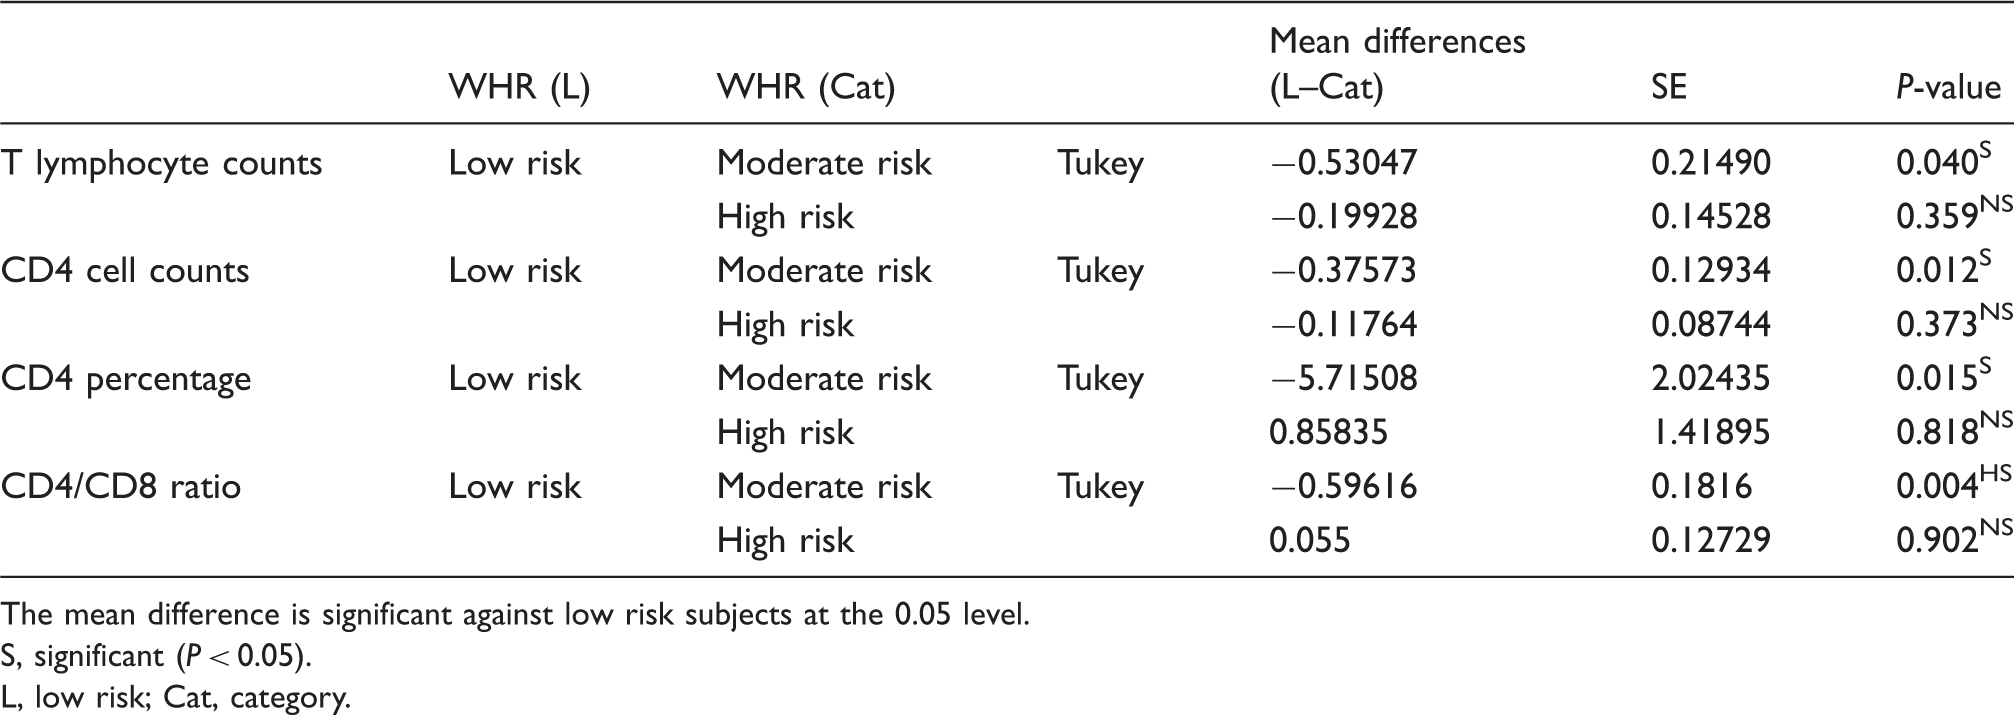
The mean difference is significant against low risk subjects at the 0.05 level.
S, significant (P < 0.05).
L, low risk; Cat, category.
The mean of CD4 cell counts in the blood (Table 11) were higher in both the moderate and high-risk groups when compared with the control group, and the ANOVA test showed that there was a significant relationship between CD4 cell counts and WHR. The Tukey post hoc test was used for the multiple comparisons between means. As shown in Table 13, the moderate risk group had significantly higher cell counts than the low-risk group, while no significant difference resulted for the high-risk group in comparison with the control.
There were no significant relationships between WHR and B-, NK-lymphocyte cells counts, nor with CD8, CD19 B, and CD56 + CD16 NK cells in blood for both risk groups compared to the control group (Tables 11 and 12).
The ANOVA one-way test showed (Table 12) that the mean values of CD4 percentages and CD4/CD8 ratios were statistically different between the WHR groups. For multiple comparisons testing, the Tukey post hoc test was used since the data for CD4 are homogeneous. The CD4/CD8 ratios data are not homogeneous, but the Tukey test was also used here, because the tests for non-homogeneous data do not show differences between groups and thus cannot explain the highly significant result of the ANOVA one-way test. The Tukey post hoc multiple comparisons test shows (Table 13) that the mean values of CD4 percentages and CD4/CD8 ratios are significantly and highly significantly higher, respectively, in the moderate group when compared with the control group.
Discussion
The role of the cells of the immune system in health maintenance and disease prevention is well-established. It was the aim of this study to determine the effects of obesity on the immune cells counts in Saudi female university students.
The findings of this study show that the platelet counts in blood increase highly significantly (P = 0.009) as the BMI increases, whereas there was no correlation between the WHR and the platelet counts. The highly significant relationship between obesity measured by BMI and the counts of the peripheral blood platelets is in agreement with Anfossi and co-workers, 11 who found an increase of the platelet counts in obese women. Darvall and co-workers 13 suggested that the increase in platelet counts results from the action of IL-6, which is produced by adipose tissue and is associated with the BMI. Therefore, the observed increase in cardiovascular disease and inflammation in the overweight, obese, and highly obese may in fact be due to the increased platelet counts shown in this study and proven by other researchers.11,13
Total white blood cell counts are highly significantly related to both the BMI (P = 0.00) and WHR (P = 0.00) categories. The total white blood cell counts are highly significantly increased in both the obese (mean ± SD, 8.2762 ± 1.98017) and highly obese (8.4176 ± 2.00459) groups compared with the healthy group (5.9462 ± 1.60505). The white blood cell counts are also higher in both the moderate (9.2320 ± 1.78513) and high (8.0858 ± 1.97693) WHR risk groups compared with the low-risk group (6.5357 ± 1.70178).
This total WBC increase goes hand in hand with the increase in the blood neutrophil cell counts, which are highly significantly related to obesity measured by the BMI (P = 0.00) and WHR (P = 0.00). For obesity assessed by BMI, the neutrophil counts in the obese (4.7476 ± 1.56065) and highly obese (4.5952 ± 1.55257) groups are above the counts in the healthy group (2.9500 ± 1.27695). For obesity measured by the WHR, the neutrophil cell counts are also higher in the moderate (5.4100 ± 1.22787) and high-risk (4.5000 ± 1.63805) groups compared with the low-risk group (3.2867 ± 1.33207). Thus, it may be concluded that neutrophil counts are directly affected by obesity by increasing their circulating counts. For the other differential white blood cells (basophils, eosinophils, and monocytes), there are no significant relationships between either one and the BMI or WHR.
The previous results are in partial agreement with other researchers, 16 who found an increase in the concentration of leukocytes, monocytes, and neutrophils in obese women, whereas in this work only leukocytes and neutrophils were found to increase in obese women in comparison with non-obese women. These results are also in agreement with another study 17 that found a positive correlation between total white blood cell counts and neutrophil counts each with BMI. This increase in WBC and neutrophils may be evidence for considering obesity as an inflammatory disease, since it is known that WBCs play a major role in inflammatory responses, 18 and that neutrophils are mobile phagocytic cells, which are generally the first cells to arrive at the site of inflammation.
It is of interest to note in the results that both total WBCs and neutrophil counts have a higher count in the moderate risk group compared to the high-risk group. These results may indicate that the increase in counts is associated with fat distribution, since in the moderate risk group fat is accumulated more in the central area of the body, whereas in the high-risk group fat is accumulated in the lower area (hips). This confirms the relationship between these cells counts and central adiposity. 17 This also confirms the widely accepted fact that central fat in women is especially dangerous and leads to cardiovascular diseases and other ailments. Also, it is important to point out that the BMI gives a very different assessment of overall obesity from the WHR, which is concerned with distribution of fat in the body. This may explain the differences in the results obtained in this study for the immune system cells.
Total blood lymphocyte cell counts are significantly associated with the BMI (P = 0.012) but not associated with the WHR. The lymphocyte cell counts are significantly higher in the highly obese (3.0238 ± 0.81235) group compared with the healthy group (2.2923 ± 0.6046).
Total blood T-cell counts are significantly associated with the WHR (P = 0.034) but not associated with the BMI. The T-cell counts are significantly higher in the moderate risk group (2.4949 ± 0.70440) than the low-risk group (1.9644 ± 0.63480). CD4-cell counts are significantly related to the BMI (P = 0.03) and the WHR (P = 0.012). For CD4 cells using the BMI, the highly obese group (1.3981 ± 0.43850) has a significantly higher count of CD4 cells compared to the healthy group (1.0154 ± 0.28761). As for the WHR categories, the moderate risk group (1.5075 ± 0.36949) has a significantly higher count compared to the low-risk group (1.1317 ± 0.37042). The CD8-, B-, and NK-cell counts do not correlate with either the BMI or WHR.
The CD4 T-cell percentages and the CD4/CD8 ratios are related to the WHR significantly (P = 0.012) and highly significantly (P = 0.004), respectively. For CD4 T-cell percentages using the WHR, the moderate risk group (49.7274 ± 8.49813) had a significantly higher percentage of CD4 T-cells compared to the low-risk group (44.0122 ± 6.25674). For the CD4/CD8 ratio, the moderate risk group (2.2156 ± 0.9355) had a highly significant higher ratio compared to the low-risk group (1.6194 ± 0.49541). Both CD4 T-cell percentages and CD4/CD8 ratios did not correlate with the BMI. The CD8 T, CD19 B, and CD65 + CD16 NK cells percentages did not correlate with either the BMI or WHR.
The previous results are partially in agreement with other studies 20 that found an increase in the lymphocyte subset counts with obesity, except for NK-cells and T-cytotoxic/suppressor cells. In this present study, a significant increase in the T and CD4 lymphocyte subset counts was obtained with increasing obesity, but not for NK-, B-, and CD8-cells. Obesity was also shown6,20 to decrease the proliferation of B- and T-cells. Another research study on females 22 agrees somewhat with the results obtained in the current study in that it found that higher CD4 and total lymphocyte counts were associated with overweight and obesity, while higher CD8 counts were associated with morbid obesity and no significant correlation existed between CD4, CD8 cell percentages, and CD4/CD8 ratios with the BMI. Some researchers 24 reject the effect of obesity alone on the lymphocyte subsets.
In animal studies, 6 obesity was found to affect cell-mediated immune response. The number of functional T-cells decreased in the obese animals which resulted in impaired immunity. These animal studies confirm the destructive effects of obesity on the immune system.
Therefore, from the above results, it may be concluded that obesity affects immunity in general, since the increase in white blood cell counts correlates highly significantly with increased BMI and WHR. It is also evident that cellular acquired immunity is enhanced by obesity, since the total lymphocyte and CD4 cell counts increase highly significantly and significantly, respectively, as obesity measured by BMI increases. Also, cellular immunity is significantly enhanced by an increase in WHR for the total lymphocytes and CD4 cells. The CD4 cell percentages and CD4/CD8 ratios also significantly increase as WHR increases. On the other hand, B-cell counts and percentages did not change with the BMI or WHR, which leads to the conclusion that humoral immunity is not affected by increasing body weight. Finally, all innate immunity cells measured in this study (basophils, eosinophils, monocyts, and NK cells) did not show any correlation with the BMI or WHR. Neutrophils are the only innate immunity cell to show a highly significant increase with the increase of the BMI and WHR and, as mentioned earlier, these cells are important in inflammatory responses, which are evident in the obese. Therefore, it may be concluded that innate immunity is not appreciably affected by overweight and obesity. Also, the significant increases in the platelets and WBC counts in the obese BMI group confirm the roles of these molecules in inflammation and agree with the consideration that obesity is an inflammatory condition.
It is evident from the previous discussion that obesity that is not associated with diseases, such as diabetes, arthritis, and cardiovascular diseases, may still remarkably affect cells of the immune system as shown in the study sample. In addition, even the young age of the subjects does not prevent the adverse effects of obesity on immunity, hence the risk of having serious health complications is remarkably higher in obese subjects, of any age, than the healthy weight ones.
It is recommended that larger studies be done on both females and males and at different age groups to determine whether there are gender-dependent variations in the immune responses to overweight and obesity. Additionally, future studies should also measure the activity of immune system cells in addition to cell counts, thus leading to a better understanding of the affects of weight on the functioning of the immune system, since the increase in cell numbers does not mean a higher associated activity.
Footnotes
Acknowledgements
The authors thank Mr Ahmad M. Alkassar for his help with flow cytometry, Mr Abdulaziz Abdulbaqi for help in the hematology work, and Ms Alaweyah H. Basleab for her efforts.
Funding
This study was partially funded by King Abdulaziz City of Science and Technology (reference number: GSP-17-137).