
Abstract
Lipopolysaccharides (LPSs) from Gram-negative bacteria are strong elicitors of the human immune systems. There is strong evidence that aggregates and not monomers of LPS play a decisive role at least in the initial stages of cell activation of immune cells such as mononuclear cells. In previous reports, it was shown that the biologically most active part of enterobacterial LPS, hexa-acyl bisphosphorylated lipid A, adopts a particular supramolecular conformation, a cubic aggregate structure. However, little is known about the size and morphology of these aggregates, regarding the fact that LPS may have strong variations in the length of the saccharide chains (various rough mutant and smooth-form LPS). Thus, in the present paper, several techniques for the determination of details of the aggregate morphology such as freeze-fracture and cryo-electron microscopy, analytical ultracentrifugation, laser backscattering analysis, and small-angle X-ray scattering were applied for various endotoxin (lipid A and different LPS) preparations. The data show a variety of different morphologies not only for different endotoxins but also when comparing different applied techniques. The data are interpreted with respect to the suitability of the single techniques, in particular on the basis of available literature data.
Keywords
Introduction
Bacterial lipopolysaccharides (LPSs) are the major lipid components of the outer membrane of Gram-negative bacteria. They are anchored in the outer membrane by their hydrophobic lipid A moiety. When released into the environment, LPS are highly active in mammals, and are thus called endotoxins. The biological activities may be beneficial at low LPS concentrations, but pathophysiological at higher concentrations, due to excessive cytokine production by cells of the immune system. 1 This may lead to septic shock for which still no successful anti-endotoxin therapies are available. Lipopolysaccharide consists of a sugar portion with varying lengths of oligo- or polysaccharide chains depending on the type of bacterial mutant, i.e., rough mutant lipopolysaccharides Re to Ra or smooth-form LPS. The polysaccharide component is covalently linked to the hydrophobic anchor of LPS, lipid A. 2 The latter is called the ‘endotoxic principle’ of LPS; however, the bioactivity of isolated lipid A is by one to two orders of magnitude lower than that of parent LPS. 3 Interestingly, the various rough mutant as well as the smooth-form LPS for example from Salmonella enterica sv. Minnesota in most test systems exhibit high biological activity, except for some modulations due to different acyl chain fluidity, 4 for which the identical lipid A moiety is made responsible.
There is a long-lasting controversy, 5 – 7 whether LPS monomers or aggregates are the biologically active units. It has been shown, however, that, at least for the initial steps of cell activation, the aggregates are the decisive units. 8 Therefore, for an understanding of cell activation, the exact description of the aggregates, essentially the type of aggregate structure and the size distribution, is of uttermost importance. Lipopolysaccharides and lipid A are amphiphilic molecules and form – above a critical concentration (critical micellar concentration, CMC) – aggregates in aqueous environments, depending on their hydrophobicity and, very importantly, on the conformation (shape) of the contributing molecules, which is again determined by their primary chemical structure and is influenced by ambient conditions like temperature, pH, water content, and concentration of mono- and divalent cations. 9 In previous reports using small-angle X-ray scattering (SAXS), it has been shown that the hexa- or hepta-acylated lipid A part of biologically active LPS assumes under near physiological conditions cubic inverted structures, whereas the penta- or tetra-acylated lipid A part of inactive LPS forms multilamellar aggregate structures. 10 Regarding the morphology of these aggregates, there is little information available, beside the older reports of Shands 11 the data of Risco and co-workers, 12 both investigating smooth-form LPS exhibiting long fibrillae-like structures. It has to be considered, however, that LPS S-form is a complex heterogeneous mixture of compounds with different sugar chain lengths and acylation patterns. 13 Within this mixture, the biologically active unit corresponds to a rough mutant Rb- or Ra-LPS chemotype. Therefore, we have analysed free lipid A and different mutant LPS from S. enterica sv. Minnesota with low chemical heterogeneity ranging from Re- over Rc- to Rb- and Ra-LPS with increasing lengths of the saccharide chains, but constant lipid A moiety 14 applying a variety of different techniques, i.e. freeze-fracture electron microscopy, laser light scattering, analytical ultracentrifugation, and small-angle X-ray scattering, and have discussed our results in relation to data found in the literature. Our and the literature data are indicative of an extremely complex morphology and size distribution of endotoxic preparations not only dependent on the chemical structure of the LPS samples but also on concentration, ambient conditions, and the applied techniques.
Materials and methods
Lipopolysaccharides
Lipopolysaccharides from S. enterica sv. Minnesota rough mutants Re, Rd2, Rc, Rb and Ra (S. enterica sv. Minnesota R595, R4, R5, R345 and R60, respectively) were extracted by the phenol/chloroform/light petroleum method,
15
smooth-form LPS from S. enterica sv. Abortus equi by the hot phenol/water procedure
16
from bacteria grown at 37°C, and were purified and lyophilized. Free lipid A was isolated by acetate buffer treatment of LPS Re. After isolation, the resulting free lipid A was purified and converted to its triethylamine salt. Results of all the standard assays performed on the purified LPS and lipid A (analysis of the amount of glucosamine, total and organic phosphate, and the distribution of the fatty acid residues), using chemical methods and mass spectrometry were in good agreement with the chemical composition known for the rough mutant LPS. The chemical structures of the different mutant LPS are presented in Figure 1.
Chemical structures of lipopolysaccharides from various rough mutant strains from S. enterica sv. Minnesota. In the case of wild-type LPS (smooth form), an additional O-antigen is present with a varying length of the polysaccharide chain. It must be noted that the complete S-form LPS usually has an underacylated (tri- or tetra-acyl) lipid A, and the bioactive fraction within S-LPS is a Ra- or Rb-LPS.
13
Abbreviations: Kdo, 3-deoxy-D-manno-oct-2-ulosonic acid; Hep, heptose; Gal, galactose; Glc, glucose; GlcNAc, N-acetyl-glucosamine.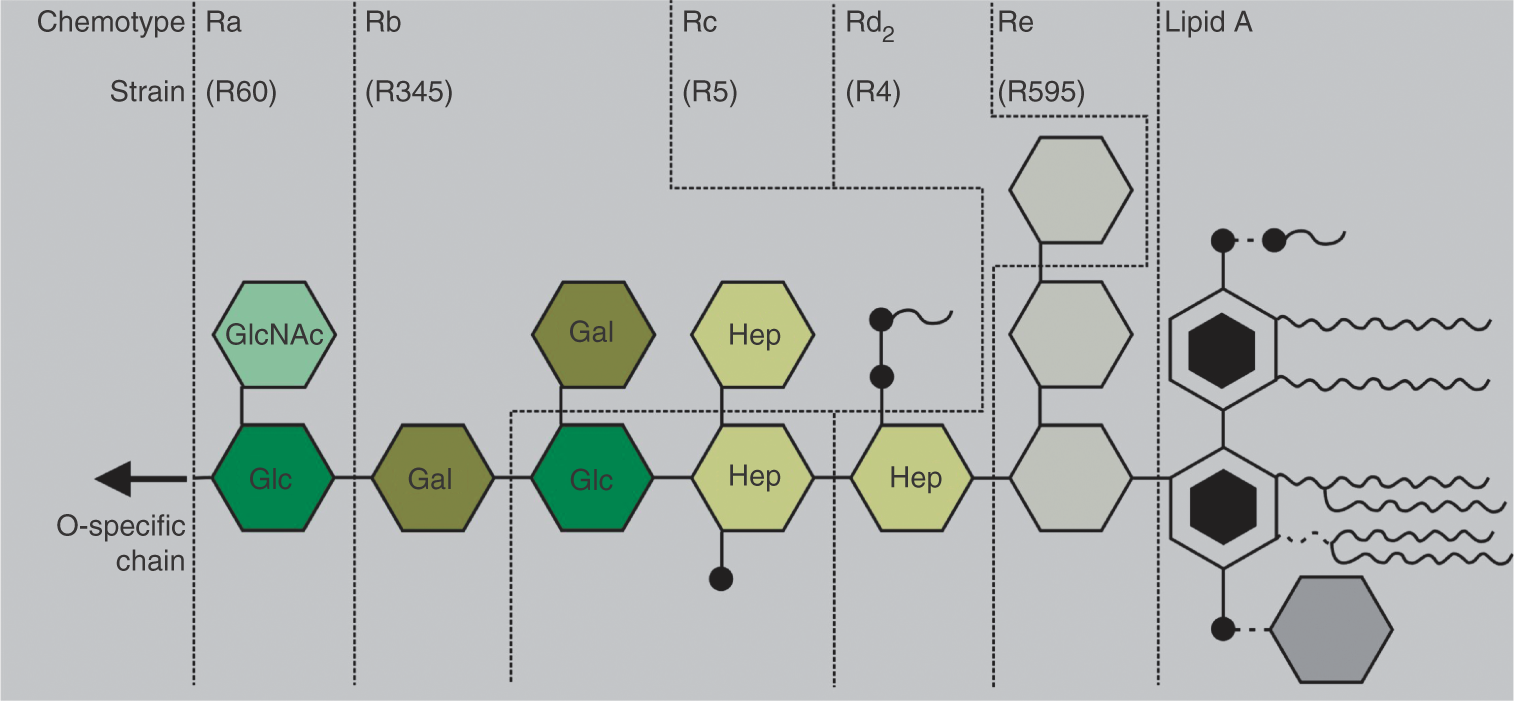
Preparation of LPS aggregates
Lipopolysaccharides or lipid A (1 mm) were solubilized in HEPES buffer (20 mm), extensively vortexed, sonicated for 30 min in a water bath, and subjected to several temperature cycles between 20–60°C. Finally, the lipid suspension was incubated at 4°C for at least 12 h before use.
Freeze-fracture and cryo-transmission electron microscopy
For freeze-fracturing transmission electron microscopy (FFTEM), the samples, copper sandwich profiles, and instruments for manipulation were incubated at room temperature or at 40°C. A small amount of the sample was sandwiched between two copper profiles as used for the double-replica technique and frozen by plunging the sandwiches immediately into liquified ethane/propane mixture cooled in liquid nitrogen. Fracturing and replication were performed at –150°C in a BAF 400T freeze-fracture device (BAL-TEC, Liechtenstein) equipped with electron guns and a film sheet thickness monitor. In a first step, 2 nm of Pt(C) were evaporated under an angle of 35°, followed by perpendicular evaporation of C for a second replica layer of 20 nm thickness. The replicas were placed on copper grids, cleaned with a chloroform-methanol mixture, and examined in an EM 901 electron microscope (Zeiss, Oberkochen, Germany).
For cryo-transmission electron microscopy, the dispersion (3 µl) was placed on a copper grid with perforated carbon film (Quantifoil R 1.2/1.3, Jena, Germany), and excess liquid was blotted automatically for 2 s between two strips of filter paper. Subsequently, the samples were rapidly plunged into liquid ethane (cooled to about –175°C) in a cryo-box (Zeiss). Excess ethane was removed with a piece of filter paper. The sample was transferred with a liquid nitrogen-cooled holder (Gatan 626, München, Germany) into the cryo-TEM (Philips-CM 120, The Netherlands) and investigated at 120 kV. The micrographs were generated by a Tietz-Fast Scan CCD Camera (TVIPS, Gauting, Germany).
Preparation of tilt series of negatively stained samples
Lipopolysaccharides in 20 mm HEPES buffer were mixed 1:1 (v/v) with ammonium molybdate (5% in bi-distilled water with 1% [w/w] trehalose, pH 7) for negative staining. A small droplet of the dispersion were placed on a copper grid with perforated carbon film (Quantifoil R 1.2/1.3), and excess liquid was removed by filter paper to form thin liquid films covering the carbon film holes, from which after air-drying stable electron permeable films result.
Tilt series were generated in the Philips-CM 120 electron microscope equipped with a 4-axis goniometer. Micrographs were done for every 3°-tilt angle difference by CCD-camera.
Laser back-scattering
Size distribution measurements were performed by non-invasive back-scatter detection (NIBS) on a Zetasizer NANO S (Malvern Instruments, Herrenberg, Germany). The samples were measured for 3 min in a fixed laser position of 173° relative to the incident laser beam. The measured intensities were correlated over time and analysed by a multiple exponential, non-negative least square fit to obtain relative intensities for the different particle sizes. The LPS samples were dispersed in 10 mm Tris buffer at pH 7, temperature-cycled three times between 20–60°C and stored at room temperature.
Analytical ultracentrifugation
The stock LPS sample preparations were diluted 1:2 or more with 20 mm HEPES buffer. Optical turbidity was between 0.7–1.2 at 420 nm (or 320 nm) in a cuvette with an optical path length of 1.2 cm, sample volume was 300 µl. The sedimentation velocity experiments were carried out as described earlier, 17 using a Beckman Optima XL-A ultracentrifuge (Beckman), an An-50Ti rotor and double-sector charcoal-filled Epon center-pieces. The rotor speed was 3000–5000 rpm corresponding to a centrifugal acceleration of 375–623 g and the rotor temperature was 20°C. Apparent absorbance (turbidity) versus radius data A(r,t) were collected at 420 nm (or 320 nm), using a radial step size of 0.03 cm. The data were modelled as a distribution of non-diffusing particles using the l-s g*(s) variant of the program Sedfit v 18 .
Small-angle X-ray diffraction
X-Ray diffraction measurements were performed at the European Molecular Biology Laboratory (EMBL) outstation at the Hamburg synchrotron radiation facility HASYLAB using the double-focusing monochromator-mirror camera X33.
19
Diffraction patterns in the range of the scattering vector 0.1 < s < 4.5 nm–1 (s = 2 sin θ/λ, 2θ scattering angle and λ the wavelength = 0.15 nm) were recorded at 40°C with exposure times of 1 min using an image plate detector with online readout (MAR345, MarResearch, Norderstedt, Germany). The s-axis was calibrated with Ag-Behenate which has a periodicity of 58.4 nm. The diffraction patterns were evaluated as described previously
20
assigning the spacing ratios of the main scattering maxima to defined three-dimensional structures. The lamellar and cubic structures are most relevant here. They are characterized by the following features:
Results
Electron microscopy
Lipid A as well as LPS aggregates from different chemotypes were characterized by freeze-fracturing, and – for LPS with long saccharide side chains (R345, R60, S-form, see Fig. 1) – also by cryo-transmission electron microscopy because of their better complete appearance. Additionally, the method of negative staining has been used to produce tilt series of micrographs for structural analysis.
The results presented for lipid A (Fig. 2) show mainly unilamellar vesicles with diameters from a few hundred nanometres to about 3 µm, exhibiting at 25°C an angled appearance. The unilamellarity can be seen best at cross-fractured vesicles (Fig. 2, stars).
Freeze-fracture electron micrograph of lipid A from LPS from S. enterica sv. Minnesota R595 (Re). The concentrations are in the millimolar range. The micrograph is indicative of unilamellar vesicles, which are, however, sometimes angled, possibly coexistence of gel and fluid lipids. The diameters are in the range 100 nm to 3 µm. *Cross-fractured vesicles, which exhibit a unilamellar arrangement.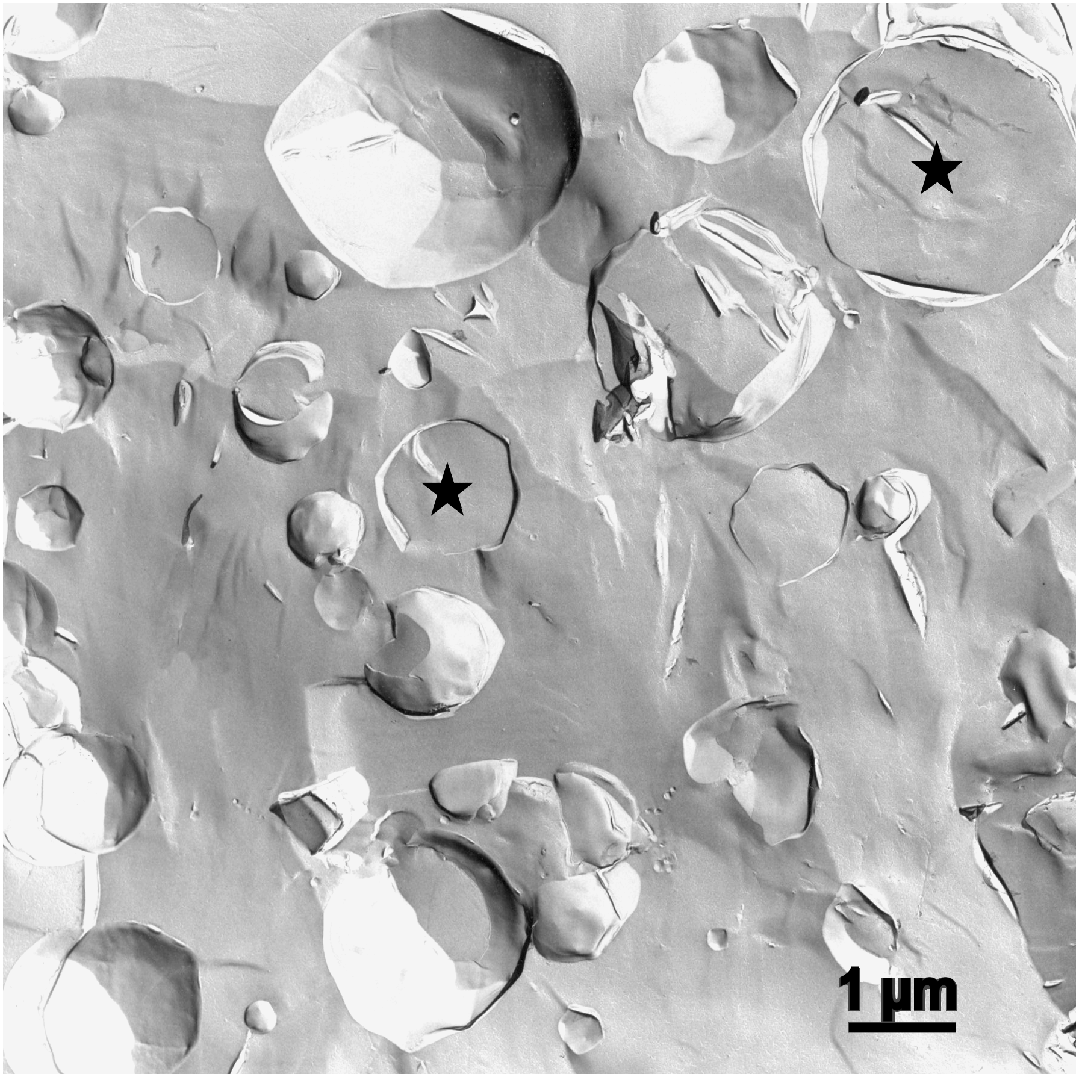
For deep rough mutant LPS (from strain R595, see Fig. 1), the resulting aggregates at room temperature are vesicle-like liposomes with diameters from about 50–200 nm. However, the aggregates are often not closed vesicles as found for many phospholipids, but rather open shells (Fig. 3) which we have called ‘eggshells’.
21
It should be noticed that they have a widely uniform diameter.
Freeze-fracture electron micrograph of LPS from S. enterica sv. Minnesota R595. The particles look like vesicular liposomes, often shell-like open (called ‘egg shells’).
7
The diameters are in the range <100 nm to ∼250 nm.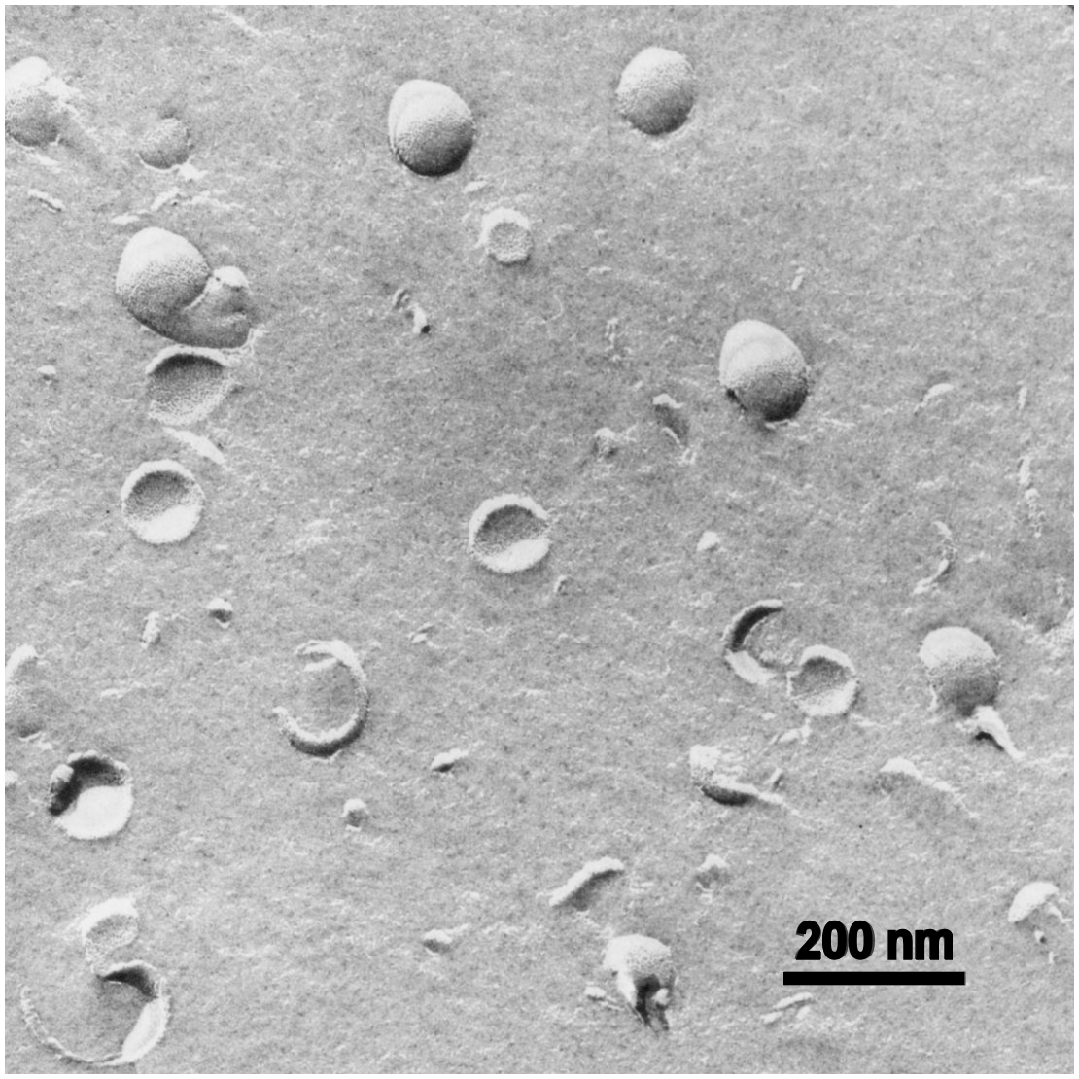
A modified structure formation can be found in the case of LPS Rd1 (strain R4, not shown) which has, in addition to the two Kdo moieties, two further heptose monosaccharides and in case of LPS Rc (strain R5; see Fig. 1). Beside spherical liposome-like structures with diameters in the range of 200–500 nm, island-like planar bilayer fragments were formed (Fig. 4, star) frequently organized in multilamellar stacks as seen in case of cross-fracturing (Fig. 4, arrow).
Freeze-fracture electron micrograph of LPS from S. enterica sv. Minnesota Rc, strain R5. The concentrations are in the millimolar range. Beside vesicles, possibly multilamellar, with diameters between 200–500 nm frequently planar membrane fragments (asterisks) of varying dimension are observed, often multilamellar (arrow).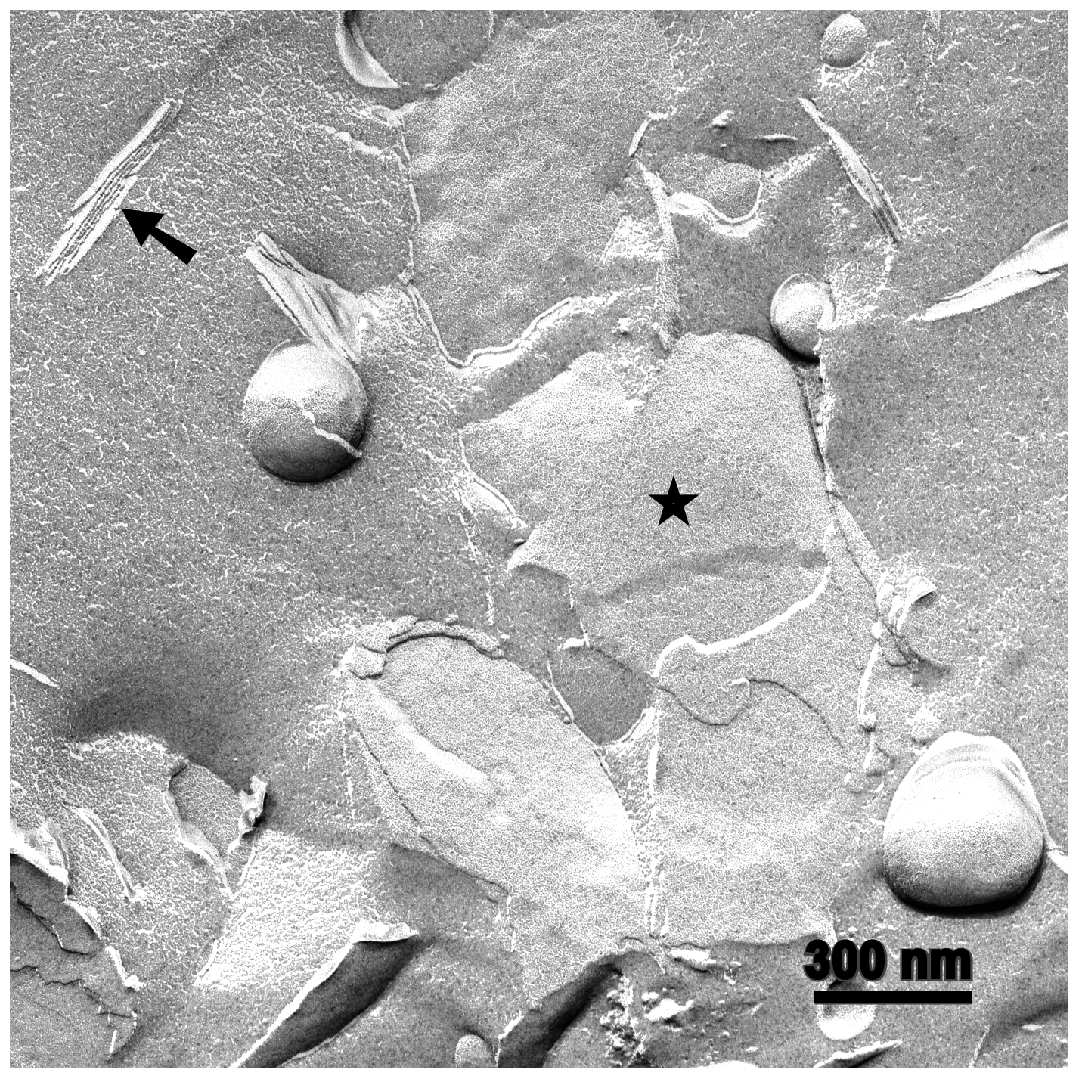
A complete morphological change takes place when the sugar chain is prolonged by three additional monosaccharides as compared to LPS Rc, i.e. for LPS Rb (from strain R345). Spherical liposomes are absent, and the dimensions of the islands of bilayer fragments appear to be smaller (<100–300 nm; Fig. 5, stars). Very often, two bilayer lamellae are tightly stacked (Fig. 5, arrow).
Freeze-fracture electron micrograph of LPS from S. enterica sv. Minnesota Rb, strain R345. The concentrations are in the millimolar range. Membrane fragments with small areas (asterisks), often bilamellar (arrow).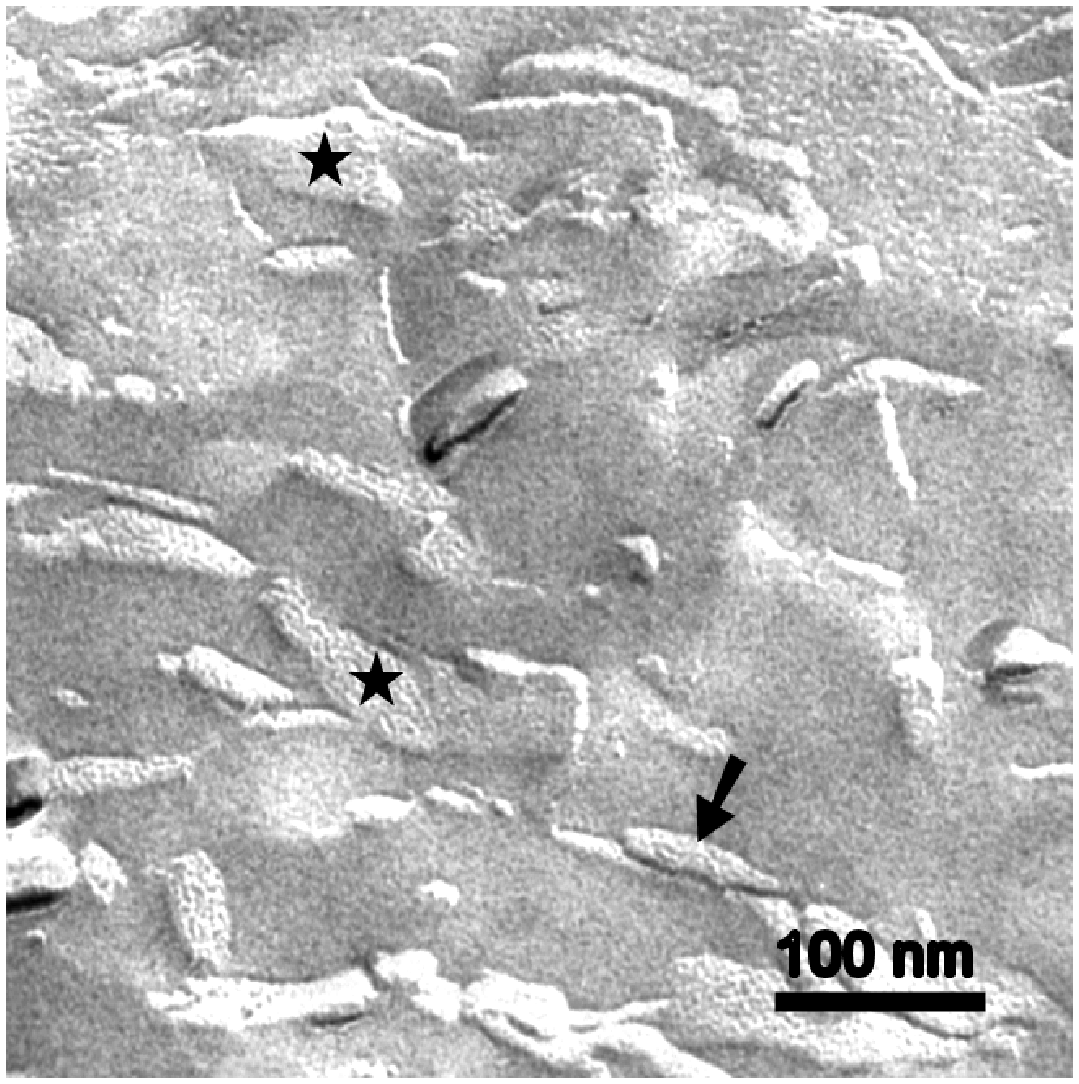
Nevertheless, the complete dimensions of the LPS Rb-structures could not be demonstrated by FFTEM. This problem became even more complicated in FFTEM-preparations of LPS Ra (strain R60) dispersions. In Figure 6A, the fracture plan exhibits short-elliptical, torus-like structures as well as elongated fibrillar structures. The cryo-TEM preparations allow a better overview and show that the structures seen after FFTEM-preparation mainly result from cross-fractured and more or less longitudinally fractured elongated worm-like ribbon structures with lengths of some hundred nm and more (Fig. 6B). The ribbons are oriented in side-view (Fig. 6B, arrow) measuring 8–9 nm in thickness and in top-view (arrow-heads) from about 14–19 nm varying in width. The ribbons are sometimes branched and can form closed ring-structures. In between elongated ribbons, short and particle-like pieces also appear.
Electron micrographs of LPS from S. enterica sv. Minnesota Ra, strain R60. The concentrations are in the millimolar range. (A) FFTEM-micrograph: short ellipsoidal and long fibrillary structures, bilamellar (see also Fig. 7, with higher magnification). (B) Cryo-TEM micrograph: long ribbon-like structures in top view (arrowheads, ∼14–17 nm broadness) and side view (arrow, 8–9 nm thickness). Beside these ribbons, also small spherical elements are visible (discs).
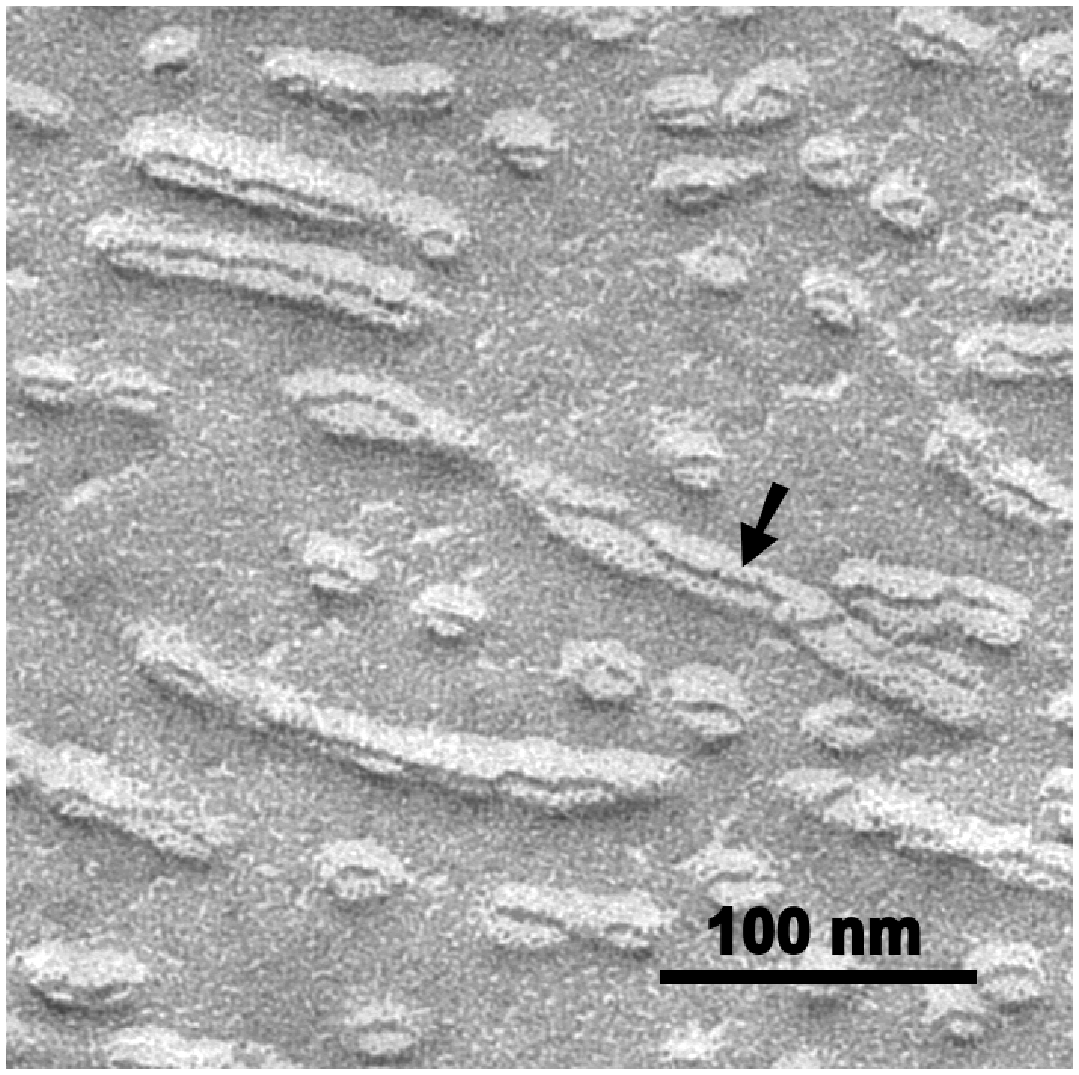
Similar structures could be found by cryo-TEM for preparations of LPS Rb (strain 345) as well (Fig. 7). Side-view (arrow) and top-view (arrow head) are visible at the same distorted ribbon-structure. The side-view has a trilaminar appearance and indicates a thickness of the ribbon of about 8 nm. Proper FFTEM micrographs of LPS Ra suggest at high magnification that the ribbons are obviously composed of two tightly arranged bilayers (Fig. 8, arrow). A thickness of 8–9 nm would be in accordance with such a structure formation.
Cryo-transmission electron micrograph of LPS R345. There are ‘ribbon-like structures’ in side view (arrows) with trilaminar structure of high contrast and in top view with low contrast (arrowhead). Freeze-fracture electron micrograph of LPS R60 (section from Fig. 5A) shows bilamellar organisation of the band structure (arrow).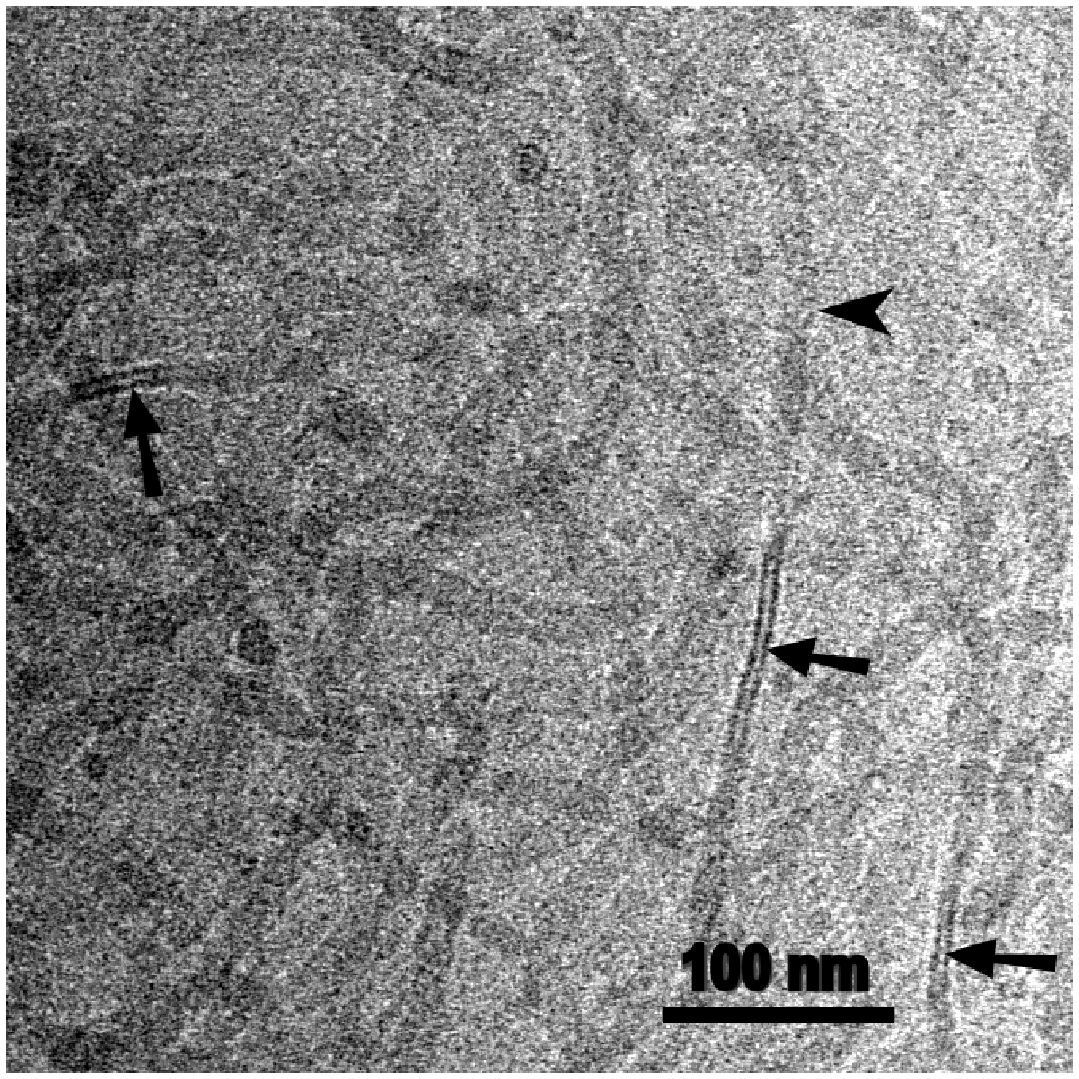
For a direct demonstration of the flat ribbon-structure, also projections under different angles by tilting the sample in the electron beam should be proper. Because of the long time exposure connected with strong radiation damage, it was necessary to use negatively stained samples instead of cryo-fixed ones. In Figure 9, a tilt series with tilt angles of 9° (A), 27° (B), and 57° (C) is shown. Ribbons running across the tilt direction (arrow) change their width significantly while ribbons running parallel with the tilt direction (arrowhead) do not.
Tilt-series of a negative staining electron micrograph of LPS R345 with tilt angles of 9° (A), 27° (B), and 57° (C). The band running vertical to the tilt axis changes its broadness depending on the angle (arrow). The band running in direction of the tilt remains in side view approximately constant (arrowhead).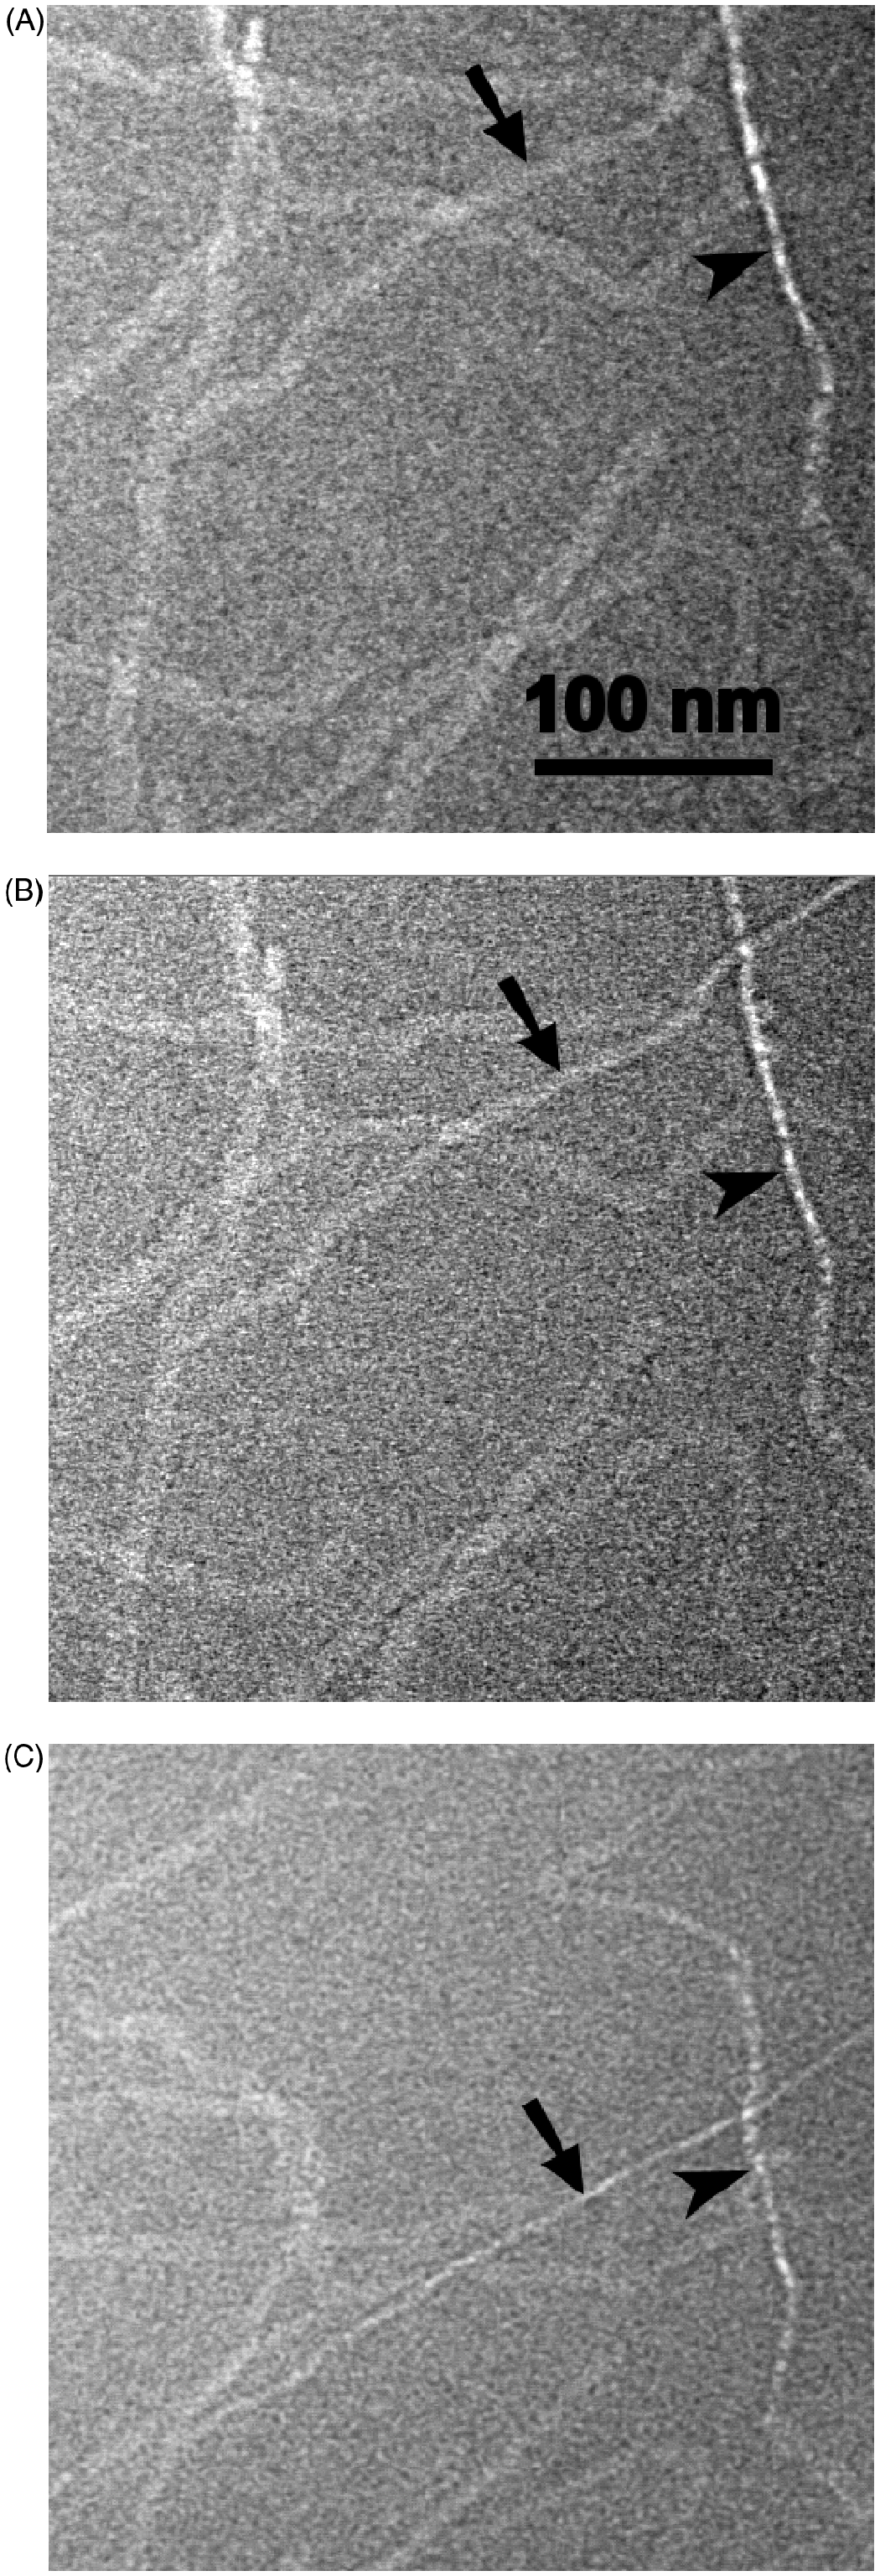
Surprisingly, the structural development of worm-like ribbons was not found in the case of wild-type LPS. The FFTEM preparations (Fig. 10A) resulted in small particles with diameters of 12–15 nm, small vesicles <100 nm (arrow) and small bilayer discs (star). Cryo-TEM micrographs (Fig. 10B) demonstrated also vesicles of about 100 nm in diameter and planar bilayer fragments with surface areas of several hundred nanometres.
Electron micrographs of LPS S-form from S. enterica sv. Abortus equi. The concentrations are in the millimolar range. The FFTEM-micrograph (A) shows a small membrane disk (star), small vesicle (arrow) and, in between, smaller granular structures (micelles). In the cryo-TEM (B) also larger vesicles (≤100 nm) and area-like membrane clods (star) appear.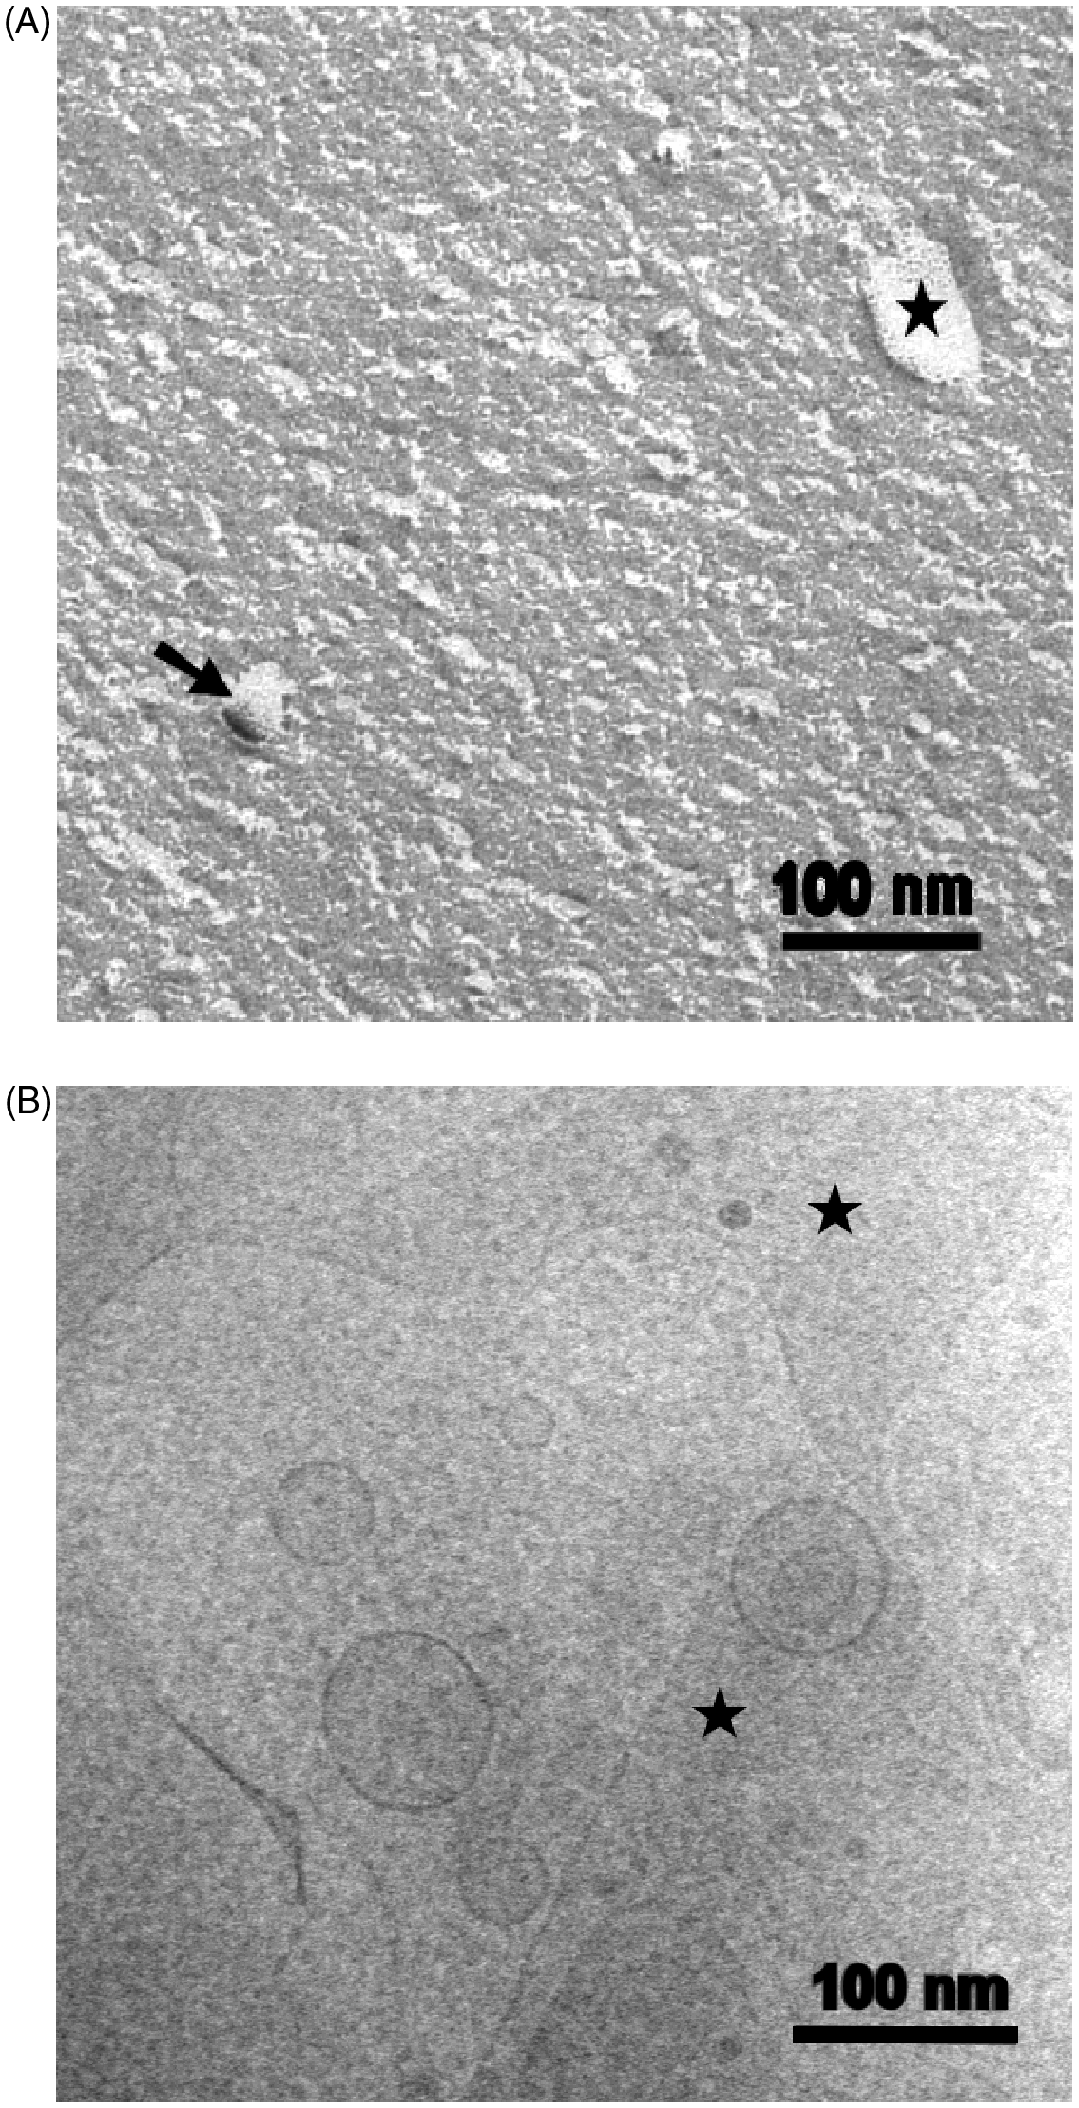
Analytical ultracentrifugation
Different LPS chemotypes – LPS S-form, Ra- and Re-mutant LPS from S. enterica sv. Minnesota strains R60 and R595, respectively, as well as free lipid A were analysed by analytical ultracentrifugation. Taking into account the spherical model for the particles and assuming the value of partial specific volume ∼0.95 g/cm3 of the LPS sample aggregates determined above, the l-sg*(s) distributions can be converted into (relative) concentration-versus-diameter curves. The transformation for both samples are shown in Figure 11A,B, exhibiting a size distribution for wild-type LPS between 5–105 nm with peaks of the diameters at 120 nm and 180 nm (Fig. 11B), whereas the rough mutant LPS shows a much broader size distribution between 100–420 nm for Re- and between 100–700 nm for Ra-LPS (Fig. 11A). For lipid A, the intensity distribution gave no interpretable data.
Analytical ultracentrifugation of LPS from S. enterica sv. Minnesota rough mutants Re (strain R595) and Ra (strain R60) (A) and LPS S-form from S. enterica sv. Abortus equi (B) at a concentration of 0.1 mm.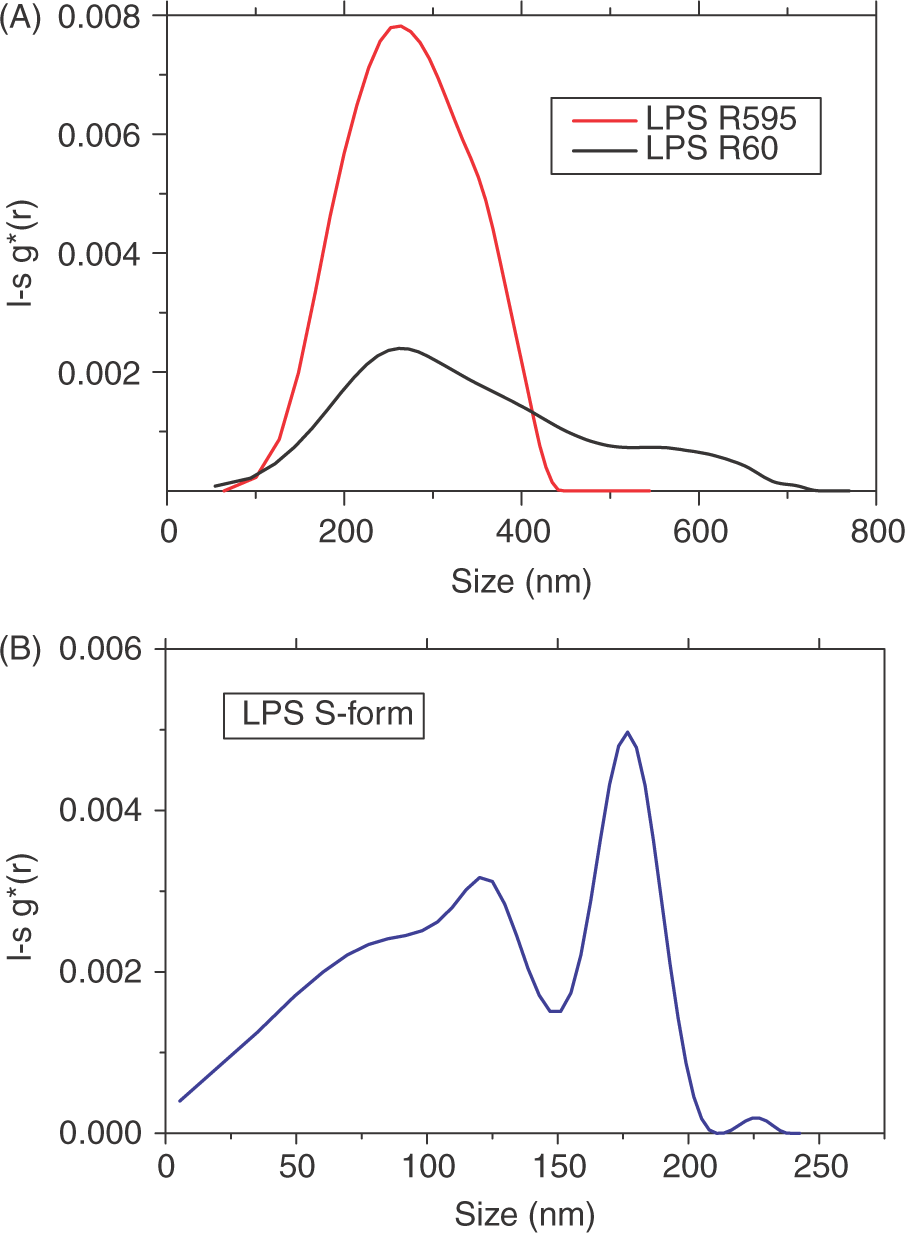
Laser backscattering analyses
The analysis of free lipid A in all cases led to a size distribution of the signals between 600 nm and more than 1000 nm, both when the intensity or the volume signals were taken (not shown, in the model, a spherical distribution is assumed). A biphasic behaviour is found for LPS R595, with two peaks around diameters of 100 nm and 700 nm (Fig. 12A). Similar findings are seen for LPS Rc, for which the peak at the higher diameter, however, is distributed between 60–1200 nm (data not shown). The Ra LPS even exhibits a triphasic behaviour with peaks centred at 30, 150, and 600 nm (Fig. 12B). For the latter, the analysis performed by intensity distribution shows highest intensity for the medium and the large diameters, whereas the analysis performed by volume distribution gave highest signals for the lowest diameter.
Laser light scattering (back-scattering) of a rough mutant Re (A) and Ra (B) from LPS from S. enterica sv. Minnesota R595 and R60, respectively at a concentration of 0.1 mm.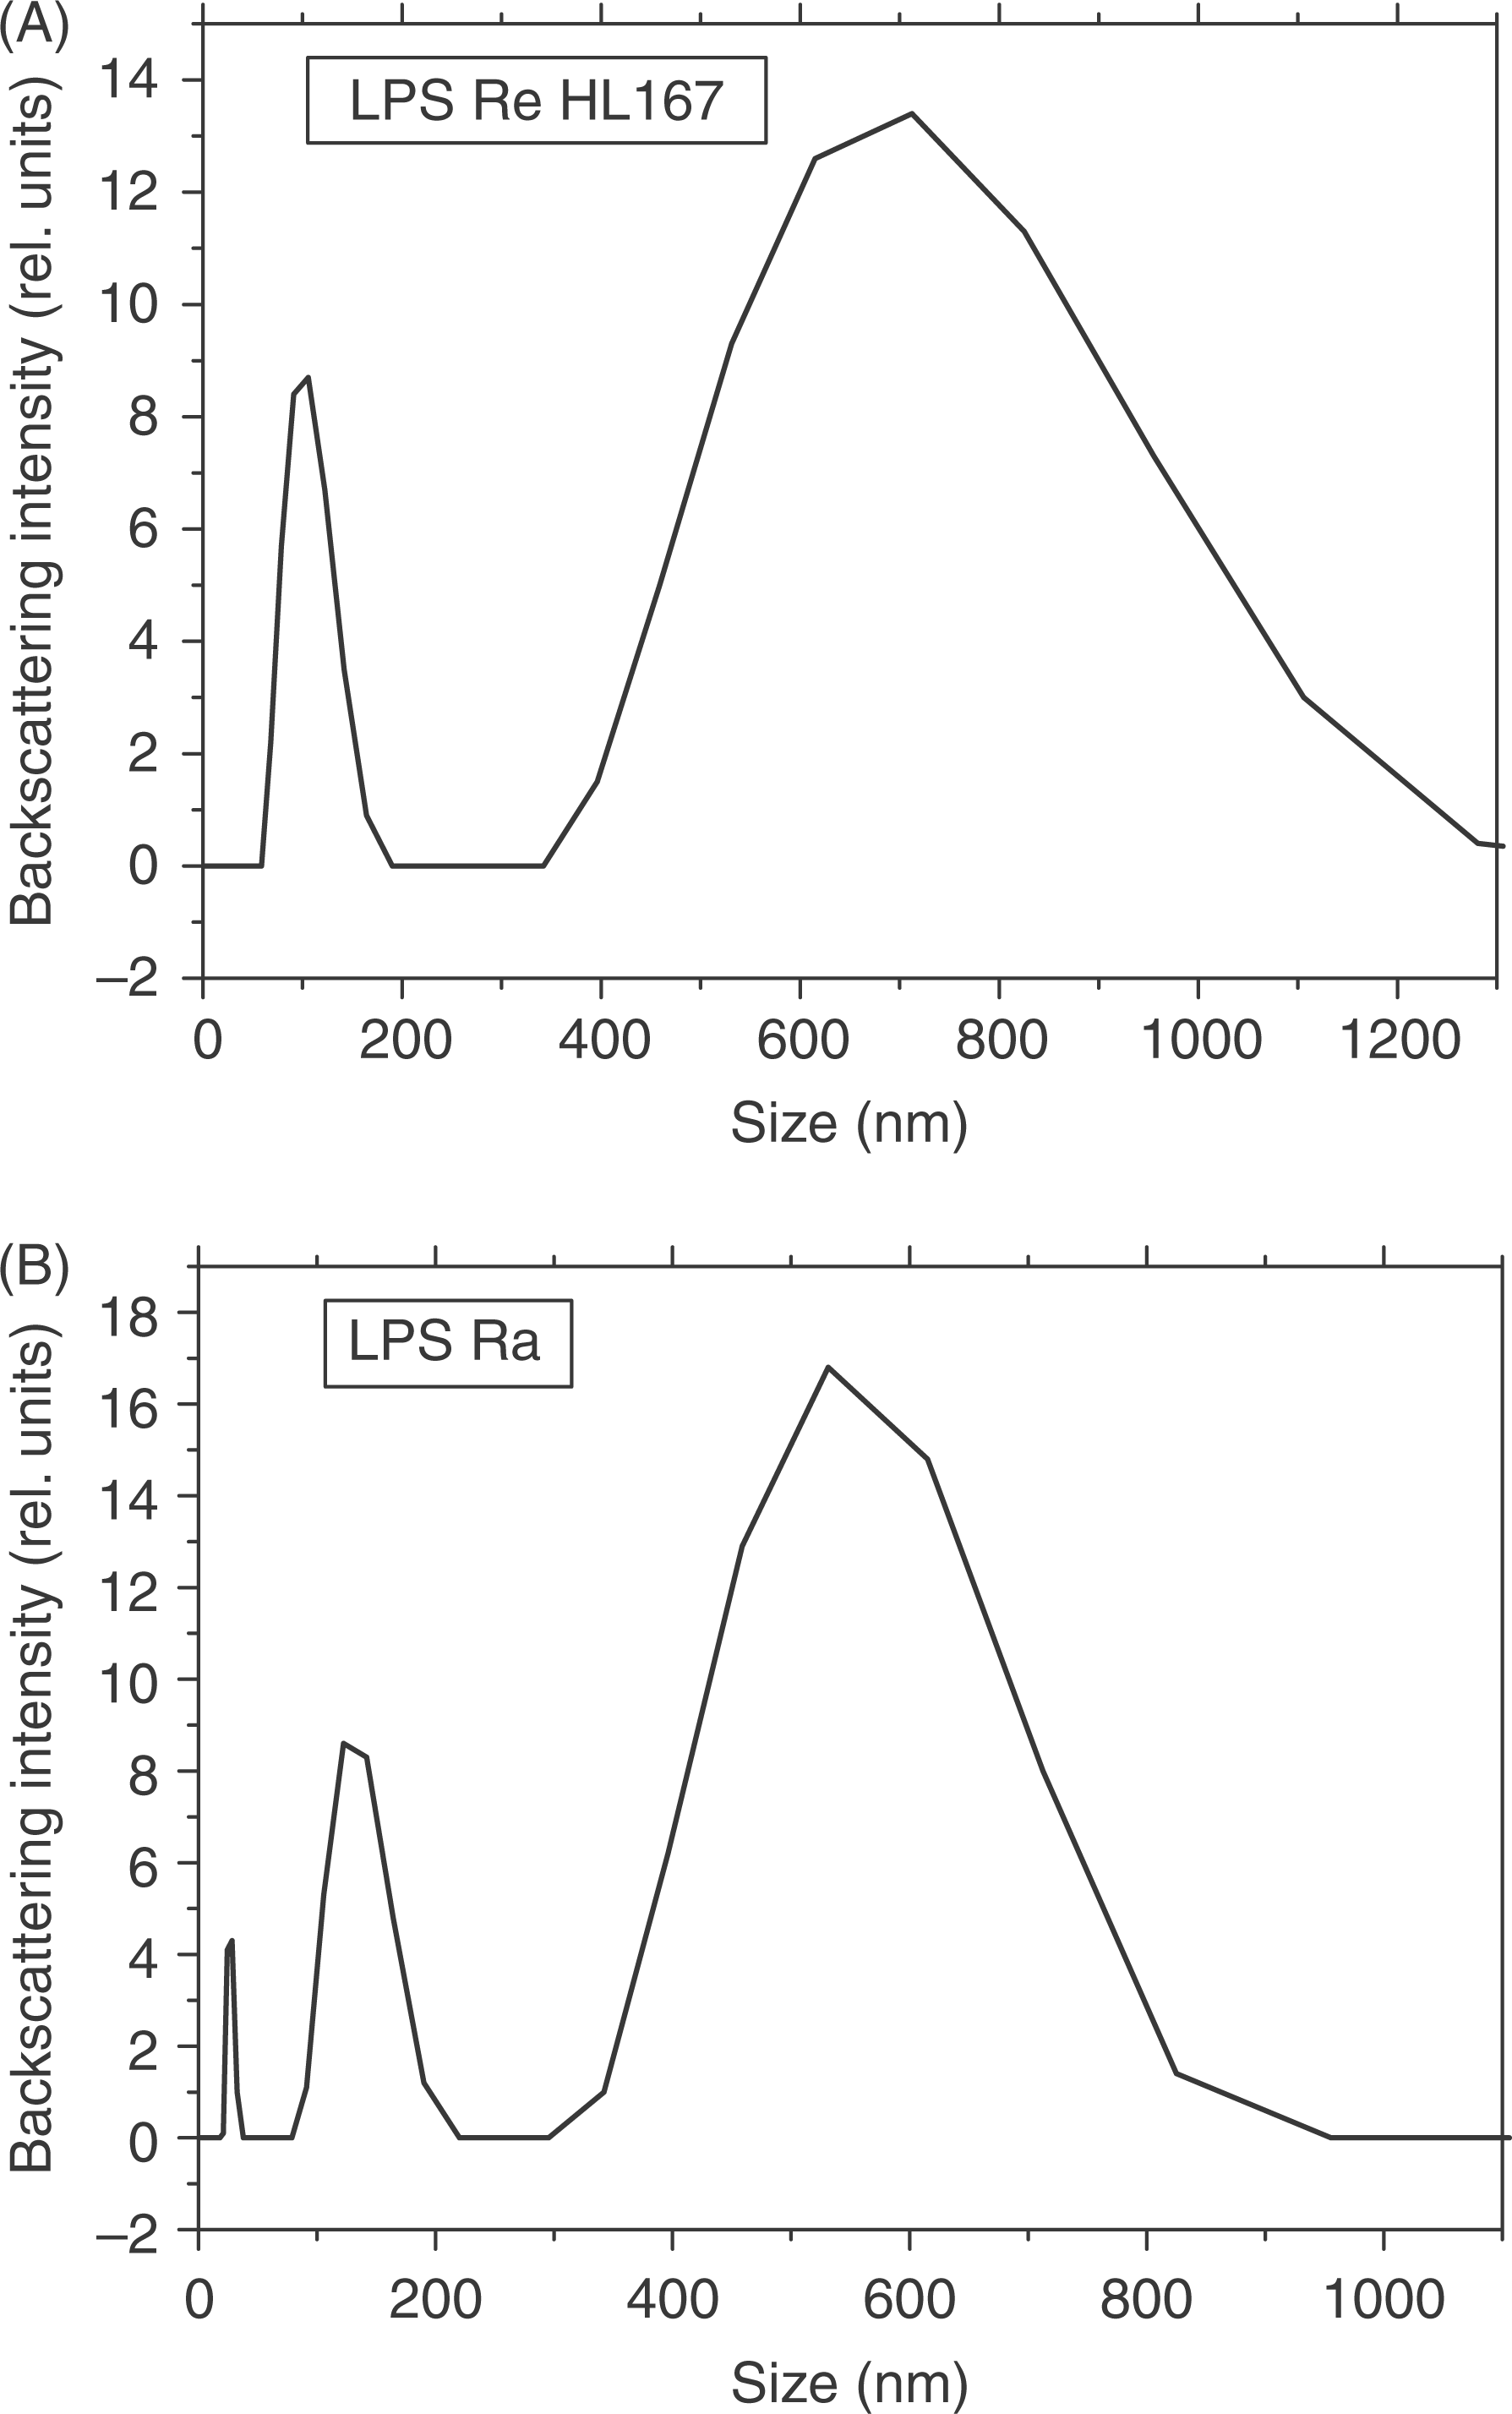
Small-angle X-ray scattering (SAXS)
Small-angle X-ray scattering experiments were performed at the Hamburg synchrotron source with lipid A and LPS samples at 95% water content to guarantee near physiological conditions. In Figure 13, diffraction patterns are shown for mutants LPS Rc (Fig. 13A) and LPS Ra (Fig. 13B). As can be seen, all spectra mainly show broad scattering intensity in the s-range 0.1–0.35 nm–1, which is characteristic for the existence of a lipid bilayer corresponding to the form factor presented in the experimental section. Only in some scattering patterns, in particular at higher temperatures, weak sharp reflections are seen which are indicative of particular aggregate structures. Thus, for LPS Ra, sharp reflections are found in the range 14–16 nm and further non-resolved maxima around 5.4 nm and 7.9 nm, which are indicative for a non-lamellar, probably cubic structure (Fig. 13B).
Synchrotron radiation small-angle X-ray diffraction patterns of (A) LPS Rc from S. enterica sv. Minnesota strain R5 and (B) LPS Ra from S. enterica sv. Minnesota strain R60 at concentrations of 5 mg/100 µl. The scattering vector s = 1/d = 2 sinθ/λ (d, spacing ratio; θ, scattering angle; λ (wavelength) 0.15 nm) is plotted versus the logarithm of the scattering intensity logI.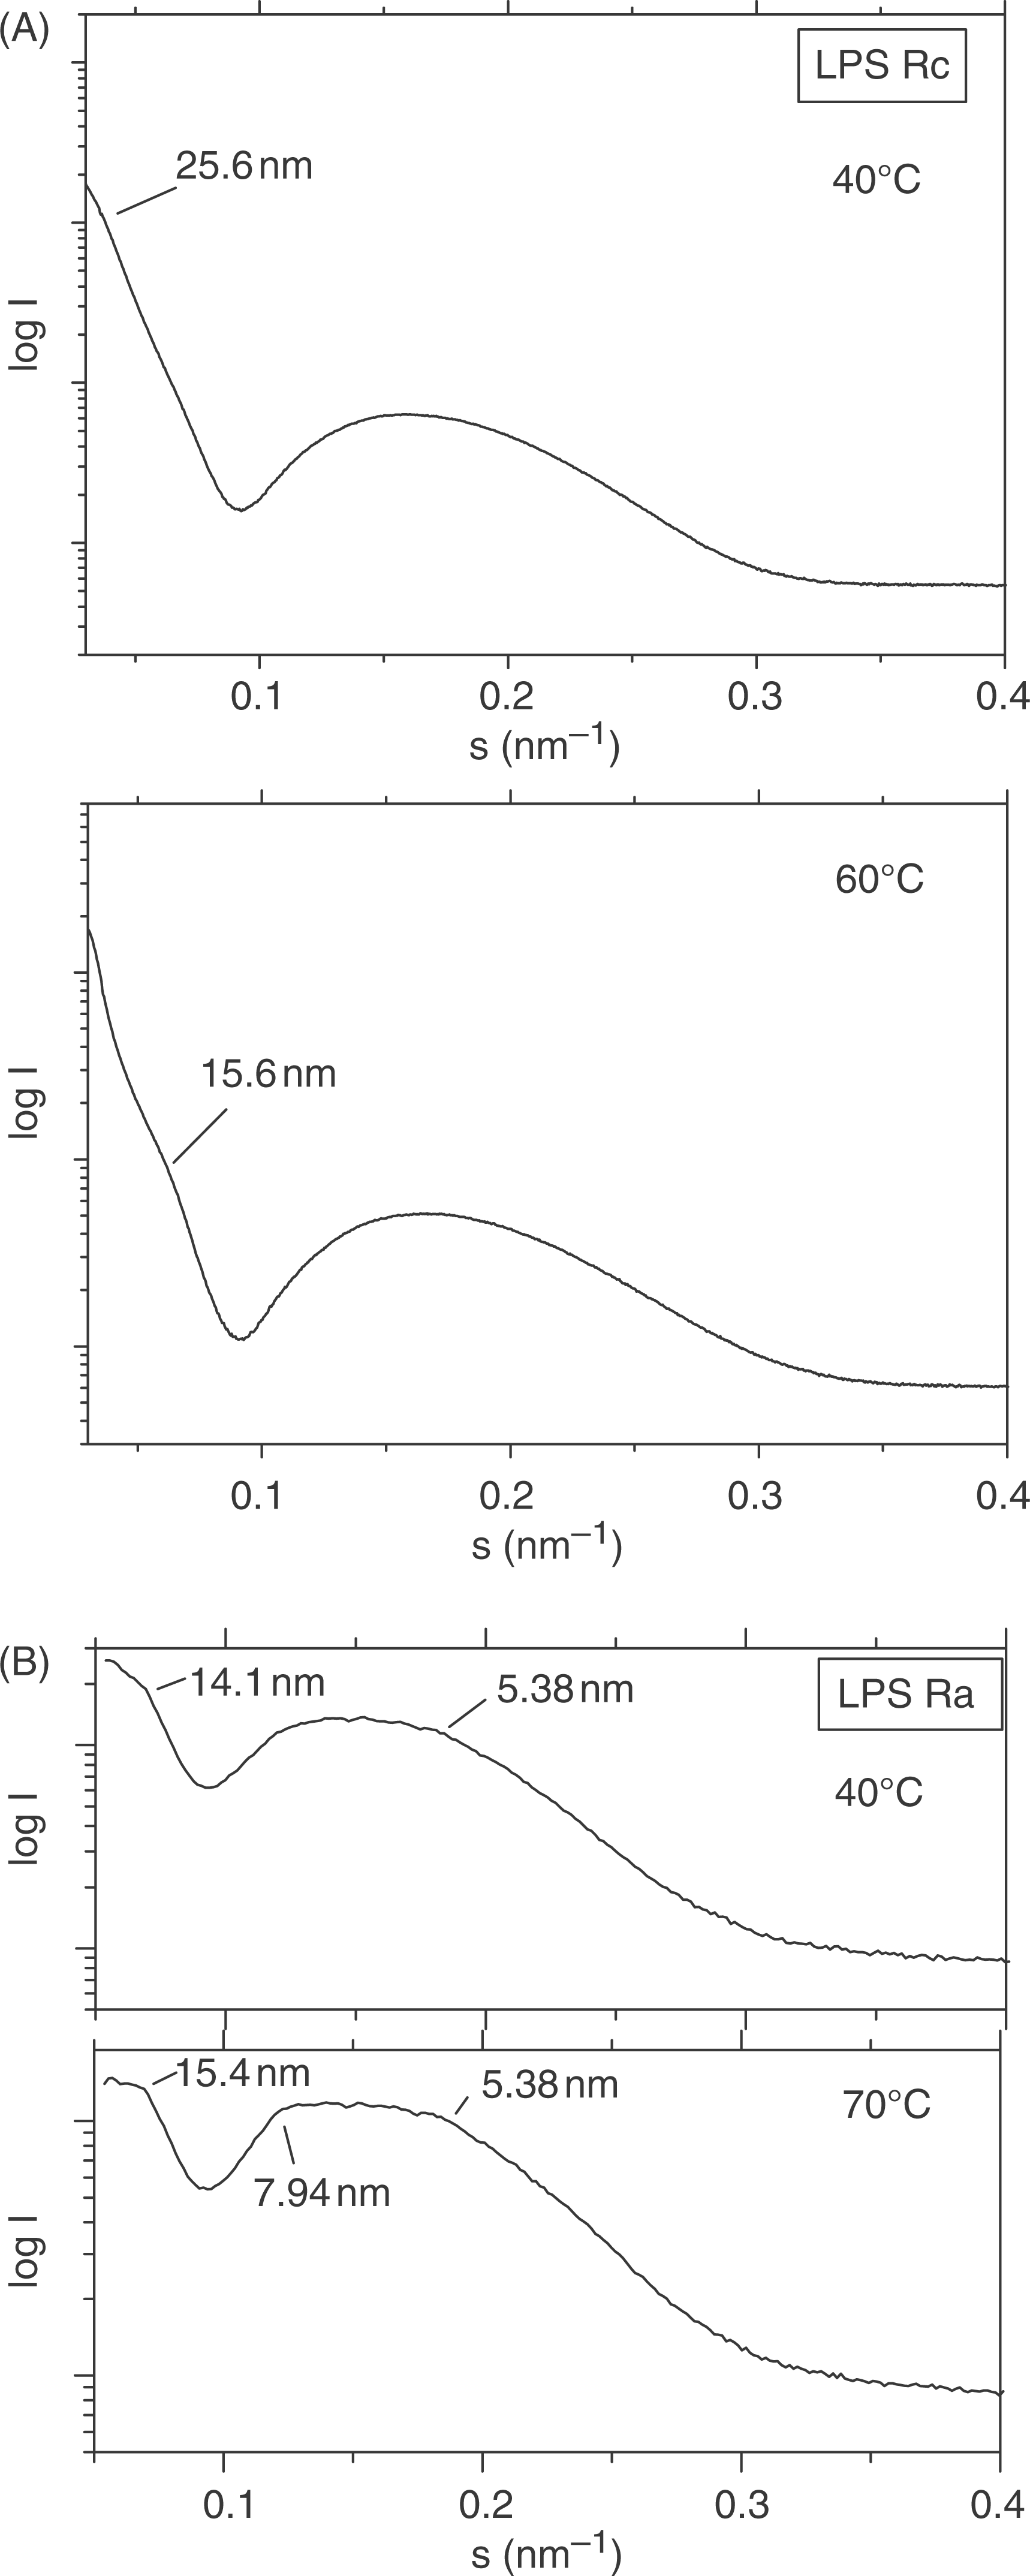
Discussion
The data presented here indicate a very complex morphology of LPS dispersions, which varies not only in dependence of the length of the saccharide chain, but also differs for one and the same LPS when applying different techniques. It has been published earlier that the bioactive aggregate structure of endotoxins corresponds to one with cubic symmetry, although the evidence for this was only unequivocal in the case of free lipid A and LPS Re.20,22,23 The data for LPS with longer saccharide chains indicate that, at least for LPS Ra, such cubic aggregate structure predominates under near physiological conditions as evidenced by SAXS data (Fig. 13B). This interpretation is strengthened by recent observations that haemoglobin and part structures are enhancing the biological activity of LPS, concomitant with a clear expression of a cubic SAXS pattern for LPS Rc as well as Ra.24,25
Although the cubic aggregate structures are important with respect to an understanding of the bioactivity, their sizes and morphologies are further significant parameters not only with respect to the endotoxic activity of LPS, but also to its possible neutralization by antimicrobial agents.
Here, the detailed morphology is strongly influenced by the particular chemical structure. For compounds with short sugar moiety, liposome-like (Fig. 2) and spherical-like structures (‘egg shells’) are formed (Fig. 3). This is evident for the structure of free lipid A adopting very large aggregates of several micrometre diameter, and also for LPS Rc (from S. enterica sv. Minnesota R5), the sizes of which are, however, much lower, in the range of some hundred nanometres in accordance to what is found for LPS Re in the analytical ultracentrifugation experiment (Fig. 11; see also Andrä et al. 21 ). The extremely high particle sizes of lipid A (Fig. 2) may be one of the explanations, that it exhibits one to two orders of magnitude lower activity than parent LPS, 3 beside the fact that the low fluidity of lipid A as compared to parent LPS also impedes bioactivity. 4 Bioactivity is governed by the interaction of particular functional groups within the lipid A backbone with mammalian binding proteins such as lipopolysaccharide-binding protein (LBP), soluble or membrane-bound CD14, and the TLR4/MD2 complex. 26 – 28 This interaction would be impeded in the case of large particle sizes.
The morphology and size distribution become much more complex with LPS having longer saccharide chains like LPS Rb, LPS Ra and wild-type forms. These form filaments or ribbon-like structures or even small micellar forms (Figs 5–10). This complexity becomes also visible from the analytical ultracentrifugation data having a very broad distribution for LPS Ra and even a bimodal distribution for wild-type LPS (Fig. 11).
The data given by analytical ultracentrifugation (Fig. 11), by cryo-electron microscopy (Fig. 10), and by laser back-scattering (Fig. 12) for LPS Re and Ra seem to be diverging. However, from electron microscopy, the pure morphology was obtained which gave long ribbons with a thickness of approximately 8–9 nm and a width of 14–19 nm, which would correspond to the bilayer distance as found earlier with SAXS. 29 The other methods give medium diameters of the resulting particles, which are not so simple to interpret in the case of non-spherical particles. The laser back-scattering analysis may even be severely restricted in the case of large aggregates leading to precipitation, which, for example, may occur in the case of LPS:drug interactions,21,30,31
In the older papers on the ‘physical shape’ of LPS particles summarized by Shands, 11 the morphology of wild-type as well as Ra-LPS was described to consist of long filaments or flat ribbons with 16 nm diameter, and preparations with shorter saccharide chains giving more spherical structures. There are, however, two severe restrictions regarding the validity of these data: (i) the chemical purity of the compounds were insufficient at that time and, therefore, the influence of impurities cannot be assessed quantitatively; and (ii) the application of electron microscopy with negative staining. The latter treatment leads in all cases to a loss of water molecules. It has been shown in previous experiments that the lyotropic behaviour, i.e. the structural polymorphism in dependent on water content, is strongly expressed for endotoxin samples leading to distinct (lamellar) three-dimensional arrangements at water content <60% as compared to those (cubic) found at high water concentrations. 20 These findings were confirmed by Risco and co-workers, 12 who reported that LPS from Escherichia coli O111:B4 adopts different sizes and shapes by applying negative staining as compared to freeze-fracturing, from which the authors conclude that negative staining may lead to artefacts. The same group investigated lipopolysaccharide preparations in the absence and presence of serum 32 and obtained various morphologies with large aggregate structures corresponding to high molecular masses of more than 106 Da. In particular, an interesting finding is their observation that LPS aggregates are strongly attached to macrophage membranes, which may be relevant for the understanding of cell activation.
Regarding the problems with negative staining, the data of Roth et al. 33 must be considered in this context. These authors reported on LPS Re forming ribbon-like structures and smooth LPS from E. coli O5:B5 forming heterogeneous particles in the range 10–100 nm obtained with negative staining electron microscopy, The data of Bergstrand et al. 34 for LPS from E. coli O55:B5 with dynamic light scattering at concentrations in the range 0.001–1.67 mg/ml are indicative of a bimodal size distribution with average radius of 26 ± 2 nm and 320 ± 40 nm, respectively, which the authors attribute to LPS aggregates and clusters of aggregates. This would correspond to some of the data for samples investigated here (see above). A detailed comparison, however, is hampered by the fact that all S-form LPS consist of a heterogeneous mixture of part structures with differences in the saccharide chain length and acylation pattern. 13
Santos and co-workers 35 found with light scattering spectroscopy of E. coli O26:B6 LPS from a broad size distribution between 40–600 nm at c = 80 µg/ml, with a medium hydrodynamic diameter of the particles at 190 nm. At concentrations lower than 15 µg/ml, there was a decrease of the medium diameter to 120 nm, and that concentration was called by the authors ‘CMCa’, which, however, has nothing to do with the critical micellar concentration, at which only monomers exist. In accordance with this, the authors call these aggregates ‘premicellar oligomers’. An interesting study on LPS structures from Re mutants as well as smooth type LPS by Aurell et al. 36 down to very low concentrations of 10 pg/ml with tapping mode atomic force microscopy indicates that LPS are still highly aggregated at these concentrations without any visible signs of breaking up into single LPS monomers. This finding is of high relevance, because only estimates of values of the CMC (critical micellar concentration) were published (in one paper 37 reporting CMC values of lipid A and LPS in the micromolar range, only the sensitivities of the applied techniques were indicated, see below). The authors showed that LPS from S. enterica sv. Typhimurium forms lipidic particles with mean average lengths of 75 nm and width of 26 nm, whereas the autocorrelation photon spectroscopic (APS) measurement yielded a hydrodynamic mean diameter of about 52 nm. In contrast, LPS Re (from S. enterica sv. Minnesota R595) formed a singlet annular structure of diameter of 38 nm, with APS data giving a hydrodynamic diameter of 32 nm (range, 30–60 nm).
A study also with variations to low concentrations using an ultra-pure LPS corresponding to E. coli Re-LPS (Kdo2–lipid A) by dynamic light scattering showed a decrease of the hydrodynamic radius from the range 20–100 nm at 200 nm to 0.1–15 nm at 20 nm concentration, from which the authors deduced CMC values in the nanomolar range. 38 However, it must be taken into account that no control of the resolution limit, i.e. the concentration at which the light scattering intensity reaches zero when diluting still existing particles, was performed.
Although crystallographic preparations of lipid A and LPS cannot be attributed to physiologically meaningful states, they may be valuable to get information about molecular geometries. Kato and colleagues 39 – 42 used synthetic lipid A and rough mutant LPS Re to Ra (crystallization of natural lipid A and wild-type LPS failed), and analyzed them by electron diffraction. From this, the anisotropic cross-section of the acyl chains was determined to be 1.67 nm × 0.924 nm for hexa-acyl LPS Re and Ra, and the length of the lipid A part to 2.96 nm. For various rough mutant LPSs, different morphological shapes were observed, including squares, rectangular plates, lozenge plates, discoids, and truncated hexagonal pyramid forms. A view from perpendicular to the membrane surface showed that the acyl chains of synthetic E. coli-type lipid A (compound ‘506’) 43 form a hexagonal lattice with a lattice constant of 0.462 nm, whereas the longitudinal axis, corresponding to the bilayer thickness, was determined to be 4.93 nm. Finally, the monolayer thickness derived from this value (2.47 nm) is thus slightly lower than, but still in quite reasonable agreement with, the length of the lipid A molecule given by Labischinski et al. 44 and, interestingly, not very different from the values found under near physiological conditions of water content lying in the range of 4.9–5.2 nm for the bilayer thickness.22,45
There are some papers which essentially describe the interaction of LPS with binding proteins such as CD14 and LBP and which use fluorescence dequenching of FITC-labelled LPS as well as metabolically labelled [3H]-LPS. 46 – 49 Regarding the high number of tritiated atoms, the latter technique may be dangerous because of severe radiation damage, and will not be discussed here. Regarding the dequenching data, it is usually reported that there is an increase in fluorescence of FITC-LPS when LPS forms complexes with proteins such as LBP. 50 Tobias et al., 50 based on sedimentation properties of LPS-LBP complexes, concluded that a reduction in fluorescence self-quenching resulted from disaggregation of LPS by LBP. However, the different behaviour of the BPI (bactericidal permeability-increasing protein) complexed with LPS led to an increase in aggregation, although a similar dequenching was found. This means that other parameters influence the dequenching process, showing that this method is not suitable for size determinations or changes. For example, a parameter influencing the intensity of fluorophores is the acyl chain fluidity. We have observed that the well-known fluidity increase of the LPS acyl chains induced by LPS-binding compounds such as peptides and proteins 51 leads to an increase in fluorescence intensity of some dyes, which could be mixed with a disaggregation such as reported. 52 In this light, various papers must be assessed which use this technique for a quantitative determination of aggregation behaviour. 52
Conclusions
The data give evidence for a very complex aggregation behaviour of bacterial lipopolysaccharides, with structure formations deviating from spheres especially in the case of longer saccharide side chains. In particular, except for one publication the detailed properties of aggregates, sizes and type of structures, in dependence on concentration down to the picomolar range, which is relevant in biological systems, are rarely characterized. Laser light scattering, one of the mostly applied techniques, only gives reliable results when the aggregates form spheres which are usually not fulfilled by LPS, and when no precipitation of the samples takes place. It can be assumed that the best technique available now is atomic force microscopy, applied in one of the investigations cited above, which should shed some more light on the questions described in future experiments.
Footnotes
Funding
The authors are indebted to the German ministry for financial support (project BMBF 01GUO824).